

Abstract
Designing a protein sequence that will fold into a predefined structure is of both practical and fundamental interest. Many successful, computational designs in the last decade resulted from improved understanding of hydrophobic and polar interactions between side chains of amino acid residues in stabilizing protein tertiary structures. However, the coupling between main-chain backbone structure and local sequence has yet to be fully addressed. Here, we attempt to account for such coupling by using a sequence profile derived from the sequences of five residue fragments in a fragment library that are structurally matched to the five-residue segments contained in a target structure. We further introduced a term to reduce low complexity regions of designed sequences. These two terms together with optimized reference states for amino-acid residues were implemented in the RosettaDesign program. The new method, called RosettaDesign-SR, makes a 12% increase (from 34 to 46%) in fraction of proteins whose designed sequences are more than 35% identical to wild-type sequences. Meanwhile, it reduces 8% (from 22% to 14%) to the number of designed sequences that are not homologous to any known protein sequences according to psi-blast. More importantly, the sequences designed by RosettaDesign-SR have 2–3% more polar residues at the surface and core regions of proteins and these surface and core polar residues have about 4% higher sequence identity to wild-type sequences than by RosettaDesign. Thus, the proteins designed by RosettaDesign-SR should be less likely to aggregate and more likely to have unique structures due to more specific polar interactions.
Keywords: protein design, structure-derived sequence profile, RosettaDesign, local sequence-structure coupling
INTRODUCTION
Computational protein design attempts to identify the amino acid sequences that will fold into a given target structure with sufficient stability and solubility and, ultimately, perform a desired function by using computational methods. The research in this area is motivated by the practical need for improving, modifying, and/or expanding the function of natural proteins as well as the fundamental interest in understanding the relationship between protein sequences, structures, and functions. Significant progress has been made in the last two decades in de novo design of proteins. In 1997, Dahiya and Mayo demonstrated through NMR structure determination that a computationally designed sequence can fold into a unique structure.1 Since then, designed proteins have been experimentally validated to fold into all-alpha,2–6 all-beta,7 and mixed α-beta proteins.8–11 A protein with a new protein fold12 was also designed successfully. The advance in computational design leads to a wide variety of applications ranging from increasing protein stability5,13 and folding rate,14–16 improving fold recognition,17–20 identifying functional sites,21 enhancing or creating binding specificity,22–28 and catalytic activity29–33 to designing protein conformational switches.34,35
Despite of significant progresses, we have not yet reached the point that successful design is guaranteed and protein design can be routinely applied to any given (known or novel) structure folds.36,37 For example, in a large-scale design of nine proteins by RosettaDesign,38 only “half of the folded designs have NMR spectra and temperature melts typical of tightly packed proteins.” The actual success rate of a fully automatic method is likely even lower because manual inspection and human experience are often involved in selecting designed sequences for final experimental validations. More recently, an experimental testing of five computationally designed, high-affinity ligand-binding proteins revealed that none of the designed proteins performs as expected due to instability, aggregation, or lack of detectable, designed ligand binding.39
What causes the low success rate described above? A commonly used criterion for judging the potential success of a design is sequence identity between the designed sequence and the original wild-type sequence for the target structure. The existing protein-design techniques have been reported to reach an average sequence identity of 30–37%.40–44 However, most studies are limited to a small number of test proteins while fixing certain residue types (e.g., Gly, Cys, Pro in EGAD,43 and Cys in RosettaDesign40). In fact, as we shall see in this article, RosettaDesign,40 EGAD,43 and Liang-Grishin44 all achieved an average sequence identity of 30–32% with a set of 33 globular proteins. It is known that 30–32% sequence identity is in a so-called twilight zone where two proteins may or may not have the same structure.45 This twilight zone is confirmed in Figure 1 by making 22,207,780 pairwise structural comparisons by TM-align47 between 6665 proteins (2Å resolution or better, pair-wise sequence identity of 90% or less, chain length between 60 and 300 residues, from the pisces server48). There is a transition from structurally dissimilar pairs (TM-score around 0.3) to structurally similar pairs (TM-score >0.5) at sequence identity around 30%. Here, TM-score >0.5 denotes structurally similar pairs47 because at TM-score >0.5 the difference between the two structures is often limited to a small portion of the structures, for proteins with high sequence identity, in particular.47,49 That is, locating in the twilight zone is likely one of the reasons for low success rate. On the other hand, Figure 1 shows that structurally dissimilar pairs essentially disappear when sequence identity is above 35%. Thus, even small improvement from 30 to 32% sequence identity achieved by existing methods could potentially lead to a large improvement in success rate. Indeed, a recent study showed that optimizing sequence identity (2% improvement) and specific reference states for all-beta proteins lead to the first successful design of a beta sandwich protein called Tenascin without the need of negative design.42
Figure 1.
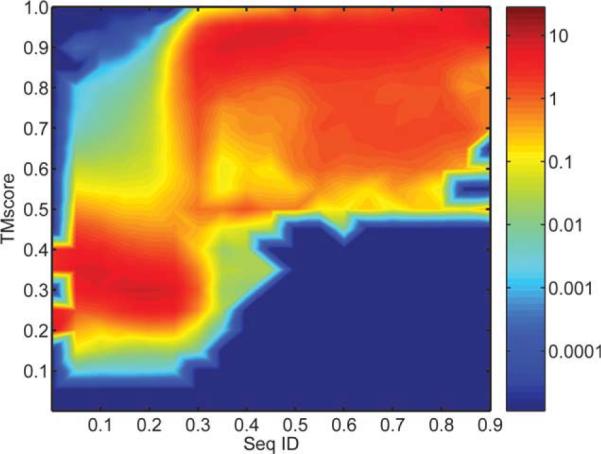
Population density of protein pairs as a function of the sequence identity between a protein pair calculated by FASTA46 (X axis) and the TM-score describing the structural similarity between a pair of proteins (Y axis). The population density is normalized for each sequence identity. The population density is described in the unit of the population density at a uniform distribution. The initial data is a 18 × 20 grid with sequence identity stepsize of 0.05 and TMscore stepsize of 0.05 based on pairwise comparison of 6665 proteins. The data is further smoothed by interpolating to a grid of 900*1000.
Improving sequence identity to wild type sequences requires a more effective scoring function because sequences are predicted by placing them onto a target structure and minimizing the scoring function. Some scoring functions are made of various physical energy terms,50 including van der Waals interaction, solvation,51,52 electrostatics,53 and hydrogen bonding.54 Others, on the other hand, took the advantage of the knowledge-based information derived from known protein structures.55–61 These energy functions are usually built to capture tight and specific tertiary packing interactions. The relation between local sequence and backbone (or secondary) structure, however, is only described by a single-residue property of amino acid propensity for a given backbone torsion angle (as used in RosettaDesign40) or for a given secondary structure (as used in ORBIT1). However, it is known from secondary structure or backbone torsion-angle prediction that a local sequence segment of about 20 residues long is needed to determine about 80% three-state secondary structure62,63 or 83% of both backbone ϕ and ψ torsion angles within 60 degree from their native values.64 Thus, it is necessary to go beyond single-residue properties to account for the coupling between local structure and sequence for protein design.
One way to take into account the coupling between local structure and sequence is to search structurally similar fragments for a given target fragment structure and produce structure-derived sequence profiles from the sequences of structurally similar fragments.20,65,66 We have successfully applied this structure-derived sequence profile for improving fold recognition and protein structure prediction.20 In this work, we explore the usefulness of this structure-derived sequence profile as an energetic term in protein design. We implemented this energy term into two separate protein-design programs, RosettaDesign,40 and EGAD.43 We found that implementing this energetic term in RosettaDesign leads to about 3% improvement from 31 to 34% for the sequence identity between the top-1 energy-ranked sequence and the wild-type sequence (based on design of 944 proteins). Larger improvement (8%) is also observed when the sequence profile is implemented in EGAD. We further show that structure-derived sequence profiles together with energy terms for reducing repetitive regions and optimized reference states lead to a method (called RosettaDesign-SR) that increases 12% (12%) for the fraction of designed proteins with more than 35% (30%) sequence identity to wild-type sequences and makes a 8% reduction to the fraction of designed proteins that do not have homologous hits to any existing sequences according to psi-blast.67 Moreover, sequences designed by RosettaDesign-SR contain more polar residues than those by RosettaDesign at both surface and core regions of proteins and, thus, are potentially more soluble and likely fold into unique conformations.
THEORY
Datasets for protein design
We downloaded a nonredundant protein set with resolution better than 2.0Å, pair-wise sequence identity of less than 30% from the pisces server48 (October 17, 2008). This set contains 4803 protein chains that are further reduced to 2528 chains after removing the chains with missing residues or backbone atoms. We randomly selected 40 globular proteins between 60 and 150 residues as a set for parameter training. Because RosettaDesign failed to design sequences for 7 of the 40 proteins, we finally have 33 proteins as the training set of protein design programs. The number of residues of these proteins ranges from 66 to 132, with an average of 104. We use a small set of 33 proteins to reduce the computational time for training.
We further selected the first 1000 smallest proteins from the above 2528 proteins. Because RosettaDesign program failed to design 56 of the 1000 proteins, the total number of proteins for testing design programs is 944. The number of residues of these proteins range from 60 to 160, with an average of 112.4.
Finally, we used the fragments contained in the structures of 2495 (2528–33) protein chains to build the fragment template library. All datasets used in this study are available at http://sparks.informatics.iupui.edu.
Structure-derived sequence profile
The method for generating structural-based sequence profile is essentially the same as that developed by Zhou and Zhou.20 Given the structure of a protein to be designed (target structure), we first divided it into a number of structural fragments with a sliding widow of length Lfrag along the sequence. For a protein with Nres residues, there are Nres − Lfrag + 1 structural fragments. Each target fragment was then structurally aligned to the same-length fragments contained in a fragment library. The sequences of the top Nfrag library fragments with the lowest root-mean-squared distance (RMSD) to the target fragment are used to calculate sequence profile, or, the probability of a residue type in a given target sequence position. RMSD values between fragments are calculated based on four backbone heavy atoms (N, Cα, C, and O) plus pseudo Cβ atom because the locations and types of native residues are supposed to be unknown. Pseudo Cβ atoms are generated based on standard 1.54Å for the Cα–Cb bond length, 109.53° for the bond angle N–Cα–Cβ and 109.46° for the dihedral angle C–N–Cα–Cβ.68 The profile [Pprofile(i,I) with sequence position i, and amino acid type I, I = 1..20] is obtained by averaging over the sliding windows. We optimized Lfrag and Nfrag to maximize the sequence identity between the wild-type sequence and the consensus sequence that corresponds to the residue type with the highest probability at each sequence position in the profile. The optimal values for Lfrag and Nfrag are 5 and 25, respectively, by using the above mentioned fragment library of 2495 proteins. During optimizing Lfrag and Nfrag, the sequence profile of a given protein in the 2495 protein set is generated from the fragment library of the rest 2494 proteins. The average sequence identity between the consensus sequences and wild-type sequences is 24.9% averaged over 2495 proteins. This is 3% higher than ~22% in our previous work20 by residue-depth dependent fragment comparison with Lfrag = 9 and Nfrag = 25. Here, residue depth refers to the depth of a residue from the surface of a protein69 and was used to compare fragments in similar level of solvent exposure. We did not use residue-depth here because using residue depth did not lead to further improvement in sequence identity. A shorter five-residue fragment used here is closely related to the jump between helical and strand structures.70
Finally, structure-derived sequence profiles for the 33 protein set (training set) are generated from the fragments of 2495 proteins.
RosettaDesign, EGAD, and Liang-Grishin programs for protein design
RosettaDesign40 (versions 2.3 and 3.0) and EGAD43 were download from http://www.rosettacommons.org/ and http://egad.ucsd.edu/EGAD_manual/index.html, respectively. We also obtained a copy of protein design program by Liang and Grishin.44 In RosettaDesign 2.3, the command “Rosetta -design -fixbb -ex1” was executed, while in RosettaDesign 3.0, the command “fixbb.linuxgccrelease -ex1” was executed. In EGAD, the JOB-TYPE is set to “MC” and the VARIABLE_POSITIONS is set to “total_sequence_design.” In Liang's program, its default setting was used. We have modified RosettaDesign 2.3, rather than RosettaDesign 3.0 because the latter was not yet available at the time we started this study. After RosettaDesign 3.0 was released, we found that the difference between sequences designed by RosettaDesign 3.0 and RosettaDesign 2.3 is small and thus we continued our focus on modification of RosettaDesign 2.3.
Modification of RosettaDesign 2.3 and EGAD energy functions
We have modified the energy functions in RosettaDesign as follows:
| (1) |
where Eoriginal is the original energy function of a given program, Pprofile(i,Ii) is the structure-derived sequence profile at a given sequence position i and residue type Ii at the position [1/125 is added to each value of Pprofile(i,Ii) to prevent ln0], Nirep is the number of nearest and second nearest neighboring residues that repeat the residue type at the sequence position i (ranging from i − 2 to i + 2 including itself), Eref(si,Ii) is the reference-state energy term that depends on secondary structure (si) and residue type (Ii), and wprofile and wrep are weight parameters for the profile and residue-repeat terms, respectively. Here, secondary structure assignment was made by STRIDE.71 The purpose of the first term is to incorporate restraints on sequence from local structure. We added the second repetitive energy term because adding the sequence profile term leads to a significant increase in number of repeats of same residue types such as LLL and VVV. The second term is a simplified definition of sequence complexity that measures the extent of randomness in a sequence by Shannon's entropy.72 It leads to a higher (unfavorable) energy if the designed sequence repeats a certain residue type within a local region. We found that this term is effective for removing low-complexity regions of designed sequence defined by the SEG program.72 We added this term because low sequence complexity is often associated with disordered regions of proteins.73 The last term in Eq. (1) is for optimizing the reference states of residue types at different secondary structure environments so that the occurrence of each residue type is close to that of wild-type sequences. Secondary structure-dependent reference states were introduced previously42,74
Equation (1) is also implemented in EGAD. However, only the first term is used because the purpose is to confirm the effect of structure-derived sequence profile in protein design.
RESULTS
Sequence identity to wild type sequences
To obtain consistent, comparative information on the sequence identity of designed sequences to wild type sequences, we have applied EGAD, RosettaDesign 2.3, RosettaDesign 3.0, and Liang-Grishin to 33 training proteins. We found that the average sequence idenity of 100 designed sequences per protein (a total of 3300 sequences) are 30.3% by EGAD (fixing Cys, Gly and Pro), 31.9% by Rosetta 2.3, and 29.0% by Rosetta 3.0, and 30.0% by Liang-Grishin,44 respectively. Thus, the average sequence identities given by different programs are between 29 and 32% for this set of training proteins.
Modification of RosettaDesign 2.3
The weight parameters and reference values are trained with the 33-protein set. Side chains of each protein structure are stripped off and pseudo Cβ atoms are built before the structure is used as the target structure. That is, all amino acid residues are designed including Cys which is typically fixed by RosettaDesign.40 Results shown in Table I are averaged over 100 designed sequences per protein. Compared with RosettaDesign, it is clear that structure-derived sequence profiles alone has substantially lower sequence identity (8% lower) with significantly higher low complexity regions (9%). We first implemented only the structure-derived sequence profile [the first term in Eq. (1)] into RosettaDesign (called RosettaDesign-S for convenience) and optimized wprofile based on the average sequence identity of designed sequences to the wild type sequences. Figure 2 shows that sequence identity changes from 31.9% at wprofile = 0 to 35.2% at wprofile = 1 with a peak at 35.6% at wprofile = 0.75. The change of sequence identity is small around wprofile = 0.75, suggesting the stability of improvement. Without fixing Cys, the RosettaDesign modified by incorporating structure-derived sequence profiles does not produce any sequences containing Cys residues as the original RosettaDesign does.
Table I.
Comparison Between the Results Given by Wild-Type Sequences, Sequences Designed by RosettaDesign 2.3, RosettaDesign and Structure-Derived Sequence Profile (RosettaDesign-S), RosettaDesign-S Plus Repetitive, and Reference-State Energy Terms (RosettaDesign-SR)
| % Polar residuesa |
||||||||
|---|---|---|---|---|---|---|---|---|
| Seq. ID (%)b | % LCc | % LLLd | % VVVe | All | α | β | Coil | |
| Wild-type | 100 | 2.1 | 0.030 | 0.060 | 49.1 | 51.2 | 41.4 | 52.6 |
| RosettaDesign | 31.9 | 6.4 | 0.113 | 0.033 | 44.0 | 48.4 | 33.8 | 46.9 |
| Sequence profilef | 24.2 | 15.1 | 0.030 | 0.714 | 28.2 | 24.2 | 21.0 | 38.3 |
| RosettaDesign-S | 35.6 | 21.3 | 0.783 | 0.597 | 37.4 | 36.9 | 28.2 | 45.1 |
| RosettaDesign-SR | 34.4 | 1.4 | 0.029 | 0.030 | 48.2 | 51.3 | 40.0 | 50.9 |
The results are obtained for the training set of 33 proteins averaged over 100 sequences designed for each protein.
Frequency of polar residues for helical, strand, and coil positions, respectively. Polar residues include D,E,H,K,N,Q,R,S,T, and Y.
The average sequence identity to wild type sequences of target proteins.
Percent of low-complexity regions defined by program SEG72.
Percent of occurrence for three sequentially linked Leu residues.
Percent of occurrence for three sequentially linked Val residues.
Results based on the consensus sequence from structure derived sequence profile.
Figure 2.
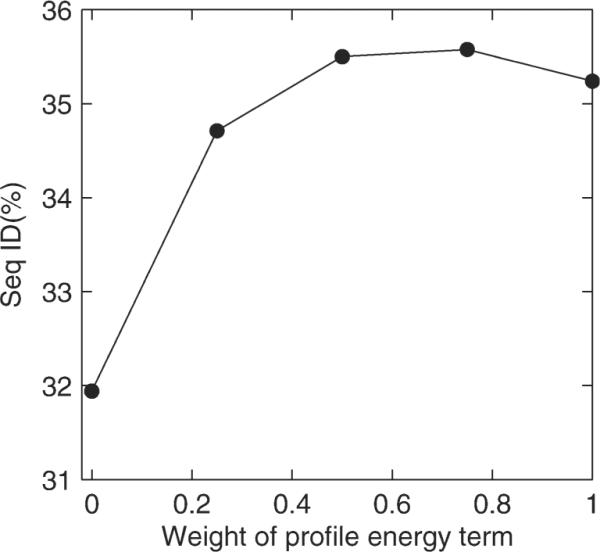
Average sequence identity between designed sequences and wild type sequences for 33 training proteins as a function of the weight wprofile for the sequence profile term.
Sequences designed by RosettaDesign-S, however, have frequent appearance of multiple repeats of same residue types such as LLL (three sequentially connected Leu residues) and VVV (three Val residues). This significant increase in LLL and VVV appearance occurs along with significant increase in low-complexity regions. As shown in Table I, low complexity regions defined by program SEG72 increase from 6.4% by RosettaDesign to 21.3% by RosettaDesign-S, compared to only 2.1% for wild type sequences. These repetitive regions, signaled low complexity of designed sequences, are often associated with disordered regions.73 The occurrence of low complexity regions indicates the hidden bias of local-fragment-derived sequence profiles toward small hydrophobic residues such as L and V. Indeed, we observed a large drop in fraction of polar residues from 44% in RosettaDesign to 37% by RosettaDesign-S. The reduction is the most significant in helical regions (decreases 11% from 48% to 37%). Thus, we introduced two additional terms in Eq. (1) to increase sequence complexity and improve the balance of hydrophobic and hydrophilic residues. More specifically, weight parameter wrep and reference state energy Eref are optimized for reducing repetitive sequences and increasing the fraction of hydrophilic residues. These parameters are optimized by a trial-and-error approach. We only modified Eref for eight residue types that have a significant deviation from their occurrence frequencies of native proteins. The final optimized value for wrep is 0.4 and the values for Eref are listed in Table II with wprofile unchanged at 0.75. The final version of the method is labeled as RosettaDesign-SR with R for repetitive and reference energy terms.
Table II.
Optimized Reference State Energy Eref(s,I) Values for 8 Amino Acid Residue Types
| Type | A | E | G | I | K | L | P | V |
|---|---|---|---|---|---|---|---|---|
| Helix | 0.8 | 0.7 | 0 | 0 | 0.2 | 0.9 | 0 | 0 |
| Strand | 0.3 | 0 | 0 | 0.9 | 0 | 0.4 | 0.1 | 1.2 |
| Coil | 0 | 0 | 0.2 | 1 | 0 | 0 | 1.6 | 0 |
Others are set to 0.
The effect of repetitive and reference-state energy terms is illustrated in Table I. Although sequence identity has decreased by about 1% from RosettaDesign-S, the fraction of low complexity regions and the occurrence of LLL and VVV as well as the frequency of polar residues are now more in line with wild-type sequences. More importantly, the amount of polar residues in designed sequences given by RosettaDesign-SR is significantly closer to that of wild type sequences than RosettaDesign. For example, the fraction of polar residues in strand regions are 34% by RosettaDesign, 28% by RosettaDesign-S, and 40% by RosettaDesign-SR, compared with 41% for wild-type. The fraction of polar residues is important for maintaining the solubility of proteins, preventing aggregation, and enhancing specific interactions.
RosettaDesign-SR
RosettaDesign-SR is tested with the dataset of 944 proteins. We designed 100 sequences for each protein. These sequences are ranked by the modified energy in Eq (1). The average sequence identities to wild type sequences for the final version of the modified RosettaDesign are 33.9% for top 1 ranked by energy, 36.8% for the highest sequence ID among top 10, 39.0% for the highest sequence ID in 100 designed sequences and 33.2% for the average over 100 designed sequences. They are 2.5%, 2.4%, 2.3%, and 2.5% improvement over RosettaDesign, respectively. Because we found that averaging top 1, or the best in top 10, or 100 designed sequences over 944 proteins yield similar trends in comparison with Rosetta-Design, we will report the results based on statistics of top 1, here and hereafter.
Table III compares the results given by wild-type sequences, sequences designed by RosettaDesign 2.3, and by RosettaDesign-SR. Similar to the results for the training set, RosettaDesign-SR provides a consistent improvement in sequence identity to wild-type sequences (2.5%), in amount of low complexity regions (5.1%), and in fraction of polar residues (2.6%). The sequence identity to wild-type sequences increases in a similar magnitude across different secondary structure. RosettaDesign-SR makes a 2.7% (from 26.2% to 28.9%), 1.6% (from 35.6% to 37.2%), and 2.7% (from 35.0% to 37.7%) improvement over RosettaDesign for helical, strand, and coil regions, respectively (not shown in Table III for clarity). As in RosettaDesign, helical residues from RosettaDesign-SR have the lowest sequence identities to the wild type sequences. The improvement in fraction of polar residues, on the other hand, is the most significant for strand regions. The sequences from RosettaDesign-SR contain 5% more polar residues in strands than the sequences from RosettaDesign although still 3% less than wild-type sequences.
Table III.
Comparison Between the Results Given by Wild-Type Sequences, Sequences Designed by RosettaDesign 2.3 and by RosettaDesign-SR
| % Polar residuesa |
||||||||
|---|---|---|---|---|---|---|---|---|
| Seq. ID (%)b | % LCc | % LLLd | % VVVe | All | α | β | Coil | |
| Wild-type | 100 | 3.1% | 0.063 | 0.045 | 50.1 | 51.8 | 44.7 | 52.5 |
| RosettaDesign | 31.4 | 9.1% | 0.244 | 0.093 | 45.6 | 50.1 | 36.1 | 48.3 |
| RosettaDesign-SR | 33.9 | 4.0% | 0.039 | 0.038 | 48.2 | 51.1 | 41.5 | 50.3 |
The results are obtained for the test set of 944 proteins with the top 1 ranked sequence in 100 sequences designed for each protein.
Frequency of polar residues for helical, strand, and coil positions, respectively.
The average sequence identity to wild type sequences of target proteins.
Percent of low-complexity regions defined by program SEG72
Percent of occurrence for three sequentially linked Leu residues.
Percent of occurrence for three sequentially linked Val residues.
Figure 3 compares the fraction of all 20 amino acid types in designed sequences to those in wild type sequences. The frequencies of most residue types given by RosettaDesign-SR are slightly closer than those given by RosettaDesign to the corresponding frequencies in the wild type sequences. The average absolute deviation between each amino acid frequency in designed sequences and wild-type sequences decreases from 1.1% (RosettaDesign) to 0.9% (RosettaDesign-SR).
Figure 3.

The frequency of 20 amino acid residues in sequences of 944 test proteins. Black bar corresponds to wild-type sequences. Gray bar corresponds to designed sequences by the original RosettaDesign. Open bar corresponds to designed sequence by RosettaDesign-SR.
It is of interest to know how the matching residues between designed sequences and wild type sequences are distributed on the surface or inside proteins and what fraction of polar residues are on the surface of proteins. We measure solvent exposure by residue contact number, the number of residues (Cα atoms) within 10 Å from a specific residue. We exclude six nearest sequentially linked residues (i ± 1, i ± 2, and i ± 3) because they are more likely within 10Å distance cutoff. Contact numbers are divided into four bins (0–5, 6–10, 11–15 and >16 contacts). We use residue contact numbers because they are found evolutionarily more conserved than solvent accessibility.75,76 More importantly, residue contact number based on Cα atoms can be evaluated in the absence of sidechains.
Table IV compares sequence identity at different contact numbers. RosettaDesign-SR improves sequence identity over RosettaDesign by 3% at the surface (residue contact number <5) and 0.5% at the deep core (residue contact number >16). This is because high sequence identity inside the core (50%) is more difficult to improve further. Identical residues between wild type sequences and designed sequences are further analyzed according to the locations of polar and nonpolar residues in wild-type sequences. As Table IV indicates, the most significant improvement is in sequence identity of polar residues across different levels of solvent exposure. There are 2.9%–4.5% more polar residues in RosettaDesign-SR sequences that are identical to those in wild type sequences than in RosettaDesign from deep core to surface. The smaller but consistent improvement is also observed in sequence identity between nonpolar residues of designed and those of wild-type sequences (between 0.2 and 1.6% at different contact numbers).
Table IV.
Comparison Between the Results at Different Solvent Exposures Given by Wild-Type Sequences, Sequences Designed by RosettaDesign 2.3 and by RosettaDesign-SR
| % Seq. IDa |
% Polar residuesb |
|||||||
|---|---|---|---|---|---|---|---|---|
| (%Population)d | [0–5]c (19.9) | [6–10]c (35.2) | [11–15]c (28.6) | ≥16c (16.3) | [0–5]c (19.9) | [6–10]c (35.2) | [11–15]c (28.6) | ≥16c (16.3) |
| Wild-type | 100 | 100 | 100 | 100 | 61.4 | 58.6 | 44.1 | 28.6 |
| RosettaDesign | 22.4 (14.0/35.8)e | 25.7 (15.7/39.9) | 36.3 (18.3/50.5) | 49.6(23.4/60.1) | 60.5 | 51.8 | 38.8 | 26.0 |
| RosettaDesign-SR | 25.7 (18.5/37.1) | 28.9 (19.9/41.6) | 38.0 (21.9/50.7) | 50.1 (26.3/59.7) | 62.7 | 55.1 | 41.1 | 28.1 |
The results are obtained for the test set of 944 proteins with the top 1 ranked sequence in 100 sequences designed for each protein.
Average sequence identity between designed sequences and wild-type sequences.
Fraction of polar residues in protein sequences.
Solvent exposure is measured by residue contact number, the number of residues (Cα atoms) within 10 Å from a specific residue (three nearest sequentially linked residues are excluded from counting). They are divided into 4 bins.
Population of residues in four residue-contact bins.
(Polar/Nonpolar). Sequence identity to polar and nonpolar residues in wild-type sequences.
Improvement in the polar content of designed sequences is also reflected from the fraction of polar residues at different contact numbers. As shown in Table IV, sequences designed by RosettaDesign-SR have more polar residues than those by RosettaDesign and closer in the fraction of polar residues to wild type sequences at all regions of proteins except that our new method yields 1% more polar residues than wild type sequences on the surface of proteins (residue contact numbers <5).
Because the sequence identity to wild type sequences is the lowest for surface-exposed residues that have few contacts with other residues, we suspect that higher fraction of surface residues in a protein (less globular-shaped) would lead to smaller sequence identity between designed sequences and wild type sequences. Figure 4 shows that such a trend indeed exists. When the fraction of surface residues (contact number <9) is greater than 80%, all designed proteins have less than 30% sequence identity to their respective wild type sequences. Meanwhile, when the fraction of surface residues is less than 30%, all designed proteins have more than 20% sequence identity to their respective wild type sequences.
Figure 4.
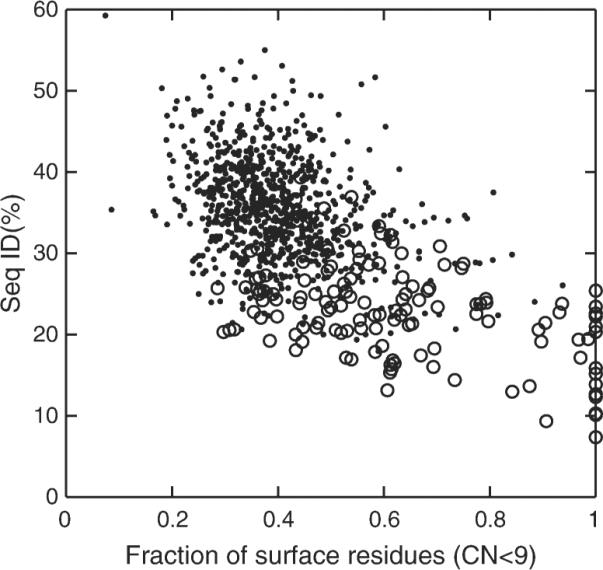
The sequence identity between top-1 ranked, designed sequences for 944 proteins and wild-type sequences as a function of fraction of surface residues (residue contact number <9). Open circles are those designed sequences that do not have any hit in a psi-blast search.
We further examine how sequence identity and fraction of polar residues change for different structural folds. Results are shown in Table V. As in RosettaDesign, sequence identity to wild type sequences given by RosettaDesign-SR is the highest for all-β proteins (37%). On the other hand, the fraction of polar residues given by RosettaDesign is 7.4% below wild type sequences for all-β proteins. RosettaDesign-SR cuts this gap more than half to 3%. Improvement on other β-strand containing proteins (others) is also observed. This suggests that the sequences designed by RosettaDesign-SR for β-strand containing proteins are more likely soluble than the sequences designed by RosettaDesign.
Table V.
Sequence Identity Between Designed Sequences and Wild Type Sequences and Fraction of Polar Residues for All-α, All-β, and Other Proteins
| % Seq. IDa |
% Polar residuesb |
|||||
|---|---|---|---|---|---|---|
| (% Population)d | All-αc (255) | All-βc (166) | Othersc (523) | All-αc (255) | All-βc (166) | Othersc (523) |
| Wild-type | 100 | 100 | 100 | 51.7 | 50.0 | 49.4 |
| RosettaDesign | 26.8 | 35.3 | 32.6 | 49.8 | 42.6 | 44.7 |
| RosettaDesign-SR | 30.2 | 36.9 | 34.8 | 49.8 | 47.0 | 47.9 |
Average sequence identity between designed sequences and wild-type sequences.
Fraction of polar residues in protein sequences.
All-α proteins refer to the proteins with >10% helical residues and <10% strand residues. All-β proteins refer to the proteins with <10% helical residues and >10% strand residues.77
The number of proteins in a given structural fold.
The above results appear to suggest a small incremental change from RosettaDesign to RosettaDesign-SR. However, as Figure 1 suggests, what is more important is the fraction of proteins whose designed sequences are more than 35% sequence identity to wild type sequences. We found that this fraction increases by 12% (33.9% by RosettaDesign and 45.9% by RosettaDesign-SR, respectively). If a 30% sequence identity cutoff is used, there is also a 12% increase from 60.1% by RosettaDesign to 72.1% by RosettaDesign-SR. Underlying significant improvement is also revealed by the fact the average sequence identity between sequences designed by Rosetta-Design and those by RosettaDesign-SR is only 51%.
Another way to verify the designed sequence is to perform a psi-blast search and to locate if there is any sequence homologous to designed ones. Because psi-blast search performs a local alignment, we define that a homologous sequence is found only if its length is at least 2/3 that of the designed sequence with an e-value of 0.01 or less. Figure 5 shows the highest sequence identity found in psi-blast search as a function of the sequence identity to wild type sequences. For the majority of proteins, the designed sequences have slightly higher sequence identity to the homologous sequences found in sequence library than to the wild type sequences. The average sequence identity between designed sequences and the closest homologous sequences is 29.9% by RosettaDesign and 34.3% by RosettaDesign-SR. (34.3% is only 0.4% higher than 33.9%, the average sequence identity to wild type sequences. This small change is due to many sequences having no homologous hits. See below.) This is consistent with about 3% improvement for sequence identity to wild-type sequences. This small improvement in average sequence identity, however, leads a significantly larger 15% increase in the fraction of designed proteins that share more than 35% identity with nearest homologous sequences in sequence library. The fractions of proteins are 54.6% by RosettaDe-sign and 70.0% by RosettaDesign-SR, respectively. For a 30% identity cutoff, the fractions of proteins are 74.3% by RosettaDesign and 84.5% by RosettaDesign-SR.
Figure 5.
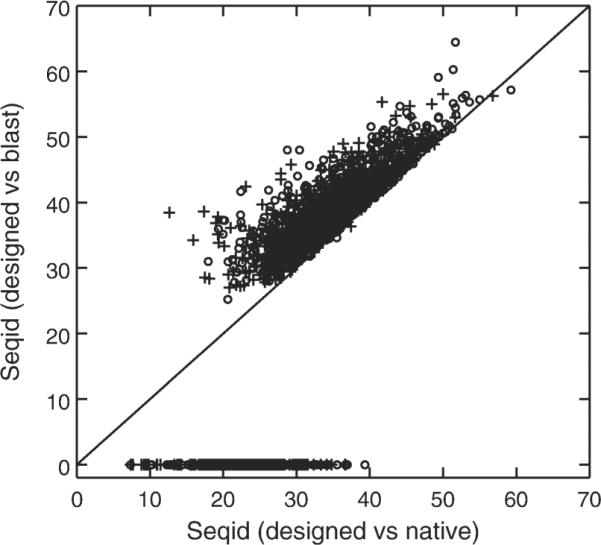
The sequence identity between designed and wild-type sequences versus the highest sequence identity between the designed and the sequence obtained by performing a psi-blast search for designed sequences. Circle denotes the sequences designed by RosettaDesign-SR, and plus denotes the sequences designed by original RosettaDesign. Points with zero sequence identity between the designed and the sequence obtained by performing a psi-blast search for designed sequences refer to those designed sequences without any hits from a psi-blast search.
We further found that there is significant improvement in number of designed sequences without homologous hits in sequence library. There are 22% (or 209 proteins) without hits for 944 proteins designed by RosettaDesign. This number is reduced to only 14% (or 134 proteins) for proteins designed by RosettaDesign-SR. Most of these “orphan” sequences are lower than 30% sequence identity to their corresponding wild-type sequences and connected to the structures with high percentage surface residues as shown in Figure 4. That is, sequences designed for proteins with 60% or more surface residues (defined as contact number <9) are often unreliable.
EGAD
To further demonstrate the usefulness of structure-derived sequence profile for protein design, we also implemented the profile in EGAD as in Eq. (1) but without repetitive and reference energy terms because optimizing the last two terms makes minor changes to sequence identity. We found that there is an 8.5% improvement in sequence identity from 30.3% to 37.8% for 33 training proteins after introduction of the sequence profile term with wprofile = 7.0. The higher sequence identity is due to fixing of Gly, Pro, and Cys in EGAD. Because EGAD is too slow for testing on all 944 proteins, we randomly selected 55 proteins from the set. Application of the modified EGAD to the set of 55 proteins continues to make an 8.0% improvement in sequence identity over EGAD. Here, EGAD was run without including native rotamers. This result confirms that the structure-derived sequence profile for protein design is effective for improving protein design.
DISCUSSION
In this article, we have tested whether a structure-derived sequence profile is useful for protein design. We found that its implementation in RosettaDesign and EGAD (RosettaDesign-S and EGAD-S) leads to about 4 and 8% improvement in sequence identity to wild type sequences, respectively. Further refining RosettaDesign-S with repetitive and reference-state energy terms leads to RosettaDesign-SR. On the basis of analysis of designed sequences for 944 proteins, we found that the most significant improvement of RosettaDesign-SR over RosettaDe-sign is in amount and location of polar residues in designed sequences. The fraction of polar residues increases by 3% (5% for strand residues) while sequence identity between polar residues of designed and that of wild-type sequences improves by 4% crossing all levels of surface exposure. More polar residues on the surface of the proteins for the sequences designed by RosettaDesign-SR will make them less likely to aggregate,78,79 a significant problem in designed sequences.39,42 Meanwhile, more polar residues inside the proteins for the sequences designed by RosettaDesign-SR will make them more likely to fold into a unique structure as hydrophilic residues form specific hydrogen bonding and salt bridges.80–82 This small improvement in sequence identity leads to a large change in overall designed sequences (the average sequence identity between sequences designed by RosettaDesign and those by RosettaDesign-SR is only 51%) and 12% increase in the fraction of proteins with more than 35% sequence identity to wild-type sequences.
Our structure-derived sequence profiles are obtained with a library of proteins with 30% or less sequence identity between each other. It is of interest to know if this sequence identity cutoff would have strong influence in the quality of sequence profiles. To answer this question, we obtained an updated dataset of 2592 proteins with a cutoff of 25% sequence identity (high-resolution X-ray structures, 2.0Å or better) by PISCES server.48 This dataset is larger than the set of 2495 proteins at 30% cutoff because this new set was downloaded 9 months later. We found that the sequence identity between the most popular residue types and wild-type sequences (averaged over proteins) is 25.3% for the new fragment library, compared to 24.9% for the library of 2495 proteins. Thus, homologous sequences if existing in proteins based on the 30% sequence identity cutoff have minor effect on structure-derived sequence profiles.
Implementing structure-derived sequence profiles only leads to about 3% improvement in sequence identity to wild type sequences. What has stopped us to achieve a higher sequence identity? Certainly, a protein can mutate frequently without a significant change in its three-dimensional structure. In fact, the average sequence identity is 56% (averaged over 944 proteins) between the wild type sequences and the consensus sequences from the sequence profile derived from homologous sequence alignments by psi-blast. That is, there is room for further improvement. A close examination of 100 sequences designed by either RosettaDesign or RosettaDesign-SR indicates that they are highly homologous among each other: the average sequence identity within themselves is 67.8% by RosettaDesign and 78.3% by RosettaDesign-SR. That is, the designed sequences converge to a single family of sequences (single solution) with different initial guesses. This suggests that it is not insufficient sampling of sequence space but rather the lack of a good energy function causing wild-type sequences often not within the family of designed sequences. Indeed, if we include a biased energy term to sample sequences with high sequence identity (SeqID) to wild type sequences (E = −wseq|SeqID-SeqID0|), we found that the energy of a designed sequence increases significantly in a parabolic curve as SeqID0 either increases toward to 100% or decreases toward 0%. Moreover, the energy of a wild type sequence is close to the energies of random sequences with about 0% sequence identity to wild-type sequence. That is, the energy function does not favor sequences that are close to 100% wild-type sequence as one of the solutions. Although native sequences are not necessarily optimized for their structures, the energy difference between wild-type sequences and optimized designed sequences is too large to be realistic. In other words, the quality of an energy function remains as the bottleneck for successful, computational design.
One important observation is higher recovery of native polar residue types in protein cores by RosettaDesign-SR. All polar residues inside core (defined as having more than 10 contacting residues) are highly conserved with an average conservation index of 0.80 from PSI-BLAST (1 for 100% conservation). RosettaDesign-SR recovered a subset (23%) of core polar residues with an average conservation index of 0.91, compared to 20% by RosettaDesign with an average conservation index of 0.93. Analysis of correctly predicted pairs of polar residues indicates that RosettaDesign-SR consistently has about 40% more pairs than RosettaDesign, regardless of the distance between the pair of polar residues. These highly conserved and connected polar residues likely play an important role in structure stabilization.
This study uses sequence identity to wild type sequence as one of the criteria for judging the potential success of the designed sequence. Completely relying on this criterion is certainly a questionable practice because most sequences constrained to have high sequence identity to wild type sequence will not fold into the same structure of the wild-type sequence. For example, an average of 80% sequence identity will be resulted from replacing all surface polar residues (contact number <6) by nonpolar residues (Table IV). This sequence, however, will more likely aggregate rather than fold. Moreover, 35% sequence-identity threshold observed in Figure 1 may not be applicable to designed sequences because the structures can be disrupted by a few bad predictions of amino acid residues. Thus, sequence identity metric has to be used in combination of other native properties such as sequence complexity, the fraction of polar residues, and the frequency of 20 amino acid residues. We are currently searching for more robust theoretical criteria for judging the potential success of a designed sequence before expensive experiments are carried out as the final proof.
This article is limited to design with a fixed backbone to reduce the conformational space of sampling. A fixed backbone may have prohibited the sampling of more native-like sequences.83 Indeed, Saunders and Baker showed that the sequence identity between designed sequences and wild-type sequences can be improved after allowing flexibility.84 RosettaDesign-SR is not limited to a fixed backbone because newly implemented terms are sequence-dependent only. We will defer design with backbone flexibility to our future studies.
ACKNOWLEDGMENTS
The authors have benefited significantly from discussion with Professors Haiyan Liu, Shide Liang, Yawen Bai, Amy Keating, and Bruce Tidor.
Grant sponsor: National Institutes of Health; Grant numbers: R01 GM 085003, R01 GM 067168
REFERENCES
- 1.Dahiyat BI, Mayo SL. De novo protein design: fully automated sequence selection. Science. 1997;278:82–87. doi: 10.1126/science.278.5335.82. [DOI] [PubMed] [Google Scholar]
- 2.Harbury PB, Plecs JJ, Tidor B, Alber T, Kim PS. High-resolution protein design with backbone freedom. Science. 1998;282:1462–1467. doi: 10.1126/science.282.5393.1462. [DOI] [PubMed] [Google Scholar]
- 3.Bryson JW, Desjarlais JR, Handel TM, DeGrado WF. From coiled coils to small globular proteins: design of a native-like three-helix bundle. Protein Sci. 1998;7:1404–1414. doi: 10.1002/pro.5560070617. [DOI] [PMC free article] [PubMed] [Google Scholar]
- 4.Walsh ST, Cheng H, Bryson JW, Roder H, DeGrado WF. Solution structure and dynamics of a de novo designed three-helix bundle protein. Proc Natl Acad Sci USA. 1999;96:5486–5491. doi: 10.1073/pnas.96.10.5486. [DOI] [PMC free article] [PubMed] [Google Scholar]
- 5.Shah PS, Hom GK, Ross SA, Lassila JK, Crowhurst KA, Mayo SL. Full-sequence computational design and solution structure of a thermostable protein variant. J Mol Biol. 2007;372:1–6. doi: 10.1016/j.jmb.2007.06.032. [DOI] [PubMed] [Google Scholar]
- 6.Bender GM, Lehmann A, Zou H, Cheng H, Fry HC, Engel D, Therien MJ, Blasie JK, Roder H, Saven JG, DeGrado WF. De novo design of a single-chain diphenylporphyrin metalloprotein. J Am Chem Soc. 2007;129:10732–10740. doi: 10.1021/ja071199j. [DOI] [PMC free article] [PubMed] [Google Scholar]
- 7.Kortemme T, Ramirez-Alvarado M, Serrano L. Design of a 20-amino acid, three-stranded beta-sheet protein. Science. 1998;281:253–256. doi: 10.1126/science.281.5374.253. [DOI] [PubMed] [Google Scholar]
- 8.Kuhlman B, O'Neill JW, Kim DE, Zhang KY, Baker D. Accurate computer-based design of a new backbone conformation in the second turn of protein L. J Mol Biol. 2002;315:471–477. doi: 10.1006/jmbi.2001.5229. [DOI] [PubMed] [Google Scholar]
- 9.Offredi F, Dubail F, Kischel P, Sarinski K, Stern AS, Van de Weerdt C, Hoch JC, Prosperi C, Francois JM, Mayo SL, Martial JA. De novo backbone and sequence design of an idealized alpha/beta-barrel protein: evidence of stable tertiary structure. J Mol Biol. 2003;325:163–174. doi: 10.1016/s0022-2836(02)01206-8. [DOI] [PubMed] [Google Scholar]
- 10.Dobson N, Dantas G, Baker D, Varani G. High-resolution structural validation of the computational redesign of human U1A protein. Structure. 2006;14:847–856. doi: 10.1016/j.str.2006.02.011. [DOI] [PubMed] [Google Scholar]
- 11.Dantas G, Corrent C, Reichow SL, Havranek JJ, Eletr ZM, Isern NG, Kuhlman B, Varani G, Merritt EA, Baker D. High-resolution structural and thermodynamic analysis of extreme stabilization of human procarboxypeptidase by computational protein design. J Mol Biol. 2007;366:1209–1221. doi: 10.1016/j.jmb.2006.11.080. [DOI] [PMC free article] [PubMed] [Google Scholar]
- 12.Kuhlman B, Dantas G, Ireton GC, Varani G, Stoddard BL, Baker D. Design of a novel globular protein fold with atomic-level accuracy. Science. 2003;302:1364–1368. doi: 10.1126/science.1089427. [DOI] [PubMed] [Google Scholar]
- 13.Schweiker KL, Zarrine-Afsar A, Davidson AR, Makhatadze GI. Computational design of the Fyn SH3 domain with increased stability through optimization of surface charge-charge interactions. Protein Sci. 2007;16:2694–2702. doi: 10.1110/ps.073091607. [DOI] [PMC free article] [PubMed] [Google Scholar]
- 14.Zhu Y, Alonso DO, Maki K, Huang CY, Lahr SJ, Daggett V, Roder H, DeGrado WF, Gai F. Ultrafast folding of alpha3D: a de novo designed three-helix bundle protein. Proc Natl Acad Sci USA. 2003;100:15486–15491. doi: 10.1073/pnas.2136623100. [DOI] [PMC free article] [PubMed] [Google Scholar]
- 15.Gillespie B, Vu DM, Shah PS, Marshall SA, Dyer RB, Mayo SL, Plaxco KW. NMR and temperature-jump measurements of de novo designed proteins demonstrate rapid folding in the absence of explicit selection for kinetics. J Mol Biol. 2003;330:813–819. doi: 10.1016/s0022-2836(03)00616-8. [DOI] [PubMed] [Google Scholar]
- 16.Nauli S, Kuhlman B, Baker D. Computer-based redesign of a protein folding pathway. Nat Struct Biol. 2001;8:602–605. doi: 10.1038/89638. [DOI] [PubMed] [Google Scholar]
- 17.Pei J, Dokholyan NV, Shakhnovich EI, Grishin NV. Using protein design for homology detection and active site searches. Proc Natl Acad Sci USA. 2003;100:11361–11366. doi: 10.1073/pnas.2034878100. [DOI] [PMC free article] [PubMed] [Google Scholar]
- 18.Larson SM, Garg A, Desjarlais JR, Pande VS. Increased detection of structural templates using alignments of designed sequences. Proteins. 2003;51:390–396. doi: 10.1002/prot.10346. [DOI] [PubMed] [Google Scholar]
- 19.am Busch MS, Mignon D, Simonson T. Computational protein design as a tool for fold recognition. Proteins. 2009;77:139–158. doi: 10.1002/prot.22426. [DOI] [PubMed] [Google Scholar]
- 20.Zhou H, Zhou Y. Fold recognition by combining sequence profiles derived from evolution and from depth-dependent structural alignment of fragments. Proteins. 2005;58:321–328. doi: 10.1002/prot.20308. [DOI] [PMC free article] [PubMed] [Google Scholar]
- 21.Cheng G, Qian B, Samudrala R, Baker D. Improvement in protein functional site prediction by distinguishing structural and functional constraints on protein family evolution using computational design. Nucleic Acids Res. 2005;33:5861–5867. doi: 10.1093/nar/gki894. [DOI] [PMC free article] [PubMed] [Google Scholar]
- 22.Kuhlman B, O'Neill JW, Kim DE, Zhang KY, Baker D. Conversion of monomeric protein L to an obligate dimer by computational protein design. Proc Natl Acad Sci USA. 2001;98:10687–10691. doi: 10.1073/pnas.181354398. [DOI] [PMC free article] [PubMed] [Google Scholar]
- 23.Reina J, Lacroix E, Hobson SD, Fernandez-Ballester G, Rybin V, Schwab MS, Serrano L, Gonzalez C. Computer-aided design of a PDZ domain to recognize new target sequences. Nat Struct Biol. 2002;9:621–627. doi: 10.1038/nsb815. [DOI] [PubMed] [Google Scholar]
- 24.Shifman JM, Mayo SL. Modulating calmodulin binding specificity through computational protein design. J Mol Biol. 2002;323:417–423. doi: 10.1016/s0022-2836(02)00881-1. [DOI] [PubMed] [Google Scholar]
- 25.Looger LL, Dwyer MA, Smith JJ, Hellinga HW. Computational design of receptor and sensor proteins with novel functions. Nature. 2003;423:185–190. doi: 10.1038/nature01556. [DOI] [PubMed] [Google Scholar]
- 26.Ashworth J, Havranek JJ, Duarte CM, Sussman D, Monnat RJ, Jr, Stoddard BL, Baker D. Computational redesign of endonuclease DNA binding and cleavage specificity. Nature. 2006;441:656–659. doi: 10.1038/nature04818. [DOI] [PMC free article] [PubMed] [Google Scholar]
- 27.Yosef E, Politi R, Choi MH, Shifman JM. Computational design of calmodulin mutants with up to 900-fold increase in binding specificity. J Mol Biol. 2009;385:1470–1480. doi: 10.1016/j.jmb.2008.09.053. [DOI] [PubMed] [Google Scholar]
- 28.Grigoryan G, Reinke AW, Keating AE. Design of protein-interaction specificity gives selective bZIP-binding peptides. Nature. 2009;458:859–864. doi: 10.1038/nature07885. [DOI] [PMC free article] [PubMed] [Google Scholar]
- 29.Pinto AL, Hellinga HW, Caradonna JP. Construction of a catalytically active iron superoxide dismutase by rational protein design. Proc Natl Acad Sci USA. 1997;94:5562–5567. doi: 10.1073/pnas.94.11.5562. [DOI] [PMC free article] [PubMed] [Google Scholar]
- 30.Bolon DN, Voigt CA, Mayo SL. De novo design of biocatalysts. Curr Opin Chem Biol. 2002;6:125–129. doi: 10.1016/s1367-5931(02)00303-4. [DOI] [PubMed] [Google Scholar]
- 31.Dwyer MA, Looger LL, Hellinga HW. Computational design of a biologically active enzyme. Science. 2004;304:1967–1971. doi: 10.1126/science.1098432. [DOI] [PubMed] [Google Scholar]
- 32.Lassila JK, Keeffe JR, Oelschlaeger P, Mayo SL. Computationally designed variants of Escherichia coli chorismate mutase show altered catalytic activity. Protein Eng Des Sel. 2005;18:161–163. doi: 10.1093/protein/gzi015. [DOI] [PubMed] [Google Scholar]
- 33.Jiang L, Althoff EA, Clemente FR, Doyle L, Rothlisberger D, Zanghellini A, Gallaher JL, Betker JL, Tanaka F, Barbas CF, III, Hilvert D, Houk KN, Stoddard BL, Baker D. De novo computational design of retro-aldol enzymes. Science. 2008;319:1387–1391. doi: 10.1126/science.1152692. [DOI] [PMC free article] [PubMed] [Google Scholar]
- 34.Ambroggio XI, Kuhlman B. Computational design of a single amino acid sequence that can switch between two distinct protein folds. J Am Chem Soc. 2006;128:1154–1161. doi: 10.1021/ja054718w. [DOI] [PubMed] [Google Scholar]
- 35.Ambroggio XI, Kuhlman B. Design of protein conformational switches. Curr Opin Struct Biol. 2006;16:525–530. doi: 10.1016/j.sbi.2006.05.014. [DOI] [PubMed] [Google Scholar]
- 36.Suarez M, Jaramillo A. Challenges in the computational design of proteins. J R Soc Interface. 2009;6(Suppl 4):S477–S491. doi: 10.1098/rsif.2008.0508.focus. [DOI] [PMC free article] [PubMed] [Google Scholar]
- 37.Lippow SM, Tidor B. Progress in computational protein design. Curr Opin Biotechnol. 2007;18:305–311. doi: 10.1016/j.copbio.2007.04.009. [DOI] [PMC free article] [PubMed] [Google Scholar]
- 38.Dantas G, Kuhlman B, Callender D, Wong M, Baker D. A large scale test of computational protein design: folding and stability of nine completely redesigned globular proteins. J Mol Biol. 2003;332:449–460. doi: 10.1016/s0022-2836(03)00888-x. [DOI] [PubMed] [Google Scholar]
- 39.Schreier B, Stumpp C, Wiesner S, Hocker B. Computational design of ligand binding is not a solved problem. Proc Natl Acad Sci USA. 2009;106:18491–18496. doi: 10.1073/pnas.0907950106. [DOI] [PMC free article] [PubMed] [Google Scholar]
- 40.Kuhlman B, Baker D. Native protein sequences are close to optimal for their structures. Proc Natl Acad Sci USA. 2000;97:10383–10388. doi: 10.1073/pnas.97.19.10383. [DOI] [PMC free article] [PubMed] [Google Scholar]
- 41.Liu Y, Kuhlman B. RosettaDesign server for protein design. Nucleic Acids Res. 2006;34(Web Server issue):W235–W238. doi: 10.1093/nar/gkl163. [DOI] [PMC free article] [PubMed] [Google Scholar]
- 42.Hu X, Wang H, Ke H, Kuhlman B. Computer-based redesign of a beta sandwich protein suggests that extensive negative design is not required for de novo beta sheet design. Structure. 2008;16:1799–1805. doi: 10.1016/j.str.2008.09.013. [DOI] [PMC free article] [PubMed] [Google Scholar]
- 43.Pokala N, Handel TM. Energy functions for protein design: adjustment with protein-protein complex affinities, models for the unfolded state, and negative design of solubility and specificity. J Mol Biol. 2005;347:203–227. doi: 10.1016/j.jmb.2004.12.019. [DOI] [PubMed] [Google Scholar]
- 44.Liang S, Grishin NV. Effective scoring function for protein sequence design. Proteins. 2004;54:271–281. doi: 10.1002/prot.10560. [DOI] [PubMed] [Google Scholar]
- 45.Rost B. Twilight zone of protein sequence alignments. Protein Eng. 1999;12:85–94. doi: 10.1093/protein/12.2.85. [DOI] [PubMed] [Google Scholar]
- 46.Pearson WR, Lipman DJ. Improved tools for biological sequence comparison. Proc Natl Acad Sci USA. 1988;85:2444–2448. doi: 10.1073/pnas.85.8.2444. [DOI] [PMC free article] [PubMed] [Google Scholar]
- 47.Zhang Y, Skolnick J. TM-align: a protein structure alignment algorithm based on the TM-score. Nucleic Acids Res. 2005;33:2302–2309. doi: 10.1093/nar/gki524. [DOI] [PMC free article] [PubMed] [Google Scholar]
- 48.Wang GL, Dunbrack RL. PISCES: a protein sequence culling server. Bioinformatics. 2003;19:1589–1591. doi: 10.1093/bioinformatics/btg224. [DOI] [PubMed] [Google Scholar]
- 49.Kosloff M, Kolodny R. Sequence-similar, structure-dissimilar protein pairs in the PDB. Proteins. 2008;71:891–902. doi: 10.1002/prot.21770. [DOI] [PMC free article] [PubMed] [Google Scholar]
- 50.Boas FE, Harbury PB. Potential energy functions for protein design. Curr Opin Struct Biol. 2007;17:199–204. doi: 10.1016/j.sbi.2007.03.006. [DOI] [PubMed] [Google Scholar]
- 51.Lazaridis T, Karplus M. Effective energy function for proteins in solution. Proteins. 1999;35:133–152. doi: 10.1002/(sici)1097-0134(19990501)35:2<133::aid-prot1>3.0.co;2-n. [DOI] [PubMed] [Google Scholar]
- 52.Pokala N, Handel TM. Energy functions for protein design. I. Efficient and accurate continuum electrostatics and solvation. Protein Sci. 2004;13:925–936. doi: 10.1110/ps.03486104. [DOI] [PMC free article] [PubMed] [Google Scholar]
- 53.Vizcarra CL, Mayo SL. Electrostatics in computational protein design. Curr Opin Chem Biol. 2005;9:622–626. doi: 10.1016/j.cbpa.2005.10.014. [DOI] [PubMed] [Google Scholar]
- 54.Kortemme T, Morozov AV, Baker D. An orientation-dependent hydrogen bonding potential improves prediction of specificity and structure for proteins and protein-protein complexes. J Mol Biol. 2003;326:1239–1259. doi: 10.1016/s0022-2836(03)00021-4. [DOI] [PubMed] [Google Scholar]
- 55.Russ WP, Ranganathan R. Knowledge-based potential functions in protein design. Curr Opin Struct Biol. 2002;12:447–452. doi: 10.1016/s0959-440x(02)00346-9. [DOI] [PubMed] [Google Scholar]
- 56.Lehmann M, Kostrewa D, Wyss M, Brugger R, D'Arcy A, Pasamontes L, van Loon AP. From DNA sequence to improved functionality: using protein sequence comparisons to rapidly design a thermostable consensus phytase. Protein Eng. 2000;13:49–57. doi: 10.1093/protein/13.1.49. [DOI] [PubMed] [Google Scholar]
- 57.Bolon DN, Mayo SL. Enzyme-like proteins by computational design. Proc Natl Acad Sci USA. 2001;98:14274–14279. doi: 10.1073/pnas.251555398. [DOI] [PMC free article] [PubMed] [Google Scholar]
- 58.Rath A, Davidson AR. The design of a hyperstable mutant of the Abp1p SH3 domain by sequence alignment analysis. Protein Sci. 2000;9:2457–2469. doi: 10.1110/ps.9.12.2457. [DOI] [PMC free article] [PubMed] [Google Scholar]
- 59.Taylor SV, Walter KU, Kast P, Hilvert D. Searching sequence space for protein catalysts. Proc Natl Acad Sci USA. 2001;98:10596–10601. doi: 10.1073/pnas.191159298. [DOI] [PMC free article] [PubMed] [Google Scholar]
- 60.Voigt CA, Martinez C, Wang ZG, Mayo SL, Arnold FH. Protein building blocks preserved by recombination. Nat Struct Biol. 2002;9:553–558. doi: 10.1038/nsb805. [DOI] [PubMed] [Google Scholar]
- 61.Larson SM, Di Nardo AA, Davidson AR. Analysis of covariation in an SH3 domain sequence alignment: applications in tertiary contact prediction and the design of compensating hydrophobic core substitutions. J Mol Biol. 2000;303:433–446. doi: 10.1006/jmbi.2000.4146. [DOI] [PubMed] [Google Scholar]
- 62.Dor O, Zhou Y. Achieving 80% ten-fold cross-validated accuracy for secondary structure prediction by large-scale training. Proteins. 2007;66:838–845. doi: 10.1002/prot.21298. [DOI] [PubMed] [Google Scholar]
- 63.Rost B. Review: protein secondary structure prediction continues to rise. J Struct Biol. 2001;134:204–218. doi: 10.1006/jsbi.2001.4336. [DOI] [PubMed] [Google Scholar]
- 64.Faraggi E, Yang Y, Zhang S, Zhou Y. Predicting continuous local structure and the effect of its substitution for secondary structure in fragment-free protein structure prediction. Structure. 2009;17:1515–1527. doi: 10.1016/j.str.2009.09.006. [DOI] [PMC free article] [PubMed] [Google Scholar]
- 65.Tsai HH, Tsai CJ, Ma B, Nussinov R. In silico protein design by combinatorial assembly of protein building blocks. Protein Sci. 2004;13:2753–2765. doi: 10.1110/ps.04774004. [DOI] [PMC free article] [PubMed] [Google Scholar]
- 66.Li Q, Zhou C, Liu H. Fragment-based local statistical potentials derived by combining an alphabet of protein local structures with secondary structures and solvent accessibilities. Proteins. 2009;74:820–836. doi: 10.1002/prot.22191. [DOI] [PubMed] [Google Scholar]
- 67.Altschul SF, Madden TL, Schaffer AA, Zhang J, Zhang Z, Miller W, Lipman DJ. Gapped BLAST and PSI-BLAST: a new generation of protein database search programs. Nucleic Acids Res. 1997;25:3389–3402. doi: 10.1093/nar/25.17.3389. [DOI] [PMC free article] [PubMed] [Google Scholar]
- 68.Wang J, Wolf RM, Caldwell JW, Kollman PA, Case DA. Development and testing of a general amber force field. J Comput Chem. 2004;25:1157–1174. doi: 10.1002/jcc.20035. [DOI] [PubMed] [Google Scholar]
- 69.Chakravarty S, Varadarajan R. Residue depth: a novel parameter for the analysis of protein structure and stability. Structure. 1999;7:723–732. doi: 10.1016/s0969-2126(99)80097-5. [DOI] [PubMed] [Google Scholar]
- 70.Baeten L, Reumers J, Tur V, Stricher F, Lenaerts T, Serrano L, Rousseau F, Schymkowitz J. Reconstruction of protein backbones from the BriX collection of canonical protein fragments. PLoS Comput Biol. 2008;4:e1000083. doi: 10.1371/journal.pcbi.1000083. [DOI] [PMC free article] [PubMed] [Google Scholar]
- 71.Frishman D, Argos P. Knowledge-based protein secondary structure assignment. Proteins. 1995;23:566–579. doi: 10.1002/prot.340230412. [DOI] [PubMed] [Google Scholar]
- 72.Wootton JC, Federhen S. Statistics of local complexity in amino-acid-sequences and sequence databases. Comput Chem. 1993;17:149–163. [Google Scholar]
- 73.Romero P, Obradovic Z, Li X, Garner EC, Brown CJ, Dunker AK. Sequence complexity of disordered protein. Proteins. 2001;42:38–48. doi: 10.1002/1097-0134(20010101)42:1<38::aid-prot50>3.0.co;2-3. [DOI] [PubMed] [Google Scholar]
- 74.Bordner AJ, Abagyan RA. Large-scale prediction of protein geometry and stability changes for arbitrary single point mutations. Proteins. 2004;57:400–413. doi: 10.1002/prot.20185. [DOI] [PubMed] [Google Scholar]
- 75.Karchin R, Cline M, Karplus K. Evaluation of local structure alphabets based on residue burial. Proteins. 2004;55:508–518. doi: 10.1002/prot.20008. [DOI] [PubMed] [Google Scholar]
- 76.Hamelryck T. An amino acid has two sides: a new 2D measure provides a different view of solvent exposure. Proteins. 2005;59:38–48. doi: 10.1002/prot.20379. [DOI] [PubMed] [Google Scholar]
- 77.Zhang C, Liu S, Zhou H, Zhou Y. The dependence of all-atom statistical potentials on structural training database. Biophys J. 2004;86:3349–3358. doi: 10.1529/biophysj.103.035998. [DOI] [PMC free article] [PubMed] [Google Scholar]
- 78.Chiti F, Stefani M, Taddei N, Ramponi G, Dobson CM. Rationalization of the effects of mutations on peptide and protein aggregation rates. Nature. 2003;424:805–808. doi: 10.1038/nature01891. [DOI] [PubMed] [Google Scholar]
- 79.Mosavi LK, Peng ZY. Structure-based substitutions for increased solubility of a designed protein. Protein Eng. 2003;16:739–745. doi: 10.1093/protein/gzg098. [DOI] [PubMed] [Google Scholar]
- 80.Lumb KJ, Kim PS. A buried polar interaction imparts structural uniqueness in a designed heterodimeric coiled coil. Biochemistry. 1995;34:8642–8648. doi: 10.1021/bi00027a013. [DOI] [PubMed] [Google Scholar]
- 81.Bolon DN, Marcus JS, Ross SA, Mayo SL. Prudent modeling of core polar residues in computational protein design. J Mol Biol. 2003;329:611–622. doi: 10.1016/s0022-2836(03)00423-6. [DOI] [PubMed] [Google Scholar]
- 82.Sindelar CV, Hendsch ZS, Tidor B. Effects of salt bridges on protein structure and design. Protein Sci. 1998;7:1898–1914. doi: 10.1002/pro.5560070906. [DOI] [PMC free article] [PubMed] [Google Scholar]
- 83.Mandell DJ, Kortemme T. Backbone flexibility in computational protein design. Curr Opin Biotechnol. 2009;20:420–428. doi: 10.1016/j.copbio.2009.07.006. [DOI] [PubMed] [Google Scholar]
- 84.Saunders CT, Baker D. Recapitulation of protein family divergence using flexible backbone protein design. J Mol Biol. 2005;346:631–644. doi: 10.1016/j.jmb.2004.11.062. [DOI] [PubMed] [Google Scholar]