Abstract
Ultra-rapid sequencing of DNA strands with nanopores is under intense investigation. The αHL protein nanopore is a leading candidate sensor for this approach. Multiple base-recognition sites have been identified in engineered αHL pores. By using immobilized synthetic oligonucleotides, we show here that additional sequence information can be gained when two recognition sites, rather than one, are employed within a single nanopore.
Keywords: α-hemolysin, DNA sequencing, nanopore, protein engineering, single-nucleotide discrimination
The α-hemolysin (αHL) protein nanopore is under investigation as a potential platform for sequencing DNA molecules. In one proposed means of nanopore sequencing, a DNA strand is electrophoretically driven through the αHL pore[1] and as each base passes a recognition point within the pore, the magnitude of ionic current block is recorded and the base sequence read out.[2] To facilitate the observation of base recognition derived from current block, DNA strands can be immobilized within the αHL pore by using a terminal hairpin or a biotin•streptavidin complex, which improves the resolution of the currents associated with individual nucleotides, because of the prolonged observation time.[3-5] The immobilized strands reduce the open pore current level, IO, to a level IB. In this paper, we quote the residual current IRES as a percentage of the open pore current: IRES = (IB/IO) × 100. By using the biotin•streptavidin approach, we recently demonstrated that the 5 nm-long β barrel of the αHL nanopore contains three recognition sites, R1, R2 and R3, each capable of recognizing single nucleotides within DNA strands (Figure 1).[4] R1 is located near the internal constriction in the lumen of the pore and recognizes bases at positions ~8 to 12 (bases are numbered from the 3′ end of synthetic oligonucleotide probes, Figure S1). R2 is located near the middle of the β barrel and discriminates bases at positions ~12 to 16. R3 recognizes bases at positions ~17 to 20 and is located near the trans entrance of the barrel.
Figure 1. The αHL nanopore.
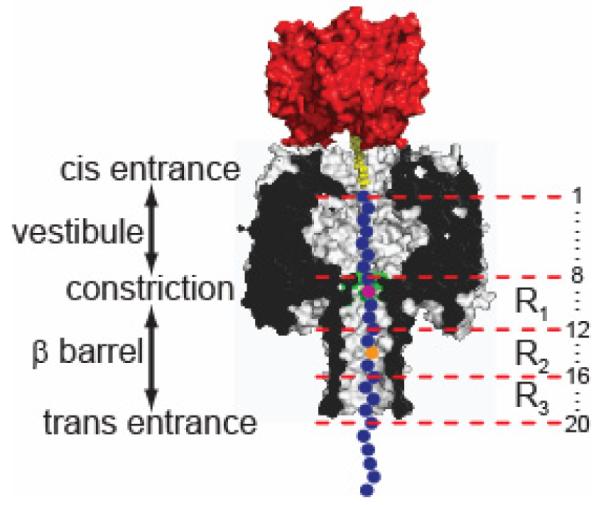
Schematic representation of an oligonucleotide (blue circles) immobilized inside an αHL pore (grey, cross-section) by the use of a 3′ biotin (yellow)•streptavidin (red) linkage (Figure S1). The bases are numbered (right) relative to the 3′ biotinylated end of the DNA. The αHL pore can be divided into two halves, each approximately 5 nm in length: an upper cap domain located between the cis entrance and the constriction, containing a roughly spherical vestibule, and a fourteen-stranded, transmembrane, antiparallel β barrel, located between the constriction and the trans entrance. The constriction of 1.4 nm diameter is formed by the Glu-111, Met-113 and Lys-147 (all three shaded green) side chains contributed by all seven subunits. R1, R2 and R3 represent the three base recognition sites in the αHL nanopore within the β barrel domain of the pore.
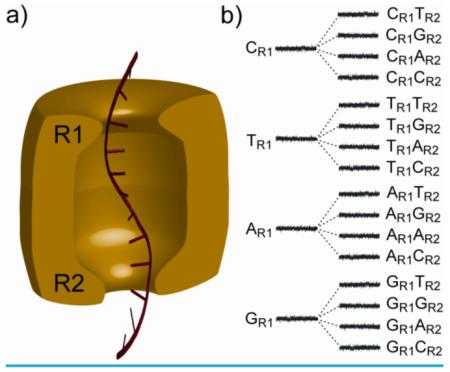
We surmised that it might be advantageous to use more than one of the recognition points for DNA sequence determination. Consider a nanopore with two reading heads, R1 and R2, each capable of recognizing all four bases (Figure 2). If the first site, R1 produces a large dispersion of current levels for the four bases and the second site, R2 produces a more modest dispersion, 16 current levels, one for each of the 16 possible base combinations, would be observed as DNA molecules are translocated through the nanopore. Therefore, at any particular moment, the current signal would offer information about two positions in the sequence, rather than just one, providing redundant information; each base is read twice, first at R1 and secondly at R2. This built-in proof-reading mechanism would improve the overall quality of sequencing.
Figure 2. Two heads are better than one.
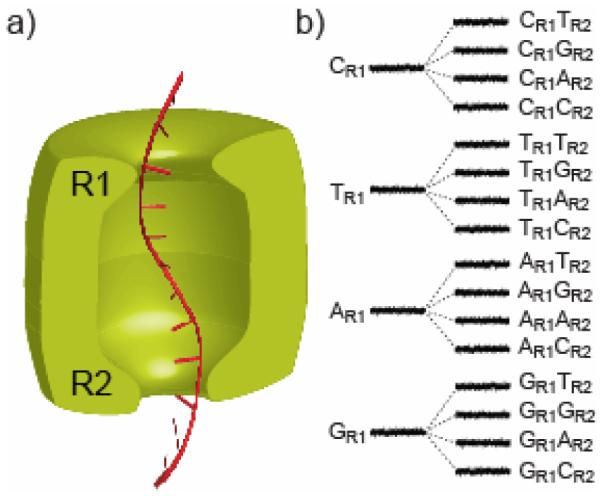
a) A hypothetical nanopore sensor (green) with two reading heads, R1 and R2, which could in principle extract more sequence information from a DNA strand (red) than a device with a single reading head. b) To illustrate the idea, we assume that the four bases of DNA at reading head R1 produce 4 distinct current levels (widely dispersed as shown). Each of the levels is split into 4 additional levels (with a lesser dispersion, for the purpose of illustration) by the second reading head R2, yielding 16 current levels in total and providing redundant information about the DNA sequence.
In the WT αHL pore, R2 is capable of discriminating between each of the four DNA bases (when the bases are placed at position 14, in an otherwise poly(dC) oligonucleotide). With the E111N/K147N mutant (NN), in which the charged residues at the constriction have been removed, a greater current flows through the pore when it is blocked with a DNA•streptavidin complex. This increase in IRES in the NN mutant leads to a greater dispersion of the current levels arising from different DNAs, and thereby improves base discrimination at R2 and R3, compared to WT.[4] However, in NN, the ability of R1 to recognize bases is weakened, presumably due to a reduced interaction between the pore and the DNA at the constriction, where amino acid residues 111 and 147 are located. Therefore, to further tune recognition at R1, substitutions at position 113, which also forms part of the constriction, were examined. The mutation M113Y was the most effective.
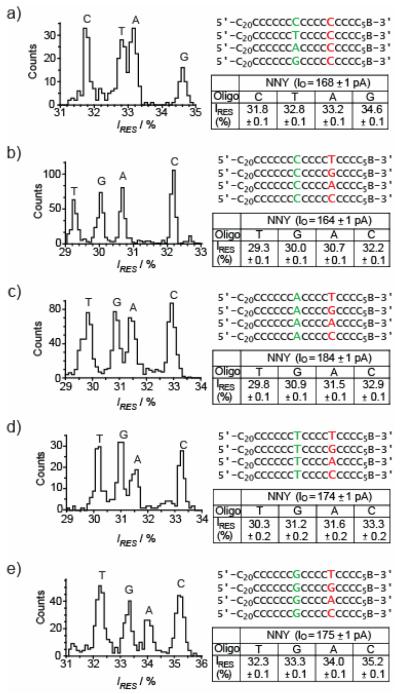
The E111N/K147N/M113Y (NNY) and NN pores displayed similar discrimination of bases by R2; bases at position 14, within poly(dC), are separated in the same order, namely C, T, A and G, in order of increasing IRES, and with a similar dispersion between C and G: ΔIRESG–C = IRESG − IRESC = +2.8 ± 0.1% (n = 3) for NN[4] and +2.9 ± 0.1% (n = 3) for NNY (Figure 3a). It should be noted that the ΔIRES values, which were readily determined from event histograms, showed little experimental variation, while the residual current values (IRES) showed variation that exceeded ΔIRES. NNY displayed vastly improved base recognition properties at R1 compared to the WT and NN pores. In the NN mutant, R1 is not capable of discriminating all four bases (when they are located at position 9 within poly(dC)),[4] and the magnitude of the current differences between the bases is quite small; the difference between the most widely dispersed bases, A and C (ΔIRESA–C) is only −0.4 ± 0.1% (n = 5, A giving a lower residual current than C). However, the NNY mutant is capable of discriminating between T, G, A and C, in order of increasing IRES (Figure 3b), and the dispersion of current levels is much larger, ΔIREST–C = −2.8 ± 0.2% (n = 5). It is remarkable that the single M113Y mutation is capable of turning a weakly discriminating R1 site in the NN mutant into a strong site in the NNY mutant.[4] Possibly, the tyrosines at position 113 improve discrimination at R1 through aromatic stacking or hydrogen bonding interactions with the immobilized bases.[6-8] But, we are unsure of what properties of the bases cause the dispersion of the current levels, although it is clear that size is not the only factor, as a T at R1 produces a greater current block than the larger purine bases.
Figure 3. Four-base discrimination at R1 and R2, by an engineered αHL nanopore.
Histograms of residual current levels for E111N/K147N/M113Y (NNY) pores are shown (left), for a set of 4 oligonucleotides (right). B represents the 3′ biotin-TEG extension (Figure S1). Each experiment was conducted at least three times, and the results displayed in the figure are from a single experiment. When the oligonucleotides are driven into the αHL pore the substituted nucleotides are positioned at R1 (red) or R2 (green). Gaussian fits were performed for each peak in the histograms and the mean value of the residual current (IRES) for each oligonucleotide is displayed in the tables to the right of the histograms and in Tables S1-5 for panels a-e respectively.
We determined whether the NNY mutant, which has two strong recognition points (R1 and R2), could behave like the two-head sensor envisaged in Figure 2 by using a library containing 16 oligonucleotides comprising poly(dC) with substitutions at position 9 (to probe R1) and position 14 (to probe R2). The sequence of a given oligonucleotide is designated: X9X14, where X represents a defined base; G, A, T or C, and 9 and 14 gives the position of the base (relative to the biotin tag).
First, we tested whether the identity of the base at position 14 (R2) affected base recognition at position 9 (R1). NNY pores were separately probed with 4 sets of 4 oligonucleotides: N9C14, N9A14, N9T14 and N9G14 (where N = G, A, T or C, Figure 3b-e, respectively). Despite the variation of the base at position 14, the distribution of the current levels for each set of 4 oligonucleotides, is remarkably similar (Table S6). This suggests that recognition at R1 (i.e. the order and dispersion of the peaks in the histograms) is only weakly influenced by the base occupying R2.
In the postulated two-head sensor, recognition point R1 produces a large current dispersion, while that produced by R2 is more modest (Figure 2b). However, in the case tested, the NNY pore, R1 and R2 produce dispersions of similar magnitude (ΔIREST–C = −2.8 ± 0.2% and ΔIRESG–C +2.9 ± 0.1%, respectively, Figure 3ab). Further, the slight dependence of recognition at R1 on the base occupying R2 (Table S6, compare the columns for rows two through five) was not considered in the proposed scheme (Figure 2). Assuming that the effects of each base at each recognition point on the change in current level are additive, and by using the directly determined ΔIRES values in Table S6, we can predict the distribution of ΔIRES values for each of the sixteen sequences N9N14, relative to poly(dC), which is set as zero (Figure 4 and Table S7). For example, consider the sequence T9A14. We can predict the unknown ΔIREST9A14–C9C14 (these two sequences were not compared directly, Figure 3) by using experimentally determined ΔIRES values (Table S6): ΔIREST9A14–C9A14 = −3.2 ± 0.1% and ΔIRESC9A14–C9C14 = +1.4 ± 0.0%. By adding these values together, we find ΔIREST9A14–C9C14 = −1.8 ± 0.1%. The use of IRES rather than experimental ΔIRES values leads to unacceptable errors in predicted ΔIRES values.
Figure 4. Predicted and experimental residual current level differences (ΔIRES) observed when NNY pores are interrogated with oligonucleotides which simultaneously probe R1 and R2.
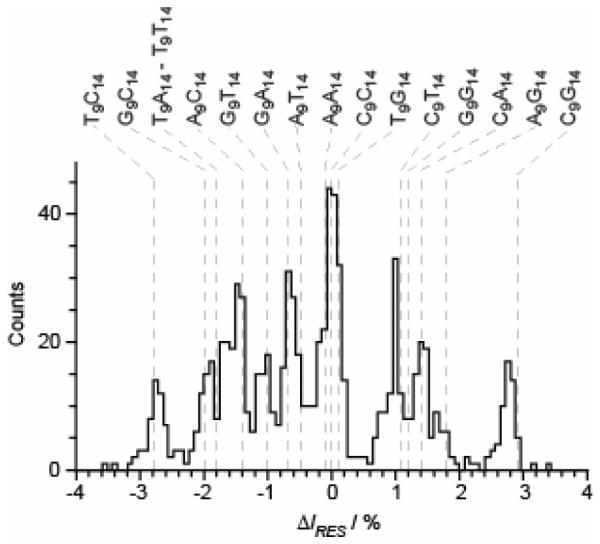
E111N/K147N/M113Y (NNY) pores were probed with 16 oligonucleotides, with the sequence 5′–CCCCCCCCCCCCCCCCCCCCCCCCCCNCCCCNCCCCCCCCB–3′, where N is A, T, G or C (N9N14, Table S8). B represents the 3′ biotin-TEG extension (Figure S1). A histogram displaying the residual current level differences (Table S9) for blockades by the various oligonucleotides, relative to the mean blockade produced by poly(dC) is shown. The current level for poly(dC) is set as zero. Blockades which have a residual current level lower than poly(dC) have negative ΔIRES values and blockades which have higher residual current levels than poly(dC) have positive ΔIRES values. The grey dashed lines show the predicted residual current levels, based on the ΔIRES data displayed in Table S6 (see the text). The predicted and measured ΔIRES values are displayed in Table S7.
All remaining ΔIRES values were predicted in the same way (Table S7) and are shown in Figure 4 as dashed grey lines. Only two sequences (T9T14 and T9A14) were predicted to overlap directly. However, given the present resolution of our electrical recordings, three additional sequences were expected to remain unresolved; for example, A9A14 was predicted to have ΔIRESA9A14–C9C14 = −0.1 ± 0.1% and it was therefore likely to overlap with C9C14. Indeed, when all 16 sequences (N9N14, Table S8) were used simultaneously to probe NNY pores, the histograms of the residual current levels consistently contained 11 resolvable sequence-specific peaks (Figure 4). The predicted ΔIRES values match well with the measured ΔIRES values, with the observed mean ΔIRES values within the error of the predicted values (Table S7). We surmise that current flow is restricted at R1 and R2, and that the effects of the two recognition points are approximately additive, when ΔIRES values are small, like the effect of two small resistances in series in an electrical circuit.
Although, the 16 DNA sequences did not produce 16 discrete current levels, we were able to resolve 11. A perfect 16-level system of two reading heads would read each position in a sequence twice, while a perfect single reading head would read the sequence just once. Therefore, although the 11-level system is imperfect, it does yield additional, redundant information about each base, which would provide more secure base identification than a single reading head. It might be thought that a third reading head would improve matters. However, in this case, the number of possible base combinations would increase from 16 to 64. Even if these levels could be dispersed across the entire current spectrum of the αHL pore (from almost open to almost closed), it is unlikely that the 64 levels could be separated owing to the electrical noise in the system, even under the low bandwidth conditions used here. Under the high applied potentials required for threading, DNA translocates very quickly through the αHL pore (at a few μs per base)[1, 9] and the situation would be exacerbated by the need for high data acquisition rates and the consequential increase in noise. Even enzyme-mediated threading at one-thousandth of the rate for free DNA will present difficulties.[10, 11] Therefore, it seems likely that a two reading-head sensor is optimal, and our next step will be to remove the superfluous reading head R3.
Here, we have considered the case where each of the reading heads recognizes just a single base at a time (Figure 2), and we have slanted the experimental conditions in that regard by using a uniform poly(dC) background. However, in reality it is likely that the nearest neighbors of a base in contact with a reading head will influence the current output. Therefore, further fine tuning of the recognition sites will be required to “sharpen” the sites and advance as close as possible to single-base recognition.
Supplementary Material
Acknowledgments
This work was supported by grants from the NIH, the MRC and the European Commission’s seventh Framework Programme (FP7) READNA Consortium. D.S. was supported by a BBSRC Doctoral Training Grant.
Footnotes
Conflict of interest statement: Hagan Bayley is the Founder, a Director and a share-holder of Oxford Nanopore Technologies, a company engaged in the development of nanopore sequencing technology. This article was not supported by Oxford Nanopore Technologies.
Experimental section
Full details of experimental procedures can be found in the Supporting Information.
REFERENCES
- [1].Kasianowicz JJ, Brandin E, Branton D, Deamer DW. Proc.Natl.Acad.Sci.USA. 1996;93:13770. doi: 10.1073/pnas.93.24.13770. [DOI] [PMC free article] [PubMed] [Google Scholar]
- [2].Branton D, Deamer DW, Marziali A, Bayley H, Benner SA, Butler T, Di Ventra M, Garaj S, Hibbs A, Huang X, Jovanovich SB, Krstic PS, Lindsay S, Ling XS, Mastrangelo CH, Meller A, Oliver JS, Pershin YV, Ramsey JM, Riehn R, Soni GV, Tabard-Cossa V, Wanunu M, Wiggin M, Schloss JA. Nature Biotechnology. 2008;26:1146. doi: 10.1038/nbt.1495. [DOI] [PMC free article] [PubMed] [Google Scholar]
- [3].Ashkenasy N, Sánchez-Quesada J, Bayley H, Ghadiri MR. Angew.Chem.Int.Ed.Engl. 2005;44:1401. doi: 10.1002/anie.200462114. [DOI] [PMC free article] [PubMed] [Google Scholar]
- [4].Stoddart D, Heron A, Mikhailova E, Maglia G, Bayley H. Proc. Natl. Acad. Sci. USA. 2009;106:7702. doi: 10.1073/pnas.0901054106. [DOI] [PMC free article] [PubMed] [Google Scholar]
- [5].Purnell RF, Schmidt JJ. ACS Nano. 2009 doi: 10.1021/nn900441x. [DOI] [PubMed] [Google Scholar]
- [6].Hu G, Gershon PD, Hodel AE, Quiocho FA. Proc.Natl.Acad.Sci.USA. 1999;96:7149. doi: 10.1073/pnas.96.13.7149. [DOI] [PMC free article] [PubMed] [Google Scholar]
- [7].Lei M, Podell ER, Cech TR. Nat Struct Mol Biol. 2004;11:1223. doi: 10.1038/nsmb867. [DOI] [PubMed] [Google Scholar]
- [8].Schroeder LA, Gries TJ, Saecker RM, Record MT, Jr., Harris ME, DeHaseth PL. J Mol Biol. 2009;385:339. doi: 10.1016/j.jmb.2008.10.023. [DOI] [PMC free article] [PubMed] [Google Scholar]
- [9].Meller A, Nivon L, Brandin E, Golovchenko J, Branton D. Proc.Natl.Acad.Sci.USA. 2000;97:1079. doi: 10.1073/pnas.97.3.1079. [DOI] [PMC free article] [PubMed] [Google Scholar]
- [10].Cockroft SL, Chu J, Amorin M, Ghadiri MR. J Am Chem Soc. 2008;130:818. doi: 10.1021/ja077082c. [DOI] [PMC free article] [PubMed] [Google Scholar]
- [11].Wilson NA, Abu-Shumays R, Gyarfas B, Wang H, Lieberman KR, Akeson M, Dunbar WB. ACS Nano. 2009;3:995. doi: 10.1021/nn9000897. [DOI] [PMC free article] [PubMed] [Google Scholar]
Associated Data
This section collects any data citations, data availability statements, or supplementary materials included in this article.


