

Abstract
Submicron scale domains of membrane-anchored receptors play an important role in cell signaling. Central questions concern the stability of these microdomains, and the mechanisms leading to the domain formation. In immune-cell adhesion zones, microdomains of short receptor-ligand complexes form next to domains of significantly longer receptor-ligand complexes. The length mismatch between the receptor-ligand complexes leads to membrane deformations and has been suggested as a possible cause of the domain formation. The domain formation is a nucleation and growth process that depends on the line tension and free energy of the domains. Using a combination of analytical calculations and Monte Carlo simulations, we derive here general expressions for the line tension between domains of long and short receptor-ligand complexes and for the adhesion free energy of the domains. We argue that the length mismatch of receptor-ligand complexes alone is sufficient to drive the domain formation, and obtain submicron-scale minimum sizes for stable domains that are consistent with the domain sizes observed during immune-cell adhesion.
Introduction
In the past years, microdomains of proteins in cell membranes have emerged as a central aspect of cell signaling [1]–[4]. The activation of T cells, for example, is initiated by submicron-scale domains of T cell receptors (TCRs) [1], [5]–[7]. The TCRs recognize foreign peptides presented by MHC ligands (MHCpeptide) in an apposing cell membrane. During T-cell adhesion, domains of TCR-MHCpeptide form within seconds in the adhesion zone [8], [9].
Several mechanisms have been proposed for the formation of TCR-MHCpeptide domains during T-cell adhesion. These mechanisms are based on the actin cytoskeleton [10], [11], enhanced cis-interactions between TCRs due to conformational changes after binding [1], pre-clustering of TCRs prior to adhesion [12], [13], and the length difference between the TCR-MHCpeptide complexes and other receptor-ligand complexes and proteins in the T-cell adhesion zone [14]–[22]. We argue here that the length differences between TCR-MHCpeptide complexes and other complexes alone can account for the formation of clusters and domains during T-cell adhesion. The TCR-MHCpeptide complex has a length of about 13 nm [23]–[25], while complexes between the integrin LFA-1 and its ligand ICAM-1 have a length around 40 nm [10]. This length mismatch induces a membrane-mediated repulsion between different complexes in the T-cell contact zone because the membranes have to bend to compensate the mismatch, which costs bending energy. Beyond certain threshold or critical concentrations of the receptors and ligands, the membrane-mediated repulsion leads to a segregation of TCR-MHCpeptide and integrin complexes into domains enriched in these complexes.
In previous work, we have derived general expressions for the critical receptor and ligand concentrations required for domain formation. These general expressions depend on the length mismatch between the receptor-ligand complexes and on the bending rigidity of the membranes [26], [27]. We have also found that large, repulsive glycoproteins and additional complexes with a length close to the TCR-MHCpeptide complex, such as the CD2–CD48 complex [25], increase the tendency for domain formation [26].
In this article, we determine the free energy and stability of clusters and domains of long and short receptor-ligand complexes. Our main results are general expressions for the line tension and adhesion free energy of the domains in terms of the concentrations and affinities of the receptors and ligands as well as the length mismatch of the receptor-ligand complexes. These general expressions fully include the effects of membrane shape fluctuations and the translational entropy of the receptors and ligands, and depend only on experimentally accessible quantities. Our expressions lead to estimates for the minimal size of stable TCR-MHCpeptide microdomains that are consistent with the submicron-scale sizes observed during T-cell adhesion.
Methods
Membrane conformations, interactions and elasticity
To describe the conformations of the two apposing membranes in a cell adhesion zone, we divide these membranes into small patches. Each patch can contain a single receptor or ligand molecule [28]–[30]. A receptor binds to a ligand molecule if the ligand is located in the membrane patch apposing the receptor, and if the separation  of the two membrane patches is close to the length of the receptor-ligand complex. The mobile receptor and ligand molecules diffuse by ‘hopping’ from patch to patch, and the thermal fluctuations of the membranes are reflected in variations of the separation of apposing membrane patches.
The energy of a membrane conformation
| (1) |
is the sum of the elastic energy  of the membranes and the interaction energy
  of the receptors and ligands. For a membrane with two types of receptors
  and
and  that bind to the ligands
  and
and  in the apposing membrane, the interaction energy is [27], [31]
| (2) |
Here, the occupation number  ,
,  , or
, or  indicates whether a receptor
  , a receptor
  , or no receptor is present in patch
  of the cell membrane in the contact zone, while
  ,
,  , or
, or  indicates whether a ligand
  , a ligand
  , or no ligand is present in the apposing membrane patch
  . The Kronecker symbol
  equals
  for
for  and is equal to
  for
for  . The potential
  thus describes the interaction of a receptor
  with a ligand
  , and the potential
  the interaction between
  and
and  . For simplicity,
  and
and  are taken to be square-well potentials
| (3) |
and
| (4) |
with binding energies  and
and  and equilibrium lengths
  of the complexes
  and
and  . We have assumed here that the two complexes have the same binding width
  .
.
The rigidity-dominated elastic energy of the membranes has the form [28], [30]
| (5) |
where  is the local separation of the apposing membrane patches
  . The elastic energy depends on the mean curvature
  of the separation field
  with the discretized Laplacian
  . Here,
  to
to  are the membrane separations at the four nearest-neighbor patches of membrane patch
  on the quadratic array of patches. The linear size
  of the membrane patches is chosen to be around 5 nm to include the whole spectrum of bending deformations of the lipid membranes [32]. The effective bending rigidity of the two membranes with rigidities
  and
and  is
is  . If one of the membranes, e.g. membrane 2, is a planar supported membrane, the effective bending rigidity
  equals the rigidity
  of the apposing membrane since the rigidity
  of the supported membrane is taken to be much larger than
  .
.
Effective adhesion potential of the membranes
The equilibrium proporties of the membranes can be determined from the free energy  where
where  is the partition function. The partition function
  is the integral over all membrane conformations, with each conformation weighted by its Boltzmann factor. In our model, the integration over the distributions
  and
and  of receptors and ligands can be performed exactly [27], which leads to
  with the effective conformational energy
| (6) |
For long and short receptors and ligands with interaction energy (2), the effective potential is a double-well potential (see fig. 1(b)). The two wells of this potential are centered around the lengths  and
and  of the complexes
  and
and  , and the width
  of these wells is equal to the binding width of the two complexes. The depths
  and
and  of the wells depend both on the concentrations and on the binding affinities of the receptors and ligands. The typical concentrations of receptors and ligands in cell adhesion zones are much smaller than the maximal concentration
  in our model. For these small concentrations, we obtain
| (7) |
| (8) |
where  ,
,  ,
,  and
and  are the area concentrations of unbound receptors and ligands, and
  and
and  are the binding constants for receptors and ligands within the appropriate binding ranges [26], [27]. The summation over the degrees of freedom
  and
and  of the receptors and ligands thus ‘maps’ the problem of two membranes interacting via long and short receptor-ligand complexes to the problem of a membrane with effective rigidity
  in an effective double-well potential.
Figure 1. Effective adhesion potential.

(a) Two membranes interacting via long (red) and short (green) receptor-ligand complexes. The length mismatch of the complexes causes membrane deformations, which cost bending energy and lead to a membrane-mediated repulsion between different receptor-ligand complexes. - (b) The attractive interactions between the two types of receptors and ligands lead to an effective double-well adhesion potential  of the membranes. The potential well 1 at small membrane separations
  reflects the interactions of the short receptor-ligand complexes, and the potential well 2 at larger membrane separations the interactions of the long receptor-ligand complexes. The depths
  and
and  of the two potential wells depend both on the concentrations and on the binding energies of the two types of receptors and ligands, see eqs. (7) and (8).
The effective potential can be generalized to cases with more than two receptor-ligand complexes, or with additional repulsive molecules [26]. For T cells adhering to antigen-presenting cells, for example, a third important receptor-ligand complex is the CD2–CD48 complex, which has about the same length as the TCR-MHCpeptide complex. In this case, the well depth  in the effective double-well potential depends on the concentrations and binding constants of TCR and MHCp as well as CD2 and CD48 [26]. In addition, complexes between TCRs and self MHCpeptide molecules, besides foreign MHCpeptides, can contribute to this well depth [26].
The effective potential helps to determine and illustrate the equilibrium behavior. If the two wells of the effective potential are relatively shallow, thermal membrane fluctuations can easily drive membrane segments to cross from one well to the other. If the two wells are deep, the crossing of membrane segments from one well to the other well is impeded by the potential barrier of width  between the wells (see fig. 1). Beyond a critical depth of the potential wells, the potential barrier leads to the formation of large membrane domains that are predominantly bound in well 1 or well 2. Within each domain, the adhesion of the membranes is predominantly mediated either by the receptor-ligand complexes
  or by the complexes
  , which leads to different concentrations
  and
and  of these complexes in the different domains. However, the equilibrium concentrations
  ,
,  ,
,  , and
, and  of unbound receptors and ligands are identical in the different domains since these receptors and ligands are free to diffuse between the domains. Therefore, the effective potential is also identical in the different domains (see eqs. (7) and (8)). In general, the diffusion of individual receptors and ligands is fast compared to the domain formation [20].
We have previously found that the critical potential depth for domain formation is
| (9) |
with the prefactor  determined from Monte Carlo simulations [27]. Domain formation or, in other words, segregation of the complexes
  and
and  can only occur if the effective potential depths
  and
and  exceed the critical potential depth
  . The critical potential depth depends on the temperature
  and the bending rigidity
  as well as on the width
  and separation
  of the two potential wells. In deriving eq. (9), we have neglected direct membrane-membrane contacts, which is reasonable for typical concentrations and lengths of receptor-ligand complexes in cell adhesion zones since the thermal membrane roughness is smaller than the lengths of the receptor-ligand complexes for these concentrations and lengths [27], [33].
In this article, we determine how the adhesion free energy and line tension of the domains depends on the depths as well as on the width  and separation
  of the two wells. The starting point for our calculations and simulations is the effective conformational energy (6) with the double-well potential
  shown in fig. 1(b).
Effective parameters and Monte Carlo simulations
We use a combination of Monte Carlo simulations and scaling arguments to determine the free energy difference and line tension of membrane domains that are bound in the two potential wells of the effective potential  . To reduce the number of parameters, we use the rescaled separation field
  in the simulations. The effective conformational energy (6) then has the form
  where
where  is the effective potential shown in fig. 1(b). The four parameters of the Monte Carlo simulations are the rescaled width and separation
| (10) |
of the potential wells, and the dimensionless well depths
| (11) |
A scaling analysis (see Appendix S1) indicates that there are only three independent parameters if the lateral correlation length of the membranes is much larger than the linear size  of the discrete membrane patches, which is the case if the membranes are only weakly bound in the potential wells. These three parameters are the rescaled well depths
| (12) |
| (13) |
and the ratio
| (14) |
of the separation and width of the potential wells. From eq. (9), we obtain the rescaled critical potential depth
| (15) |
with  , which depends only on the ratio of these two characteristic lengths of the double-well potential.
In the Monte Carlo simulations, we attempt local Monte Carlo moves in which the rescaled separation  of the membrane patch
  is shifted to a new value
  where
where  is a random number between
  and 1. Following the standard Metropolis criterion [34], a local move is always accepted if the change
  in conformational energy is negative, and accepted with the probability
  for
for  . We perform simulations with up to
  attempted local moves per patch
  and membrane sizes up to
  patches. The membrane size is always chosen to be much larger than the lateral correlation length of the membranes, since thermodynamic averages of membrane quantities then do not depend on the finite size of the membranes. Further details of our Monte Carlo simulations are described in ref. [30].
Results
Adhesion free energy of receptor-ligand domains
The free energy of domains of long or short receptor-ligand complexes can be determined from the effective double-well adhesion potential of the membranes (see fig. 1). We consider first a domain of short receptor-ligand complexes, i.e. a domain bound in well 1 of the effective adhesion potential. The free energy per area of this membrane domain is (see Appendix S2)
| (16) |
where  is the free energy per area of the unbound membrane, and
  is the area fraction of the membrane domain bound in the well. The rescaled well depth
  depends on the concentrations and affinity of the receptors and ligands, on the effective bending rigidity
  of the membranes, and on the width
  of the well (see eq. (12)). Similarly, the free energy per area of a domain of long receptor-ligand complexes, i.e. of a domain bound in well 2 of the effective potential, can be written as
| (17) |
For equal widths  of the two potential wells, the free energy difference per area between domains bound in well 1 and well 2 is then
| (18) |
The function  is linear in the rescaled well depth
  for small values of
  , and attains the limiting value of 1 for large values of
  at which the membrane domain is essentially fully bound in the well [29], [33]. The precise form of this function can be easily determined from Monte Carlo simulations of a membrane bound in a single well (see fig. 2). To derive a general analytical expression for the free energy difference
  , we consider here the single-parameter fit [33]
| (19) |
with  for the Monte Carlo data at the rescaled well width
  . For
. For  , the single-parameter function
  coincides with overall more precise three-parameter functions
  at
at  and
and  (see fig. 2). With eq. (19), we obtain the general expression
| (20) |
for the adhesion free energy difference between domains bound in well 1 and well 2 of the effective adhesion potential shown in fig. 1(b).
Figure 2. Fraction  of membrane patches inside a single well as a function of the rescaled depth
  of the well.

The data points are from Monte Carlo simulations with the rescaled well widths  (filled circles) and
  (open circles). The full lines result from fits of the three-parameter function
  with
with  ,
,  , and
, and  for
for  and
and  ,
,  , and
, and  for
for  . The dashed line results from a fit of eq. (19) with
  to the data points for
  and
and  (see [33] for details).
Classical nucleation theory of domain formation
We use classical nucleation theory to determine the line tension between domains of long and short receptor-ligand complexes. Equilibrium properties of the membranes, such as the line tension between the domains of receptor-ligand complexes, can be obtained from the effective double-well adhesion potential of the membranes shown in fig. 1(b). We consider now a circular membrane domain of radius  that is bound in well 1 of the effective adhesion potential, surrounded by a large domain bound in well 2. We assume that the rescaled depths of the two potential wells are beyond the critical depth (15), with
  . In classical nucleation theory, the excess free energy of the circular domain is
| (21) |
where  is the line tension of the domain boundary, and
  is the free energy difference per area between the two domains. The excess free energy has a maximum at the critical radius
| (22) |
which follows from  . For radii
  , the circular domain grows into a stable domain since the excess free energy decreases with increasing
  . For radii
  , the circular domain is instable and shrinks since the excess free energy decreases with decreasing
  . Using eq. (22), we will determine the line tension
  from the free energy differences
  and the critical radii
  obtained from Monte Carlo simulations.
Critical domains sizes from Monte Carlo simulations
We determine the critical radii of domain nucleation from Monte Carlo simulations. The simulations start from pre-equilibrated initial conformations with a circular nucleus of radius  bound in the deeper well 1, surrounded by a membrane domain bound in well 2 (see fig. 3). The pre-equilibration ensures (i) that the circular nucleus contains the expected fraction
  of membrane patches bound in well 1, (ii) that the surrounding domain contains a fraction
  of membrane patches bound in well 2, and (iii) that the domain boundary is relaxed. To create a pre-equilibrated initial conformation, we ‘cut out’ a circular domain of radius
  from a Monte Carlo simulation of a membrane that only ‘feels’ well 1, ‘freeze’ this domain, and place it into a membrane that only ‘feels’ well 2. The domain boundary is then relaxed by a simulation in which the nucleus remains ‘frozen’ (no Monte Carlo moves inside the nucleus), and in which the surrounding membrane continues to ‘feel’ only well 2.
Figure 3. Stability of adhesion domains.

(a) and (b): Time sequences of Monte Carlo snapshots of a membrane in the effective double-well potential of fig. 1(b) with rescaled depths  and
and  , rescaled width
  and rescaled separation
  . Membrane patches bound in well 1 are indicated in green, and membrane patches bound in well 2 are red. In (a), the initial radius of the green domain bound in well 1 of the effective potential is below the critical radius for domain stability. Therefore, the domain shrinks and finally vanishes in the simulations. The shapshots are taken at times
  ,
,  ,
,  ,
,  , and
, and  Monte Carlo steps per patch. In (b), the initial radius of the green domain is above the critical radius. The domain thus increases until the whole membrane is bound in the deeper potential well 1. The shapshots are taken at times
  ,
,  ,
,  ,
,  , and
, and  Monte Carlo steps per patch.
Nuclei with a radius  smaller than the critical radius
  tend to shrink, while nuclei with a radius larger than
  tend to grow (see fig. 3). To quantify this tendency of the nuclei to grow or shrink, we perform 30 simulations for each nucleus size, and determine the fraction of the simulations in which the nucleus grows. These growth fractions are displayed in fig. 4 for simulations with the rescaled depth
  of well 1 and rescaled depths between
  and
and  for well 2. After data smoothening, the critical radius
  is defined as the radius at which the smoothed growth fractions have the value 0.5 (see caption of fig. 4 for details).
Figure 4. Growth probability of a circular nucleus as a function of the nucleus radius  in units of the linear size
  of the membrane patches.

The initial nucleus is bound in well 1 of the effective adhesion potential shown in fig. 1(b), and the surrounding membrane is bound in well 2 (see Monte Carlo snapshots in fig. 3). The six curves are from simulations with the rescaled depths  , 0.105, 0.11, 0.115, 0.1175, and 0.12 of well 2 (from left to right). In all simulations, the rescaled depth of well 1 is
  , and the rescaled separation and width of the wells are
  and
and  . Each data point was obtained from averaging over 30 simulations. To extract the critical radius from a curve, we fit the curve with three different fit functions and determine the three radii
  at which these fit functions attain the value 0.5. The critical radius
  is defined as the average of these three radii. For the six curves, we obtain the values
  , 6.70, 9.81, 16.12, 22.58, and 35.08 of the critical radius. The three fit functions are
  (full lines),
  (dashed lines), and
 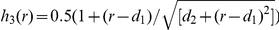 (dotted lines).
According to eq. (22), the line tension now follows as  from the critical radii
  and the free energy differences
  , which are calculated from eq. (18) with
  where
where  is the three-parameter function at the rescaled well width
  shown in fig. 2. The resulting values for the line tension are shown in fig. 5. The line tension increases with the rescaled depth
  of well 2 since the potential barrier increases (see fig. 1(b)). The line tension for the symmetric double-well potential with well equal depths
  can be obtained from extrapolation (see fig. 5).
Figure 5. Line tension extrapolation.

Line tension  as function of the rescaled depth
  of well 2 for the rescaled depth
  of well 1. The six data points result from the six values of the critical radius
  determined in fig. 4. The line tension
  is obtained from the critical radii as
  (see eq. (22)), with the free energy difference
  calculated from eq. (18) with the function
  given in Appendix S2 and in the caption of fig. 2. Linear extrapolation of the four right data points leads to the estimated value
  for the line tension of the symmetric double-well potential with rescaled depth
  and rescaled separation
  and
and  of the wells.
Line tension between domains of long and short receptor-ligand complexes
To derive a general relation for the line tension  , we now focus on the extrapolated line tensions for the symmetric double-well potential. The symmetric double-well potential corresponds to the equilibrium situation in the case of large coexisting domains since the free-energy difference per area (18) between the domains vanishes for equal rescaled well depths
  [26], [31]. Our values for the extrapolated line tensions at different rescaled depths
  and separations
  are shown in fig. 6. Each of the data points in this figure results from an extrapolation analogous to fig. 5.
Figure 6. Extrapolated line tensions  for the symmetric double-well potential with rescaled depth
  of the potential wells.

The data points are from Monte Carlo simulations with the rescaled well width  and the rescaled well separations
  , 4 and 6. (a) For small and intermediate values of
  , the line tension
  is linear in
  ; (b) At large values of
  , the line tension
  is a nonlinear function of
  . Note that the first three data points are identical with the black data points in subfigure (a). The line tension vanishes at the critical potential depth
  for domain formation, which depends on the separation
  and width
  of the two potential wells (see eqs. (14) and (15)).
For small and intermediate values of  , the line tension
  depends linearly on
  (see fig. 6(a)). This linear dependence is in agreement with previous evidence [35], [36] that the critical point of membranes in a double-well potential is in the same universality class as the critical point of the two-dimensional Ising model. In the vicinity of the critical temperature
  , the line tension in the Ising model depends linearly on
  for
for  . Therefore, the line tension
  of the membrane domains can be expected to depend linearly on
  for
for  as well, which implies a linear dependence on
  for
for  in the vicinity of the critical potential depth
  .
.
The critical potential depth  can be estimated from extrapolation to
  since the line tension
  vanishes at the critical point. From the three curves in fig. 6(a), we obtain the values
  ,
,  , and
, and  for
for  ,
,  , and
, and  . Within the numerical accuracy, these values agree with the values
  ,
,  , and
, and  obtained from eq. (15). This agreement confirms our approach since eq. (15) has been derived independently from a finite-size scaling analysis of Monte Carlo data [27].
The values of the rescaled well depth  in fig. 6(a) range from 0 to 0.25. For this range of values, the fraction
  of membrane patches bound in a single well only depends on
  , and not on the well width
  (see fig. 2). We therefore expect that the values of
  shown in fig. 6(a) only depend on the rescaled depth
  and the ratio
  of the separation and width of the wells. The line tension
  in 6(a) is linear in
  and vanishes at the critical depth
  . From a dimensional analysis (see Appendix S1), we obtain the scaling form
| (23) |
for the line tension in the vicinity of the critical point.
The scaling function  in eq. (23) can be obtained from an analysis of the slope of the three lines in fig. 6(a) as a function of
  (see fig. 7). From the Monte Carlo simulations, we obtain the line tension in units of
  . To extract the scaling function
  from the Monte Carlo data, we note that eq. (23) can be written as
| (24) |
where  and
and  are the rescaled width and separation of the potential wells defined in eq. (10). The three data points in fig. 7 for the slopes of the three lines in fig. 6(a) can be well fitted with a linear function. According to eq. (24), this linear function is
  . For the rescaled well width
  used in our Monte Carlo simulations, we obtain
| (25) |
with  and
and  . From a previous scaling analysis of
  [27], we expect that eq. (23) holds for
  . However, the scaling relation (23) is not unreasonable in the limit of small
  . In this limit, the line tension
  vanishes since
  diverges according to eq. (15) and since
  is 0 for
  .
.
Figure 7. Slopes of the three curves in fig. 6(a) as a function of the ratio  of the separation and width of the potential wells.

The slopes can be well fitted by a linear function (see text).
Minimum sizes of stable TCR microdomains
We consider now a situation in which a domain of long receptor-ligand complexes  extends over the whole adhesion zone of two cells, and determine the critical size for the nucleation of microdomains of short
  complexes within this large
  domain. This situation corresponds to a T cell that adheres to a second cell via long integrin complexes and that forms microdomains of short TCR-MHCpeptide complexes if foreign MHCpeptides are present on the apposing cell surface. According to classical nucleation theory, the critical radius beyond which these microdomains are stable is
  (see eq. (22)). From our general relations (23) and (20) for the line tension
  and the free energy difference
  , we obtain
| (26) |
with numerical parameters  ,
,  (see eq. (25)),
  (see eq. (15)), and
  (see eq. (20)). The nucleation of a microdomain of short receptor-ligand complexes
  within the large
  domain can only occur for effective binding energies
  of the domains. We assume here that the line tension for this nucleation event can be estimated by eq. (23) with
  since the barrier crossed in the event has the height
  .
.
To estimate the magnitude of the rescaled effective binding energy  of the domain of
  complexes, we assume now the values
  and
and  for the concentrations and binding constants of the receptors and ligands, which lead to the effective binding energy
  of these complexes (see eq. (8)). The rescaled effective binding energy defined in eq. (13) is then
  for the interaction range
  nm of the complexes and the effective bending rigidity
  of the membranes. The fraction
  of the membranes within binding range of the receptors and ligands is then approximately
  according to eq. (19), and the concentration of bound receptor-ligand complexes is
  [33]. These concentrations are within the range of typical concentrations in cell adhesion zones [37].
For T cells, the length difference  between the TCR-MHCpeptide and the integrin complexes is about 25 nm, which leads to the ratio
  of the separation and width of the two wells in the effective potential. According to eq. (15), the critical rescaled well depth for domain formation is then
  . As required for domain coexistence, this value of the critical well depth is below our estimate for
  , and also below
  since nucleation of the
  microdomain implies
  . In fig. 8, the critical radii
  obtained from eq. (26) are plotted as a function of
  . Depending on the difference between
  and
and  , the critical radii vary between tens and hundreds of nanometers, which is in the range of microdomain sizes observed in T-cell adhesion [8], [9], [38], [39].
Figure 8. Critical radius  for the nucleation of a microdomain of short
  complexes within a large domain of long
  complexes, as a function of the difference
  between the rescaled effective binding energies of the domains (see eq. (26)).

We have assumed here the values  nm and
  nm for the width and separation of the two wells in the effective potential. The critical radius decreases with
  for constant value of
  , and decreases with
  for constant
  .
.
Conclusions
While the line tension and stability of lipid domains has been investigated for a long time[40]–[49], the line tension of protein domains in the adhesion zones of membranes has not been addressed, to the best of our knowledge, in previous studies. In this article, we have derived general relations for the line tension  and the free energy difference
  between domains of long and short receptor-ligand complexes in cell adhesion zones (see eqs. (20) and (23)). These relations were obtained from a combination of scaling arguments and Monte Carlo simulations and fully include the thermal shape fluctuations of the membranes. In addition, the degrees of freedom of the receptors and ligands related to their lateral mobility along the membranes are systematically taken into account via partial integration in the partition function. These general relations for the line tension and adhesion free energy of the receptor-ligand domains depend only on parameters that can be directly related to experimentally accessible quantities. Using typical values for T-cell adhesion zones, we find that stable submicron-scale domains of TCR-MHCpeptide complexes may form solely because of their length mismatch to integrin complexes. The role of the T-cell cytoskeleton thus may be limited to the observed transport of TCR-MHCpeptide microdomains to the contact zone center via weak frictional coupling of the cytoskeleton to the TCRs [50], [51].
Supporting Information
Dimensional analysis.
(PDF)
Free energy of a membrane in a single-well potential.
(PDF)
Footnotes
Competing Interests: The authors have declared that no competing interests exist.
Funding: This work was supported by the interdisciplinary network of excellence “Synthetic Bioactive Surfaces” of the Fraunhofer Society and the Max Planck Society. The funders had no role in study design, data collection and analysis, decision to publish, or preparation of the manuscript.
References
- 1.Choudhuri K, Dustin ML. Signaling microdomains in T cells. FEBS Lett. 2010;584:4823–4831. doi: 10.1016/j.febslet.2010.10.015. [DOI] [PMC free article] [PubMed] [Google Scholar]
- 2.Kholodenko BN, Hancock JF, Kolch W. Signalling ballet in space and time. Nat Rev Mol Cell Biol. 2010;11:414–426. doi: 10.1038/nrm2901. [DOI] [PMC free article] [PubMed] [Google Scholar]
- 3.Pasquale EB. Eph-ephrin bidirectional signaling in physiology and disease. Cell. 2008;133:38–52. doi: 10.1016/j.cell.2008.03.011. [DOI] [PubMed] [Google Scholar]
- 4.Wu Y, Jin X, Harrison O, Shapiro L, Honig BH, et al. Cooperativity between trans and cis interactions in cadherin-mediated junction formation. Proc Natl Acad Sci USA. 2010;107:17592–17597. doi: 10.1073/pnas.1011247107. [DOI] [PMC free article] [PubMed] [Google Scholar]
- 5.Yokosuka T, Saito T. Dynamic regulation of T-cell costimulation through TCR-CD28 microclusters. Immunol Rev. 2009;229:27–40. doi: 10.1111/j.1600-065X.2009.00779.x. [DOI] [PubMed] [Google Scholar]
- 6.Seminario MC, Bunnell SC. Signal initiation in T-cell receptor microclusters. Immunol Rev. 2008;221:90–106. doi: 10.1111/j.1600-065X.2008.00593.x. [DOI] [PubMed] [Google Scholar]
- 7.Choudhuri K, van der Merwe PA. Molecular mechanisms involved in T cell receptor triggering. Semin Immunol. 2007;19:255–261. doi: 10.1016/j.smim.2007.04.005. [DOI] [PubMed] [Google Scholar]
- 8.Campi G, Varma R, Dustin M. Actin and agonist MHC-peptide complex-dependent T cell receptor microclusters as scaffolds for signaling. J Exp Med. 2005;202:1031–1036. doi: 10.1084/jem.20051182. [DOI] [PMC free article] [PubMed] [Google Scholar]
- 9.Yokosuka T, Sakata-Sogawa K, Kobayashi W, Hiroshima M, Hashimoto-Tane A, et al. Newly generated T cell receptor microclusters initiate and sustain T cell activation by recruitment of Zap70 and SLP-76. Nat Immunol. 2005;6:1253–1262. doi: 10.1038/ni1272. [DOI] [PubMed] [Google Scholar]
- 10.Dustin ML, Cooper JA. The immunological synapse and the actin cytoskeleton: molecular hardware for T cell signaling. Nat Immunol. 2000;1:23–29. doi: 10.1038/76877. [DOI] [PubMed] [Google Scholar]
- 11.Wülfing C, Davis MM. A receptor/cytoskeletal movement triggered by costimulation during t-cell activation. Science. 1998;282:2266–2269. doi: 10.1126/science.282.5397.2266. [DOI] [PubMed] [Google Scholar]
- 12.Molnar E, Deswal S, Schamel WWA. Pre-clustered TCR complexes. FEBS Lett. 2010;584:4832–4837. doi: 10.1016/j.febslet.2010.09.004. [DOI] [PubMed] [Google Scholar]
- 13.Lillemeier BF, Mörtelmaier MA, Forstner MB, Huppa JB, Groves JT, et al. TCR and Lat are expressed on separate protein islands on T cell membranes and concatenate during activation. Nat Immunol. 2010;11:90–96. doi: 10.1038/ni.1832. [DOI] [PMC free article] [PubMed] [Google Scholar]
- 14.Springer TA. Adhesion receptors of the immune system. Nature. 1990;346:425–434. doi: 10.1038/346425a0. [DOI] [PubMed] [Google Scholar]
- 15.Shaw AS, Dustin ML. Making the T cell receptor go the distance: a topological view of T cell activation. Immunity. 1997;6:361–369. doi: 10.1016/s1074-7613(00)80279-4. [DOI] [PubMed] [Google Scholar]
- 16.Qi SY, Groves JT, Chakraborty AK. Synaptic pattern formation during cellular recognition. Proc Natl Acad Sci USA. 2001;98:6548–6553. doi: 10.1073/pnas.111536798. [DOI] [PMC free article] [PubMed] [Google Scholar]
- 17.Weikl TR, Groves JT, Lipowsky R. Pattern formation during adhesion of multicomponent membranes. Europhys Lett. 2002;59:916–922. [Google Scholar]
- 18.Burroughs NJ, Wülfing C. Differential segregation in a cell-cell contact interface: the dynamics of the immunological synapse. Biophys J. 2002;83:1784–1796. doi: 10.1016/S0006-3495(02)73944-1. [DOI] [PMC free article] [PubMed] [Google Scholar]
- 19.Raychaudhuri S, Chakraborty AK, Kardar M. Effective membrane model of the immunological synapse. Phys Rev Lett. 2003;91:208101. doi: 10.1103/PhysRevLett.91.208101. [DOI] [PubMed] [Google Scholar]
- 20.Weikl TR, Lipowsky R. Pattern formation during T-cell adhesion. Biophys J. 2004;87:3665–3678. doi: 10.1529/biophysj.104.045609. [DOI] [PMC free article] [PubMed] [Google Scholar]
- 21.Coombs D, Dembo M, Wofsy C, Goldstein B. Equilibrium thermodynamics of cell-cell adhesion mediated by multiple ligand-receptor pairs. Biophys J. 2004;86:1408–1423. doi: 10.1016/S0006-3495(04)74211-3. [DOI] [PMC free article] [PubMed] [Google Scholar]
- 22.Figge MT, Meyer-Hermann M. Geometrically repatterned immunological synapses uncover formation mechanisms. PLoS Comput Biol. 2006;2:e171. doi: 10.1371/journal.pcbi.0020171. [DOI] [PMC free article] [PubMed] [Google Scholar]
- 23.van der Merwe PA, McNamee PN, Davies EA, Barclay AN, Davis SJ. Topology of the CD2–CD48 cell-adhesion molecule complex: implications for antigen recognition by T cells. Curr Biol. 1995;5:74–84. doi: 10.1016/s0960-9822(95)00019-4. [DOI] [PubMed] [Google Scholar]
- 24.Wang JH, Smolyar A, Tan K, Liu JH, Kim M, et al. Structure of a heterophilic adhesion complex between the human CD2 and CD58 (LFA-3) counterreceptors. Cell. 1999;97:791–803. doi: 10.1016/s0092-8674(00)80790-4. [DOI] [PubMed] [Google Scholar]
- 25.Milstein O, Tseng SY, Starr T, Llodra J, Nans A, et al. Nanoscale increases in CD2–CD48-mediated intermembrane spacing decrease adhesion and reorganize the immunological synapse. J Biol Chem. 2008;283:34414–34422. doi: 10.1074/jbc.M804756200. [DOI] [PMC free article] [PubMed] [Google Scholar]
- 26.Weikl TR, Asfaw M, Krobath H, Rozycki B, Lipowsky R. Adhesion of membranes via receptor-ligand complexes: Domain formation, binding cooperativity, and active processes. Soft Matter. 2009;5:3213–3224. [Google Scholar]
- 27.Asfaw M, Rozycki B, Lipowsky R, Weikl TR. Membrane adhesion via competing receptor/ligand bonds. Europhys Lett. 2006;76:703–709. [Google Scholar]
- 28.Lipowsky R. Adhesion of membranes via anchored stickers. Phys Rev Lett. 1996;77:1652–1655. doi: 10.1103/PhysRevLett.77.1652. [DOI] [PubMed] [Google Scholar]
- 29.Weikl TR, Lipowsky R. Adhesion-induced phase behavior of multicomponent membranes. Phys Rev E. 2001;64:011903. doi: 10.1103/PhysRevE.64.011903. [DOI] [PubMed] [Google Scholar]
- 30.Weikl TR, Lipowsky R. Membrane adhesion and domain formation. In: Leitmannova Liu A, editor. Advances in Planar Lipid Bilayers and Liposomes. Academic Press; 2006. [Google Scholar]
- 31.Rozycki B, Lipowsky R, Weikl TR. Segregation of receptor–ligand complexes in cell adhesion zones: phase diagrams and the role of thermal membrane roughness. New J Phys. 2010;12:095003. [Google Scholar]
- 32.Goetz R, Gompper G, Lipowsky R. Mobilitiy and elasticity of self-assembled membranes. Phys Rev Lett. 1999;82:221–224. [Google Scholar]
- 33.Krobath H, Rozycki B, Lipowsky R, Weikl TR. Binding cooperativity of membrane adhesion receptors. Soft Matter. 2009;5:3354–3361. [Google Scholar]
- 34.Binder K, Heermann DW. Monte Carlo simulation in statistical physics, 4th ed. Springer; 2002. [Google Scholar]
- 35.Ammann A, Lipowsky R. Discontinuous phase transitions of membranes: a Monte Carlo study. J Phys II. 1996;6:255–270. [Google Scholar]
- 36.Lipowsky R. Discontinuous unbinding transitions of exible membranes. J Phys II. 1994;4:1755–1762. [Google Scholar]
- 37.Grakoui A, Bromley SK, Sumen C, Davis MM, Shaw AS, et al. The immunological synapse: a molecular machine controlling T cell activation. Science. 1999;285:221–227. doi: 10.1126/science.285.5425.221. [DOI] [PubMed] [Google Scholar]
- 38.Varma R, Campi G, Yokosuka T, Saito T, Dustin ML. T cell receptor-proximal signals are sustained in peripheral microclusters and terminated in the central supramolecular activation cluster. Immunity. 2006;25:117–127. doi: 10.1016/j.immuni.2006.04.010. [DOI] [PMC free article] [PubMed] [Google Scholar]
- 39.Yokosuka T, Kobayashi W, Sakata-Sogawa K, Takamatsu M, Hashimoto-Tane A, et al. Spatiotemporal regulation of T cell costimulation by TCR-CD28 microclusters and protein kinase C theta translocation. Immunity. 2008;29:589–601. doi: 10.1016/j.immuni.2008.08.011. [DOI] [PMC free article] [PubMed] [Google Scholar]
- 40.Lipowsky R. Budding of membranes induced by intramembrane domains. J Phys II. 1992;2:1825–1840. [Google Scholar]
- 41.Jülicher, Lipowsky Domain-induced budding of vesicles. Phys Rev Lett. 1993;70:2964–2967. doi: 10.1103/PhysRevLett.70.2964. [DOI] [PubMed] [Google Scholar]
- 42.Baumgart T, Hess ST, Webb WW. Imaging coexisting uid domains in biomembrane models coupling curvature and line tension. Nature. 2003;425:821–824. doi: 10.1038/nature02013. [DOI] [PubMed] [Google Scholar]
- 43.Bacia K, Schwille P, Kurzchalia T. Sterol structure determines the separation of phases and the curvature of the liquid-ordered phase in model membranes. Proc Natl Acad Sci USA. 2005;102:3272–3277. doi: 10.1073/pnas.0408215102. [DOI] [PMC free article] [PubMed] [Google Scholar]
- 44.Heinrich MC, Levental I, Gelman H, Janmey PA, Baumgart T. Critical exponents for line tension and dipole density difference from lipid monolayer domain boundary uctuations. J Phys Chem B. 2008;112:8063–8068. doi: 10.1021/jp7116246. [DOI] [PubMed] [Google Scholar]
- 45.Semrau S, Idema T, Holtzer L, Schmidt T, Storm C. Accurate determination of elastic parameters for multicomponent membranes. Phys Rev Lett. 2008;100:088101. doi: 10.1103/PhysRevLett.100.088101. [DOI] [PubMed] [Google Scholar]
- 46.Brewster R, Pincus PA, Safran SA. Hybrid lipids as a biological surface-active component. Biophys J. 2009;97:1087–1094. doi: 10.1016/j.bpj.2009.05.051. [DOI] [PMC free article] [PubMed] [Google Scholar]
- 47.Yamamoto T, Brewster R, Safran SA. Chain ordering of hybrid lipids can stabilize domains in saturated/hybrid/cholesterol lipid membranes. Europhys Lett. 2010;91:28002. [Google Scholar]
- 48.Gutlederer E, Gruhn T, Lipowsky R. Polymorphism of vesicles with multi-domain patterns. Soft Matter. 2009;5:3303–3311. [Google Scholar]
- 49.Hu J, Weikl TR, Lipowsky R. Vesicles with multiple membrane domains. Soft Matter. 2011;7:6092–6102. [Google Scholar]
- 50.Mossman KD, Campi G, Groves JT, Dustin ML. Altered TCR signaling from geometrically repatterned immunological synapses. Science. 2005;310:1191–1193. doi: 10.1126/science.1119238. [DOI] [PubMed] [Google Scholar]
- 51.DeMond AL, Mossman KD, Starr T, Dustin ML, Groves JT. T cell receptor microcluster transport through molecular mazes reveals mechanism of translocation. Biophys J. 2008;94:3286–3292. doi: 10.1529/biophysj.107.119099. [DOI] [PMC free article] [PubMed] [Google Scholar]
Associated Data
This section collects any data citations, data availability statements, or supplementary materials included in this article.
Supplementary Materials
Dimensional analysis.
(PDF)
Free energy of a membrane in a single-well potential.
(PDF)