Abstract
Yta7 is a highly conserved bromodomain-containing protein with AAA-ATPase homology originally implicated in heterochromatin boundary function in Saccharomyces cerevisiae. Although increased activity of the human ortholog has been implicated in malignant breast tumors, Yta7's precise mode of action is unknown. Transcriptional analysis in yeast cells revealed a role for Yta7 and its ATPase function in gene induction, including galactose- and sporulation-induced transcription. This requirement was direct and activating, because Yta7 associated with the GAL gene cluster only upon transcriptional induction. Suggestive of a role in transcriptional elongation, Yta7 localized to the ORFs of highly transcribed genes. Intriguingly, the yta7Δ mutant's transcriptional defects were partially suppressed by decreased dosage of histones H3 and H4. Consistent with this suppression, cells lacking Yta7 exhibited both increased levels of chromatin-incorporated histone H3 and decreased nucleosome spacing. Importantly, this modulation of H3 levels occurred independently of changes in H3 transcript level. Because Yta7 binds histone H3 in vitro, these results suggested a direct role for Yta7 in H3 eviction or degradation. Further, local loss of Yta7 activity at a long inducible gene resulted in accumulation of H3 at the 3′ end upon transcriptional activation, implying Yta7 may regulate H3 cotranscriptionally.
Keywords: ANCCA, H2A.Z
The size constraints of the nucleus necessitate condensation of eukaryotic DNA into chromatin. The fundamental subunit of chromatin is the nucleosome, 147 bp of DNA wound about the histone octamer (1). Each octamer typically contains two copies each of the canonical histones H2A, H2B, H3, and H4. However, histone variants, such as H2A.Z, macro-H2A, H3.3, CENP-A, and others, are substituted at specific genomic locations for their cognate canonical histone (2, 3). All chromatin-dependent processes—transcription, replication, recombination, and repair—are affected by the position and occupancy of nucleosomes. With respect to transcription, nucleosomes constrain access of site-specific and general transcription factors to their DNA template (4, 5).
Access of transcription factors to DNA is facilitated by chromatin remodelers, which can reveal transcription factor binding sites by nucleosome sliding (6), and by the incorporation of histone variants, such as H2A.Z and H3.3, that can destabilize nucleosomes (7, 8). Once RNA PolII is engaged on the DNA template, nucleosomes must be navigated during transcriptional elongation. The clearing of H2A/H2B dimers from transcribed regions is facilitated by the nucleosome-destabilizing activity of the FAcilitates Chromatin Transcription (FACT) complex (9, 10), originally identified as necessary for PolII transcription on a chromatinized template in vitro (11). The H3/H4 tetramer was long believed to stay associated with DNA during PolII-mediated transcription (12, 13). However, recent studies clearly indicate that replication-independent replacement of canonical H3 with H3.3 occurs during transcription (14–17). In budding yeast, which contains only the centromere-specific and H3.3 forms of H3, replication-independent H3 exchange in ORFs is positively correlated with PolII occupancy (18–20). Although histone chaperones responsible for replication-independent deposition of H3.3 have been identified, how eviction of H3 occurs is presently unclear. In vitro, high densities of PolII can evict the entire histone octamer (21); however, in vivo, other factors appear to be required for eviction, such as the H3/H4 chaperone Asf1 (18, 22, 23). Whether Asf1 acts alone in this capacity, or with other proteins, is unknown.
The YTA7 gene of Saccharomyces is conserved from yeast to humans and encodes the only bromodomain-containing AAA-ATPase in yeast. The human ortholog, ATPase nuclear coactivator cancer-associated (ANCCA), is a coactivator of both estrogen and androgen receptors, and increased expression of ANCCA is associated with breast and prostate cancers with poor prognoses (24, 25). yta7 mutants were originally isolated as being defective for restricting Sir-protein silencing from spreading (26, 27). However, Yta7's precise mode of action is unclear. In Saccharomyces cerevisiae there are conflicting claims, with Yta7 described either as a repressor (28) or an activator (29) of histone gene expression.
The conserved domain structure of Yta7 is suggestive of function. Yta7 appears to contain two histone interaction domains: a noncanonical bromodomain and an acidic N-terminal region. Although bromodomains typically bind acetylated lysines, in vitro analyses suggest that Yta7's bromodomain preferentially interacts with the unacetylated and unmethylated N-terminal tail of histone H3 (28, 30). Additionally, Yta7 contains a putative AAA-ATPase domain of the NSF/Cdc48/Pex family, members of which are classically hexameric and involved in unfolding or manipulating proteins (31). Indeed, the human ortholog, ANCCA, assembles into oligomers, and its ATPase activity is required for its coactivator function (32, 33). Thus, its domain structure implied that Yta7 might function enzymatically on histones or nucleosomes. The goal of this work was to test these implications and uncover what Yta7's molecular function might be. The experiments described here led to the view that Yta7 participates in the eviction and/or degradation of histone H3 to facilitate active transcription.
Results
Inducible Genes Required Yta7 for Proper Induction.
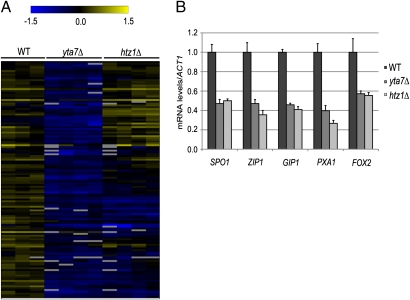
To clarify the function of this chromatin-interacting protein, the genome-wide transcriptional requirements for Yta7 were determined in S. cerevisiae. Interestingly, significantly misregulated transcripts in the yta7Δ mutant grown in rich medium [Significance Analysis of Microarrays (SAM), 1.5 median false gene cutoff; Table S1] were from genes whose expression is inducible relative to constitutively expressed genes. To assess if the misregulation of inducible transcripts in non-inducing conditions observed in the yta7Δ mutant might indicate a general role in induction, we assayed cells lacking the histone variant H2A.Z, which is required for optimal induction of multiple inducible genes (34–38). Although cells lacking H2A.Z (htz1Δ) exhibited broader transcriptional misregulation (7% of transcripts) than cells lacking Yta7, the majority of genes down-regulated in the yta7Δ mutant behaved similarly in the htz1Δ mutant (Fig. 1 A and B; binominal distribution; P = 2 × 10⁻²⁷). These results suggested that Yta7 was required for optimal gene induction.
Fig. 1.
Significant coregulation by Yta7 and H2A.Z. (A) Hierarchical clustering analysis of genes significantly down-regulated in the yta7Δ mutant indicated that the majority were also down-regulated in cells lacking H2A.Z (htz1Δ). Both genes and samples were clustered according to complete linkage, with the distance metric of the Pearson correlation. Values are log2 (strain/pooled reference), where each column is a biological replicate. Gray rectangles indicate missing data values for that experiment. (B) RNA analysis of inducible genes in non-inducing conditions. The level of each transcript was normalized to ACT1 mRNA levels and adjusted to a WT level set equal to 1. In this and all other figures, the error bars represent the SEM of at least three biological replicates.
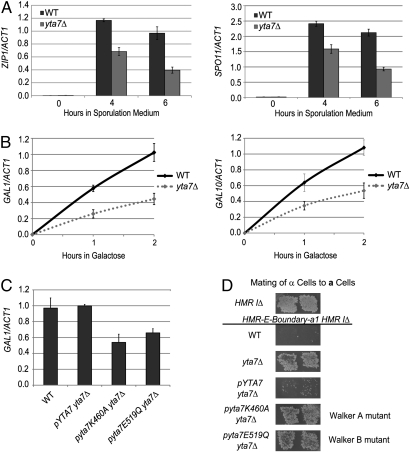
To test Yta7's potential role in gene induction, two distinct classes of inducible genes were assayed: early meiotic genes and galactose-inducible genes. The induction of meiotic genes was evaluated in the S. cerevisiae strain SK1 because of its highly efficient and synchronous meiosis and sporulation (39). The yta7Δ homozygotes failed to reach wild-type (WT) levels of gene expression for the early meiotic genes ZIP1 and SPO11 (Fig. 2A). This defect in achieving maximal induction was also observed for the mid-sporulation genes GIP1 and YSW1 (Fig. S1). Moreover, Yta7 was also required for proper induction of the galactose-inducible genes GAL1 and GAL10 (Fig. 2B). Interestingly, cells defective for H2A.Z incorporation exhibited similarly defective GAL gene induction with or without Yta7 (Fig. S2), suggesting that Yta7 and H2A.Z functioned together to ensure proper GAL gene induction (discussed below). Thus, assays of two distinct induction paradigms identified Yta7 as necessary for optimal induction.
Fig. 2.
Inducible genes required Yta7 and its AAA-ATPase domain for proper expression. (A) RNA analysis of SK1 WT and yta7Δ homozygotes. Cells were pregrown in YPAcetate, represented by the t = 0 time point, and then resuspended in sporulation medium for the times indicated. (B) RNA analysis of galactose induction. Cells were grown in YPRaffinose (2%, non-inducing) to an OD600 of 0.6; at that point, cells were harvested for the t = 0 time point. Prewarmed galactose was then added to a final concentration of 2%. (C) RNA analysis was performed as above, except cells were harvested after 1 h with galactose. (D) Mating test of α-cells. WT is unable to mate if the “Boundary,” 1 kb of DNA normally to the right of HMR, is inserted between the HMR-E silencer and a1, denoted HMR-E-Boundary-a1. This mating defect is because Sir proteins cannot traverse this Boundary to silence a1. When the yta7Δ mutation is introduced into this background, mating is partially restored (26), indicating that the Boundary is partially defective.
Yta7's AAA-ATPase Domain Was Required for Its Function.
To investigate the importance of Yta7's putative AAA-ATPase domain to its function, GAL1 induction was assayed in strains containing mutations in the Walker A (K460A) or Walker B (E519Q) motif of Yta7's AAA-ATPase domain. Both mutants were defective for GAL1 induction, indicating that residues essential for ATP binding and hydrolysis (40) were required for Yta7's role in induction (Fig. 2C). Because YTA7 was identified through its contribution to the boundary between silenced chromatin at the HMR locus and active genes nearby (26, 27), we further assayed these ATPase mutants for boundary function. Point mutants in either the Walker A or Walker B motif of Yta7's AAA-ATPase domain were indistinguishable from the yta7Δ mutant (Fig. 2D). Thus, the results from two independent assays clearly demonstrated that Yta7's AAA-ATPase was essential for its function.
Yta7 Localized to Inducible Genes upon Activation.
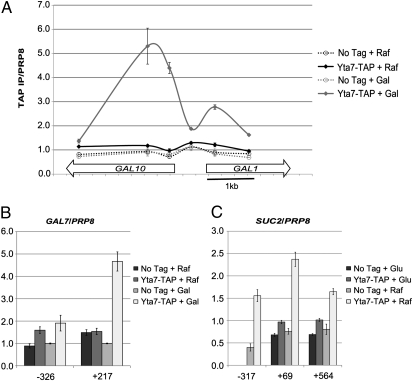
To test if this role in induction was attributable to direct action of Yta7 at the GAL gene cluster, ChIP was performed on epitope-tagged Yta7 (Yta7-TAP) in inducing and non-inducing conditions. Yta7 became enriched at the GAL1, GAL7, and GAL10 loci specifically upon galactose addition (Fig. 3 A and B). Interestingly, the peak of Yta7's localization occurred in the 5′-end of the GAL1 and GAL10 ORFs, with intermediate levels near the promoter and no detectable binding in the 3′-end. This preference for the 5′-end of the ORF was further observed upon tiling of the long inducible gene pGAL1::FMP27 (see below). Yta7's localization at GAL7 also exhibited preferential ORF enrichment (Fig. 3B). Further, consistent with the induction-dependent localization of Yta7 observed at the GAL gene cluster, Yta7 localized to SUC2 only upon induction (Fig. 3C). Taken together with the defective GAL gene induction in the yta7Δ mutant, these data indicated that Yta7 was directly required for GAL gene induction and that Yta7's transcription-coupled function was exerted primarily in the 5′-end of ORFs.
Fig. 3.
Yta7 localized to inducible genes upon activation. (A) ChIP analysis of Yta7-TAP across GAL10-GAL1 in inducing and non-inducing conditions. The two conditions represent YPRaffinose (Raf; 2%, non-inducing) and the same cultures 1 h after addition of galactose (+ Gal). Values were obtained with qPCR and represent the IP signal over the IP signal for the negative internal control PRP8. (B) ChIP analysis of Yta7-TAP, as above, at GAL7. Numbering in this and subsequent figures refers to base pairs from the start of the ORF for the gene indicated. (C) Yta7-TAP enrichment at SUC2 in YPD (2%) vs. Raf (2%), in which SUC2 is induced.
In accordance with Yta7's enrichment in ORFs, Yta7 physically interacts in vivo with Chd1, a helicase thought to regulate the transition between transcriptional initiation and elongation (41), and Spt16, the largest subunit of the FACT complex, which facilitates elongation by destabilizing nucleosomes (27, 42–44). Because Yta7's bromodomain can directly interact with histone H3 in vitro (28), it was possible that H3 modification, particularly acetylation, targeted Yta7 to the 5′-region of ORFs. Interestingly, however, in vivo and in vitro analyses of Yta7's interaction with histone H3 have thus far failed to indicate any preferred modification state of H3 (28, 30). Thus, Yta7's interaction with histone H3 appeared insufficient to explain Yta7's targeting. In principle, if H3 were not recruiting Yta7, then Yta7's interaction with H3 might reflect Yta7 activity exerted after localization. Thus, given Yta7's requirement for its AAA-ATPase domain (Fig. 2 C and D), we hypothesized that Yta7 might act on H3 rather than being recruited by it.
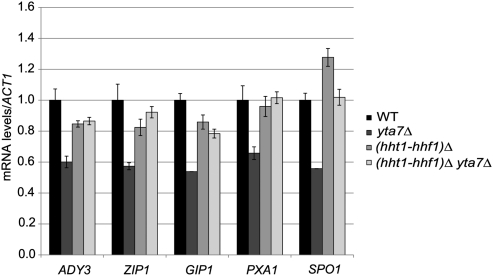
Supporting the hypothesis that Yta7 might act on H3, yta7Δ mutants are sensitive to the dosage of histones H3 and H4 (45, 46). Specifically, yta7Δ mutants grow better when a copy of the gene encoding either H3 or H4 is deleted. This growth defect suppression is not observed upon decreased dosage of the genes encoding H2A or H2B. Formally, it would appear that cells without Yta7 experience a specific “excess” of histones H3 and H4. Following this reasoning, we observed that many of the yta7Δ mutant's transcriptional defects were at least partially suppressed when one of the two copies of the H3 and H4 genes was removed (hht1-hhf1)Δ (Fig. 4). Thus, the loss of Yta7 might result either in overexpression of H3 and H4 or a cellular state sensitive to normal levels of H3 and H4 expression.
Fig. 4.
Phenotypic suppression with decreased dosage of histones H3 and H4. RT-qPCR analysis of transcript levels in cells grown in YPD. The level of each transcript was normalized to ACT1 mRNA levels and adjusted to a WT level set equal to 1.
In S. cerevisiae, there are two copies of each canonical histone gene organized into four paired loci (HHT1-HHF1, HHT2-HHF2, HTA1-HTB1, and HTA2-HTB2). Three of the four pairs are thought to be similarly regulated (HTA2-HTB2 is not subject to Hir-mediated repression) (47, 48). In asynchronously growing cells, Yta7 is highly enriched at all four canonical histone gene pairs. For three of the gene pairs, Yta7 is preferentially enriched in the ORFs, but at HTA1-HTB1, it is enriched in the promoter (28). However, there are conflicting data on whether Yta7's role at these loci is activating or repressive (28, 29). In principle, suppression of the yta7Δ mutant's phenotype by decreased dosage of H3 and H4 might reflect excess histone gene expression caused by the loss of Yta7-mediated repression. However, there were no significant differences in the levels of histone gene transcripts in the yta7Δ mutant relative to WT (Fig. S3). Therefore, we explored posttranscriptional explanations for how histone dosage intersected with Yta7's function. Specifically, we tested whether there was more H3 (and presumably H4) incorporated into chromatin in the yta7Δ mutant relative to WT.
Loss of Yta7 Resulted in Increased Nucleosome Density.
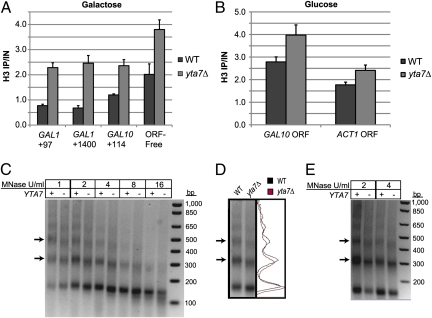
To test the prediction of increased levels of histones H3 and H4 in chromatin in the yta7Δ mutant, H3 ChIP was performed for the GAL gene cluster in inducing and non-inducing conditions. Consistent with decreased induction, there was a twofold to threefold increased H3 ChIP signal at the GAL genes in the yta7Δ mutant. An ORF-free control region (49) also exhibited an increase in H3 signal in the absence of Yta7, although to a lesser extent (Fig. 5A). This increased H3 signal was also observed at repressed GAL10 and at the highly transcribed ACT1 locus (Fig. 5B). To determine (i) if this increase in H3 “ChIP-ability” in the yta7Δ mutant reflected an actual increase in nucleosome occupancy and (ii) what the global effects on chromatin structure might be, we performed micrococcal nuclease digests on bulk chromatin. Digested chromatin from the yta7Δ mutant displayed faster migrating mono-, di-, and trinucleosome products than from WT for various concentrations of micrococcal nuclease (Fig. 5 C and D). This effect was most obvious on the di- and trinucleosome mobilities rather than on mononucleosomes, as would be expected if relative mobility were dominated by the internucleosome distance. Thus, this digestion profile was consistent with increased nucleosome density and a shorter DNA linker between nucleosomes. Indeed, the yta7Δ mutant exhibited an estimated decrease of 9 ± 2 bp in nucleosome repeat length. Because the average linker length in S. cerevisiae is ∼18 bp (50), the average linker length in the yta7Δ mutant appeared to approach the naturally occurring minimum of 7–9 bp (51, 52). Further, this effect was robust, because the yta7Δ mutant also clearly displayed faster migrating mono-, di-, and trinucleosome products than WT when grown in medium with either glucose or a nonfermentable carbon source (Fig. 5E). Thus, although a ChIP signal is subject to potential shearing effects and nonlinear antibody response (53, 54), the global chromatin pattern following micrococcal nuclease digestions clearly supported the increased H3 ChIP signal observed in the yta7Δ mutant.
Fig. 5.
Loss of Yta7 resulted in increased nucleosome density. (A) H3 ChIP performed on cells pregrown in YPRaffinose (2%, non-inducing) and then grown with galactose for 2 h. DNA values were quantified by qPCR and are presented as IP/IN for each primer set. (B) H3 ChIP performed on cells growing in YPD. (C) Micrococcal nuclease digestion performed on spheroplasts derived from YPD cultures. Digestions were performed in parallel for 10 min each at 37 °C. Isolated DNA was quantified, and equal amounts were electrophoretically separated on a 2% agarose gel. The arrows indicate the bands corresponding to the di- and trinucleosome products. (D) Overlaid intensity traces of the 2 U/mL MNase lanes presented in C. (E) Micrococcal nuclease digestion, as performed and visualized in C, but performed on spheroplasts derived from YPRaffinose (2%) cultures.
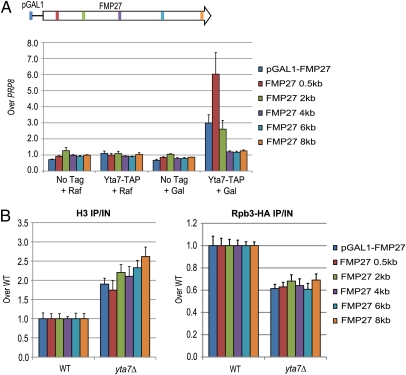
Because functional analysis indicated the importance of Yta7 to gene induction, we sought to determine if Yta7 could directly regulate H3 levels in a gene upon transcription. To this end, the GAL1 promoter was inserted in front of an 8-kb ORF to generate pGAL1::FMP27. This gene fusion is commonly used in S. cerevisiae transcriptional studies to provide enhanced spatial resolution of transcriptional events because this ORF is fivefold longer than the GAL1 ORF, allowing for clear distinction of 5′- vs. 3′-ORF effects (49). Upon induction, Yta7 became strongly enriched at the 5′-end of the ORF (Fig. 6A), consistent with our data above. Given Yta7's direct effect on FMP27 during induction, we then assayed H3 occupancy upon induction in the presence and absence of Yta7. Cells without Yta7 displayed increased levels of H3 throughout the locus, consistent with the ∼50% decrease in FMP27 mRNA levels observed upon induction in the yta7Δ mutant (Fig. S4). However, contrary to an overall H3 increase that might occur purely as the result of a decrease in transcriptional initiation, induced pGAL1::FMP27 in the yta7Δ mutant exhibited progressively more H3 the farther downstream from the promoter probed (Fig. 6B). This trend resulted in a 50% greater H3 ChIP signal at 8 kb than at 500 bp into the gene. Thus, an abnormal distribution of histone H3 occurred upon loss of Yta7 activity at an inducible gene.
Fig. 6.
Impaired H3 removal upon transcriptional activation. (A) ChIP analysis of Yta7-TAP across the inducible FMP27 allele in inducing and non-inducing conditions. The two conditions represent YPRaffinose (2%, non-inducing) and the same cultures 1 h after addition of galactose. Values were obtained with qPCR and represent the IP signal over the IP signal for the negative internal control PRP8. (B) H3 (Left) and Rpb3-HA (Right) ChIP performed in parallel on the same sonicated chromatin samples. Represented values are IP/IN, adjusted to a WT level set equal to 1 for each primer set. Raw IP/IN values for Rpb3-HA ChIP in both WT and the yta7mutant were relatively uniform (±15%) across the locus. Distances given are with respect to the start of the ORF.
In principle, given the inverse correlation between transcription levels and histone occupancy (55, 56), the gradient of increasing H3 signal toward the 3′-end of FMP27 in the yta7Δ mutant could be attributable to decreased transcription along the course of the gene. However, PolII localization in the yta7Δ mutant appeared uniformly reduced throughout the locus, rather than a gradient (Fig. 6B). Thus, because no additional decrease in PolII occupancy was observed at the 3′-end, the 3′-ORF H3 accumulation was not attributable to decreased PolII transit. Instead, these data implied that Yta7 function prevented H3 accumulation throughout the ORF, with an increasing gradient of H3 peaking at the 3′-end of FMP27. Thus, taken together with the apparent increased nucleosome density in the yta7Δ mutant demonstrated by micrococcal nuclease digests, the abnormal accumulation of H3 upon transcription at FMP27 prompted us to test whether Yta7 was able to limit the amount of chromatin-bound H3.
H3 Levels Varied Inversely with Yta7 Levels.
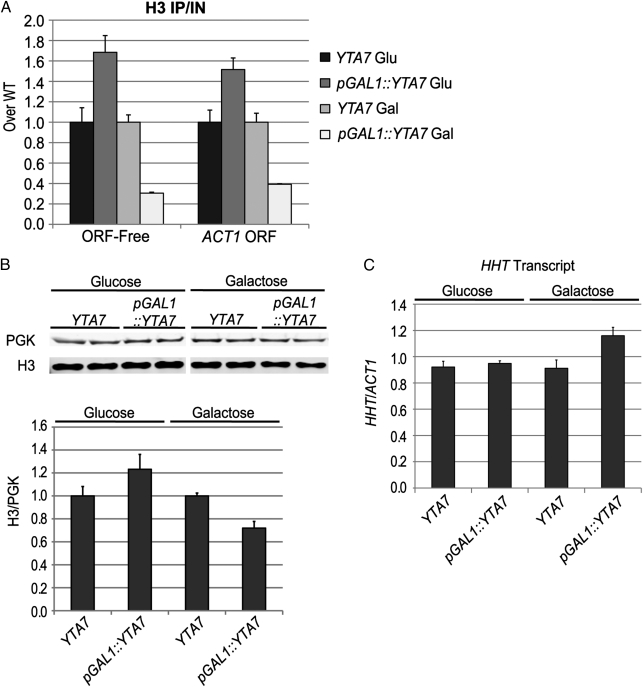
Levels of chromatin-incorporated histone H3 were evaluated by ChIP in cells overexpressing Yta7 (pGAL1::YTA7) to assess Yta7's capacity to influence chromatin-bound H3. These cells exhibited less than half the H3 signal of WT in the regions probed (Fig. 7A), and they also exhibited a decrease of ∼30% in total H3 protein levels (Fig. 7B). However, H3 transcript levels were not decreased in these strains (Fig. 7C), indicating that the decrease in total H3 occurred through a posttranscriptional mechanism. On the contrary, cells overexpressing Yta7 displayed a moderate yet significant increase in H3 transcript levels (P = 0.03, two-tailed t test). This increase could reflect either a direct activating role of Yta7 at the HHT1 and HHT2 loci or an autoregulatory response to decreased H3 protein levels. In contrast, these same strains grown in medium repressing pGAL1::YTA7 phenocopied the yta7Δ mutant, displaying increased levels of incorporated H3 at the regions assayed (Fig. 7A). Further, in repressive conditions, pGAL1::YTA7 strains displayed increased levels of total H3 (Fig. 7B). Thus, the level of histone H3, but not its transcript, was inversely correlated with the level of Yta7.
Fig. 7.
Yta7 decreased histone H3 levels posttranscriptionally. (A) H3 ChIP performed on cells not expressing Yta7 [glucose (Glu)] or overexpressing Yta7 [galactose (Gal)]. Cells were grown in YPD or YPGalactose overnight and then diluted into fresh medium of the same type and grown for 6 h until reaching mid-log growth. Values are IP/IN normalized to WT levels in each medium. (B) Representative immunoblot of histone H3 and phosphoglycerate kinase (PGK), as a loading control, on extracts of the above cells, taken immediately before cross-linking. All bands are from the same blot with a sizing ladder lane cropped from the middle. Duplicate lanes for a given genotype represent independent preparations. Quantitation is based on immunoblotting of four separate sample preparations. Values are the ratio of H3 band pixels over the PGK band pixels and are adjusted to the ratio for WT in each medium type. (C) RT-qPCR analysis of H3 transcript levels on the same cultures analyzed in A and B. HHT reflects H3 transcript from both the HHT1 and HHT2 loci.
Discussion
Motivated by the conservation of an AAA-ATPase domain coupled to a bromodomain and by the importance of Yta7's human ortholog, ANCCA, to human health, we investigated how Yta7 might use ATP hydrolysis upon histone interaction. This work established that Yta7 acted to limit nucleosome density, localizing to sites undergoing high rates of replication-independent H3 exchange, where its ATPase domain was required to facilitate gene induction.
Yta7's ATPase-Dependent Role in Gene Induction.
Transcriptional analysis of cells lacking Yta7 demonstrated a broad misregulation of inducible genes in non-inducing conditions. Many non-induced genes exhibited decreased basal expression levels, a property shared with cells lacking the histone variant H2A.Z. Because cells lacking H2A.Z exhibit induction defects for many genes, we tested the role of Yta7 in gene induction. Yta7's ATPase function was required for the proper induction of meiosis- and galactose-induced genes. Further, this induction defect was likely a direct effect of lacking Yta7 activity, because Yta7 was recruited to these genes upon induction. Additionally, Yta7 may be broadly required for gene induction, because many other inducible genes were misregulated in the yta7Δ mutant grown in rich medium (Table S1). The role of Yta7 demonstrated here for gene induction in S. cerevisiae is striking, given that the human ortholog, ANCCA, functions in induction of estradiol- and androgen-induced genes (24, 32).
Molecular Basis of H3 and H4 Dosage Suppression of yta7Δ.
Bulk chromatin of the yta7Δ mutant displayed increased nucleosome occupancy, as observed with micrococcal nuclease analysis. This increase was also evident by H3 ChIP at selected loci. Given that histones H3 and H4 exist in the nucleus only as a heterodimer or tetramer, and that yta7Δ mutants grow better when a copy of the gene encoding either H3 or H4 is deleted (45, 46), we reasoned that histones H3 and H4 would behave similarly in the yta7Δ mutant. Thus, we focused our studies on histone H3, which Yta7 directly binds (28, 30).
It is clear from transcriptional studies in which the dosage of histones H3 and H4 is altered that certain classes of genes, such as inducible genes in non-inducing conditions, are particularly sensitive to nucleosome density, becoming further down-regulated upon increased H3/H4 dosage (57) and inappropriately up-regulated upon decreased dosage (58). The suppression of the yta7Δ mutant's transcriptional defect at these loci by decreased histone H3 and H4 dosage strongly suggested that increased nucleosome density was the source of down-regulation.
Direct Regulation of H3 by Yta7.
Given that Yta7 is a chromatin-associated protein that can directly bind H3, we tested the ability of Yta7 to modulate the level of chromatin-bound H3 directly. In contrast to the yta7Δ mutant, chromatin in cells overexpressing Yta7 was significantly depleted of histone H3. Total levels of histone H3 were also decreased, although H3 transcript levels were not. Thus, our data demonstrated that Yta7 modulated levels of histone H3 protein, independently of perturbations in H3 transcript levels.
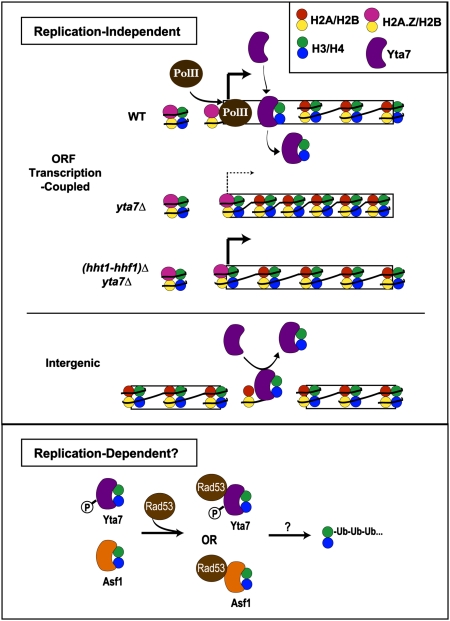
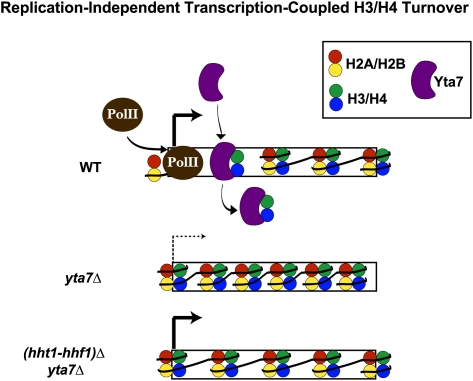
Furthermore, at the inducible FMP27, to which Yta7 localized upon induction, Yta7 was directly required upon induction to prevent the accumulation of H3 throughout the ORF, with an increasing gradient of H3 peaking at the 3′-end of FMP27 in the yta7Δ mutant. Thus, both the global and site-specific data strongly implied that Yta7 helps to limit the amount of H3 in chromatin. The localization of Yta7 to induced genes was consistent with previous evidence that Yta7 is enriched at some of the most highly transcribed genes: FBA1, TEF1, and PMA1 (28, 59). Because replication-independent H3 exchange in ORFs is positively correlated with PolII occupancy (18–20), Yta7's localization was tightly correlated to rates of H3 and H4 turnover in their ORFs. Given the requirement for Yta7 to limit accumulation of chromatin-bound H3 directly at induced FMP27 and more broadly, we propose that Yta7 facilitates the eviction or degradation of histone H3 (Fig. 8). In principle, we could not strictly rule out indirect effects on H3 levels at genes at which Yta7 activity is required for proper transcription. However, Yta7's ability to bind H3 directly suggests that Yta7 directly manipulates H3 at these highly transcribed genes. Further, Yta7's requirement for its AAA-ATPase domain suggests that ATP hydrolysis could provide the requisite energy for eviction or degradation.
Fig. 8.
Potential mechanism of Yta7's limitation of chromatin-bound H3. Our data supported a model in which Yta7 is recruited to highly transcribed genes, where it is necessary to limit the amount and distribution of H3 occupancy, possibly functioning downstream of the histone variant H2A.Z. As depicted, transcriptional defects attributable to the increased nucleosome occupancy in cells without Yta7 were suppressed by decreasing the dosage of histones H3 and H4 (hht1-hhf1)Δ. Because Yta7 also appeared to limit H3 occupancy at intergenic regions, this may further indicate Yta7's role in replication-independent H3 exchange or suggest a modified role in replication-dependent H3 turnover. A possible mechanism of replication-dependent posttranscriptional regulation of H3, as indicated by protein association, is Yta7's collaboration with Rad53 in the H3/H4 degradation pathway. The H3/H4 chaperone, Asf1, has already been implicated in this pathway. Such modulation of Yta7 activity might occur through the purported cell-cycle-regulated post-translational modifications of Yta7. P, phosphorylation; Ub, ubiquitylation.
Presently, it is unclear to what extent the apparent global increase in nucleosome density in the yta7Δ mutant is attributable to defects in transcription-coupled H3 dynamics. However, because the majority of the S. cerevisiae genome is transcribed, global effects on nucleosome density attributable to transcription-coupled processes can be observed, as in the case of cells deficient for transcription-coupled nucleosome reassembly (60). Data for the ORF-free region analyzed in Figs. 5A and 7A suggested that Yta7 also functioned at some intergenic regions, which experience the highest replication-independent H3 turnover rates on average, largely independent of transcription rate (18, 20). Thus, our data were consistent with Yta7 functioning solely in replication-independent regulation of H3. However, the ability to regulate levels of chromatin-associated H3 could also be used for replication-dependent H3 dynamics. Thus, Yta7 may also exert S-phase–specific activity, such as eviction of H3 and H4 at the replication fork or degradation of excess soluble H3 and H4 after replication completion. Indeed, Yta7 associates with Rad53 (61, 62), a kinase that facilitates the ubiquitylation and degradation of excess soluble histones (63). Strikingly, like yta7Δ mutants, the growth defect of rad53 mutants is suppressed by decreasing the dosage of H3 and H4 (64). Further, cell-cycle-specific activities of Yta7 may be reflected by its phosphorylation by Cdk1 (65). Thus, our data were consistent with Yta7 potentially modulating H3 differentially depending on the cell-cycle phase.
Yta7 Targeting.
The functional overlap of Yta7 and H2A.Z displayed by the array analysis prompted us to investigate their potential collaboration in gene induction. Because H2A.Z is also required for proper GAL gene induction (34, 38, 66), we assessed the possibility of functional overlap between Yta7 and H2A.Z at the GAL gene cluster. Strikingly, cells lacking Yta7, H2A.Z localization, or both displayed the same decrease in GAL1 transcript levels. Because H2A.Z is enriched at the GAL gene cluster before induction (66), and thus before Yta7 recruitment, the swr1Δ yta7Δ double-mutant data implied that Yta7 acted downstream of H2A.Z upon GAL gene induction.
Acting downstream of H2A.Z at GAL1 applies to any event occurring subsequent to early transcriptional initiation, because loss of H2A.Z results in decreased TBP recruitment to the GAL1 promoter upon induction (66). Because tiling of the GAL cluster and inducible FMP27 demonstrated a clear 5′-ORF bias in Yta7's localization, Yta7 is likely recruited post-initiation, and thus functionally downstream of H2A.Z. The precise mode of Yta7's recruitment to actively transcribed genes is currently under investigation. However, given Yta7's bromodomain, Yta7's 5′-ORF bias is consistent with targeting by ORF acetylation (67).
Materials and Methods
Yeast Strains and Media.
All yeast strains were derived from W303-1a, except those used in Fig. 2 A and D (listed in Table S2). One-step integration of KO cassettes and C-terminal epitope tags was performed as described (68–70) (primer sequences are listed in Table S3). All gene disruptions were confirmed by 5′- and 3′-junction PCR. Strains containing integrated pGAL1::FMP27 and pGAL1::YTA7 were constructed by insertion as described (68). All epitope tagging was confirmed by immunoblotting as described below. Yta7-TAP provided full Yta7 function, as assayed by heterochromatin boundary function.
The YTA7 clone was generated by PCR amplification of genomic DNA with primers adding 40 bp of homology to HindIII- and EcoRI-digested pRS316. This product was cotransformed with doubly digested pRS316. The complementing clone (pJR2860) contained ∼400 bp upstream and ∼300 bp downstream intergenic sequence (Table S3). Site-directed mutagenesis of pJR2860 was performed to generate the point mutants yta7K460A (pJR2861) and yta7E519Q (pJR2862).
Transformants of SK1 were generated by electroporation. Briefly, mid-log phase cells were incubated in 10 mM Tris-1 mM EDTA (TE) with 100 mM lithium acetate for 45 min at 30 °C. DTT was added to 25 mM, and the cells were left at 30 °C for another 15 min. Cells were then washed with water and once with 1 M cold sorbitol. Cells were electroporated at 1.5 kV, 25 μF, 200 Ω and then immediately resuspended in 1 M cold sorbitol. Cells were plated on selective medium containing 1 M sorbitol. Transformations were performed in diploids. Heterozygous diploids were sporulated, and homozygous diploids were produced by single-cell matings. Synchronous meiotic entry was achieved as previously described (71).
For galactose induction experiments, cells were grown to an OD600 of 0.6 in YPRaffinose (2%); at that point, prewarmed 20% galactose was added to a final concentration of 2%. Unless otherwise indicated, all “+ Gal” data points represent 1 h after induction. All solution percentages are wt/vol.
Microarrays.
Cultures were grown at 30 °C to an OD600 of 0.8–1. RNA was extracted with hot acid phenol as described (72). A denaturing gel was run to assess the quality of the RNA. For each experiment, 20 μg of total RNA from each strain and 20 μg of total RNA from a pooled reference were primed with 5 μg/μL oligo dT and 5 μg/μL pdN15 for 10 min at 70 °C, followed by 10 min on ice. Roche Transcriptor was used for RT with a 3:2 ratio of amino-allyl-dUTP/dTTP. Reactions were performed at 42 °C for 12 h. Residual RNA was then hydrolyzed with 250 mM NaOH for 15 min at 65 °C. cDNA was isolated from this mixture via a Qiagen MinElute Reaction Cleanup Kit. After dye coupling (Cy3 and Cy5; Amersham) for 2 h at room temperature, the cDNA was purified with the MinElute Reaction Cleanup Kit and quantified with a Nanodrop spectrophotometer (Thermo Scientific). Reference cDNA was pooled, and equal amounts were mixed with each experimental sample. Hybridizations were performed for 12–14 h at 65 °C using the MAUI Hybridization System (BioMicro Systems).
Custom microarrays were fabricated as described (73) at the University of California, San Francisco, Center for Advanced Technology with Operon's Aros V1.1 and Yeast Brown laboratory Oligo eXtension (YBOX) 70-mer probes. Specific protocols for array printing, postprocessing, and washing are available at http://cat.ucsf.edu.
After washing, the arrays were scanned on a Genepix 4000B scanner (Molecular Devices) and the images were analyzed using Genepix Pro-6.1 (Molecular Devices) software. After removing poor-quality spots, the data were corrected using TiGR MIDAS v2.20 locally weighted scatterplot smoothing (LOWESS) normalization. Analysis was performed using TiGR MeV version 3.1 (74). Significantly affected genes were determined using the SAM statistical package (75), with a 1.5 median false gene cutoff.
RNA Isolation and Quantitative RT-PCR.
RNA isolation for all experiments except those illustrated in Figs. 2C and 7C and Figs. S2 and S3 was performed using the hot-phenol method (72). Total RNA was digested with DNase I (Roche) and purified using an RNeasy MinElute kit (Qiagen). RNA for the experiments illustrated in Figs. 2C and 7C and Figs. S2 and S3 was isolated directly from whole-cell extract using an RNeasy Mini kit (Qiagen) with on-column DNase I (Qiagen) digestion. cDNA was synthesized using a Super-Script III First-Strand Synthesis System (Invitrogen). Oligo(dT) priming was used for all experiments except those illustrated in Figs. S2–S4, for which random hexamer priming was used. Quantitative PCR (qPCR) on cDNA was performed using an MX3000P qPCR machine (Agilent) and a Dynamo HS SYBR Green qPCR kit (NEB). Amplification values for all primer sets were normalized to actin (ACT1) cDNA amplification values. Samples were analyzed in technical triplicate for three or four independent RNA preparations.
ChIP Analysis.
All cells were cross-linked with 1% formaldehyde at an OD600 of 0.6–0.9. For Yta7-TAP ChIP experiments, cells were cross-linked for 45 min at 30 °C. For H3 and Rpb3-3HA ChIP experiments, cells were cross-linked for 20 min at room temperature. Cross-linking was quenched by addition of glycine to a final concentration of 300 mM. Cells were then washed twice with Tris-buffered saline and lysed with 0.5-mm zirconia beads in FA lysis buffer (76) using the MP Fastprep-24. For Yta7-TAP ChIP, chromatin was isolated at 74,000 × g for 36 min and then washed for 1 h at 4 °C. Sonication yielded an average sheared DNA size of 400–500 bp.
For H3 and Rpb3-3HA ChIP, chromatin was isolated as described (76). For Yta7-TAP immunoprecipitations (IP), 30 μL of IgG Sepharose (GE Healthcare) was incubated for 1.5 h at 4 °C with sonicated chromatin from 150 mL of culture at ∼0.6 OD600. For H3 IP, 1.5 μg of rabbit α-H3 (ab1971; Abcam) was incubated overnight at 4 °C with 25 μL of Protein A Sepharose (GE Healthcare) and sonicated chromatin from 15 OD600 units of cells. For Rpb3-3HA IP, 25 μL of monoclonal anti–HA-agarose (Sigma) was incubated overnight at 4 °C with sonicated chromatin from 30 OD600 units of cells. Resin washing, IP elution, and DNA purification were performed as described (76). qPCR was performed on precipitated DNA fragments as described above. The negative control primer set for Yta7-TAP ChIP amplifies a region within the PRP8 ORF and was chosen as an internal control because it corresponded to a locus with an IP/Input (IP/IN) signal consistently indistinguishable from the no-tag control. Yta7-TAP ChIP values are presented as IPx/IPPRP8. Because a negative control region is not possible for H3, presented values are IP/IN.
Micrococcal Nuclease Digestion.
Digests were performed largely as described (77), with the following modifications. One hundred milliliters of cells at ∼1.0 OD600 was harvested. Cells were washed once in Pre-spheroplast Buffer [20 mM KPO4 (pH 7.0), 1 M sorbitol, 10 mM DTT] and then incubated in Spheroplast Buffer [20 mM KPO4 (pH 7.0), 1.1 M sorbitol, 0.5 mM CaCl2, 0.5 mM PMSF, 1.2 mg/mL Zymolyase 100T] for 30 min at 30 °C. Extent of spheroplasting was assessed by absorbance readings of dilutions into 1% SDS. Micrococcal nuclease digests were performed in parallel for 10 min at 37 °C. Reactions were promptly stopped by addition of EDTA and SDS to final concentrations of 25 mM and 0.5%, respectively. Isolated DNA was quantified by Nanodrop, and 25 μg of each sample was electrophoretically separated on a 2% agarose gel. Nucleosome repeat lengths were estimated as described (52). Briefly, the base-pair length of each band was calculated from gel images of micrococcal nuclease digests (2 biological replicates), and the slope of these sizes as a function of nucleosome number (1–4) was determined.
Protein Analysis.
Fifteen milliliters of cells at an OD600 of ∼1.0 was collected. Yeast whole-cell extracts were prepared by resuspending cells in 20% trichloroacetic acid (TCA) and performing mechanical lysis with 0.5-mm zirconia beads. Supernatant was removed, and beads were washed three times with 5% TCA. The supernatants were pooled after each wash, and precipitated proteins were collected by centrifugation. Pellets were air-dried and resuspended in 75 μL of 3× SDS sample buffer and 37.5 μL of 1 M Tris base. Samples were boiled and spun. The supernatant was then evaluated by standard SDS/PAGE and immunoblotting. Detection and quantitation were performed with the Li-cor Odyssey imaging system. Antibodies used for immunoblotting were rabbit anti-H3 antibody (ab1791; Abcam) and, as a loading control, mouse anti-phosphoglycerate kinase antibody (no. 459250; Invitrogen).
Supplementary Material
Acknowledgments
We thank Kevin Struhl, Fred Winston, and Toshio Tsukiyama for insightful critiques and suggestions. We greatly appreciate the fruitful discussions and support of Mike Botchan, Barbara Meyer, Robert Fischer, and Jay Hollick. We are grateful to David Donze and Josh Babiarz for strains and to Bryan Clarkson and Jesse Patterson for generous assistance in expression array production and analysis. We thank Meru Sadhu, Oliver Zill, Rachel Zunder, and Jody Westbrook for critical analysis and discussions of this work. This work was supported by National Institutes of Health Grants GM31105 and T32 GM 007232 and a National Science Foundation predoctoral fellowship (to A.E.).
Footnotes
The authors declare no conflict of interest.
See Author Summary on page 19461.
This article contains supporting information online at www.pnas.org/lookup/suppl/doi:10.1073/pnas.1116819108/-/DCSupplemental.
References
- 1.Luger K, Mäder AW, Richmond RK, Sargent DF, Richmond TJ. Crystal structure of the nucleosome core particle at 2.8 A resolution. Nature. 1997;389:251–260. doi: 10.1038/38444. [DOI] [PubMed] [Google Scholar]
- 2.Campos EI, Reinberg D. Histones: Annotating chromatin. Annu Rev Genet. 2009;43:559–599. doi: 10.1146/annurev.genet.032608.103928. [DOI] [PubMed] [Google Scholar]
- 3.Talbert PB, Henikoff S. Histone variants—Ancient wrap artists of the epigenome. Nat Rev Mol Cell Biol. 2010;11:264–275. doi: 10.1038/nrm2861. [DOI] [PubMed] [Google Scholar]
- 4.Jiang C, Pugh BF. Nucleosome positioning and gene regulation: Advances through genomics. Nat Rev Genet. 2009;10:161–172. doi: 10.1038/nrg2522. [DOI] [PMC free article] [PubMed] [Google Scholar]
- 5.Radman-Livaja M, Rando OJ. Nucleosome positioning: How is it established, and why does it matter? Dev Biol. 2010;339:258–266. doi: 10.1016/j.ydbio.2009.06.012. [DOI] [PMC free article] [PubMed] [Google Scholar]
- 6.Cairns BR. The logic of chromatin architecture and remodelling at promoters. Nature. 2009;461:193–198. doi: 10.1038/nature08450. [DOI] [PubMed] [Google Scholar]
- 7.Jin C, Felsenfeld G. Nucleosome stability mediated by histone variants H3.3 and H2A.Z. Genes Dev. 2007;21:1519–1529. doi: 10.1101/gad.1547707. [DOI] [PMC free article] [PubMed] [Google Scholar]
- 8.Kumar SV, Wigge PA. H2A.Z-containing nucleosomes mediate the thermosensory response in Arabidopsis. Cell. 2010;140:136–147. doi: 10.1016/j.cell.2009.11.006. [DOI] [PubMed] [Google Scholar]
- 9.Belotserkovskaya R, et al. FACT facilitates transcription-dependent nucleosome alteration. Science. 2003;301:1090–1093. doi: 10.1126/science.1085703. [DOI] [PubMed] [Google Scholar]
- 10.Xin H, et al. yFACT induces global accessibility of nucleosomal DNA without H2A-H2B displacement. Mol Cell. 2009;35:365–376. doi: 10.1016/j.molcel.2009.06.024. [DOI] [PMC free article] [PubMed] [Google Scholar]
- 11.Orphanides G, LeRoy G, Chang CH, Luse DS, Reinberg D. FACT, a factor that facilitates transcript elongation through nucleosomes. Cell. 1998;92:105–116. doi: 10.1016/s0092-8674(00)80903-4. [DOI] [PubMed] [Google Scholar]
- 12.Kireeva ML, et al. Nucleosome remodeling induced by RNA polymerase II: Loss of the H2A/H2B dimer during transcription. Mol Cell. 2002;9:541–552. doi: 10.1016/s1097-2765(02)00472-0. [DOI] [PubMed] [Google Scholar]
- 13.Thiriet C, Hayes JJ. Replication-independent core histone dynamics at transcriptionally active loci in vivo. Genes Dev. 2005;19:677–682. doi: 10.1101/gad.1265205. [DOI] [PMC free article] [PubMed] [Google Scholar]
- 14.Ahmad K, Henikoff S. The histone variant H3.3 marks active chromatin by replication-independent nucleosome assembly. Mol Cell. 2002;9:1191–1200. doi: 10.1016/s1097-2765(02)00542-7. [DOI] [PubMed] [Google Scholar]
- 15.Chow CM, et al. Variant histone H3.3 marks promoters of transcriptionally active genes during mammalian cell division. EMBO Rep. 2005;6:354–360. doi: 10.1038/sj.embor.7400366. [DOI] [PMC free article] [PubMed] [Google Scholar]
- 16.Sutcliffe EL, et al. Dynamic histone variant exchange accompanies gene induction in T cells. Mol Cell Biol. 2009;29:1972–1986. doi: 10.1128/MCB.01590-08. [DOI] [PMC free article] [PubMed] [Google Scholar]
- 17.Jin C, et al. H3.3/H2A.Z double variant-containing nucleosomes mark ‘nucleosome-free regions’ of active promoters and other regulatory regions. Nat Genet. 2009;41:941–945. doi: 10.1038/ng.409. [DOI] [PMC free article] [PubMed] [Google Scholar]
- 18.Rufiange A, Jacques PE, Bhat W, Robert F, Nourani A. Genome-wide replication-independent histone H3 exchange occurs predominantly at promoters and implicates H3 K56 acetylation and Asf1. Mol Cell. 2007;27:393–405. doi: 10.1016/j.molcel.2007.07.011. [DOI] [PubMed] [Google Scholar]
- 19.Jamai A, Imoberdorf RM, Strubin M. Continuous histone H2B and transcription-dependent histone H3 exchange in yeast cells outside of replication. Mol Cell. 2007;25:345–355. doi: 10.1016/j.molcel.2007.01.019. [DOI] [PubMed] [Google Scholar]
- 20.Dion MF, et al. Dynamics of replication-independent histone turnover in budding yeast. Science. 2007;315:1405–1408. doi: 10.1126/science.1134053. [DOI] [PubMed] [Google Scholar]
- 21.Kulaeva OI, Hsieh FK, Studitsky VM. RNA polymerase complexes cooperate to relieve the nucleosomal barrier and evict histones. Proc Natl Acad Sci USA. 2010;107:11325–11330. doi: 10.1073/pnas.1001148107. [DOI] [PMC free article] [PubMed] [Google Scholar]
- 22.Adkins MW, Tyler JK. The histone chaperone Asf1p mediates global chromatin disassembly in vivo. J Biol Chem. 2004;279:52069–52074. doi: 10.1074/jbc.M406113200. [DOI] [PubMed] [Google Scholar]
- 23.Schwabish MA, Struhl K. Asf1 mediates histone eviction and deposition during elongation by RNA polymerase II. Mol Cell. 2006;22:415–422. doi: 10.1016/j.molcel.2006.03.014. [DOI] [PubMed] [Google Scholar]
- 24.Zou JX, et al. Androgen-induced coactivator ANCCA mediates specific androgen receptor signaling in prostate cancer. Cancer Res. 2009;69:3339–3346. doi: 10.1158/0008-5472.CAN-08-3440. [DOI] [PubMed] [Google Scholar]
- 25.Kalashnikova EV, et al. ANCCA/ATAD2 overexpression identifies breast cancer patients with poor prognosis, acting to drive proliferation and survival of triple-negative cells through control of B-Myb and EZH2. Cancer Res. 2010;70:9402–9412. doi: 10.1158/0008-5472.CAN-10-1199. [DOI] [PMC free article] [PubMed] [Google Scholar]
- 26.Jambunathan N, et al. Multiple bromodomain genes are involved in restricting the spread of heterochromatic silencing at the Saccharomyces cerevisiae HMR-tRNA boundary. Genetics. 2005;171:913–922. doi: 10.1534/genetics.105.046938. [DOI] [PMC free article] [PubMed] [Google Scholar]
- 27.Tackett AJ, et al. Proteomic and genomic characterization of chromatin complexes at a boundary. J Cell Biol. 2005;169:35–47. doi: 10.1083/jcb.200502104. [DOI] [PMC free article] [PubMed] [Google Scholar]
- 28.Gradolatto A, et al. Saccharomyces cerevisiae Yta7 regulates histone gene expression. Genetics. 2008;179:291–304. doi: 10.1534/genetics.107.086520. [DOI] [PMC free article] [PubMed] [Google Scholar]
- 29.Fillingham J, et al. Two-color cell array screen reveals interdependent roles for histone chaperones and a chromatin boundary regulator in histone gene repression. Mol Cell. 2009;35:340–351. doi: 10.1016/j.molcel.2009.06.023. [DOI] [PubMed] [Google Scholar]
- 30.Gradolatto A, et al. A noncanonical bromodomain in the AAA ATPase protein Yta7 directs chromosomal positioning and barrier chromatin activity. Mol Cell Biol. 2009;29:4604–4611. doi: 10.1128/MCB.00160-09. [DOI] [PMC free article] [PubMed] [Google Scholar]
- 31.Erzberger JP, Berger JM. Evolutionary relationships and structural mechanisms of AAA+ proteins. Annu Rev Biophys Biomol Struct. 2006;35:93–114. doi: 10.1146/annurev.biophys.35.040405.101933. [DOI] [PubMed] [Google Scholar]
- 32.Zou JX, Revenko AS, Li LB, Gemo AT, Chen HW. ANCCA, an estrogen-regulated AAA+ ATPase coactivator for ERalpha, is required for coregulator occupancy and chromatin modification. Proc Natl Acad Sci USA. 2007;104:18067–18072. doi: 10.1073/pnas.0705814104. [DOI] [PMC free article] [PubMed] [Google Scholar]
- 33.Revenko AS, Kalashnikova EV, Gemo AT, Zou JX, Chen HW. Chromatin loading of E2F-MLL complex by cancer-associated coregulator ANCCA via reading a specific histone mark. Mol Cell Biol. 2010;30:5260–5272. doi: 10.1128/MCB.00484-10. [DOI] [PMC free article] [PubMed] [Google Scholar]
- 34.Santisteban MS, Kalashnikova T, Smith MM. Histone H2A.Z regulates transcription and is partially redundant with nucleosome remodeling complexes. Cell. 2000;103:411–422. doi: 10.1016/s0092-8674(00)00133-1. [DOI] [PubMed] [Google Scholar]
- 35.Zhang H, Roberts DN, Cairns BR. Genome-wide dynamics of Htz1, a histone H2A variant that poises repressed/basal promoters for activation through histone loss. Cell. 2005;123:219–231. doi: 10.1016/j.cell.2005.08.036. [DOI] [PMC free article] [PubMed] [Google Scholar]
- 36.Gévry N, et al. Histone H2A.Z is essential for estrogen receptor signaling. Genes Dev. 2009;23:1522–1533. doi: 10.1101/gad.1787109. [DOI] [PMC free article] [PubMed] [Google Scholar]
- 37.Wan Y, et al. Role of the histone variant H2A.Z/Htz1p in TBP recruitment, chromatin dynamics, and regulated expression of oleate-responsive genes. Mol Cell Biol. 2009;29:2346–2358. doi: 10.1128/MCB.01233-08. [DOI] [PMC free article] [PubMed] [Google Scholar]
- 38.Halley JE, Kaplan T, Wang AY, Kobor MS, Rine J. Roles for H2A.Z and its acetylation in GAL1 transcription and gene induction, but not GAL1-transcriptional memory. PLoS Biol. 2010;8:e1000401. doi: 10.1371/journal.pbio.1000401. [DOI] [PMC free article] [PubMed] [Google Scholar]
- 39.Primig M, et al. The core meiotic transcriptome in budding yeasts. Nat Genet. 2000;26:415–423. doi: 10.1038/82539. [DOI] [PubMed] [Google Scholar]
- 40.Hanson PI, Whiteheart SW. AAA+ proteins: Have engine, will work. Nat Rev Mol Cell Biol. 2005;6:519–529. doi: 10.1038/nrm1684. [DOI] [PubMed] [Google Scholar]
- 41.Simic R, et al. Chromatin remodeling protein Chd1 interacts with transcription elongation factors and localizes to transcribed genes. EMBO J. 2003;22:1846–1856. doi: 10.1093/emboj/cdg179. [DOI] [PMC free article] [PubMed] [Google Scholar]
- 42.Formosa T. FACT and the reorganized nucleosome. Mol Biosyst. 2008;4:1085–1093. doi: 10.1039/b812136b. [DOI] [PubMed] [Google Scholar]
- 43.Lambert JP, Mitchell L, Rudner A, Baetz K, Figeys D. A novel proteomics approach for the discovery of chromatin-associated protein networks. Mol Cell Proteomics. 2009;8:870–882. doi: 10.1074/mcp.M800447-MCP200. [DOI] [PMC free article] [PubMed] [Google Scholar]
- 44.Lambert JP, et al. Defining the budding yeast chromatin-associated interactome. Mol Syst Biol. 2010;6:448. doi: 10.1038/msb.2010.104. [DOI] [PMC free article] [PubMed] [Google Scholar]
- 45.Collins SR, et al. Functional dissection of protein complexes involved in yeast chromosome biology using a genetic interaction map. Nature. 2007;446:806–810. doi: 10.1038/nature05649. [DOI] [PubMed] [Google Scholar]
- 46.Costanzo M, et al. The genetic landscape of a cell. Science. 2010;327:425–431. doi: 10.1126/science.1180823. [DOI] [PMC free article] [PubMed] [Google Scholar]
- 47.Osley MA, Lycan D. Trans-acting regulatory mutations that alter transcription of Saccharomyces cerevisiae histone genes. Mol Cell Biol. 1987;7:4204–4210. doi: 10.1128/mcb.7.12.4204. [DOI] [PMC free article] [PubMed] [Google Scholar]
- 48.Xu H, Kim UJ, Schuster T, Grunstein M. Identification of a new set of cell cycle-regulatory genes that regulate S-phase transcription of histone genes in Saccharomyces cerevisiae. Mol Cell Biol. 1992;12:5249–5259. doi: 10.1128/mcb.12.11.5249. [DOI] [PMC free article] [PubMed] [Google Scholar]
- 49.Mason PB, Struhl K. Distinction and relationship between elongation rate and processivity of RNA polymerase II in vivo. Mol Cell. 2005;17:831–840. doi: 10.1016/j.molcel.2005.02.017. [DOI] [PubMed] [Google Scholar]
- 50.Mavrich TN, et al. A barrier nucleosome model for statistical positioning of nucleosomes throughout the yeast genome. Genome Res. 2008;18:1073–1083. doi: 10.1101/gr.078261.108. [DOI] [PMC free article] [PubMed] [Google Scholar]
- 51.Lantermann AB, et al. Schizosaccharomyces pombe genome-wide nucleosome mapping reveals positioning mechanisms distinct from those of Saccharomyces cerevisiae. Nat Struct Mol Biol. 2010;17:251–257. doi: 10.1038/nsmb.1741. [DOI] [PubMed] [Google Scholar]
- 52.Godde JS, Widom J. Chromatin structure of Schizosaccharomyces pombe. A nucleosome repeat length that is shorter than the chromatosomal DNA length. J Mol Biol. 1992;226:1009–1025. doi: 10.1016/0022-2836(92)91049-u. [DOI] [PubMed] [Google Scholar]
- 53.Auerbach RK, et al. Mapping accessible chromatin regions using Sono-Seq. Proc Natl Acad Sci USA. 2009;106:14926–14931. doi: 10.1073/pnas.0905443106. [DOI] [PMC free article] [PubMed] [Google Scholar]
- 54.Teytelman L, et al. Impact of chromatin structures on DNA processing for genomic analyses. PLoS ONE. 2009;4:e6700. doi: 10.1371/journal.pone.0006700. [DOI] [PMC free article] [PubMed] [Google Scholar]
- 55.Kristjuhan A, Svejstrup JQ. Evidence for distinct mechanisms facilitating transcript elongation through chromatin in vivo. EMBO J. 2004;23:4243–4252. doi: 10.1038/sj.emboj.7600433. [DOI] [PMC free article] [PubMed] [Google Scholar]
- 56.Schwabish MA, Struhl K. Evidence for eviction and rapid deposition of histones upon transcriptional elongation by RNA polymerase II. Mol Cell Biol. 2004;24:10111–10117. doi: 10.1128/MCB.24.23.10111-10117.2004. [DOI] [PMC free article] [PubMed] [Google Scholar]
- 57.Singh RK, et al. Excess histone levels mediate cytotoxicity via multiple mechanisms. Cell Cycle. 2010;9:4236–4244. doi: 10.4161/cc.9.20.13636. [DOI] [PMC free article] [PubMed] [Google Scholar]
- 58.Wyrick JJ, et al. Chromosomal landscape of nucleosome-dependent gene expression and silencing in yeast. Nature. 1999;402:418–421. doi: 10.1038/46567. [DOI] [PubMed] [Google Scholar]
- 59.Holstege FC, et al. Dissecting the regulatory circuitry of a eukaryotic genome. Cell. 1998;95:717–728. doi: 10.1016/s0092-8674(00)81641-4. [DOI] [PubMed] [Google Scholar]
- 60.Celona B, et al. Substantial histone reduction modulates genomewide nucleosomal occupancy and global transcriptional output. PLoS Biol. 2011;9:e1001086. doi: 10.1371/journal.pbio.1001086. [DOI] [PMC free article] [PubMed] [Google Scholar]
- 61.Smolka MB, et al. Dynamic changes in protein-protein interaction and protein phosphorylation probed with amine-reactive isotope tag. Mol Cell Proteomics. 2005;4:1358–1369. doi: 10.1074/mcp.M500115-MCP200. [DOI] [PMC free article] [PubMed] [Google Scholar]
- 62.Breitkreutz A, et al. A global protein kinase and phosphatase interaction network in yeast. Science. 2010;328:1043–1046. doi: 10.1126/science.1176495. [DOI] [PMC free article] [PubMed] [Google Scholar]
- 63.Singh RK, Kabbaj MH, Paik J, Gunjan A. Histone levels are regulated by phosphorylation and ubiquitylation-dependent proteolysis. Nat Cell Biol. 2009;11:925–933. doi: 10.1038/ncb1903. [DOI] [PMC free article] [PubMed] [Google Scholar]
- 64.Gunjan A, Verreault A. A Rad53 kinase-dependent surveillance mechanism that regulates histone protein levels in S. cerevisiae. Cell. 2003;115:537–549. doi: 10.1016/s0092-8674(03)00896-1. [DOI] [PubMed] [Google Scholar]
- 65.Ubersax JA, et al. Targets of the cyclin-dependent kinase Cdk1. Nature. 2003;425:859–864. doi: 10.1038/nature02062. [DOI] [PubMed] [Google Scholar]
- 66.Adam M, Robert F, Larochelle M, Gaudreau L. H2A.Z is required for global chromatin integrity and for recruitment of RNA polymerase II under specific conditions. Mol Cell Biol. 2001;21:6270–6279. doi: 10.1128/MCB.21.18.6270-6279.2001. [DOI] [PMC free article] [PubMed] [Google Scholar]
- 67.Li B, Carey M, Workman JL. The role of chromatin during transcription. Cell. 2007;128:707–719. doi: 10.1016/j.cell.2007.01.015. [DOI] [PubMed] [Google Scholar]
- 68.Longtine MS, et al. Additional modules for versatile and economical PCR-based gene deletion and modification in Saccharomyces cerevisiae. Yeast. 1998;14:953–961. doi: 10.1002/(SICI)1097-0061(199807)14:10<953::AID-YEA293>3.0.CO;2-U. [DOI] [PubMed] [Google Scholar]
- 69.Goldstein AL, McCusker JH. Three new dominant drug resistance cassettes for gene disruption in Saccharomyces cerevisiae. Yeast. 1999;15:1541–1553. doi: 10.1002/(SICI)1097-0061(199910)15:14<1541::AID-YEA476>3.0.CO;2-K. [DOI] [PubMed] [Google Scholar]
- 70.Puig O, et al. The tandem affinity purification (TAP) method: A general procedure of protein complex purification. Methods. 2001;24:218–229. doi: 10.1006/meth.2001.1183. [DOI] [PubMed] [Google Scholar]
- 71.Cao L, Alani E, Kleckner N. A pathway for generation and processing of double-strand breaks during meiotic recombination in S. cerevisiae. Cell. 1990;61:1089–1101. doi: 10.1016/0092-8674(90)90072-m. [DOI] [PubMed] [Google Scholar]
- 72.Collart MA, Oliviero S. Preparation of yeast RNA. Curr Protoc Mol Biol. 2001;Chapter 13:Unit 13.12. doi: 10.1002/0471142727.mb1312s23. [DOI] [PubMed] [Google Scholar]
- 73.DeRisi JL, Iyer VR, Brown PO. Exploring the metabolic and genetic control of gene expression on a genomic scale. Science. 1997;278:680–686. doi: 10.1126/science.278.5338.680. [DOI] [PubMed] [Google Scholar]
- 74.Saeed AI, et al. TM4 microarray software suite. Methods Enzymol. 2006;411:134–193. doi: 10.1016/S0076-6879(06)11009-5. [DOI] [PubMed] [Google Scholar]
- 75.Tusher VG, Tibshirani R, Chu G. Significance analysis of microarrays applied to the ionizing radiation response. Proc Natl Acad Sci USA. 2001;98:5116–5121. doi: 10.1073/pnas.091062498. [DOI] [PMC free article] [PubMed] [Google Scholar]
- 76.Aparicio O, et al. Chromatin immunoprecipitation for determining the association of proteins with specific genomic sequences in vivo. Curr Protoc Mol Biol. 2005;Chapter 21:Unit 21.3. doi: 10.1002/0471142727.mb2103s69. [DOI] [PubMed] [Google Scholar]
- 77.Lam FH, Steger DJ, O'Shea EK. Protocol Exchange. 2008. Mapping nucleosome position in S. cerevisiae by quantitative PCR. 10.1038/nprot.2008.121. [Google Scholar]


