Abstract
We performed label-free observation of molecular dynamics in apoptotic cells by Raman microscopy. Dynamic changes in cytochrome c distribution at the Raman band of 750 cm-1 were observed after adding an apoptosis inducer to the cells. The comparison of mitochondria fluorescence images and Raman images of cytochrome c confirmed that changes in cytochrome c distribution can be distinguished as release of cytochrome c from mitochondria. Our observation also revealed that the redox state of cytochrome c was maintained during the release from the mitochondria. Monitoring mitochondrial membrane potential with JC-1 dye confirmed that the observed cytochrome c release was associated with apoptosis.
Keywords: label-free imaging, protein signaling, Raman microscopy, redox state
Raman scattering has been used for label-free observation of biological molecules since it can detect vibrational frequencies of molecules in living specimens. Since molecular vibrations are strongly related to molecular structure, condition, and environment, the combination of spontaneous Raman scattering and optical microscopy allows us to monitor both the location and condition of biological molecules in living cells (1–6). Recent highly sensitive spectroscopic imaging techniques based on nonlinear optical phenomena such as coherent anti-Stokes Raman scattering (CARS) and stimulated Raman scattering (SRS) also have been applied to observe cellular molecules or drug distribution in cells and tissues, advancing label-free imaging as a powerful technique for investigation of biological samples (7, 8).
Spontaneous Raman microscopy can record the ensemble cell spectral information, allowing simultaneous observation of multiple molecules participating in dynamic cellular events such as apoptosis. Apoptosis is regulated cell death and controls cell homeostasis, tissue atrophy, and protects against serious disorders such as cancer, AIDS, and autoimmune diseases (9). Since the apoptotic mechanism is complicated and involves a large variety of molecules, spontaneous Raman imaging can play a vital role in revealing apoptosis pathways. Previously, biological assays such as western blotting, two-hybrid system, and immunostaining methods have been performed to investigate the apoptotic process with molecular specificity. These assays are extremely useful and provide valuable information about the biological molecules associated with apoptosis. However, these methodologies cannot directly investigate the dynamics of biological molecules, and disruption of the sample or introduction of chemical labels into the cell during the measurement may alter the biological conditions. Raman microscopy enables us to observe the dynamics of intracellular molecules during apoptosis in a natural environment because it does not require any labeling.
We observed translocation of cytochrome c from mitochondria to the cytosol during apoptosis. Cytochrome c acts as a trigger of caspase cascade activation, resulting in the disassembly of proteins (9). Observation of the dynamics of cytochrome c therefore reveals the initiation of apoptosis before morphological changes in the apoptotic cell are visible. We utilized resonant Raman scattering of cytochrome c using a 532 nm wavelength excitation laser. Cytochrome c absorbs visible light at a wavelength of around 530 nm, enhancing the Raman scattering cross-section, and allows high contrast spatial distribution imaging (10). With the combination of a slit-scanning technique using line-shaped illumination, we performed label-free observation of cytochrome c translocation with a temporal resolution of ten min or less (11, 12). The details of the slit-scanning Raman microscope are described in Materials and Methods, and Fig. S1.
Results and Discussion
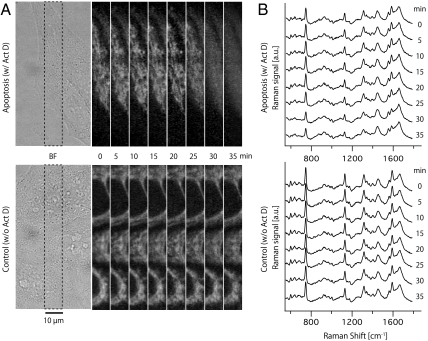
Fig. 1A shows the resulting bright-field and time-lapse Raman images of apoptotic cells, reconstructed from the distribution of the Raman scattering intensity at 750 cm-1, which is assigned to pyrrole breathing mode ν15 in cytochrome c (11). The cells were incubated with Actinomycin D (Act D), which inhibits RNA synthesis and induces apoptosis (13), and Raman imaging was performed at 5 min intervals 7 h after the treatment by Act D. After 25 min of observation, the Raman signal distribution was seen to diffuse into the cell body as shown in Fig. 1A. This diffusion of the signal continued for 10 min, and no further significant change in the distribution was observed. Cells observed without Act D incubation showed no distribution change in the Raman peak intensity at 750 cm-1.
Fig. 1.
(A) Bright-field and time-lapse Raman images of cytochrome c distribution in label-free HeLa cells. The area indicated with the dotted line was observed by Raman microscopy. The images were taken at 5 min intervals with a frame rate of 80 s/images and reconstructed by Raman signal intensity at 750 cm-1. The images consist of 20 × 360 pixels. (B) Time-lapse observation of averaged Raman spectra obtained from cytosol (180 pixels). Raman signals at 750, 1127, 1314, and 1585 cm-1 are assigned to the vibrational mode of cytochrome c.
Fig. 1B shows the time series of Raman spectra obtained from the cellular cytoplasm. Each spectrum in Fig. 1B was averaged from 180 points (see Fig. S2). The decrease of Raman signals assigned to cytochrome c was observed in the cell incubated with Act D, corresponding to the release of cytochrome c and subsequent diffusion through the cell. The intensity of other Raman bands remained at similar intensities during the observation. The shape of the Raman spectrum also reflects the redox state of cytochrome c (14), which has been reported to change during apoptosis (15). In Fig. 1B, the positions of the Raman peaks correspond to those of cytochrome c in the reduced state, and the relative peak intensity is almost similar to that in the control result (cells imaged without Act D) shown in Fig. 1B. This implies that the redox state of most cytochrome c is maintained during the release from the mitochondria in this observation.
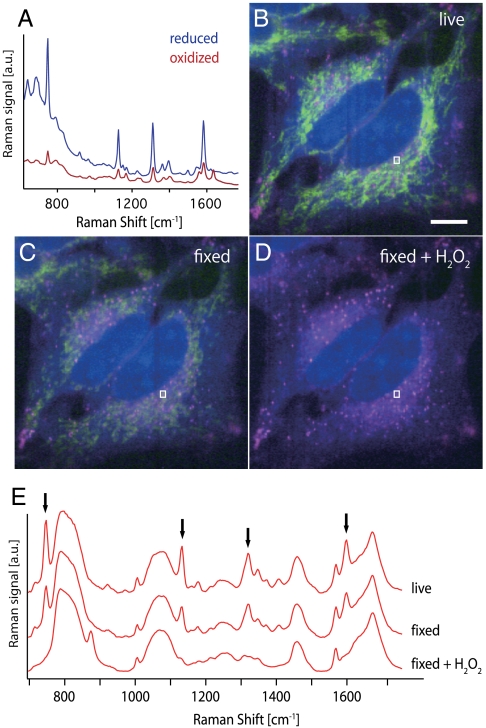
To further investigate the redox state of cytochrome c, we have obtained the Raman spectra of a cytochrome c solution in reduced and oxidized forms, shown in Fig. 2A at 532 nm excitation. Aside from the change of peak positions, the Raman spectra for reduced and oxidized forms show a significant difference in the Raman signal intensity. From this result and the fact that the peak intensity of the Raman signals in early apoptotic cells was maintained at a similar level to control cells, our observation indicates that the cytochrome c does not change the redox state as it is released from mitochondria. To confirm that the Raman signal actually decreases during oxidization of cytochrome c in a cell, we obtained Raman images of live, and then paraformaldehyde fixed HeLa cells, which were then treated with H2O2, to ensure the oxidization of cytochrome c. We then compared the images of the same cells: live, after fixation, and then after additional H2O2 treatment, as shown in Fig. 2B, C, and D. The comparison of the images clearly shows that the oxidized cytochrome c cannot produce a Raman signal high enough to be detected in the cells. Fig. 2E shows the Raman spectra averaged in the region indicated by the white line in each image. The Raman peaks assigned to cytochrome c (indicated with the arrows) decreased in the fixed cell and totally disappeared with H2O2. These results imply that the respiratory function in mitochondria may not be degraded significantly during stimulation by Act D, which is supported by the fact that Act D actually induces apoptosis by interfering with RNA synthesis.
Fig. 2.
(A) Raman spectra of a cytochrome c solution under the reduced and oxidized state. The reduction of cytochrome c was done by using ascorbic acid. (B) Raman images of living HeLa cells, and the same cells were observed after (C) the paraformaldehyde fixation and (D) the H2O2 treatment following the fixation. For each image, Raman intensities at 750, 1686, and 2857 cm-1, which can be assigned to cytochrome c, Amide-I, and CH2 stretching vibration mode, are mapped in green, blue, and red, respectively. The contrast of the images was tuned in the same signal range so that the signal intensities can be compared between the images. The images consist of 20 × 360 pixels. Scale bar, 10 μm.
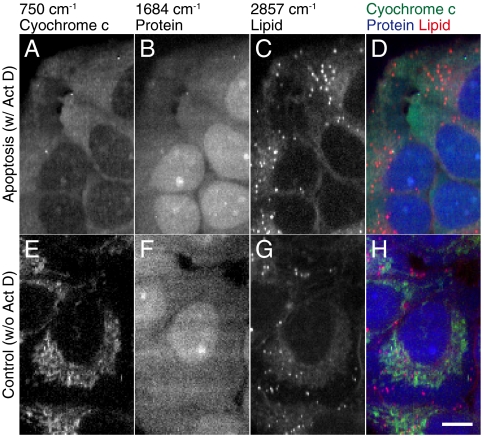
In order to confirm the distribution of the Raman signals with high spatial resolution, we fixed HeLa cells after being incubated with Act D for 2 h and observed by Raman microscope. Raman images constructed by using the peak intensities at 750, 1684, and 2857 cm-1, which can be assigned to the pyrrole breathing mode ν15 in cytochrome c, Amide-I band in protein and CH2 band in lipid, respectively (11), are shown in Fig. 3A–C, and the color-merged image is shown in Fig. 3D. Raman images of HeLa cells without Act D treatment are also obtained and shown in Fig. 3E–H. The comparison of the figures shows the clear difference in the distribution of cytochrome c in the cells with and without the Act D treatment. In Fig. 3A, cytochrome c is distributed in the whole part of the extranuclear region, but not in Fig. 3E. We also recognized the weak Raman signal of 750 cm-1 in the intranuclear region in Fig. 3A, which is presumably from cytochrome c above or below the nuclei, and is observed in the image due to the low axial resolution inherent in slit-confocal detection. These results support the conclusions drawn from the time-lapse observation results shown in Fig. 1A.
Fig. 3.
Raman images of apoptotic or nonapoptotic HeLa cells at (A, E) 750, (B, F) 1684, (C, G) 2857 cm-1, showing the distribution of cytochrome c, protein beta sheet, and lipid molecules, respectively. (D, H) were constructed by merging images (A) through (C) or (E) through (G) with color channels. The images consist of 154 × 88 pixels. Scale bar, 10 μm.
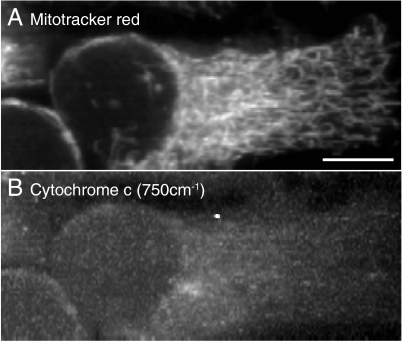
The distributions of proteins show no significant differences in either sample, and provide further evidence that the cytochrome c distribution changed independently of the cell morphological change. Compared to the control result, the apoptotic cells exhibit a larger number of lipid vesicles, which might correspond to the accumulation of intracellular vesicles in the stage of morphological change in apoptosis (6, 16). However, these lipid vesicles are often also observed in nonapoptotic cells (See Fig. 2 for example), and from the morphology, the cell observed in Fig. 3 was presumably imaged before forming the apoptotic body discussed in Refs. (6) and (16). The distribution of mitochondria was also observed using mitotracker red of apoptotic cells and performing Raman imaging of the cytochrome c distribution as shown in Fig. 4, which supports the conclusion that the Raman signal distribution in Fig. 1A and 3A is the result of release of cytochrome c from mitochondria by apoptosis, and corresponds to a previous report of fluorescence observation of cytochrome c-GFP dynamics in apoptosis (17).
Fig. 4.
(A) Fluorescence and (B) Raman images of a fixed HeLa cell treated with Act D. The release of cytochrome c can be confirmed from the comparison of the images. Scale bar, 10 μm.
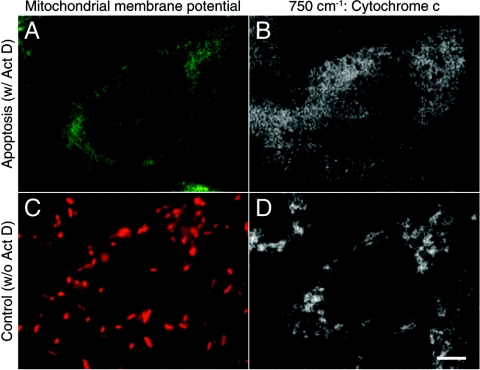
Mitochondrial membrane potential is known to change during apoptosis and may in fact be responsible for the release of the cytochrome c (15, 17). To investigate the link between the mitochondrial membrane potential and cytochrome c, we monitored mitochondrial membrane depolarization and investigated the distribution of cytochrome c in apoptotic cells. We introduced JC-1 dye, which has a fluorescence peak that changes with mitochondrial membrane potential polarization from 529 nm to 590 nm due to formation of J-aggregate in the mitochondrial membrane (18), to live HeLa cells in order to monitor the change of the potential. Fig. 5A and B show fluorescence and Raman images of a HeLa cell in which membrane potential depolarization was confirmed from the fluorescence emission only at 529 nm. After confirming the membrane potential depolarization from the fluorescence image, Raman observation was performed. From Fig. 5B, we can confirm the cytochrome c signal is distributed in the extranuclear region of the cell. Fig. 5C and D shows a Raman image at 750 cm-1 and a fluorescence image from a HeLa cell without membrane depolarization, which was confirmed by the fluorescence emission at 590 nm from the aggregated JC-1 as shown with the red color in the image. In Fig. 5D, we confirmed the localization of the Raman signal in the microstructure which appears to be mitochondria in the cell. Taken together, these observations support the above conclusion that the significant change in the distribution of the cytochrome c signal at 750 cm-1 was induced by apoptosis.
Fig. 5.
Relationship between the distribution of cytochrome c and mitochondrial membrane potential. (A, C) The mitochondrial membrane potential images of HeLa cells incubated with or without Act D were obtained by JC-1 dye. Fluorescence intensities of the emission at around 529 nm and 590 nm are shown in green and red, respectively. (B, D) The Raman images of HeLa cells incubated with or without Act D were reconstructed using the distribution of Raman signals at 750 cm-1. The images consist of 235 × 111 pixels. Scale bar, 10 μm.
In this research, we observed the distribution change of cytochrome c during apoptosis without using labeling. The parallel detection of Raman spectra with slit-scanning allowed us to monitor the dynamics of the biomolecules with a temporal resolution of a few minutes, and with the possibility of observing the oxidization state of intracellular molecules. The label-free observation has advantages especially in observation of dynamics of biomolecules because labeling markers may disturb the motion of target molecules with a size and weight greater than or comparable to the target. For example, cytochrome c consists of 104 amino acids and weighs about 12.4 kDa, whereas a typical GFP consists of 238 amino acids and weighs about 27 kDa (19, 20). Raman imaging can also contribute to the observation of molecule-specific tags with reduced labeling effects by using Raman-active molecular tags smaller than the target, such as deuterium or alkynes (21, 22). In true label-free imaging, however, concerns over the reproducibility or reliability in introduction of tags or expression of fluorescent proteins in the sample become alleviated. These features emphasize the importance of developing label-free observation techniques and the use of Raman scattering in detection of biomolecules. One disadvantage of spontaneous Raman imaging is the potential for photodamage during intense laser excitation. This can be mitigated by using nonlinear Raman scattering techniques such as CARS or SRS with near-infrared wavelengths for illuminating the sample, generally with the trade-off of being unable to detect the entire spectrum from the sample. These emerging optical techniques are certain to expand the available technology for biological observation in the near future.
Materials and Methods
Slit-Scanning Raman Microscopy.
All the hyperspectral Raman scattering images in Fig. 1–5 were obtained using a home-built slit-scanning Raman microscope (see Fig. S1) with 532 nm excitation from a frequency-doubled Nd: YVO4 laser (Verdi, Coherent Inc. for Fig. 1; Millennia-Xs, Spectra-Physics for Fig. 2–5). The laser beam is shaped into a line by a cylindrical lens and focused on the sample at the microscope stage by a 60X/1.2 NA water immersion objective lens (UPLSAPO 60XW, Olympus). The backscattered Raman signals from the sample are collected by the same objective lens, then pass into a spectrograph (MK-300, Bunkoh Keiki) through a 532 nm long-pass edge filter (LP03-532RU-25, Semrock) and are then detected by a cooled CCD camera (Pixis 400B, Princeton Instruments). At the sample plane, the line-focused laser was scanned by a single-axis galvanometer mirror (710–745825, 000-3014016, GSI Lumonics). A stage top incubator (INUG2-OTD-LJ, Tokai Hit) was equipped with the microscope to keep the environment around samples in a humidified atmosphere (5% CO2, 95 % air) at 37 °C during experiment. The Raman microscope is also equipped with a mercury lamp, filter cubes (G-2A, FITC; Nikon), and color CCD camera (DS-5Mc, Nikon) for detecting the fluorescence signal of JC-1 dye (10009172, Cayman Chemical).
Sample Preparation.
HeLa cells were used as a sample in all experiments. Cells were cultured in culturing medium in a humidified atmosphere (5% CO2, 95% air) at 37 °C. The medium was Dulbecco’s modified Eagle’s medium (DMEM; 680552, Nissui) supplemented with 10% fetal calf serum, 2 mM glutamine, 100 units/mL penicillin, and 100 μg/mL streptomycin.
Experimental Procedure.
Fig. 1: Prior to Raman imaging, the cells were seeded on a CaF2 (5 mm in diameter, 0.215 mm thick; Starbar Japan) substrate and cultured in the DMEM with 1 μM Act D (A1410, Sigma-Aldrich) for 1 h to trigger apoptosis. The solution was replaced with DMEM and incubated for 6 h to remove Act D from the cells so that the interaction between light and Act D will not alter the cellular condition during the time-lapse Raman imaging. For Raman imaging, the medium was replaced with a Hepes-buffered Tyrode’s solution composed of (in mM) NaCl, 150; glucose, 10; Hepes, 10; KCl, 4.0; MgCl2, 1.0; CaCl2, 1.0; and NaOH, 4.0. The correction collar of the objective lens was set to 2.03 to compensate for the difference of refractive indices between glass and CaF2. Raman scattering images were taken at 5 min intervals for 35 min. The line scan number was 20 for each image and the slit of the spectrograph was set to 50 μm. The irradiated laser intensity at the sample plane and exposure time for each line was 1.5 mW/μm2 and 1.5 s, respectively.
Fig. 2: Raman spectra of cytochrome c solutions of 1 mg/mL were measured for Fig. 2A. The reduction of cytochrome c was performed with 1 mM ascorbic acid. The cells were incubated on a quartz substrate (2.5 cm in diameter, 0.17 mm thick; Starbar Japan) and observed by the Raman microscope for Fig. 2B. After the observation, the cells were fixed by 4% paraformaldehyde. Then, the medium was replaced with a Hepes-buffered Tyrode’s solution, and the cells were observed by the same microscope to obtain Fig. 2C. After the second observation, H2O2 was added to obtain Fig. 2D. The number of line scans was 178 for each image and the slit of the spectrograph was set to 50 μm. The irradiated laser intensity at the sample plane and exposure time for each line was 3.5 mW/μm2 and 4 s, respectively.
Fig. 3: The cells were incubated with 1 μM Act D for 2 h on a quartz substrate (2.5 cm in diameter, 0.17 mm thick; Starbar Japan) and fixed by 4% paraformaldehyde. Then, the medium was replaced with a Hepes-buffered Tyrode’s solution, and finally, Raman imaging was performed. The number of line scans was 88 for each image and the slit of the spectrograph was set to 30 μm. The irradiated laser intensity at the sample plane and exposure time for each line were 3.30 mW/μm2 and 5 s, respectively.
Fig. 4: The cells were incubated with 1 μM Act D on a quartz substrate (2.5 cm in diameter, 0.17 mm thick; Starbar Japan). After 10 h incubation, mitotracker red (M22425, Invitrogen) was added to the dish and the cells were kept in a CO2 incubator for 10 min, and then fixed by 4% paraformaldehyde. Then, the medium was replaced with a Hepes-buffered Tyrode’s solution for performing Raman imaging. The number of line scans was 67 for each image and the slit of the spectrograph was set to 50 μm. The irradiated laser intensity at the sample plane and exposure time for each line were 2.7 mW/μm2 and 2 s, respectively.
Fig. 5: We used a JC-1 mitochondrial membrane potential assay kit from Cayman Chemical and followed the protocol recommended by the manufacturer. The original JC-1 reagent in the kit was diluted with DMEM by 110 times and used to incubate the cells for 15 min in order to load the cells with JC-1 dye. Then the cells were incubated for 7 h after replacing the medium with DMEM containing 1 μM Actinomycin D. The solution was replaced with a Hepes-buffered Tyrode’s solution, and the mitochondrial membrane potential was then monitored by fluorescence microscopy. After monitoring the mitochondrial membrane potential, we observed the cells by Raman microscopy. The scanning number was 111 lines for each Raman image and the slit of the spectrograph was 30 μm. For Raman imaging, the irradiated laser intensity at the sample plane and exposure time for each line were 2.77 mW/μm2 and 3 s, respectively. For monitoring mitochondrial membrane potential, JC-1 dye was excited by a mercury lamp focused on the sample by the same objective lens used for Raman imaging. For observing red or green fluorescence, G-2A (Excitation filter λex: 510–560 nm, Emission filter λem: 590 nm, Dichromatic mirror λdm: 575 nm) or FITC (λex: 465–495 nm, λem: 515–555 nm, λdm: 505 nm) filter cube were used, respectively.
Data Analysis.
After Raman imaging, the Raman hyperspectral dataset was processed by singular value decomposition (SVD) for noise reduction, and we chose loading vectors that significantly contribute to the images contrast for the image (4, 11). Following SVD processing, the fluorescence background signal was subtracted from the Raman spectra at each pixel in the image by a modified polyfit fluorescence removal technique (11, 23).
Supplementary Material
ACKNOWLEDGMENTS.
We thank Dr. K. Hamada, Dr. J. Ando, Dr. M. Yamanaka, and Dr. K. Dodo for helpful discussions and technical supports. We also thank Prof. T. Takamatsu in Kyoto Prefectural University of Medicine for providing HeLa cells for the experiments. This work was supported by Japan Science and Technology Agency (JST) and Nakatani Electronic Measuring Technology Association.
Footnotes
The authors declare no conflict of interest.
This article is a PNAS Direct Submission.
This article contains supporting information online at www.pnas.org/lookup/suppl/doi:10.1073/pnas.1107524108/-/DCSupplemental.
References
- 1.Puppels GJ, et al. Studying single living cells and chromosomes by confocal Raman microspectroscopy. Nature (London) 1990;347:301–303. doi: 10.1038/347301a0. [DOI] [PubMed] [Google Scholar]
- 2.Puppels GJ, Grond M, Grave J. Direct imaging Raman microscope based on tunable wavelength excitation and narrow-band emission detection. Appl Spectrosc. 1993;47:1256–1267. [Google Scholar]
- 3.Uzunbajakava N, et al. Nonresonant confocal Raman imaging of DNA and protein distribution in apoptotic cells. Biophys J. 2003;84:3968–3981. doi: 10.1016/S0006-3495(03)75124-8. [DOI] [PMC free article] [PubMed] [Google Scholar]
- 4.Manen H-J, Kraan YM, Roos D, Otto C. Intracellular chemical imaging of heme-containing enzymes involved in innate immunity using resonance Raman microscopy. J Phys Chem B. 2004;108:18762–18771. [Google Scholar]
- 5.Huang Y-S, Karashima T, Yamamoto M, Hamaguchi H. Molecular-level investigation of the structure, transformation, and bioactivity of single living fission yeast cells by time- and space-resolved Raman spectroscopy. Biochemistry. 2005;44:10009–10019. doi: 10.1021/bi050179w. [DOI] [PubMed] [Google Scholar]
- 6.Zoladek A, Pascut FC, Patel P, Notingher I. Non-invasive time-course imaging of apoptotic cells by confocal Raman micro-spectroscopy. J Raman Spectrosc. 2011;42:251–258. [Google Scholar]
- 7.Zumbusch A, Holtom GR, Xie XS. Three-dimensional vibrational imaging by coherent anti-Stokes Raman scattering. Phys Rev Lett. 1999;82:4142–4145. [Google Scholar]
- 8.Freudiger CW, et al. Label-free biomedical imaging with high sensitivity by stimulated Raman scattering microscopy. Science. 2008;322:1857–1861. doi: 10.1126/science.1165758. [DOI] [PMC free article] [PubMed] [Google Scholar]
- 9.Hengartner MO. The biochemistry of apoptosis. Nature. 2000;407:770–776. doi: 10.1038/35037710. [DOI] [PubMed] [Google Scholar]
- 10.Spiro TG, Strekas TC. Resonance Raman spectra of hemoglobin and cytochrome c: Inverse polarization and vibronic scattering. Proc Natl Acad Sci USA. 1972;69:2622–2626. doi: 10.1073/pnas.69.9.2622. [DOI] [PMC free article] [PubMed] [Google Scholar]
- 11.Hamada K, et al. Raman microscopy for dynamic molecular imaging of living cells. J Biomed Opt. 2008;13:044027. doi: 10.1117/1.2952192. [DOI] [PubMed] [Google Scholar]
- 12.Veirs DK, Ager JW, III, Loucks ET, Rosenblatt GM. Mapping materials properties with Raman spectroscopy utilizing a 2-D detector. Appl Opt. 1990;29:4969–4980. doi: 10.1364/AO.29.004969. [DOI] [PubMed] [Google Scholar]
- 13.Kleeff J, Kornmann M, Sawhney H, Korc M. Actinomycin D induces apoptosis and inhibits growth of pancreatic cancer cells. Int J Cancer. 2000;86:399–407. doi: 10.1002/(sici)1097-0215(20000501)86:3<399::aid-ijc15>3.0.co;2-g. [DOI] [PubMed] [Google Scholar]
- 14.Adar F. Resonance Raman spectra of ferric cytochrome c. A probe of low-lying electronic levels of the iron ion. J Phys Chem. 1978;82:230–234. [Google Scholar]
- 15.Brown GC, Borutaite V. Regulation of apoptosis by the redox state of cytochrome c. Biochem Biophys Acta. 2008;1777:877–881. doi: 10.1016/j.bbabio.2008.03.024. [DOI] [PubMed] [Google Scholar]
- 16.Zhang J, Reedy MC, Hannun YA, Obeid LM. Inhibition of caspases inhibits the release of apoptotic bodies: Bcl-2 inhibits the initiation of formation of apoptotic bodies in chemotherapeutic agent-induced apoptosis. J Cell Biol. 1999;145:99–108. doi: 10.1083/jcb.145.1.99. [DOI] [PMC free article] [PubMed] [Google Scholar]
- 17.Goldstein JC, Waterhouse NJ, Juin P, Evan GI, Green DR. The coordinate release of cytochrome c during apoptosis is rapid, complete and kinetically invariant. Nat Cell Biol. 2000;2:156–162. doi: 10.1038/35004029. [DOI] [PubMed] [Google Scholar]
- 18.Smiley ST, et al. Intracellular heterogeneity in mitochondrial membrane potentials revealed by a J-aggregate-forming lipophilic cation JC-1. Proc Natl Acad Sci USA. 1991;88:3671–3675. doi: 10.1073/pnas.88.9.3671. [DOI] [PMC free article] [PubMed] [Google Scholar]
- 19.Niwa H, et al. Chemical nature of the light emitter of the Aequorea green fluorescent protein. Proc Natl Acad Sci USA. 1996;93:13617–13622. doi: 10.1073/pnas.93.24.13617. [DOI] [PMC free article] [PubMed] [Google Scholar]
- 20.Horn DM, Zubarev RA, McLafferty FW. Automated de novo sequencing of proteins by tandem high-resolution mass spectrometry. Proc Natl Acad Sci USA. 2000;97:10313–10317. doi: 10.1073/pnas.97.19.10313. [DOI] [PMC free article] [PubMed] [Google Scholar]
- 21.Van Manen HJ, Lenferink A, Otto C. Noninvasive imaging of protein metabolic labeling in single human cells using stable isotopes and Raman microscopy. Ana Chem. 2008;80:9576–9582. doi: 10.1021/ac801841y. [DOI] [PubMed] [Google Scholar]
- 22.Yamakoshi H, et al. Imaging of EdU, an alkyne-tagged cell proliferation probe, by Raman microscopy. J Am Chem Soc. 2011;133:6102–6105. doi: 10.1021/ja108404p. [DOI] [PubMed] [Google Scholar]
- 23.Lieber CA, Mahadevan-Jansen A. Automated method for subtraction of fluorescence from biological Raman spectra. Appl Spectrosc. 2003;57:1363–1367. doi: 10.1366/000370203322554518. [DOI] [PubMed] [Google Scholar]
Associated Data
This section collects any data citations, data availability statements, or supplementary materials included in this article.


