Abstract
Background
We have constructed Bayesian prior-based, amino-acid sequence profiles for the complete yeast mitochondrial proteome and used them to develop methods for identifying and characterizing the context of protein mutations that give rise to human mitochondrial diseases. (Bayesian priors are conditional probabilities that allow the estimation of the likelihood of an event - such as an amino-acid substitution - on the basis of prior occurrences of similar events.) Because these profiles can assemble sets of taxonomically very diverse homologs, they enable identification of the structurally and/or functionally most critical sites in the proteins on the basis of the degree of sequence conservation. These profiles can also find distant homologs with determined three-dimensional structures that aid in the interpretation of effects of missense mutations.
Results
This survey reports such an analysis for 15 missense mutations, one insertion and three deletions involved in Leber's hereditary optic neuropathy, Leigh syndrome, mitochondrial neurogastrointestinal encephalomyopathy, Mohr-Tranebjaerg syndrome, iron-storage disorders related to Friedreich's ataxia, and hereditary spastic paraplegia. We present structural correlations for seven of the mutations.
Conclusions
Of the 19 mutations analyzed, 14 involved changes in very highly conserved parts of the affected proteins. Five out of seven structural correlations provided reasonable explanations for the malfunctions. As additional genetic and structural data become available, this methodology can be extended. It has the potential for assisting in identifying new disease-related genes. Furthermore, profiles with structural homologs can generate mechanistic hypotheses concerning the underlying biochemical processes - and why they break down as a result of the mutations.
Background
As we move into the post-genome era, bioinformatics tools provide a powerful means of organizing and integrating information related to hereditary diseases. We present here a prototype study of this approach. Using a database of all identifiable proteins that contribute to the structure and/or biosynthesis of yeast (Saccharomyces cerevisiae) mitochondria, we have generated a library of protein profiles [1] that enables us to identify homologs in a wide range of genomes, including human. As a result, we have available sets of highly accurate amino-acid sequence alignments over the conserved regions that correspond to these profiles. By mapping known human disease-related mutations onto these alignments we can investigate the relationships to sequence conservation - and to sequence variations. In the cases where one or more of the identified homologs has a determined structure, these mutations can be interpreted in structural terms, allowing us to draw mechanistic inferences.
We have used profile analysis based on Bayesian priors, conditional probabilities that allow the estimation of the likelihood of an event on the basis of prior occurrences of similar events, to make this library of sequence profiles. The strength of prior-based profile analysis lies in its ability to capture homologous protein domains as related objects. Each domain is represented as a matrix of amino-acid probabilities (more precisely, log likelihood values) where each position in the domain has an estimated probability of being occupied by any particular amino acid. The similarities or degrees of residue conservation between homologous sequences reveal positions critical for protein structure and function. A profile-induced multiple alignment displays immutable positions, physicochemically conserved positions and highly variable positions. The examples presented in this paper show how such alignments provide insight into human mitochondrial pathologies.
Mitochondrial proteins are an attractive subset of the cellular proteome to analyze because they perform a number of correlated functions and interact extensively with one another. Their properties and behavior reflect an integrated system, and the effects of different mutational changes can be meaningfully cross-compared. The survey of this miniature proteome should reveal many of the features that characterize the larger complete proteomes of eukaryotic cell types. Mitochondrial pathologies also present uniquely complex evolutionary and genetic features as a result of their origin within organelles derived from ancient symbionts and the strictly maternal inheritance pattern followed by an important subset of the relevant genes.
Mitochondrial genome overview
The mitochondrial genome itself encodes only a handful of genes. The largest mitochondrial genome discovered to date - of the protist Reclinomonas americana - codes for 97 gene products (67 proteins and 30 structural RNAs) in a span of 69,034 base pairs [2]. Human mitochondrial DNA is much smaller, encoding 37 gene products (13 proteins, 2 rRNAs and 22 tRNAs) over 16,569 base pairs [3]. All its encoded proteins are directly involved in oxidative phosphorylation and include components of complex I (NADH dehydrogenase subunits ND1, ND2, ND3, ND4, ND4L, ND5, ND6), complex III (cytochrome b), complex IV (cytochrome oxidase subunits I, II and III) and complex V (mitochondrial ATPase subunits 6 and 8) [4]. All other human genes encoding mitochondrial proteins (total estimated at around 1,100 [5]) are transcribed in the nucleus, translated in the cytoplasm and their products imported into mitochondria. The interplay between organellar and nuclear genomes accounts for a large part of the diversity in mitochondrial pathologies.
Each human cell contains multiple mitochondria, often dynamically interconnected in a complex reticular network [6, 7], and each mitochondrion may contain ten or more mitochondrial DNA (mtDNA) molecules. Usually all copies of mtDNA are identical, a state known as homoplasmy. Occasionally, however, mtDNA mutations occur and there arise two (or more) populations of mtDNA, a state called heteroplasmy [4]. In fact, heteroplasmic mtDNA ought to be relatively common, considering that human mtDNA mutates 10-20 times faster than nuclear DNA as a result of inadequate proofreading by mitochondrial DNA polymerases [4] and limited mtDNA repair capability. This expectation is to some extent borne out by the relative prominence of mitochondrial disorders arising from mutations in the mtDNA - although it is also important to note that such mutations, being comparatively easy to identify by sequencing, will naturally have been among the first to be characterized.
Disease classification
Schapira has devised a classification scheme for mitochondrial defects [8] based primarily on whether or not the affected gene product is directly involved in oxidative phosphorylation and whether it is encoded by mtDNA or nuclear DNA.
A primary defect in oxidative phosphorylation defines class I. Distinct mitochondrial pathologies may overlap more than one class, for example Leigh syndrome (see below). Subclass Ia includes diseases arising from mutations in mtDNA genes encoding subunits of proteins involved in oxidative phosphorylation, mitochondrial tRNA genes and mitochondrial rRNA genes. This subclass has three related categories, depending on the nature of the underlying mutations: (i) large-scale mtDNA deletions and duplications; (ii) point mutations and small rearrangements in protein-coding mtDNA regions; and (iii) small-scale mtDNA mutations in tRNA and rRNA genes [8]. In order for a class Ia pathology to present itself, the mtDNA mutation must occur in a significant fraction of the heteroplasmic mtDNA population, as high as 60% for mtDNA deletions [9] (Ia-i) and even up to 95% for tRNA mutations (Ia-iii) [10]. Class Ib mitochondrial diseases arise from mutations in any of the 70-odd nuclear genes encoding protein subunits involved in oxidative phosphorylation [5]. These mutations can occur in exons or introns as well as promoters.
Class II mitochondrial disorders stem from secondary defects in oxidative phosphorylation. Class IIa genetic pathologies are characterized by mutations in nuclear mitochondrial protein genes whose products are imported into the mitochondria but are not subunits of the oxidative phosphorylation apparatus. There are four subtypes: (i) mtDNA abnormality due to mutations in nuclear genes affecting mtDNA transcription, translation or replication; (ii) direct mtDNA damage or defects in mtDNA repair; (iii) defective oxidative phosphorylation subunit import; and (iv) defective oxidative phosphorylation subunit assembly [8]. Type IIb pathologies arise from endogenous and exogenous toxins.
Results
Table 1 summarizes the examples described below. They include all cases for which sufficiently specific mutational information exists to enable effective use of the profile tool.
Table 1.
Selected mutations associated with human mitochondrial disorders
| Disorder | Affected protein | DNA change | Protein change | Evolutionary conservation | Structural environment |
| LHON | ND4 | G11778A | R340H | Absolute | N/A |
| ND1 | G3460A | A52T | Slight | N/A | |
| ND6 | T14484C | M64V | Moderate | N/A | |
| G14459A | A72V | High | N/A | ||
| Leigh syndrome | ATP6 | T8993G | L156R | Absolute | Subunit interface |
| PDHA1 | C892G | R263G | Slight | Near active site | |
| SURF1 | G385A | G124E | Absolute | N/A | |
| T751C | I246T | High | Predicted β-sheet | ||
| SDHA | C1684T | R554W | High | Surface-exposed | |
| MNGIE | TP | G1419A | G145R | High | Near active site |
| G1443A | G153S | Absolute | Near active site | ||
| A2744G | K222S | Absolute | Near active site | ||
| A3371 | E289A | Absolute | Notin active site | ||
| Deafness-dystonia | DDP1 | T151del (1 nt) | Truncation - see text | High | N/A |
| A183del (10 nt) | Truncation - see text | High | NA | ||
| C198G | C66W | Absolute | N/A | ||
| Iron-storage | ABCB7 | ATT → ATG | I400M | High | Predicted tight turn |
| HSP | Paraplegin | 784del (2 nt) | 60% truncated | High | N/A |
| 2228ins (1 nt = A) | 7.2% Truncated | Moderate | N/A |
ABCB7, ATP-binding cassette, subfamily B, member 7; ATP4, adenosine triphosphate synthase subunit 4 (ATP6 - subunit 6); DDP1, deafness-dystonia peptide 1, del, deletion; HSP, hereditary spastic paraplegia; ins, insertion; LHON, Leber's hereditary optic neuropathy; MNGIE, mitochondrial neurogastrointestinal encephalomyopathy; N/A, not available; ND, NADH dehydrogenase; ND1 ... NDn, ND subunits 1 ... nt, nucleotide; PDHA1, pyruvate dehydrogenase subunit E1α; SDHA, succinate dehydrogenase subunit A; SURF1, surfeit locus protein 1; TP, thymidine phosphorylase.
Primary mutational disorders of oxidative phosphorylation (class I)
Leber's hereditary optic neuropathy
Leber's hereditary optic neuropathy (LHON), the most common cause of male adolescent blindness, is attributed to mutations in mtDNA genes encoding subunits of complex I (NADH dehydrogenase (ND) - alternatively termed NADH CoQ1 reductase). The most frequently encountered mutation (50% of cases among Europeans, 95% among Asians) is G11778A in ND4 (Arg340 → His). Additionally, G3460A (Ala52 → Thr) in ND1, and both T14484C (Met64 → Val) and G14459A (Ala72 → Val) in ND6 rank among the other primary LHON-associated mutations [4, 11].
As seen in Figure 1, the arginine residue at position 340 in the human sequence for ND4 (NU4M_HUMAN) (which corresponds to position 300 of the profile) is absolutely conserved across Gram-positive (Rv3157), Gram-negative (EC2277), archaeal (PAB1432) and eukaryotic taxa (NU4M_HUMAN and nad4_PRA). The pathogenic mutation of arginine to histidine at this position represents a moderately significant divergence in sequence, substituting an imidazole group for a guanidino group. The two amino-acid side chains differ in shape, hydrogen-bonding capability and degree of positive charge (arginine always being positively charged at physiological pH, histidine only having a positive charge about half the time).
Figure 1.
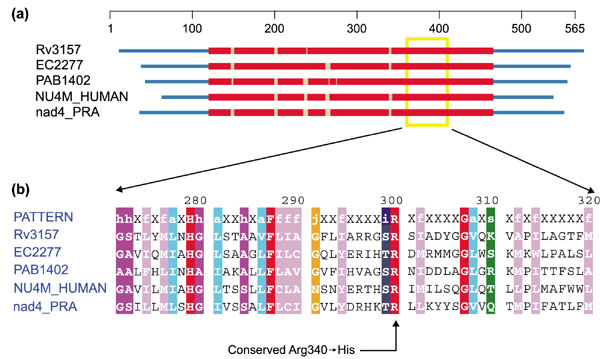
Profile-induced multiple alignment of NADH dehydrogenase, subunit 4. (a) Protein domain diagram. Profile-aligned regions (in red) set the boundaries for sequence domains. Gaps are indicated by gray interruptions in the red bars. Coordinates in the domain diagram are based on the aligned set of sequences. Amino-acid position is given on the scale above. (b) The zoomed-in aligned region marked by the yellow box on the domain diagram (see Additional data files). The alignment is colored according to amino-acid class assignments, with red indicating identity. Coordinates in the aligment are taken from the position in the profile. For more details see [48, 53]. Sequences are obtained from Mycobacterium tuberculosis (Rv3157), Escherichia coli (EC2277), Pyrococcus abyssi (PAB1402), Homo sapiens mitochondrion (NU4M_HUMAN) and Reclinomonas americana mitochondrion (nad4_PRA).
The common missense substitution in ND1 that leads to LHON, Ala52 → Thr, does not have as obvious an explanation for its effect. Inspection of the set of aligned sequences (Figure 2) shows that this position tolerates glycine and methionine as well as alanine. Substituting a threonine for the alanine in the human sequence adds a beta-branched amino acid capable of disrupting local secondary/tertiary structure or possibly intersubunit interactions. The hydroxyl group of the threonine may also form hydrogen bonds with neighboring amino-acid residues so as to add to this potential disruption. Further structural study of complex I will be required to explain how this mutation contributes to LHON.
Figure 2.
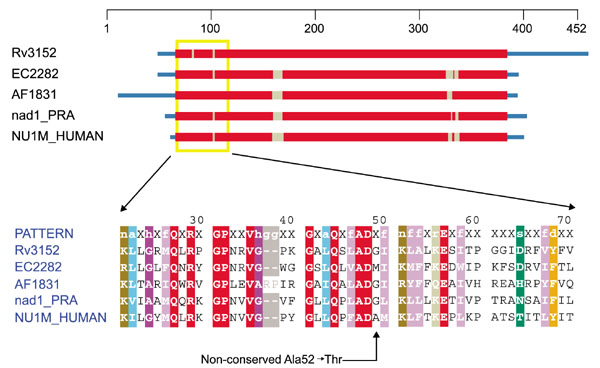
Domain diagram and partial alignment for NADH dehydrogenase, subunit 1 (ND1). The column indicated by the arrow at the bottom is position 52 of NU1M_HUMAN. Sequences are from M. tuberculosis (Rv3152), E. coli (EC2282), Archaeoglobus fulgidus (AF1831), H. sapiens mitochondrion (NU1M_HUMAN) and R. americana mitochondrion (nad1_PRA). Colors are as in Figure 1.
The two common pathogenic mutations in ND6 (Met64 → Val and Ala72 → Val) lead to a less severe and a very severe form of LHON, respectively [12]. As Mycobacterium tuberculosis already uses a valine in position 64 (Figure 3), it is understandable that the Met64 → Val substitution should cause a less severe disease phenotype. In position 72, only alanine and methionine have been seen among the identified homologs. As such, the introduction of valine adds a β-branched amino acid at a conserved non-β-branched hydrophobic position. Additionally, the two eukaryotes Xenopus laevis and Homo sapiens have conserved the alanine, whereas the more distantly related species all conserve a methionine. Whereas only one of the NADH-dehydrogenase subunit mutations occurs at an absolutely conserved position, there are reasonable explanations for how the other mutations could manifest their likely pathology.
Figure 3.
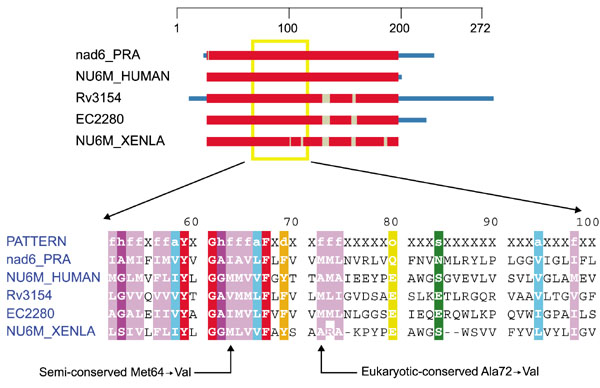
Domain diagram and partial alignment for NADH dehydrogenase, subunit 6 (ND6). The columns indicated with arrows at the bottom are positions 64 and 72 of NU6M_HUMAN. Sequences are from M. tuberculosis (Rv3154), Escherichia coli (EC2280), X. laevis mitochondrion (NUAM6_XENLA), H. sapiens mitochondrion (NU6M_HUMAN) and R. americana mitochondrion (nad6_PRA). Colors are as in Figure 1.
Leigh syndrome
Leigh syndrome (also known as subacute necrotizing encephalomyelopathy) is another common mtDNA mutation disorder, frequently associated with cytochrome oxidase (COX) deficiency [13], though no disease-related mutations of the mtDNA-encoded COX subunits have been reported. A single T-to-G transversion at mtDNA position 8,993 changes leucine 156 of ATP synthase subunit 6 to arginine (Leu56 → Arg) [14] (Figure 4a).
Figure 4.
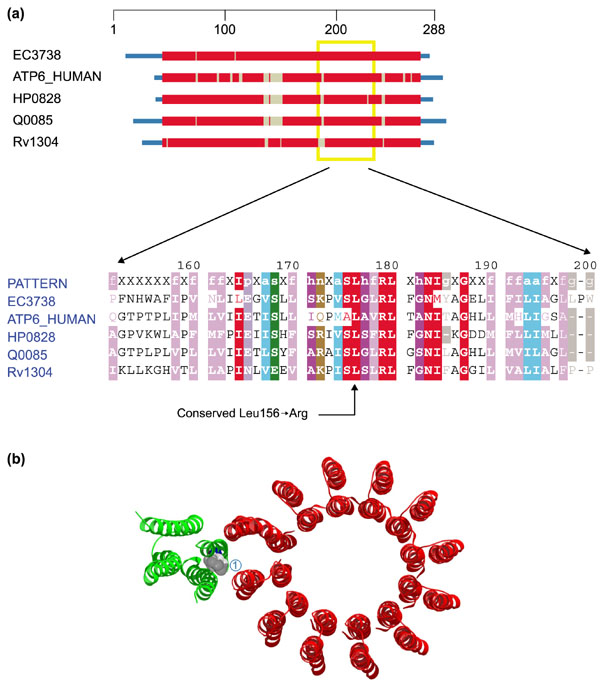
Domain diagram and structure of ATP synthase. (a) Domain diagram and partial alignment for ATP synthase, subunit 6 (ATP6). The column indicated by the arrow at the bottom corresponds to position 156 of ATP6_HUMAN. Sequences are obtained from M. tuberculosis (Rv1304), Helicobacter pylori (HP0828), E. coli (EC3738), S. cerevisiae mitochondrion (Q0085) and H. sapiens mitochondrion (ATP6_HUMAN). Colors are as in Figure 1. (b) Ribbon diagram showing the structure of ATP synthase subunits: ATP6 (a-chain, green) and ATP9 (c-chain, red). Leucine 156 (1) is shown as a space-filling model. The structure comes from the Protein Data Bank (code: 1C17).
Lower copy numbers of this mutation (~ 70%) are associated with neuropathy, ataxia and retinitis pigmentosa (NARP) whereas high copy numbers (>90%) give rise to Leigh syndrome [15]. Mutating the conserved leucine to arginine at position 156 is a drastic change, disrupting a γ-branched aliphatic residue with a basic guanidino group, a major chemical and presumably structural substitution. In this case structural data are available (see Figure 4b) and clearly indicates the key location of this residue at the protein-protein interface of two of the subunits of the F0 component of complex V (ATP synthase).
Mutations found in at least two nuclear genes also correlate with Leigh syndrome: one for a subunit of the pyruvate dehydrogenase complex and one for surfeit locus protein 1 (SURF-1), which is involved in the assembly of cytochrome c oxidase. As these are not oxidative phosphorylation proteins the mutations qualify as class II disorders. A missense mutation (Arg263 → Gly) in the E1α subunit of pyruvate dehydrogenase (PDHA1) has been associated with Leigh syndrome (Figure 5). This mutation seems to affect assembly of the E1α-E1β heterotetramer [16]. The gene's location on the X chromosome complicates its expression pattern in females as a result of the random pattern of X inactivation [17].
Figure 5.
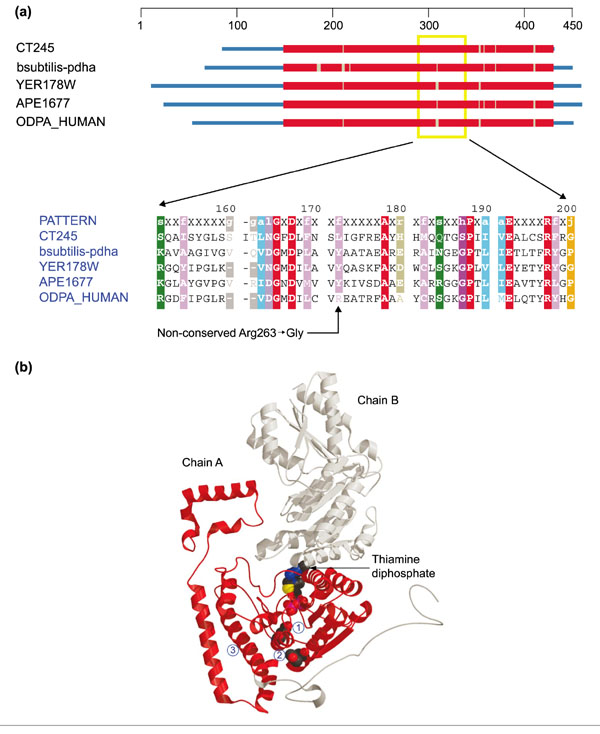
Structures of pyruvate dehydrogenase E1-α subunit and branched-chain α-ketoacid dehydrogenase α subunit. (a) Domain diagram and partial alignment for pyruvate dehydrogenase E1-α subunit (PDHA1). The column indicated by the arrow at the bottom corresponds to position 263 of ODPA_HUMAN. Sequences come from Chlamydia trachomatis (CT245), Bacillus subtilis (bsubtilis-pdha), S. cerevisiae (YER178W), Aeropyrum pernix (APE1677) and H. sapiens (ODPA_HUMAN). Colors are as in Figure 1. (b) Ribbon diagram of branched-chain α-ketoacid dehydrogenase α subunit (H. sapiens) - a close homolog to PDHA1 (Z-score 73.2). The structure comes from the Protein Data Bank ([49]; code: 1DTWA). Chain A is colored red, chain B gray. A space-filling model of thiamine diphosphate (TPP) (center) indentifies the enzyme active site. Below and slightly to the left, the catalytic group Glu92 is also shown in space-filling representation (1), and further down (directly under the TPP) Tyr262 is similarly shown (2). Arg263 occupies this position in ODPA_HUMAN. Helix H3 is the second helix at the lower left (3).
Whereas only the human sequence uses arginine at this position, all other taxa use a large hydrophobic amino acid - either tyrosine or leucine; note that even an arginine side chain has a substantial hydrophobic segment bearing its terminal guanidino group. Substituting the small turn-forming glycine residue could have a significant impact on proper folding of this subunit. As shown in Figure 5b, Arg263 is located quite close to the active site of the enzyme, a region of the structure where even small perturbations could have large effects on activity.
The gene for SURF1 displays mutations (Gly124 → Glu and 110246 → Thr) that can also lead to Leigh syndrome [18, 19]. A number of deletions seen in SURF-1 do so as well. The Ile124 → Glu substitution disrupts an absolutely conserved glycine that most probably participates in a turn (Figure 6). The Ile246 → Thr mutation occurs in (and probably disrupts) a predicted β sheet believed to be present in this protein from all higher eukaryotes. It occurs toward the carboxyl terminus of the human protein and is beyond the region covered by the profile, a reflection of sequence divergence between eukaryotes and prokaryotes in this region.
Figure 6.
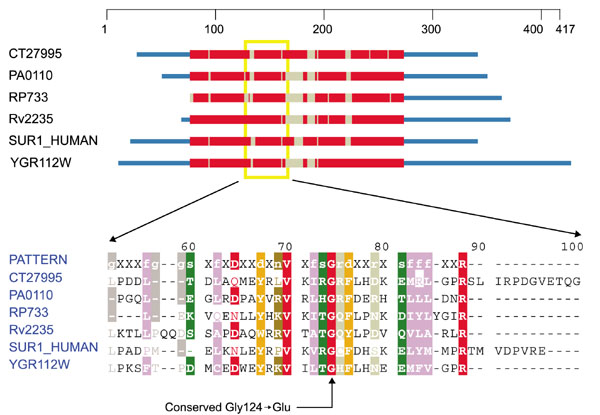
Domain diagram and partial alignment for surfeit locus protein 1 (SURF1). The column indicated by an arrow at the bottom corresponds to position 124 of SUR1_HUMAN. Sequences come from Drosophila melanogaster (CT27995), Pseudomonas aeruginosa (PA0110), Rickettsia prowazekii (RP733), M. tuberculosis (Rv2235), H. sapiens (SUR1_HUMAN) and S. cerevisiae (YGR112W). Colors are as in Figure 1.
Mutations giving rise to Leigh syndrome have also been described in the flavoprotein subunit (Fp or SDHA) of the succinate dehydrogenase complex (SDH) [20, 21]. The mutant version (C1684T, Arg554 → Trp; Figure 7a) of SDHA has a normal Km and Ki (for malonate) but is much more sensitive to downregulation by oxaloacetate (OAA).
Figure 7.
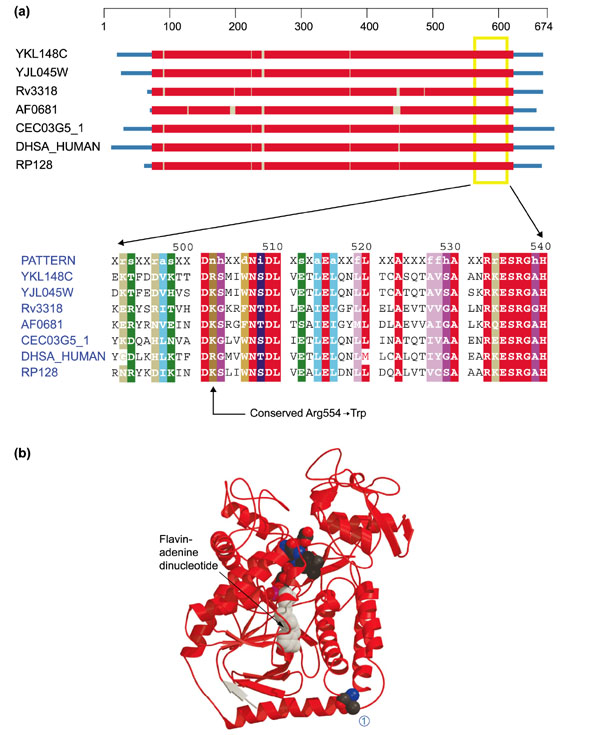
Structures of the flavoprotein subunits of succinate dehydrogenase and fumarate reductase. (a) Domain diagram and alignment for the flavoprotein subunit of succinate dehydrogenase (SDHA). The column indicated by the arrow on the bottom corresponds to position 554 of DHSA_HUMAN. Sequences come from S. cerevisiae (YKL148W and YJL045W), M. tuberculosis (Rv3318), A. fulgidus (AF0681), Caenorhabditis elegans (CEC03G5_1), H. sapiens (DHSA_HUMAN) and R. prowazekii (RP128). Colors are as in Figure 1. (b) Ribbon diagram of the flavoprotein subunit of fumarate reductase (E. coli) - a very close homolog of SDH Fp (Z-score 175.8). The structure comes from the Protein Data Bank (code: 1FUMA). Flavin adenine dinucleotide can be seen (in space-filling representation) in the middle of the structure and Thr494 is similarly indicated at the right-hand end of the bottom-most helix (1). Arg554 occupies this position in DHSA_HUMAN.
Mutating the conserved arginine residue at position 554 to a tryptophan causes a loss of a polar residue and replacement with a much larger aromatic group. It is not apparent from the location of this residue in the structure (Figure 7b) why this change should have such an effect on function. It lies on the surface at a considerable distance from the active site and does not have any apparent role in subunit-subunit interactions. In fact, however, the high degree of sequence conservation over this entire region (Figure 7a) suggests that SDHA is fairly intolerant of mutations here. Proper interaction with the lipid bilayer may partly explain the phenomenon.
Secondary mutational disorders in oxidative phosphorylation (class II)
Mitochondrial neurogastrointestinal encephalomyopathy
Class II mitochondrial disorders are due to mutations in nuclear mitochondrial protein genes. Mitochondrial neurogastrointestinal encephalomyopathy (MNGIE) is characterized by ptosis, progressive external ophthalmoplegia, gastrointestinal dismotility, thin body habitus, peripheral neuropathy, myopathy, leukoencephalopathy and lactic acidosis and multiple mtDNA deletions or mtDNA depletion, or both. It is a class II Δ-mtDNA depletion disorder. It is believed that the pathogenic mechanism relates to aberrant thymidine metabolism giving rise to impaired mtDNA replication and/or mtDNA maintenance [22]. Missense mutations in the enzyme thymidine phosphorylase (TP) (Gly145 → Arg, Gly153 → Ser, Lys222 → Ser, Glu289 → Ala and a few others) have been found in multiple MNGIE patients, and are believed to cause the pathology [22].
TP catalyzes a step in the salvage pathway for thymine (thymidine + phosphate → thymine + 2-deoxy-D-ribose-1-phosphate). In higher eukaryotes, TP plays the role of platlet-derived endothelial cell growth factor [23], evidently by virtue of the fact that the deoxyribose sugar product is used as an angiogenesis-inducing factor [24]. TP also has gliostatin activity. Profile-induced multiple alignments of this protein show a great degree of conservation over the pathogenic positions, particularly for the Gly153 → Ser mutation (Figure 8). Glycine is absolutely preserved at this position, indicating that it may be critical for proper folding. Substituting a serine could disrupt this, although a preceding glycine may partially compensate. The Gly145 → Arg substitution does not disrupt an absolutely conserved position as serine is also permitted, but it introduces a large, basic (and partly hydrophobic) residue that presumably diminishes at least one key function of TP. Lys222 → Ser and Glu289 → Ala both disrupt absolutely conserved sequence positions, the former of which lies on the periphery of the active site (data not shown). Ghu289 participates in some partly buried conserved ionic interactions more than 15 Å distant from the active site (data not shown).
Figure 8.
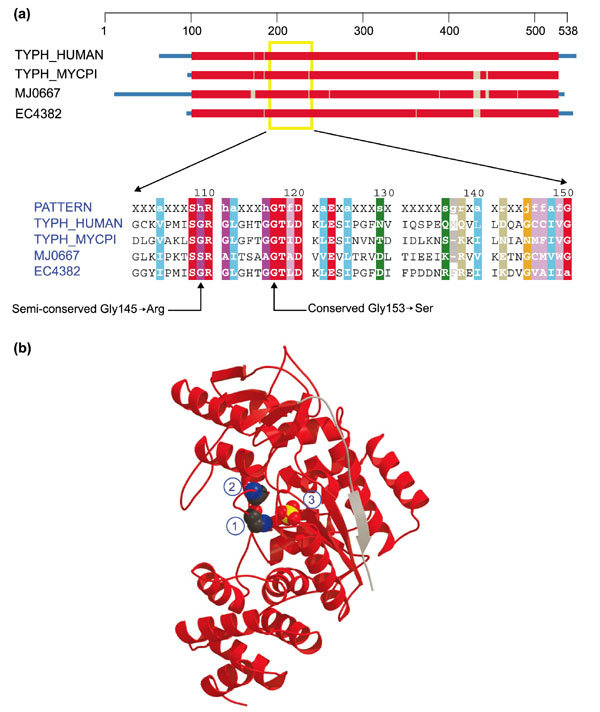
Domain diagram and structure of thymidine phosphorylase (TP). (a) Domain diagram and partial alignment for thymidine phosphorylase. The columns indicated by arrows at the bottom correspond to positions 145 and 153 of TYPH_HUMAN. Sequences are obtained from H. sapiens (TYPH_HUMAN), Mycoplasma pyrum (TYPH_MYCPI), Methanococcus jannaschii (MJ0667) and E. coli (EC4382). Colors are as in Figure 1. (b) Ribbon diagram of TP (E. coli). Structure from the Protein Data Bank (code: 2TPT). Space-filling representations show a sulfate ion (center) (3) and two conserved glycines (left), the lower of which (1) aligns with Gly145 in TYPH_HUMAN and the other (2) with Gly153 in TYPH_HUMAN.
Deafness-dystonia
Deafness-dystonia, or Mohr-Tranebjaerg syndrome, is a mitochondrial protein import disorder. Mutations in DDP1 (deafness/dystonia peptide 1) lead to deafness-dystonia. In two cases seen to date, a 1 bp deletion in exon 1 (T151del) results in a frameshift, leading to incorporation of 25 new amino acids after Glu38, followed by a stop codon. In a second case, a 10 bp deletion in exon 2 causes a frameshift at Met48, leading to incorporation of 12 new residues and a stop codon [25]. These proteins are homologous to the yeast mitochondrial import protein Tim8p (YJR135W-A) [26].
As seen in Figure 9, both frameshift mutations lead to elimination of a highly conserved motif (NCVpRFaDT) near the carboxyl terminus of the peptide - a region that must be critical to proper function or folding. The recent publication of the first DDP missense mutation (Cys66 → Trp) [27] strongly supports this prior conclusion based on the frameshifts. As neither Tim8p nor any close homolog has yet had its structure determined, we cannot infer detailed structure-function relationships. Tim8p and Tim13p exist in the mitochondrial intermembrane space and determine the location of Tim9p. Tim9p is located either in the 70 kDa import complex between the mitochondrial membranes or the 300 kDa TIM22 complex embedded in the inner membrane [28]. Deletions of Tim8p affect the ability to import mitochondrial proteins that become embedded in the inner membrane [29]. It is possible that the frameshift mutations seen in deafness-dystonia interfere with the interface between Tim8p and Tim13p.
Figure 9.

Domain diagram and complete alignment for Tim8p. The columns indicated by the two arrows on the right correspond to positions 39 and 49 of DDP_HUMAN. Sequences are obtained from C. elegans (CEY39A3C_83_D), D. melanogaster (CT4964), H. sapiens (DDP_HUMAN) and S. cerevisiae (YJR135W-A). Colors are as in Figure 1.
Iron-storage disorders
Friedreich's ataxia also falls into the category of a class II mtDNA damage/repair disorder. It is characterized by progressive gait and limb ataxia, lack of tendon reflexes, dysarthria and pyramidal weakness in inferior limbs [30]. Lack of frataxin protein causes a build-up of iron in the matrix spaces of the mitochondria. As iron accumulates, it competes with catalase for hydrogen peroxide and forms hydroxyl radicals (Fe2+ + H2O2 → Fe3+ + OH- + OH·) - so-called reactive oxygen species that can attack mtDNA, membrane lipids, carbohydrates and proteins. This can damage the entire oxidative phosphorylation system, especially the highly vulnerable iron-sulfur centers. The shortage of frataxin does not result from formation of mutant proteins, but rather from expansion of a GAA repeat in the first intron of the frataxin gene. This expanded repeat is believed to form localized RNA secondary structures that interfere with transcription [31, 32]. Yfh1p (YDL120W), the frataxin homolog in yeast, interacts with the yeast mitochondrial intermediate peptidase (Oct1, YKL134C) to lower matrix iron concentration, directly and by competition [33].
Normal mitochondrial iron homeostasis minimally depends on wild-type frataxin to control efflux. Both proteolytic cleavage (via MPP and/or IMP complexes) and chaperonin help (mt-HSP70/Ssc2p) in membrane trafficking and/or folding are needed for the mature frataxin protein to arrive at its destination in the matrix in its proper conformation. Iron efflux also depends upon the iron-sulfur cluster transporter Atm1p (YMR301C). A missense mutation in Abcb7 (or hABC7 the human homolog of Atm1p), Ile400 → Met, has been implicated in X-linked sideroblastic anemia and ataxia [34], a disorder closely related to Friedreich's ataxia. Figure 10 summarizes the sequence and phylogenetic context for this pathogenic change. No experimental structural data are available, but discrete state-space models [35, 36] (H. He, G. McAllister and T.F. Smith, manuscript in preparation) for membrane proteins clearly indicate that the mutation falls in an extracellular tight turn between transmembrane helices five and six.
Figure 10.
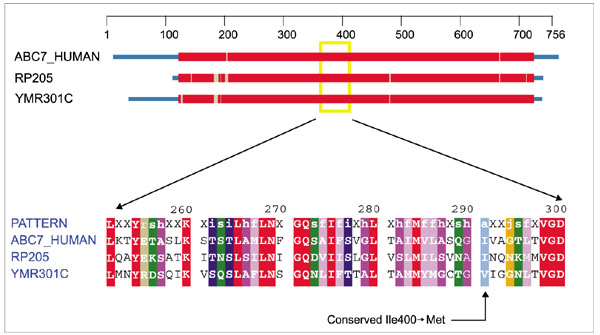
Domain diagram and partial alignment for the Fe-S cluster transporter Atm1p. The column indicated by the arrow at the bottom corresponds to position 400 of ABC7_HUMAN. Sequences are obtained from H. sapiens (ABC7_HUMAN), R. prowazekii (RP205) and S. cerevisiae (YMR301C). Colors are as in Figure 1.
A pair of cation transporters, Mmt1 (YMR177W) and Mmt2 (YPL224C) in yeast, controls iron influx into the mitochondria. This other half of iron homeostasis could also easily have a role in Friedreich's ataxia and X-linked sideroblastic anemia.
Hereditary spastic paraplegia
Hereditary spastic paraplegia (HSP), a class II assembly disorder, is characterized by progressive, usually severe, lower extremity spasticity due to degeneration of the long axons of the central nervous system (while the cell bodies remain intact). Inheritance can be autosomal dominant, autosomal recessive or X-linked. Some cases of HSP result from mutations in the gene for paraplegin, a nuclear-encoded mitochondrial metalloprotease, including: a 2 bp deletion at position 784, which causes a frameshift that eliminates 60% of the protein; and an adenine insertion at position 2,228 of the paraplegin cDNA, which creates a frameshift resulting in truncation of the last 57 residues of this 795-residue protein [37]. As shown in Figure 11, there are very few well conserved positions in the deleted 57-residue tail, implying that this may be a comparatively disordered part of the protein. No missense mutations have been found in human paraplegin to date. This protein resembles three yeast proteins which function as chaperonins and/or proteases: Afg3p (YER017C), Rca1p (YMRo89C) and Yme1p (YPR024W). They participate in recycling the components of complex V (ATP synthase) as well as in its assembly. The products of YER017C and YMR089C make up the mitochondrial adenosine triphosphatase (m-AAA) protease complex, which is embedded in the inner mitochondrial membrane facing the matrix. YPR024W encodes the i-AAA protease complex, which faces the intermembrane space.
Figure 11.
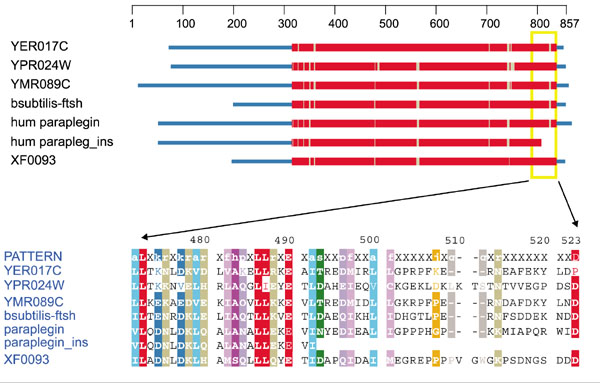
Domain diagram and partial alignment for the mitochondrial AAA-proteases. Sequences are obtained from H. sapiens (paraplegin and paraplegin_ins containing the adenine insertion), B. subtilis (bsubtilis-ftsh), Xylella fastidiosa (XF0093) and S. cerevisiae (YER017C, YPR024W and YMR089C). Colors are as in Figure 1.
The yeast m-AAA protease complex is itself regulated by two prohibitin proteins, Phb1 (YGR132C) and Phb2 (YGR231C) [38]. Paraplegin homologs, analogous to the yeast paralogs Afg3p, Rca1p and Yme1p, must almost certainly exist, and human prohibitins may be expected as well. Point mutations in conserved regions of these proteins can be expected to cause missense mutations and translational truncations that will also lead to hereditary spastic paraplegia.
Discussion
The process of understanding genetic disease typically proceeds through three stages: first, recognition of the disease state or syndrome including its hereditary character; second, discovery and mapping of the related mutation(s); and third, elucidation of the biochemical/biophysical mechanism leading to the disease phenotype. Sickle-cell anemia provides the classic example. In the case of mitochondrial diseases there are more than 100 described conditions (OMIM [39], MITOP [40], and WUSTL [5] websites) and a comparable (and growing!) number of mutations [8]. As already described for LHON, Leigh syndrome and HSP, the causative mutations are not necessarily confined to a single protein-coding gene, or even to the nuclear versus the mitochondrial genome. Put differently, there is no one-to-one mapping between mutations (or even whole genes) and a particular defined disease entity. Thus, each disease spectrum may correspond to several sets of mutations, each set affecting one protein or protein subunit. Obviously, mutations in mt-tRNA, mt-rRNA and proteins that affect mitochondrial gene expression will also potentially have pleiotropic effects.
The results presented here address the third stage of understanding genetic disease, namely the characterization of the disease phenotype at the molecular level with a view to explaining its biochemical mechanism. In principle, the approach can be applied to any mutated protein-coding gene. When structural information is available, the exact mechanism of disease causation may be ascertainable at the molecular level - and testable by means of carefully targeted experiments. A further extension of this basic-knowledge approach lies in the direction of molecular evolution. As we will show elsewhere (T.P., T.F.S. and S.C.M., unpublished observations), the extended sets of homologs assembled using prior-based profiles provide a rich source of phylogenetic information. Not only should it be possible to sketch out the history of the development of different biochemical machineries, it should also be possible to establish which parts of the proteins are most critical to function on the basis of amino-acid sequence conservation correlated with the structural contexts.
Knowledge gained by the approach described here has obvious application to both the diagnosis and therapy of mitochondrial diseases. Once a mutation has been characterized, the exact nature of the associated illness is known with precision. This has a bearing upon choice of therapy and allows a much more exact prognosis than a characterization simply as, say, Leigh syndrome. In addition, the information from sequence alignments has predictive power: mutations not yet recorded in the literature might turn up at key positions in some of the proteins known to be affected in mitochondrial diseases. Individuals carrying such changes might be alerted to the possible harmful consequences and take whatever precautionary measures seem appropriate. (Note that substitutions in the human sequence that match amino-acid residues found at the corresponding locations in taxonomically distant sequences are less likely to prove harmful than completely novel substitutions.) This application of informatics data will certainly grow in importance as acquisition of additional single-nucleotide polymorphism (SNP) data becomes increasingly common and new paralogs and orthologs are added to the sequence database. Finally, depending on the nature of the affected protein and the frequency of occurrence of diseased individuals, it may be possible to use the data for attempts at rational drug design or gene therapy.
The work reported here represents a preliminary overview of the field. Eventually, an exhaustive survey should be completed, continuously updated and made publicly available. That will require precise characterization of many more mutations as well as expansion of the database of mitochondrial protein profiles beyond what we have constructed using yeast as a model. Such efforts are underway.
Materials and methods
Yeast mitochondrial protein database (YMPD)
We created a database of >430 yeast mitochondrial proteins using biochemical keyword searches for known mitchondrial processes from the Saccharomyces Genome Database [41], the Munich Information Center for Protein Sequences [42], the Yeast Proteome Database [43], and MitBASE [44], and by monitoring the current literature. Each member of this set of proteins is characterized by at least one prior-based profile [1] that represents the most conserved region(s).
As S. cerevisiae does not use a canonical mitochondrial complex I we have substituted the NADH dehydrogenase protein subunits from R. americana to initialize these profiles.
Developing prior-based profiles
Prior-based profiles [1], the principal tools used in this work, represent evolutionarily conserved, sequence-based, functional domains. Once created, each profile can be used to search all available databases in an attempt to locate all homologous sequence matches - which in ideal cases correspond to single protein domains. This expanded set of homologous sequences is then multiply-aligned using the profile as a template. The set of multiply-aligned sequences defines sequence-domain boundaries, allows putative functional assignments for previously unidentified proteins and highlights key conserved residues of members of a homologous set of proteins. As new sequences (and sequenced genomes) become available, our set of profiles can identify the additional homologs with high sensitivity and specificity [1].
The profile-defining set
A defining set with a wide taxonomic spread should be optimal for locating distant homologs from as many species as possible. Ideal profiles have a defining set composed of one protein each from a eukaryote, an archaeon, a Gram-positive bacterium and a Gram-negative bacterium, and one yeast mitochondrial protein. To create the defining set for each profile, we established a superset of potential family members using BLAST searches [45] against our Biomolecular Engineering Research Center (BMERC) all-genomes database and Swiss-Prot [46]. Each identified yeast mitochondrial protein serves as a 'seed' (initializing protein) for a BLAST search. The cutoff scores are set at an expectation value of E= 10-6 using the standard SEG and XNU filters for low-complexity regions [47]. From these BLAST hits we selected the initial defining set of maximum taxonomic spread. In some cases, BLAST fails to locate sequence homologs that have diverged greatly from the seed mitochondrial protein. We then used an iterative procedure to generate a profile using local dynamic programming, to maximize the information content. For such cases, the initial profile is run against the all-genomes database by exhaustive local dynamic programming. Then the next highest scoring member from a different kingdom is added to the defining set. We iterated this process until the ideal taxonomic spread was achieved or the information content of the profile dropped below ten amino-acid equivalencies [48].
Expanding the set of profile homologs
Once a profile is built we attempt to find all sequences sharing this sequence domain. This is done by heuristic and/or exhaustive approaches. In the heuristic approach the profile searches BMERC's all-genomes and Swiss-Prot by filtering the larger databases using BLAST with an expectation value cutoff of E = 10-2, followed by a short-in-long profile search. In the exhaustive approach, the profile searches the all-genomes database or the current version of Swiss-Prot using short-in-long dynamic programming.
Multiple alignment sets
Each profile induces a multiple alignment for any set of proteins that contain it. The profiles only align those subregions of a protein that they match. These regions incorporate the most conserved amino-acid positions among the sequences that make up the profile's defining set. We have chosen defining sets that contain the shortest informative protein sequence in order to maximize the chance of producing single-domain profile objects. A longer sequence in the defining set might make a slightly higher-scoring profile by the addition of a few carboxy- or amino-terminal residues, but only at the risk of missing slightly shorter members of the set when the profile is used to search the databases.
Homologous structures from the Protein Data Bank
We routinely search the RCSB Protein Data Bank [49], for potential structural homologs. Profile matches with Z-scores above 10 are retained and used to align the profile-matched region to a structural domain. These profile-induced structural alignments can be visualized in Rasmol [50], and images built using Molscript [51] and Rasters3D [52].
Additional data files
The following additional data files are available with this paper online: complete alignments for the profile-covered regions of the sequences shown in Figure 1 (additonal data file 1), Figure 2 (additonal data file 2), Figure 3 (additonal data file 3), Figure 4 (additonal data file 4), Figure 5 (additonal data file 5), Figure 6 (additonal data file 6), Figure 7 (additonal data file 7), Figure 8 (additonal data file 8), Figure 9 (additonal data file 9), Figure 10 (additonal data file 10) and Figure 11 (additonal data file 11).
Supplementary Material
Acknowledgments
Acknowledgements
We thank Greg McAllister for helpful discussions of transmembrane protein structures. This work was partially supported by US Department of Energy Grant DE-FG02-98ER62558 and NSF Grant DBI-9807993.
References
- Das S, Smith TF. Identifying nature's protein Lego set. In Advances in Protein Chemistry Edited by Richards FM, Eisenberg DS,Kim PS San Diego: Academic Press; 2000. pp. 159–183. [DOI] [PubMed]
- Lang BF, Burger G, O'Kelly CJ, Cedergren R, Golding GB, Lemieux C, Sankoff D, Turmel M, Gray MW. An ancestral mitochondrial DNA resembling a eubacterial genome in miniature. Nature. 1997;387:493–497. doi: 10.1038/387493a0. [DOI] [PubMed] [Google Scholar]
- Taanman JW. The mitochondrial genome: structure, transcription, translation and replication. Biochim Biophys Acta. 1999;1410:103–123. doi: 10.1016/s0005-2728(98)00161-3. [DOI] [PubMed] [Google Scholar]
- Leonard JV, Schapira AH. Mitochondrial respiratory chain disorders I: mitochondrial DNA defects. Lancet. 2000;355:299–304. doi: 10.1016/s0140-6736(99)05225-3. [DOI] [PubMed] [Google Scholar]
- Mitochondrial disorders http://www.neuro.wustl.edu/neuromuscular/mitosyn.html
- Rizzuto R, Pinton P, Carrington W, Fay FS, Fogarty KE, Lifshitz LM, Tuft RA, Pozzan T. Close contacts with the endoplasmic reticulum as determinants of mitochondrial Ca2+ responses. Science. 1998;280:1763–1766. doi: 10.1126/science.280.5370.1763. [DOI] [PubMed] [Google Scholar]
- Skulachev VP. Mitochondrial filaments and clusters as intracellular power-transmitting cables. Trends Biochem Sci. 2001;26:23–29. doi: 10.1016/s0968-0004(00)01735-7. [DOI] [PubMed] [Google Scholar]
- Schapira AH. Mitochondrial disorders. Biochim Biophys Acta. 1999;1410:99–102. doi: 10.1016/s0005-2728(98)00160-1. [DOI] [PubMed] [Google Scholar]
- Hayashi J, Ohta S, Kikuchi A, Takemitsu M, Goto Y, Nonaka I. Introduction of disease-related mitochondrial DNA deletions into HeLa cells lacking mitochondrial DNA results in mitochondrial dysfunction. Proc Natl Acad Sci USA. 1991;88:10614–10618. doi: 10.1073/pnas.88.23.10614. [DOI] [PMC free article] [PubMed] [Google Scholar]
- Chomyn A, Martinuzzi A, Yoneda M, Daga A, Hurko O, Johns D, Lai ST, Nonaka I, Angelini C, Attardi G. MELAS mutation in mtDNA binding site for transcription termination factor causes defects in protein synthesis and in respiration but no change in levels of upstream and downstream mature transcripts. Proc Natl Acad Sci USA. 1992;89:4221–4225. doi: 10.1073/pnas.89.10.4221. [DOI] [PMC free article] [PubMed] [Google Scholar]
- Riordan-Eva P, Harding AE. Leber's hereditary optic neuropathy: the clinical relevance of different mitochondrial DNA mutations. J Med Genet. 1995;32:81–87. doi: 10.1136/jmg.32.2.81. [DOI] [PMC free article] [PubMed] [Google Scholar]
- Brown MD, Voljavec AS, Lott MT, MacDonald I, Wallace DC. Leber's hereditary optic neuropathy: a model for mitochondrial neurodegenerative diseases. FASEB J. 1992;6:2791–2799. doi: 10.1096/fasebj.6.10.1634041. [DOI] [PubMed] [Google Scholar]
- Zeviani M, Bertagnolio B, Uziel G. Neurological presentations of mitochondrial diseases. J Inherit Metab Dis. 1996;19:504–520. doi: 10.1007/BF01799111. [DOI] [PubMed] [Google Scholar]
- Trounce I, Neill S, Wallace DC. Cytoplasmic transfer of the mtDNA nt 8993 T → G (ATP6) point mutation associated with Leigh syndrome into mtDNA-less cells demonstrates cosegregation with a decrease in state III respiration and ADP/O ratio. Proc Natl Acad Sci USA. 1994;91:8334–8338. doi: 10.1073/pnas.91.18.8334. [DOI] [PMC free article] [PubMed] [Google Scholar]
- Santorelli FM, Shanske S, Macaya A, DeVivo DC, DiMauro S. The mutation at nt 8993 of mitochondrial DNA is a common cause of Leigh's syndrome. Ann Neurol. 1993;34:827–834. doi: 10.1002/ana.410340612. [DOI] [PubMed] [Google Scholar]
- Marsac C, Benelli C, Desguerre I, Diry M, Fouque F, De Meirleir L, Ponsot G, Seneca S, Poggi F, Saudubray JM, et al. Biochemical and genetic studies of four patients with pyruvate dehydrogenase E1 alpha deficiency. Hum Genet. 1997;99:785–792. doi: 10.1007/s004390050449. [DOI] [PubMed] [Google Scholar]
- Dahl H-HM. Getting to the nucleus of mitochondrial disorders: Identification of respiratory chain-enzyme genes causing Leigh syndrome. Am J Hum Genet. 1998;63:1594–1597. doi: 10.1086/302169. [DOI] [PMC free article] [PubMed] [Google Scholar]
- Tiranti V, Hoertnagel K, Carrozzo R, Galimberti C, Munaro M, Granatiero M, Zelante L, Gasparini P, Marzella R, Rocchi M, et al. Mutations of SURF-1 in Leigh disease associated with cytochrome c oxidase deficiency. Am J Hum Genet. 1998;63:1609–1621. doi: 10.1086/302150. [DOI] [PMC free article] [PubMed] [Google Scholar]
- Poyau A, Buchet K, Bouzidi MF, Zabot MT, Echenne B, Yao J, Shoubridge EA, Godinot C. Missense mutations in SURF1 associated with deficient cytochrome c oxidase assembly in Leigh syndrome patients. Hum Genet. 2000;106:194–205. doi: 10.1007/s004390051028. [DOI] [PubMed] [Google Scholar]
- Bourgeron T, Rustin P, Chretien D, Birch-Machin M, Bourgeois M, Viegas-Pequignot E, Munnich A, Rotig A. Mutation of a nuclear succinate dehydrogenase gene results in mitochondrial respiratory chain deficiency. Nat Genet. 1995;11:144–149. doi: 10.1038/ng1095-144. [DOI] [PubMed] [Google Scholar]
- Parfait B, Chretien D, Rotig A, Marsac C, Munnich A, Rustin P. Compound heterozygous mutations in the flavoprotein gene of the respiratory chain complex II in a patient with Leigh syndrome. Hum Genet. 2000;106:236–243. doi: 10.1007/s004390051033. [DOI] [PubMed] [Google Scholar]
- Nishino I, Spinazzola A, Hirano M. Thymidine phosphorylase gene mutations in MNGIE, a human mitochondrial disorder. Science. 1999;283:689–692. doi: 10.1126/science.283.5402.689. [DOI] [PubMed] [Google Scholar]
- Miyadera K, Dohmae N, Takio K, Sumizawa T, Haraguchi M, Furukawa T, Yamada Y, Akiyama S. Structural characterization of thymidine phosphorylase from human placenta. Biochem Biophys Res Commun. 1995;212:1040–1045. doi: 10.1006/bbrc.1995.2074. [DOI] [PubMed] [Google Scholar]
- Brown NS, Bicknell R. Thymidine phosphorylase, 2-deoxy-D-ribose and angiogenesis. Biochem J. 1998;334:1–8. doi: 10.1042/bj3340001. [DOI] [PMC free article] [PubMed] [Google Scholar]
- Jin H, May M, Tranebjaerg L, Kendall E, Fontan G, Jackson J, Subramony SH, Arena F, Lubs H, Smith S, et al. A novel X-linked gene, DDP, shows mutations in families with deafness (DFN-1), dystonia, mental deficiency and blindness. Nat Genet. 1996;14:177–180. doi: 10.1038/ng1096-177. [DOI] [PubMed] [Google Scholar]
- Koehler CM, Leuenberger D, Merchant S, Renold A, Junne T, Schatz G. Human deafness dystonia syndrome is a mitochondrial disease. Proc Natl Acad Sci USA. 1999;96:2141–2146. doi: 10.1073/pnas.96.5.2141. [DOI] [PMC free article] [PubMed] [Google Scholar]
- Tranebjaerg L, Hamel BC, Gabreels FJ, Renier WO, Van Ghelue M. A de novo missense mutation in a critical domain of the X-linked DDP gene causes the typical deafness-dystonia-optic atrophy syndrome. Eur J Hum Genet. 2000;8:464–467. doi: 10.1038/sj.ejhg.5200483. [DOI] [PubMed] [Google Scholar]
- Koehler CM, Merchant S, Schatz G. How membrane proteins travel across the mitochondrial intermembrane space. Trends Biochem Sci. 1999;24:428–432. doi: 10.1016/s0968-0004(99)01462-0. [DOI] [PubMed] [Google Scholar]
- Leuenberger D, Bally NA, Schatz G, Koehler CM. Different import pathways through the mitochondrial intermembrane space for inner membrane proteins. EMBO J. 1999;18:4816–4822. doi: 10.1093/emboj/18.17.4816. [DOI] [PMC free article] [PubMed] [Google Scholar]
- Rotig A, de Lonlay P, Chretien D, Foury F, Koenig M, Sidi D, Munnich A, Rustin P. Aconitase and mitochondrial iron-sulphur protein deficiency in Friedreich ataxia. Nat Genet. 1997;17:215–217. doi: 10.1038/ng1097-215. [DOI] [PubMed] [Google Scholar]
- Delatycki MB, Williamson R, Forrest SM. Friedreich ataxia: an overview. J Med Genet. 2000;37:1–8. doi: 10.1136/jmg.37.1.1. [DOI] [PMC free article] [PubMed] [Google Scholar]
- Sakamoto N, Chastain PD, Parniewski P, Ohshima K, Pandolfo M, Griffith JD, Wells RD. Sticky DNA: self-association properties of long GAA.TTC repeats in R.R.Y Triplex structures from Friedreich's ataxia. Mol Cell. 1999;3:465–475. doi: 10.1016/s1097-2765(00)80474-8. [DOI] [PubMed] [Google Scholar]
- Branda SS, Yang ZY, Chew A, Isaya G. Mitochondrial intermediate peptidase and the yeast frataxin homolog together maintain mitochondrial iron homeostasis in Saccharomyces cerevisiae. Hum Mol Genet. 1999;8:1099–1110. doi: 10.1093/hmg/8.6.1099. [DOI] [PubMed] [Google Scholar]
- Allikmets R, Raskind WH, Hutchinson A, Schueck ND, Dean M, Koeller DM. Mutation of a putative mitochondrial iron transporter gene (ABC7) in X-linked sideroblastic anemia and ataxia (XLSA/A). Hum Mol Genet. 1999;8:743–749. doi: 10.1093/hmg/8.5.743. [DOI] [PubMed] [Google Scholar]
- Stultz CM, White JV, Smith TF. Structural analysis based on state-space modeling. Protein Sci. 1993;2:305–314. doi: 10.1002/pro.5560020302. [DOI] [PMC free article] [PubMed] [Google Scholar]
- White JV, Stultz CM, Smith TF. Protein classification by stochastic modeling and optimal filtering of amino acid sequences. Math Biosci. 1994;119:35–75. doi: 10.1016/0025-5564(94)90004-3. [DOI] [PubMed] [Google Scholar]
- Casari G, De Fusco M, Ciarmatori S, Zeviani M, Mora M, Fernandez P, De Michele G, Filla A, Cocozza S, Marconi R, et al. Spastic paraplegia and OXPHOS impairment caused by mutations in paraplegin, a nuclear-encoded mitochondrial metallopro-tease. Cell. 1998;93:973–983. doi: 10.1016/s0092-8674(00)81203-9. [DOI] [PubMed] [Google Scholar]
- Steglich G, Neupert W, Langer T. Prohibitins regulate membrane protein degradation by the m-AAA protease in mitochondria. Mol Cell Biol. 1999;19:3435–3442. doi: 10.1128/mcb.19.5.3435. [DOI] [PMC free article] [PubMed] [Google Scholar]
- Online Mendelian Inheritance in Man. http://www.ncbi.nlm.nih.gov/entrez/query.fcgi?db=OMIM
- Mitochondrial Project. http://www.mips.biochem.mpg.de/proj/medgen/mitop/
- Chervitz SA, Hester ET, Ball CA, Dolinski K, Dwight SS, Harris MA, Juvik G, Malekian A, Roberts S, Roe T, et al. Using the Saccharomyces Genome Database (SGD) for analysis of protein similarities and structure. Nucleic Acids Res. 1999;27:74–78. doi: 10.1093/nar/27.1.74. [DOI] [PMC free article] [PubMed] [Google Scholar]
- Mewes HW, Frishman D, Gruber C, Geier B, Haase D, Kaps A, Lemcke K, Mannhaupt G, Pfeiffer F, Schuller C, et al. MIPS: a database for genomes and protein sequences. Nucleic Acids Res. 2000;28:37–40. doi: 10.1093/nar/28.1.37. [DOI] [PMC free article] [PubMed] [Google Scholar]
- Hodges PE, McKee AH, Davis BP, Payne WE, Garrels JI. The Yeast Proteome Database (YPD): a model for the organization and presentation of genome-wide functional data. Nucleic Acids Res. 1999;27:69–73. doi: 10.1093/nar/27.1.69. [DOI] [PMC free article] [PubMed] [Google Scholar]
- de Pinto B, Malladi SB, Altamura N. MitBASE pilot: a database on nuclear genes involved in mitochondrial biogenesis and its regulation in Saccharomyces cerevisiae. Nucleic Acids Res. 1999;27:147–149. doi: 10.1093/nar/27.1.147. [DOI] [PMC free article] [PubMed] [Google Scholar]
- Altschul SF, Gish W, Miller W, Myers EW, Lipman DJ. Basic local alignment search tool. J Mol Biol. 1990;215:403–410. doi: 10.1016/S0022-2836(05)80360-2. [DOI] [PubMed] [Google Scholar]
- Bairoch A, Apweiler R. The SWISS-PROT protein sequence data bank and its supplement TrEMBL in 1999. Nucleic Acids Res. 1999;27:49–54. doi: 10.1093/nar/27.1.49. [DOI] [PMC free article] [PubMed] [Google Scholar]
- Wootton JC, Federhen S. Analysis of compositionally biased regions in sequence databases. Methods Enzymol. 1996;266:554–571. doi: 10.1016/s0076-6879(96)66035-2. [DOI] [PubMed] [Google Scholar]
- Smith RF, Smith TF. Automatic generation of primary sequence patterns from sets of related protein sequences. Proc Natl Acad Sci USA. 1990;87:118–122. doi: 10.1073/pnas.87.1.118. [DOI] [PMC free article] [PubMed] [Google Scholar]
- Berman HM, Westbrook J, Feng Z, Gilliland G, Bhat TN, Weissig H, Shindyalov IN, Bourne PE. The Protein Data Bank. Nucleic Acids Res. 2000;28:235–242. doi: 10.1093/nar/28.1.235. [DOI] [PMC free article] [PubMed] [Google Scholar]
- Sayle RA, Milner-White EJ. RASMOL: biomolecular graphics for all. Trends Biochem Sci. 1995;20:374. doi: 10.1016/s0968-0004(00)89080-5. [DOI] [PubMed] [Google Scholar]
- Kraulis PJ. MOLSCRIPT: a program to produce both detailed and schematic plots of protein structures. J Appl Crystallogr. 1991;24:946–950. [Google Scholar]
- Merritt E, Bacon D. Raster3D: photorealistic molecular graphics. Methods Enzymol. 1997;277:505–524. doi: 10.1016/s0076-6879(97)77028-9. [DOI] [PubMed] [Google Scholar]
- Amino acid classes. http://bmerc-www.bu.edu/description/aaclasses.html
Associated Data
This section collects any data citations, data availability statements, or supplementary materials included in this article.


