

Abstract
Within individual cells, two molecular processes have been implicated as sources of noise in gene expression: (i) Poisson fluctuations in mRNA abundance arising from random birth and death of individual mRNA transcripts or (ii) promoter fluctuations arising from stochastic promoter transitions between different transcriptional states. Steady-state measurements of variance in protein levels are insufficient to discriminate between these two mechanisms, and mRNA single-molecule fluorescence in situ hybridization (smFISH) is challenging when cellular mRNA concentrations are high. Here, we present a perturbation method that discriminates mRNA birth/death fluctuations from promoter fluctuations by measuring transient changes in protein variance and that can operate in the regime of high molecular numbers. Conceptually, the method exploits the fact that transcriptional blockage results in more rapid increases in protein variability when mRNA birth/death fluctuations dominate over promoter fluctuations. We experimentally demonstrate the utility of this perturbation approach in the HIV-1 model system. Our results support promoter fluctuations as the primary noise source in HIV-1 expression. This study illustrates a relatively simple method that complements mRNA smFISH hybridization and can be used with existing GFP-tagged libraries to include or exclude alternate sources of noise in gene expression.
Keywords: constitutive gene-expression, HIV-1 LTR promoter, mRNA single-molecule FISH, stochastic fluctuations, transcription
Introduction
Clonal cell populations exhibit considerable cell-to-cell variation in the levels of any specific protein (Elowitz et al, 2002; Blake et al, 2003; Kaern et al, 2005; Raser and O'Shea, 2005; Sigal et al, 2006; Raj and van Oudenaarden, 2008). This variation or expression noise is essential for diverse cellular processes, such as the regulation of probabilistic cell-fate decisions and the generation of phenotypic heterogeneity across isogenic cell lines (Suel et al, 2006; Maamar et al, 2007; Chang et al, 2008; Losick and Desplan, 2008; Sureka et al, 2008; Singh and Weinberger, 2009; Razooky and Weinberger, 2011; Munsky et al, 2012). Tight control of expression noise is also vital for optimal functioning of housekeeping proteins, and diverse diseased states have been attributed to an increase in expression noise in particular genes (Cook et al, 1998; Kemkemer et al, 2002; Fraser et al, 2004; Bahar et al, 2006). Collectively, these results suggest that gene-expression noise profoundly affects biological function and underscore the importance of developing methods that pinpoint the source of noise in a given gene circuit.
Gene-expression noise is often decomposed into intrinsic and extrinsic noise (Elowitz et al, 2002). While extrinsic noise arises from intercellular differences in the amounts of cellular components (e.g., RNA polymerases and ribosomes), intrinsic noise results from the random timing and discrete nature of biochemical reactions associated with promoter remodeling, transcription, translation, and degradation of mRNA and protein species. Although several techniques are available to separate extrinsic and intrinsic noise (e.g., see Elowitz et al, 2002 and Newman et al, 2006), methods to discriminate between the different sources of intrinsic noise are far less developed. Experimental evidence suggests that transcriptional intrinsic noise originates from two sources: (i) Poisson mRNA fluctuations arising from probabilistic synthesis and decay of individual mRNA transcripts (mRNA birth/death fluctuations) and (ii) promoter switching between different transcriptional states (promoter fluctuations). mRNA birth/death fluctuations constitute a major source of stochasticity in gene expression since many mRNA species are present at very low molecular counts within cells (Bar-Even et al, 2006; Newman et al, 2006; Taniguchi et al, 2010). These mRNA fluctuations are transmitted downstream through translational bursting to generate intercellular variability in protein levels. Alternatively, protein variability results from promoter switching between different transcriptional states. An important consequence of promoter switching is transcriptional bursting, where multiple mRNAs are created per promoter-firing event (Raser and O'Shea, 2004; Golding et al, 2005; Raj et al, 2006; Yunger et al, 2010; Suter et al, 2011; Muramoto et al, 2012). In this study, we sought to develop a method to determine the relative contributions of mRNA birth/death fluctuations and promoter fluctuations to intrinsic gene-expression noise, assuming that protein levels are the only observable state of the system.
At a qualitative level, both mRNA birth/death and promoter fluctuations generate similar predictions for steady-state protein noise levels (Bar-Even et al, 2006; Ingram et al, 2008). Thus, steady-state distributions of protein abundances across cells are insufficient to identify the source of intrinsic expression noise. One increasingly popular method to quantify the extent of stochastic promoter switching relies on counting individual mRNA transcripts in single cells by single-molecule fluorescence in situ hybridization (smFISH) (Raj et al, 2006; Zenklusen et al, 2008; Tan and van Oudenaarden, 2010). mRNA smFISH is a powerful and elegant method, but requires that individual mRNA molecules be long enough to accommodate the binding of at least 20 individual probes. This is needed to insure the spot is sufficiently bright to be distinguished in images and counted, and that the specific mRNA species being analyzed are in a concentration low enough that individual diffraction-limited spots do not spatially overlap.
Here, we report a method for discriminating mRNA birth/death and promoter fluctuations that can be used with highly expressed mRNAs and that is easily implemented across different cell types. More specifically, we show that the dynamical changes in protein noise levels, in response to perturbations, are sufficient to determine the source of intrinsic expression noise. These perturbations can be generated relatively easily with readily available small-molecule pharmaceutical agents that rapidly and efficiently block transcription and translation. We illustrate the experimental utility of this method by perturbing gene expression from the human immunodeficiency virus type 1 (HIV-1) long terminal repeat (LTR) promoter. Transient changes in reporter protein noise levels, in response to small-molecule drugs, show that LTR gene-expression noise results primarily (>90%) from promoter fluctuations.
Results and Discussion
Stochastic gene-expression model
To analyze the different sources of intrinsic noise in protein abundance, we considered a stochastic model of gene expression that incorporates both low-copy mRNA fluctuations and transcriptional bursting (Figure 1). In this model, mRNA transcription and degradation are stochastic events that occur at exponentially distributed time intervals. Each transcriptional event creates a burst of B mRNA molecules, where B is a discrete random variable with probability {B=i}=αi, i∈{1,2,3…} and mean 〈B〉, where the chevrons, 〈〉, represent the expected value. Note that B=1 with a probability of one corresponds to Poisson fluctuations in mRNA counts while a large average burst size 〈B〉 implies transcriptional bursting (i.e., promoter switching between active and inactive promoter states). If m(t) denotes the mRNA population count at time t, then the probability Pj(t) of having j mRNA molecules at time t evolves according to the following chemical master equation:
Figure 1.

Stochastic hybrid model of gene expression with two different sources of noise. Schematic illustrating the two sources of noise: (i) Poisson mRNA fluctuations arising from stochastic production and degradation of individual mRNA molecules, and (ii) promoter fluctuations arising from slow promoter transitions (red arrows) between ‘Gene OFF’ and ‘Gene ON’ states. As protein population counts are often very large, stochasticity in protein dynamics is neglected.
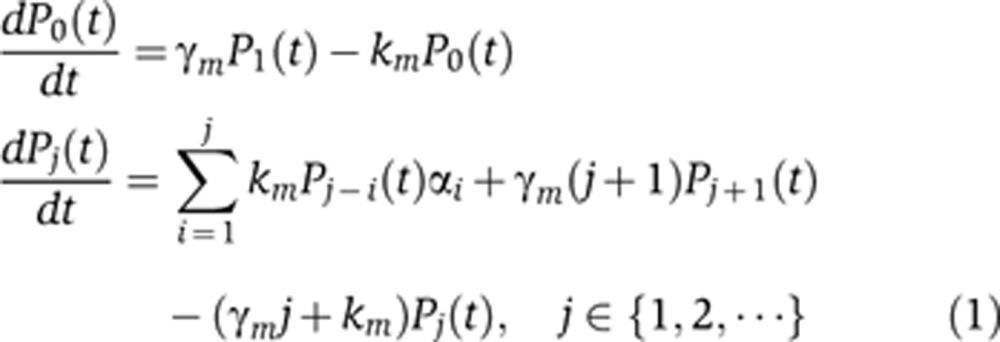 |
where km is the frequency of transcription events and γm represents the mRNA degradation rate (Mcquarrie, 1967). Fluctuations in mRNA counts are transmitted downstream to the protein level, which is assumed to be the only observable state of the system. As protein population counts are typically large, we can ignore Poisson noise arising from stochastic birth and death of individual protein molecules. Accordingly, protein dynamics are modeled deterministically as
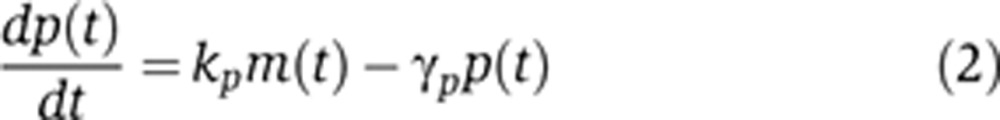 |
where kp is the mRNA translation rate, γp is the protein degradation rate and p(t) denotes the protein count at time t. Together, Equations (1) and (2) constitute a stochastic hybrid gene-expression model in which mRNA time evolution is discrete and stochastic, while protein levels evolve continuously and deterministically.
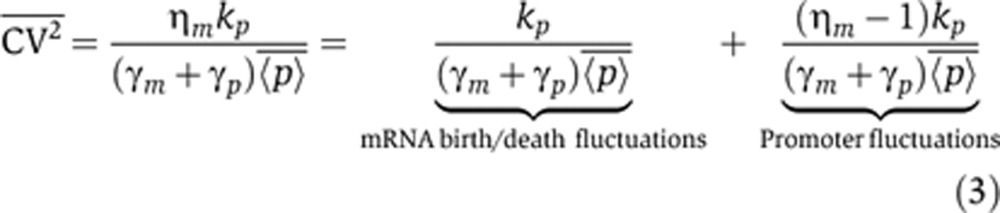
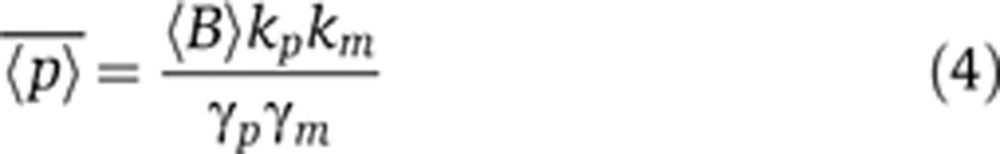
As in many studies, protein-expression noise is quantified using the coefficient of variation squared, defined as CV2=σ2/〈p〉2, where σ2 is the variance in protein level and 〈p〉 denotes the average protein abundance (Paulsson, 2004, 2005; Pedraza and Paulsson, 2008). For the gene-expression model described above, the steady-state protein noise level is given by
 |
where
 |
denotes the steady-state mean protein abundance and
 |
represents the steady-state Fano factor (also known as ‘noise strength’) of the mRNA population count (see Supplementary Appendix A in Supplementary information). Equation 3 represents the total intrinsic noise in gene expression and can be decomposed into components representing expression variability originating from mRNA birth/death fluctuations and stochastic promoter switching. When ηm=1, then mRNA population counts have Poisson statistics, and protein noise levels primarily arise from mRNA birth/death fluctuations. In contrast, when ηm=10, then 90% of the protein noise is generated through promoter fluctuations and transcriptional bursting of mRNAs from the promoter. Finally, we point out that ηm is directly related to the mean transcriptional burst size 〈B〉 for many promoters. In particular, analysis shows that for a two-state promoter model, where the ON state is unstable and the promoter spends most of the time in the OFF state, ηm=1+〈B〉 (see Supplementary Appendix B). Thus, ηm is representative of the mean burst size for many promoters including HIV LTR, which have been shown to reside mostly in the OFF state (Raj et al, 2006; Singh et al, 2010; Suter et al, 2011). We next explore methods to determine ηm for a specific promoter or gene.
Equations 3 and 4 show that increasing the frequency of transcription events, km, increases the steady-state mean protein abundance, but decreases the steady-state noise level such that the product  remains fixed. Thus, intrinsic noise scales inversely with mean protein abundance, consistent with experimental observations in both prokaryotes and eukaryotes (Kepler and Elston, 2001; Thattai and van Oudenaarden, 2001; Ozbudak et al, 2002; Simpson et al, 2004; Bar-Even et al, 2006; Newman et al, 2006). One method to determine ηm would be through the scaling of
  versus
  , as the scaling factor is proportional to it (Equation 3). However, the scaling factor also depends on the mRNA translation rate kp and protein and mRNA half-lives, and thus, this method requires a priori knowledge of these parameters. Moreover, for this
  versus
  method, one needs to quantify protein abundances in absolute molecule counts rather than fluorescence intensities, as is typically the case. Thus, steady-state measurements of protein noise magnitude are insufficient to determine ηm and, hence, insufficient to discriminate between the different components of intrinsic noise. Below, we predict analytically and demonstrate experimentally that ηm can be inferred from transient changes of protein population mean and noise magnitude in response to transcriptional and translational perturbations to gene expression.
Analytical results: dynamics of protein noise magnitude in response to perturbations
Small-molecule drugs provide a convenient method to perturb genetic circuits and realize transient changes in protein levels across different cell types. In this section, we theoretically analyze the effects of small-molecule drugs that specifically block transcription and translation. These drugs are routinely used to determine the stability of mRNAs and proteins (Zhou, 2004; Yen et al, 2008; Hao and Baltimore, 2009). Such experiments typically involve bulk assays that track transient changes in mean molecular abundances across a population of cells. In response to a complete block of translation or transcription, the mean protein levels 〈p(t)〉 decay as,
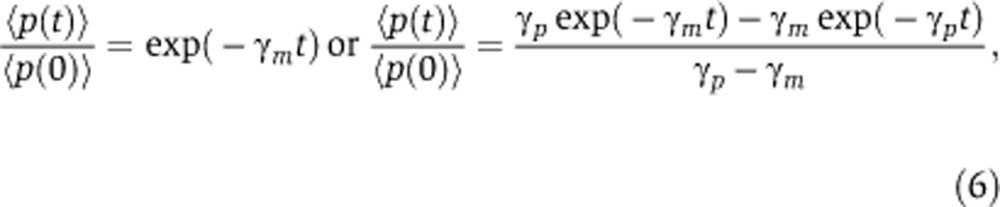 |
respectively, where t represents the time since drug addiction. Thus, both mRNA and protein half-life can be quantified by monitoring 〈p(t)〉 in response to blocks in transcription and translation. Next, we investigate how cell-to-cell variation in protein levels (coefficient of variation squared) changes in response to these small-molecule drugs and whether this change provides information about unknown system parameters, such as ηm.
We first consider a translational block to gene expression. Recall that, in this gene-expression model, protein production and degradation are modeled as differential equations. A translational block would result in a deterministic exponential decay in protein levels in each individual cell, which would shift the distribution of protein level across the cell population to lower levels without changing its coefficient of variation. Thus, in case of a translational block, this model predicts that no additional information can be gained from the higher order statistical moments of p(t).
We next consider a transcriptional block to gene expression by setting the frequency of transcriptional events km=0 at time t=0. Assuming the system was at steady state before the block, the protein-noise level (measured by the coefficient of variation squared, CV2(t)) changes as
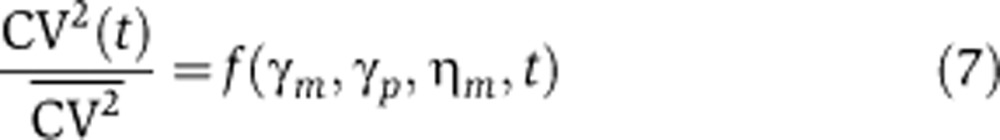 |
where  is the initial protein-noise level given by (3), and function
  is a monotonically increasing function of t (see Supplementary Appendix C in Supplementary information). With transcription blocked, mRNA levels exponentially decay, leading to an increase in cell-to-cell variability, as would be expected from the inverse scaling of noise and mean levels. This increase in mRNA noise is transmitted to encoded proteins, causing CV2(t) to monotonically increase over time (Figure 2). Interestingly, this analysis indicates that the rate of increase of CV2(t) is dependent on the source of intrinsic noise. This point is illustrated in Figure 2, which plots the function
  for different values of ηm, and hence different relative contributions of mRNA birth/death and promoter fluctuations to expression noise. More specifically, as we increase ηm, the initial rise in the protein-noise level becomes more and more gradual. Intuitively, this occurs because, when expression noise results primarily from promoter fluctuations, then mRNA counts are sufficiently high, and mRNA degradation is essentially a deterministic process. Thus, when transcription is blocked, mRNAs degrade approximately deterministically across single cells, which reduces protein levels and generates a slow increase in CV2(t). On the other hand, when expression noise originates from mRNA birth/death fluctuations, then a transcriptional block results in stochastic degradation of mRNAs across the cells, which rapidly increases the protein-noise levels (Figure 2). In summary, the increase in protein cell-to-cell variability after transcription is blocked is dependent on ηm, and the dynamics of CV2(t) can discriminate between alternative sources of intrinsic stochasticity in gene expression. Finally, we point out that although the above results were derived assuming deterministic protein dynamics (i.e., Equation 2), modeling protein synthesis and decay stochastically does not significantly alter the predictions in Figure 2 (see Supplementary Appendix D).
Figure 2.

Transient changes in gene-expression noise can discriminate between mRNA birth/death and promoter fluctuations. Predictions for changes in gene-expression noise after transcription are blocked when protein half-life⩽2 × mRNA half-life (γm⩽2γp, left, note that this is expressed in terms of degradation rate) and protein half-life>2 × mRNA half-life (γm>2γp, right, note that this is expressed in terms of degradation rate), for different contributions of promoter fluctuations to gene-expression noise. If variability in protein levels mainly results from stochastic birth and death of individual mRNA molecules, then CV2(t) is predicted to change much more rapidly than when protein variability results from promoter fluctuations. The y axis is normalized by the CV2(t) at t=0. These simulations were preformed assuming a 2.5-h protein half-life with a 3-h (left) and 1-h (right) mRNA half-life.
Equation 7 shows that the rise in protein-noise levels after a transcription block is dependent on ηm, γm, and γp. Assuming protein and mRNA degradation rates are known or have been determined from the kinetics of protein decay (Equation 6), ηm can be directly inferred from CV2(t). Since this procedure to quantify ηm depends on examining relative changes in CV2(t), it will work irrespective of whether protein levels are quantified in terms of fluorescence intensity or molecular counts. However, if data on absolute protein molecular count are available, then the frequency of transcriptional events km and the mRNA translation rate kp can also be determined from the steady-state protein mean and noise level (Equations 3 and 4). Hence, by combining transient data on the statistical moments of p(t) (Equations 6 and 7) together with their steady-state values (Equations 3 and 4), one can infer all the parameters of the gene-expression model.
One limitation of this method is that it may not be applicable in cases where the mRNA half-life is much shorter than the protein half-life. This limitation arises because when mRNA half-life is short, mRNA transcripts quickly decay to zero once transcription in blocked. With no available mRNA, protein decay will be dominated by protein degradation alone and will not contain any information about the underlying mRNA dynamics. For example, when γm is much larger than γp, then decay in mean protein levels is always given by p(t)=exp(−γpt), irrespective of whether transcription or translation is blocked (Equation 6), hence providing no information on the mRNA half-life. Thus, for this method to work, reporter systems need to be used where both mRNA and protein degradation reactions are first-order processes that occur with known comparable rates. Moreover, small-molecule drugs used for perturbing transcription/translation should not alter these decay rates.
Importantly, the change in protein expression variability after a transcription block becomes insensitive to ηm, when ηm is large. For example, model predictions for ηm equal to 1 and 10 are well separated in Figure 2, but predictions for ηm equal to 10 and 80 are close to each other. Thus, it may not be possible to get precise estimates of ηm by this method, especially when ηm is large (i.e., high levels of transcriptional bursting from the promoter).
Experimental results: HIV-1 LTR gene-expression noise results primarily from promoter fluctuations
In this section, we illustrate the experimental utility of this method by quantifying the relative contributions of mRNA birth/death and promoter fluctuations to HIV-1 expression noise. Stochastic expression of viral proteins from the HIV-1 LTR promoter critically influences the viral-fate decision between active replication and post-integration latency (a dormant state of the virus analogous to phage lysogeny) (Weinberger et al, 2005; Weinberger and Shenk, 2007; Weinberger et al, 2008). Thus, this is an important system to identify the source of intrinsic noise in gene expression.
To discriminate between the different sources of intrinsic noise using the dynamics of protein noise magnitude, it is essential to use a reporter system in which the mRNA half-life is not very short compared to the protein half-life. Toward that end, we used flow cytometry measurements of a destabilized version of GFP (d2GFP) that exhibits a 2.5-h half-life. Previous measurements quantified a 3-h half-life for the d2GFP mRNA (Raj et al, 2006), so γm≈γp for d2GFP, making it an ideal reporter system for this study. To quantify HIV-1 LTR expression noise, we use our previously described library of isoclonal populations (Singh et al, 2010), where each isoclonal population carries a single copy of a minimal vector encoding HIV-1 LTR driving d2GFP, integrated at a unique location in the human genome. To focus on intrinsic noise and remove extrinsic contributions to noise measurements, gating of flow cytometry data was performed as described (Newman et al, 2006; Singh et al, 2010). To filter extrinsic noise, a two-color fluorescent reporter system (Elowitz et al, 2002) was implemented where each cell contains a single integrated copy of the LTR driving d2GFP and a second copy of the LTR driving mCherry at a different integration site (see Supplementary Figure S7). After filtering of extrinsic noise, isoclonal populations exhibit an inverse scaling of steady-state noise level  with mean protein abundance (Singh et al, 2010), as predicted by the model (Equation 3). This inverse scaling of
  versus
  is consistent with both mRNA birth/death and promoter fluctuations (Equation 3), and as mentioned above steady-state protein noise levels are insufficient to discriminate between the different sources of intrinsic noise.
To discriminate between mRNA birth/death and promoter fluctuations, we analyzed dynamic changes in HIV-1 LTR expression noise after perturbation with two transcriptional inhibitors, actinomycin D, a small-molecule drug that rapidly and efficiently blocks transcription by preventing RNA polymerase II (RNAp II) elongation (Sobell, 1985), and Flavopiridol, a small-molecule drug that blocks transcription by inhibiting the interaction of P-TEFb with RNAp II (Chao and Price, 2001). Introducing either transcriptional inhibitor to any of the isoclonal populations resulted in a decrease in d2GFP fluorescence intensity levels that was consistent with the reported 2.5-h d2GFP protein and 3-h d2GFP mRNA half-lives (see Supplementary information and Supplementary Figure S3). The fact that the decay in d2GFP fluorescence after actinomycin D treatment is consistent with the reported 3-h mRNA half-life (Raj et al, 2006) suggests that the dynamics of the reporter decay are not affected by the presence of the drug. The data also show that d2GFP fluorescence decays, in the presence of cycloheximide, at ∼3.5 h both in the presence and absence of actinomycin D (Supplementary Figure S2; Supplementary Appendix E).
In response to both transcriptional inhibitors, the cell-to-cell variability in fluorescence intensity levels across all the isoclonal populations (CV2(t)) gradually increases over time (Figure 3). Fitting the data to model predictions (see Supplementary Appendix F for details) shows that this increase in CV2(t) is inconsistent, for all clones, with a model where intercellular variability in protein levels originates only from mRNA birth/death fluctuations (Figure 3). Instead, the data indicate that promoter fluctuations act as the dominant source of gene-expression noise in the HIV-1 LTR promoter with a mRNA Fano factor (ηm) of at least 10 across four different integration sites (Supplementary Appendix F). Direct measurements of mRNA population statistics by mRNA smFISH also show high levels of transcriptional bursting from the HIV-1 LTR (ηm≈80; see Supplementary Appendix G) and provide an independent experimental verification of the proposed method.
Figure 3.
Transcriptional bursting is a significant source of variability in HIV-1 LTR gene-expression across different integration sites. Time courses of CV2(t) of GFP expression, as measured by flow cytometry, for four isoclonal Jurkat T lymphocyte populations (F32, G95, LL44, and LL8) after perturbation with transcriptional blocking drugs actinomycin D (left column) or flavopiridol (right column). The transient increases in gene-expression noise after transcriptional blocking were consistent with a model in which HIV-1 LTR expression noise is primarily due to transcriptional bursting of mRNAs from the viral promoter (red lines; ηm=15). In contrast, a model in which mRNA birth/death fluctuations act as the dominant source of gene-expression noise (black dashed lines; ηm=1), overestimates the observed transient increase in CV2(t) for all clones. All quantities are normalized by their corresponding values of CV2(t) at t=0; error bars show 95% confidence interval for the CV2(t). Source data is available for this figure in the Supplementary Information.

Conclusions
In summary, we present a simple method to discriminate between mRNA birth/death and promoter fluctuations by measuring the dynamics of protein-expression noise in response to perturbations. This perturbation approach is complementary to other methods, such as mRNA smFISH, as it only requires data at the protein level and can work at high mRNA-expression levels. With the large libraries of GFP-tagged proteins and reporters already exist for many systems, it may be possible to quantify the extent of transcriptional bursting across the genome without having to design individual mRNA smFISH probes for each gene.
One potential shortcoming of this approach is that changes in expression noise in response to perturbations can be sensitive to extrinsic noise in the system. For example, in the absence of extrinsic noise, different intrinsic-noise mechanisms predict very distinct changes in CV2(t) in response to perturbations (Figure 2). However, a constitutive promoter with high levels of extrinsic noise in the transcription rate and a promoter with transcriptional bursting can have similar changes in CV2(t) after transcription is blocked. Thus, the presence of extrinsic noise hampers the ability to discriminate the different sources of intrinsic noise. These results emphasize that, to discriminate mRNA birth/death and promoter fluctuations, extrinsic noise in gene expression must be filtered out by appropriate gating of cells or use of two-color reporter systems (as done in this paper; see Supplementary Appendix H).
Recent theoretical observations suggest that, during cell division, stochastic partitioning of molecules results in the cell-to-cell variability observed in clonal populations (Huh and Paulsson, 2011). However, the present study focuses on transient changes in noise within a clonal population instead of steady-state measurements. The 12-hour duration of our experiments is also much shorter than the ∼30-hour doubling time of Jurkat cells, therefore minimizing effects that may be due to stochastic partitioning during the course of the experiment. Most importantly, the perturbations performed in the present study utilize small molecules, actinomycin D and flavopiridol, that induce cell-cycle arrest (Kuerbitz et al, 1992; Nelson and Kastan, 1994; Schrump et al, 1998; Shapiro et al, 1999) therefore circumventing any added stochastic effects arising from partitioning.
Measuring transient changes in reporter expression noise in response to a transcriptional block showed that transcriptional bursting of mRNAs from the HIV-1 LTR is a significant source of noise in viral gene expression. It is now well established that the HIV-1 LTR exhibits a block in transcriptional elongation: after transcriptional initiation from the LTR, RNAp II is poorly processive and stalls 50–70 nucleotides after initiation proximal to a nucleosome referred to as nuc-1 (Kao et al, 1987; Jordan et al, 2003). One attractive model is that the stochastic recruitment of elongation and chromatin remodeling factors can enhance elongation processivity and remodel nuc-1, respectively, resulting in a stochastic burst of multiple stalled mRNAs (Singh et al, 2010). Such transcriptional bursting can be an important regulatory mechanism to generate high cell-to-cell variability in the levels of expressed viral proteins for HIV-1 decision-making between active replication and latency in single cells. These results add to an increasing body of work (Austin et al, 2006; Cox et al, 2008; Dunlop et al, 2008; Warmflash and Dinner, 2008; Munsky et al, 2009; Sanchez et al, 2011; Wong et al, 2011) showing that fluctuations in protein levels carry important information, and that measuring statistical properties of these fluctuations can be an important tool for characterizing the regulatory mechanisms of genetic circuits.
Materials and methods
Construction and maintenance of isoclonal populations
Isoclonal populations containing a single integrated copy of either one or both minimal vectors encoding HIV-1 LTR driving d2GFP (termed as LTR-d2GFP) or HIV-1 LTR driving Cherry (termed as LTR-mCh) were constructed as described (Weinberger et al, 2008). Individual isoclonal populations were maintained in RPMI-1640 (supplemented with L-glutamine, 10% fetal bovine serum, and 1% penicillin-streptomycin) in a humidified environment at 37°C and maintained by passage at between 2 × 10⁵ and 2 × 10⁶ cells/ml.
Blocking gene expression with small-molecule drugs
To measure transient changes in reporter expression after a transcriptional block, actinomycin D (Sigma-Aldrich), at a final concentration of 0.1, 1, or 10 μg/ml, or flavopiridol (Sigma-Aldrich), at a final concentration of 3 μM, was added to cells. After the addition of either inhibitor, cells were collected at regular intervals, and the GFP expression for each isoclonal population was measured by flow cytometry on a BD FacsCalibur (BD Biosciences, San Jose, CA; see below). For analyzing transient changes in reporter expression after a translational block, protein synthesis was blocked with cycloheximide (Sigma-Aldrich), at a final concentration of 10 μg/ml. In Supplementary Figure S2 in Supplementary information, both cycloheximide and actinomycin D were added to cells at 10 μg/ml at the same time.
Flow cytometry analysis
Reporter expression in the LTR-d2GFP isoclonal population was measured by flow cytometry on a FACSCalibur and subsequently analyzed using FlowJo™ (Treestar, Ashland, Oregon). Expression variability within the isoclonal population was quantified using the coefficient of heterogeneity in cell size, cell shape, and cell-cycle state (i.e., extrinsic noise) was minimized by a previously adopted approach of drawing a small gate around the forward (FSC) and side (SSC) scatter medians that contains at least 5000 cells (Newman et al, 2006). Coefficient of variation is computed from this gated population with the statistics toolbox in FlowJo.
smFISH microscopy
A smFISH probe set for d2GFP was designed using the online software available from Biosearch Technologies (Novato, CA) (with the following inputs: no masking, 34 probes, 20-nt oligo length, and a spacing of 2 nt. Jurkat T Lymphocytes were stuck down onto No. 1.5 thickness cover glass 8-well plates (Lab-Tek) as described (Weinberger and Shenk, 2007) and fixed for 10 min in 3.7% formaldehyde, followed by treatment with 70% ethanol at 4°C for 18 h. smFISH was performed as described (Waks et al, 2011). Two independent experiments were performed and ∼100 cells were collected for each experiment (196 in total). A Nikon Ti-E widefield epifluorescence microscope equipped with the Nikon Perfect Focus System, automated stage, a Plan Apo 100 × oil 1.4NA objective, CoolSnap HQ2 CCD 14bit Camera, and Sutter Lambda XL lamp excitation light source was used. Each image was acquired with a 3-s exposure time, 260 nm slices in the z-direction, and 45 slices for each position selected.
Image analysis
Quantitative image analysis was performed using code obtained from http://www.biology.ucsd.edu/labs/rifkin/software.html. Image segmentation to differentiate between spots in neighboring cells was performed using custom code written in MATLAB (available upon request).
Supplementary Material
Supplementary Appendices A-H, Supplementary Figures S1-7
Acknowledgments
We thank Roger Tsien and Michael David for flow cytometer use, Scott Rifkin for extensive guidance with the smFISH analysis, and Kurt Thorn and the Nikon Imaging Center at UCSF for technical expertise. BSR is supported by the NSF Graduate Research Fellowship Program (GRFP) and acknowledges support from the NIH Molecular Biophysics Training Grant (Grant GM08326). This work was supported by the NIH Director’s New Innovator Award to LSW (DP2OD006677), and the NIGMS National Systems Biology Centers at UCSD (P50 GM085764) and UCSF (P50 GM081879).
Author contributions: AS designed research, performed experiments, analyzed data, and wrote the paper. BSR performed experiments, analyzed data, and wrote the paper. RDD performed experiments and analyzed data. LSW designed research, analyzed data, and wrote the paper.
Footnotes
The authors declare that they have no conflict of interest.
References
- Austin DW, Allen MS, McCollum JM, Dar RD, Wilgus JR, Sayler GS, Samatova NF, Cox CD, Simpson ML (2006) Gene network shaping of inherent noise spectra. Nature 439: 608–611 [DOI] [PubMed] [Google Scholar]
- Bahar R, Hartmann CH, Rodriguez KA, Denny AD, Busuttil RA, Dolle ME, Calder RB, Chisholm GB, Pollock BH, Klein CA, Vijg J (2006) Increased cell-to-cell variation in gene expression in ageing mouse heart. Nature 441: 1011–1014 [DOI] [PubMed] [Google Scholar]
- Bar-Even A, Paulsson J, Maheshri N, Carmi M, O'Shea E, Pilpel Y, Barkai N (2006) Noise in protein expression scales with natural protein abundance. Nat Genet 38: 636–643 [DOI] [PubMed] [Google Scholar]
- Blake WJ, Kaern M, Cantor CR, Collins JJ (2003) Noise in eukaryotic gene expression. Nature 422: 633–637 [DOI] [PubMed] [Google Scholar]
- Chang HH, Hemberg M, Barahona M, Ingber DE, Huang S (2008) Transcriptome-wide noise controls lineage choice in mammalian progenitor cells. Nature 453: 544–547 [DOI] [PMC free article] [PubMed] [Google Scholar]
- Chao SH, Price DH (2001) Flavopiridol inactivates P-TEFb and blocks most RNA polymerase II transcription in vivo. J Biol Chem 276: 31793–31799 [DOI] [PubMed] [Google Scholar]
- Cook DL, Gerber AN, Tapscott SJ (1998) Modeling stochastic gene expression: implications for haploinsufficiency. Proc Natl Acad Sci USA 95: 15641–15646 [DOI] [PMC free article] [PubMed] [Google Scholar]
- Cox CD, McCollum JM, Allen MS, Dar RD, Simpson ML (2008) Using noise to probe and characterize gene circuits. Proc Natl Acad Sci USA 105: 10809–10814 [DOI] [PMC free article] [PubMed] [Google Scholar]
- Dunlop MJ, Cox RS 3rd, Levine JH, Murray RM, Elowitz MB (2008) Regulatory activity revealed by dynamic correlations in gene expression noise. Nat Genet 40: 1493–1498 [DOI] [PMC free article] [PubMed] [Google Scholar]
- Elowitz MB, Levine AJ, Siggia ED, Swain PS (2002) Stochastic gene expression in a single cell. Science 297: 1183–1186 [DOI] [PubMed] [Google Scholar]
- Fraser HB, Hirsh AE, Giaever G, Kumm J, Eisen MB (2004) Noise minimization in eukaryotic gene expression. PLoS Biol 2: e137. [DOI] [PMC free article] [PubMed] [Google Scholar]
- Golding I, Paulsson J, Zawilski SM, Cox EC (2005) Real-time kinetics of gene activity in individual bacteria. Cell 123: 1025–1036 [DOI] [PubMed] [Google Scholar]
- Hao S, Baltimore D (2009) The stability of mRNA influences the temporal order of the induction of genes encoding inflammatory molecules. Nat Immunol 10: 281–288 [DOI] [PMC free article] [PubMed] [Google Scholar]
- Huh D, Paulsson J (2011) Non-genetic heterogeneity from stochastic partitioning at cell division. Nat Genet 43: 95–100 [DOI] [PMC free article] [PubMed] [Google Scholar]
- Ingram PJ, Stumpf MP, Stark J (2008) Nonidentifiability of the source of intrinsic noise in gene expression from single-burst data. PLoS Comput Biol 4: e1000192. [DOI] [PMC free article] [PubMed] [Google Scholar]
- Jordan A, Bisgrove D, Verdin E (2003) HIV reproducibly establishes a latent infection after acute infection of T cells in vitro. EMBO J 22: 1868–1877 [DOI] [PMC free article] [PubMed] [Google Scholar]
- Kaern M, Elston TC, Blake WJ, Collins JJ (2005) Stochasticity in gene expression: from theories to phenotypes. Nat Rev Genet 6: 451–464 [DOI] [PubMed] [Google Scholar]
- Kao SY, Calman AF, Luciw PA, Peterlin BM (1987) Anti-termination of transcription within the long terminal repeat of HIV-1 by tat gene product. Nature 330: 489–493 [DOI] [PubMed] [Google Scholar]
- Kemkemer R, Schrank S, Vogel W, Gruler H, Kaufmann D (2002) Increased noise as an effect of haploinsufficiency of the tumor-suppressor gene neurofibromatosis type 1 in vitro. Proc Natl Acad Sci USA 99: 13783–13788 [DOI] [PMC free article] [PubMed] [Google Scholar]
- Kepler TB, Elston TC (2001) Stochasticity in transcriptional regulation: origins, consequences, and mathematical representations. Biophys J 81: 3116–3136 [DOI] [PMC free article] [PubMed] [Google Scholar]
- Kuerbitz SJ, Plunkett BS, Walsh WV, Kastan MB (1992) Wild-type p53 is a cell cycle checkpoint determinant following irradiation. Proc Natl Acad Sci USA 89: 7491–7495 [DOI] [PMC free article] [PubMed] [Google Scholar]
- Losick R, Desplan C (2008) Stochasticity and cell fate. Science 320: 65–68 [DOI] [PMC free article] [PubMed] [Google Scholar]
- Maamar H, Raj A, Dubnau D (2007) Noise in gene expression determines cell fate in Bacillus subtilis. Science 317: 526–529 [DOI] [PMC free article] [PubMed] [Google Scholar]
- Mcquarrie DA (1967) Stochastic approach to chemical kinetics. J Appl Probab 4: 413–478 [Google Scholar]
- Munsky B, Neuert G, van Oudenaarden A (2012) Using gene expression noise to understand gene regulation. Science 336: 183–187 [DOI] [PMC free article] [PubMed] [Google Scholar]
- Munsky B, Trinh B, Khammash M (2009) Listening to the noise: random fluctuations reveal gene network parameters. Mol Syst Biol 5: 318. [DOI] [PMC free article] [PubMed] [Google Scholar]
- Muramoto T, Cannon D, Gierlinski M, Corrigan A, Barton GJ, Chubb JR (2012) Live imaging of nascent RNA dynamics reveals distinct types of transcriptional pulse regulation. Proc Natl Acad Sci USA 109: 7350–7355 [DOI] [PMC free article] [PubMed] [Google Scholar]
- Nelson WG, Kastan MB (1994) DNA strand breaks: the DNA template alterations that trigger p53-dependent DNA damage response pathways. Mol Cell Biol 14: 1815–1823 [DOI] [PMC free article] [PubMed] [Google Scholar]
- Newman JR, Ghaemmaghami S, Ihmels J, Breslow DK, Noble M, DeRisi JL, Weissman JS (2006) Single-cell proteomic analysis of S. cerevisiae reveals the architecture of biological noise. Nature 441: 840–846 [DOI] [PubMed] [Google Scholar]
- Ozbudak EM, Thattai M, Kurtser I, Grossman AD, van Oudenaarden A (2002) Regulation of noise in the expression of a single gene. Nat Genet 31: 69–73 [DOI] [PubMed] [Google Scholar]
- Paulsson J (2004) Summing up the noise in gene networks. Nature 427: 415–418 [DOI] [PubMed] [Google Scholar]
- Paulsson J (2005) Models of stochastic gene expression. Phys Life Rev 2: 157–175 [Google Scholar]
- Pedraza JM, Paulsson J (2008) Effects of molecular memory and bursting on fluctuations in gene expression. Science 319: 339–343 [DOI] [PubMed] [Google Scholar]
- Raj A, Peskin CS, Tranchina D, Vargas DY, Tyagi S (2006) Stochastic mRNA synthesis in mammalian cells. PLoS Biol 4: e309. [DOI] [PMC free article] [PubMed] [Google Scholar]
- Raj A, van Oudenaarden A (2008) Nature, nurture, or chance: stochastic gene expression and its consequences. Cell 135: 216–226 [DOI] [PMC free article] [PubMed] [Google Scholar]
- Raser JM, O'Shea EK (2004) Control of stochasticity in eukaryotic gene expression. Science 304: 1811–1814 [DOI] [PMC free article] [PubMed] [Google Scholar]
- Raser JM, O'Shea EK (2005) Noise in gene expression: origins, consequences, and control. Science 309: 2010–2013 [DOI] [PMC free article] [PubMed] [Google Scholar]
- Razooky BS, Weinberger LS (2011) Mapping the architecture of the HIV-1 Tat circuit: A decision-making circuit that lacks bistability and exploits stochastic noise. Methods 53: 68–77 [DOI] [PMC free article] [PubMed] [Google Scholar]
- Sanchez A, Garcia HG, Jones D, Phillips R, Kondev J (2011) Effect of promoter architecture on the cell-to-cell variability in gene expression. PLoS Comput Biol 7: e1001100. [DOI] [PMC free article] [PubMed] [Google Scholar]
- Schrump DS, Matthews W, Chen GA, Mixon A, Altorki NK (1998) Flavopiridol mediates cell cycle arrest and apoptosis in esophageal cancer cells. Clin Cancer Res 4: 2885–2890 [PubMed] [Google Scholar]
- Shapiro GI, Koestner DA, Matranga CB, Rollins BJ (1999) Flavopiridol induces cell cycle arrest and p53-independent apoptosis in non-small cell lung cancer cell lines. Clin Cancer Res 5: 2925–2938 [PubMed] [Google Scholar]
- Sigal A, Milo R, Cohen A, Geva-Zatorsky N, Klein Y, Liron Y, Rosenfeld N, Danon T, Perzov N, Alon U (2006) Variability and memory of protein levels in human cells. Nature 444: 643–646 [DOI] [PubMed] [Google Scholar]
- Simpson ML, Cox CD, Sayler GS (2004) Frequency domain chemical Langevin analysis of stochasticity in gene transcriptional regulation. J Theor Biol 229: 383–394 [DOI] [PubMed] [Google Scholar]
- Singh A, Razooky B, Cox CD, Simpson ML, Weinberger LS (2010) Transcriptional bursting from the HIV-1 promoter is a significant source of stochastic noise in HIV-1 gene expression. Biophys J 98: L32–34 [DOI] [PMC free article] [PubMed] [Google Scholar]
- Singh A, Weinberger LS (2009) Stochastic gene expression as a molecular switch for viral latency. Curr Opin Microbiol 12: 460–466 [DOI] [PMC free article] [PubMed] [Google Scholar]
- Sobell HM (1985) Actinomycin and DNA transcription. Proc Natl Acad Sci USA 82: 5328–5331 [DOI] [PMC free article] [PubMed] [Google Scholar]
- Suel GM, Garcia-Ojalvo J, Liberman LM, Elowitz MB (2006) An excitable gene regulatory circuit induces transient cellular differentiation. Nature 440: 545–550 [DOI] [PubMed] [Google Scholar]
- Sureka K, Ghosh B, Dasgupta A, Basu J, Kundu M, Bose I (2008) Positive feedback and noise activate the stringent response regulator rel in mycobacteria. PLoS ONE 3: e1771. [DOI] [PMC free article] [PubMed] [Google Scholar]
- Suter DM, Molina N, Gatfield D, Schneider K, Schibler U, Naef F (2011) Mammalian genes are transcribed with widely different bursting kinetics. Science 332: 472–474 [DOI] [PubMed] [Google Scholar]
- Tan RZ, van Oudenaarden A (2010) Transcript counting in single cells reveals dynamics of rDNA transcription. Mol Syst Biol 6: 358. [DOI] [PMC free article] [PubMed] [Google Scholar]
- Taniguchi Y, Choi PJ, Li GW, Chen HY, Babu M, Hearn J, Emili A, Xie XS (2010) Quantifying E-coli proteome and transcriptome with single-molecule sensitivity in single cells. Science 329: 533–538 [DOI] [PMC free article] [PubMed] [Google Scholar]
- Thattai M, van Oudenaarden A (2001) Intrinsic noise in gene regulatory networks. Proc Natl Acad Sci USA 98: 8614–8619 [DOI] [PMC free article] [PubMed] [Google Scholar]
- Waks Z, Klein AM, Silver PA (2011) Cell-to-cell variability of alternative RNA splicing. Mol Syst Biol 7: 506. [DOI] [PMC free article] [PubMed] [Google Scholar]
- Warmflash A, Dinner AR (2008) Signatures of combinatorial regulation in intrinsic biological noise. Proc Natl Acad Sci USA 105: 17262–17267 [DOI] [PMC free article] [PubMed] [Google Scholar]
- Weinberger LS, Burnett JC, Toettcher JE, Arkin AP, Schaffer DV (2005) Stochastic gene expression in a lentiviral positive-feedback loop: HIV-1 Tat fluctuations drive phenotypic diversity. Cell 122: 169–182 [DOI] [PubMed] [Google Scholar]
- Weinberger LS, Dar RD, Simpson ML (2008) Transient-mediated fate determination in a transcriptional circuit of HIV. Nat Genet 40: 466–470 [DOI] [PubMed] [Google Scholar]
- Weinberger LS, Shenk T (2007) An HIV feedback resistor: auto-regulatory circuit deactivator and noise buffer. PLoS Biol 5: e9. [DOI] [PMC free article] [PubMed] [Google Scholar]
- Wong JV, Yao G, Nevins JR, You L (2011) Viral-mediated noisy gene expression reveals biphasic E2f1 response to MYC. Mol Cell 41: 275–285 [DOI] [PMC free article] [PubMed] [Google Scholar]
- Yen HC, Xu Q, Chou DM, Zhao Z, Elledge SJ (2008) Global protein stability profiling in mammalian cells. Science 322: 918–923 [DOI] [PubMed] [Google Scholar]
- Yunger S, Rosenfeld L, Garini Y, Shav-Tal Y (2010) Single-allele analysis of transcription kinetics in living mammalian cells. Nat Methods 7: 631–U641 [DOI] [PubMed] [Google Scholar]
- Zenklusen D, Larson DR, Singer RH (2008) Single-RNA counting reveals alternative modes of gene expression in yeast. Nat Struct Mol Biol 15: 1263–1271 [DOI] [PMC free article] [PubMed] [Google Scholar]
- Zhou P (2004) Determining protein half-lives. Methods Mol Biol 284: 67–77 [DOI] [PubMed] [Google Scholar]
Associated Data
This section collects any data citations, data availability statements, or supplementary materials included in this article.
Supplementary Materials
Supplementary Appendices A-H, Supplementary Figures S1-7