The conserved fission yeast protein Skb1 inhibits mitotic entry through the SAD kinase Cdr1. Skb1 and Cdr1 are spatially segregated in discrete sets of stable nodes at the cell cortex. This work reveals new spatial control elements of the mitotic size control system.
Abstract
Cell cycle progression is coupled to cell growth, but the mechanisms that generate growth-dependent cell cycle progression remain unclear. Fission yeast cells enter into mitosis at a defined size due to the conserved cell cycle kinases Cdr1 and Cdr2, which localize to a set of cortical nodes in the cell middle. Cdr2 is regulated by the cell polarity kinase Pom1, suggesting that interactions between cell polarity proteins and the Cdr1-Cdr2 module might underlie the coordination of cell growth and division. To identify the molecular connections between Cdr1/2 and cell polarity, we performed a comprehensive pairwise yeast two-hybrid screen. From the resulting interaction network, we found that the protein Skb1 interacted with both Cdr1 and the Cdr1 inhibitory target Wee1. Skb1 inhibited mitotic entry through negative regulation of Cdr1 and localized to both the cytoplasm and a novel set of cortical nodes. Skb1 nodes were distinct structures from Cdr1/2 nodes, and artificial targeting of Skb1 to Cdr1/2 nodes delayed entry into mitosis. We propose that the formation of distinct node structures in the cell cortex controls signaling pathways to link cell growth and division.
INTRODUCTION
A wide variety of cell types delay cell cycle transitions until they reach a critical size threshold, but the mechanisms that relay size- and growth-dependent signals to the cell cycle machinery remain largely unclear. In yeast through mammals, SAD-family protein kinases promote the G2/M cell cycle transition by down-regulating the mitotic inhibitor Wee1 (Coleman et al., 1993; Parker et al., 1993; Wu and Russell, 1993; Ma et al., 1996; Barral et al., 1999; Lu et al., 2004). The fission yeast SAD kinases Cdr1 and Cdr2 function in a linear pathway and localize in a band of cortical node-like structures in the cell middle (Martin and Berthelot-Grosjean, 2009; Moseley et al., 2009). These nodes also contain Wee1 (Moseley et al., 2009), the inhibitory target of Cdr1 and Cdr2. The formation of cortical nodes may serve to concentrate components of a signaling pathway, such as Cdr1, Cdr2, and Wee1, although these structures may impart additional levels of spatial regulation to the pathway.
Upstream regulators of Cdr1 and Cdr2 may serve as “input” signals to the mitotic size control system, and several such factors have been identified. A key example is the cell polarity protein kinase Pom1, which regulates Cdr2 in a cell size–dependent manner (Martin and Berthelot-Grosjean, 2009; Moseley et al., 2009). Factors such as Nif1 and Fin1 have also been implicated in upstream control of Cdr1-Cdr2 signaling (Wu and Russell, 1997; Grallert et al., 2012). The Pom1-Cdr2 connection raises the possibility that coordination of cell growth and division involves communication between the cell polarity and cell cycle systems. A complete understanding of the mitotic size control system will require systematic identification of such upstream regulators, elucidation of their underlying biochemical mechanisms, and description of how their spatial positioning controls signaling behavior in cells.
Many components of the Cdr2-Cdr1-Wee1 signaling pathway are conserved in the budding yeast Saccharomyces cerevisiae, in which the SAD-family kinase Hsl1 negatively regulates the Wee1-like protein Swe1 (Ma et al., 1996; Barral et al., 1999). This signaling pathway leads to Swe1 degradation and requires the enigmatic PRMT5-family methyltransferase Hsl7 (Ma et al., 1996; McMillan et al., 1999, 2002), which is believed to act as a signaling scaffold to promote mitosis. Hsl1, Hsl7, and Swe1 all colocalize at the bud neck (Shulewitz et al., 1999; Cid et al., 2001; Theesfeld et al., 2003), where signaling likely occurs. In vertebrate cells, Hsl7 also functions to promote mitosis by down-regulating Wee1 (Yamada et al., 2004). This conserved function to promote mitotic entry is contrasted by the fission yeast Hsl7-like protein Skb1. In fission yeast cells, Skb1 inhibits mitotic entry through Wee1 (Gilbreth et al., 1998), but the details of this Skb1 signaling pathway and its spatial control are not known. The different activities of Hsl7 versus Skb1 may reflect plasticity in how a conserved signaling module has evolved to control the cell cycle in distinct cell types.
In this study, we performed a protein–protein interaction screen to identify physical links between cell polarity and the Cdr2-Cdr1-Wee1 system. We found that Skb1 physically interacts with Cdr1 and Wee1, and genetic epistasis places Skb1 as an upstream inhibitor of Cdr1 signaling in cells. Skb1 localizes to a novel set of cortical nodes that are distinct from Cdr2-Cdr1-Wee1 nodes, and these separate structures impart spatial control of the signaling pathway. These results reveal an unexpected spatial organization of the mitotic size control system and indicate the importance of stable signaling domains at the cell cortex.
RESULTS
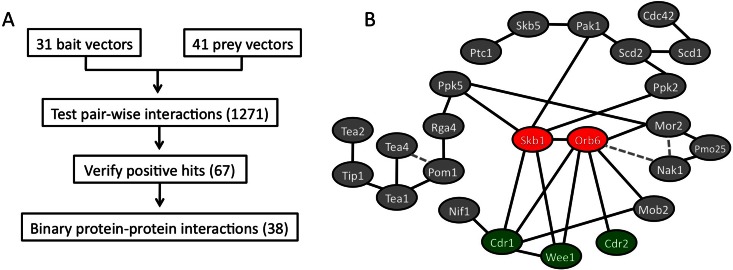
We assembled a list of 37 cell polarity proteins with connections to cell growth and shape. These proteins—along with Cdr1, Cdr2, and Wee1—were tested for all possible binary interactions using a directed yeast two-hybrid assay (Figure 1A). We tested 1271 potential interactions in the screen and identified 67 potential hits. These initial hits were retested and then analyzed under conditions that test stringency of interaction (Supplemental Figure S1B). This approach defined 38 protein–protein interactions, including 17 novel hits (Figure 1B and Supplemental Table S1). Some novel interactions were not observed under stringent conditions and thus require additional interaction tests for verification. We focused on strong bidirectional interactions to identify novel input signals to the Cdr2-Cdr1-Wee1 module.
FIGURE 1:
Pairwise yeast-two hybrid interaction screen. (A) Workflow of directed yeast two-hybrid screen. (B) Protein interactome found in the two-hybrid screen. Solid lines indicate protein–protein interactions; dashed lines denote previously reported interactions (Kanai et al., 2005; Hachet et al., 2011) not found in our large-scale screen.
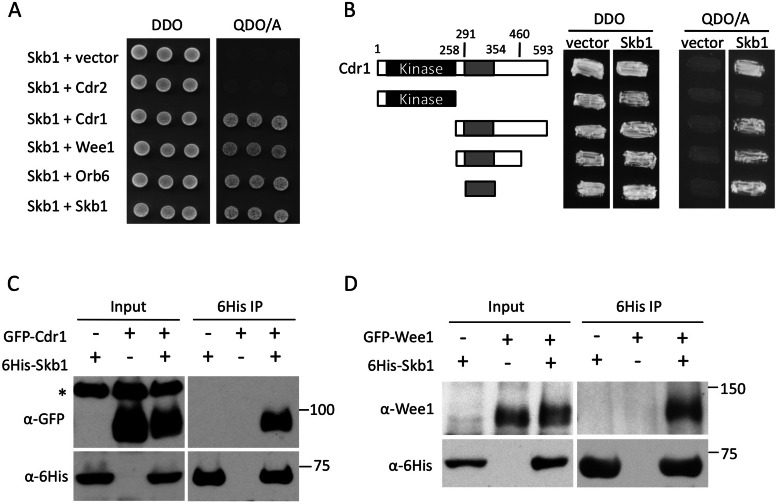
Two interacting proteins—the PRMT5-family arginine methyltransferase Skb1 and the NDR-family kinase Orb6—are positioned in the middle of our interactome (Figure 1B). Skb1 and Orb6 physically interact with each other (Wiley et al., 2003), and each protein was genetically linked with both cell polarity and mitotic entry (Gilbreth et al., 1996, 1998; Verde et al., 1998). In particular, Skb1 displayed strong and novel interactions with Cdr1 and Wee1 (Figure 2A) and was shown to inhibit mitotic entry (Gilbreth et al., 1998). Therefore we decided to investigate the genetic pathway and cellular role of Skb1 in fission yeast mitotic entry.
FIGURE 2:
Skb1 physically interacts with Cdr1 and Wee1. (A) Skb1 interacts with Cdr1, Wee1, Orb6, and itself by two-hybrid assay. Transformants were selected on a double dropout (DDO) plate, and interactions were tested on a quadruple dropout + Aba (QDO/A) plate. (B) Skb1 interacts with a small region of Cdr1 outside of the kinase domain. Transformants were selected on a DDO plate, and interactions were tested on a QDO/A plate. (C, D) Skb1 interacts with Cdr1 and Wee1 by coimmunoprecipitation. The indicated constructs were overexpressed in fission yeast cells, and hexahistidine (6His)-Skb1 was purified by nickel-agarose chromatography. Whole-cell extracts (input) and immunoprecipitations (IP) were probed using anti-6His and anti-GFP or anti-Wee1 antibodies. Asterisk marks a nonspecific band that is absent in IP samples.
In our screen, Skb1 interacted with multiple protein kinases. To eliminate the possibility that Skb1 binds nonspecifically to kinase domains, we mapped the region of Cdr1 that interacts with Skb1. Skb1 did not interact with the kinase domain of Cdr1 but did with a small region (residues 291–354; Figure 2B) outside of the catalytic domain. This region is important for Cdr1 kinase activity (Wu and Russell, 1997). We next tested Skb1 interaction with Cdr1 and Wee1 in fission yeast cell extracts. Both Cdr1 and Wee1 were coimmunoprecipitated with Skb1 (Figure 2, C and D), consistent with their strong interactions by yeast two-hybrid assay. These physical interactions raise the possibility that Skb1 acts as an input signal to Cdr1 for mitotic size control.
Skb1 inhibits mitotic entry through Cdr1 and Wee1
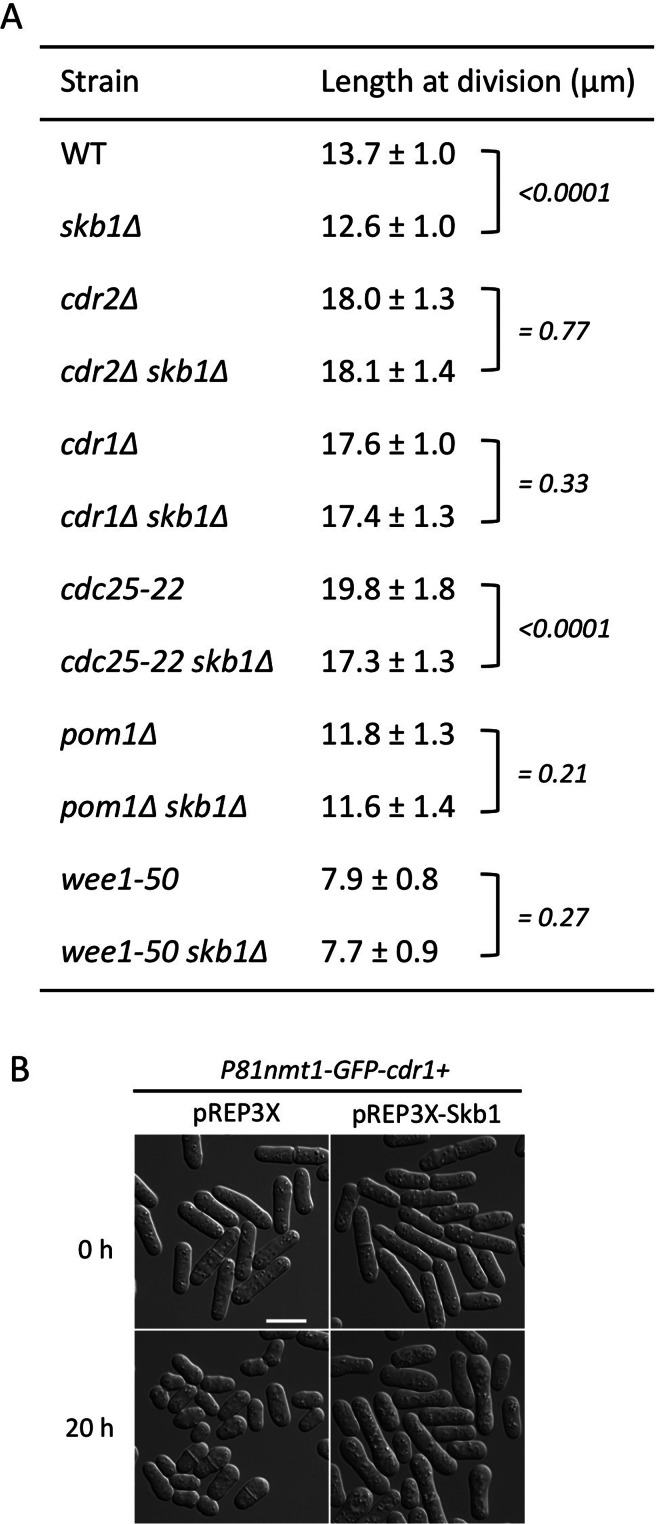
We used genetic epistasis to test the role of Skb1 in regulating mitotic entry. Fission yeast cells reproducibly enter into mitosis and divide at ∼14 μm in length, due in part to regulation of Cdr1 and Cdr2. We found that skb1∆ cells divided at a smaller size than wild-type cells (Figure 3A), consistent with previous work (Gilbreth et al., 1998). To confirm that the smaller division size of skb1∆ mutant cells reflected premature entry into mitosis, we measured the size of cells with separated spindle pole bodies (SPBs; yeast equivalent of centrosome). SPB separation occurred at a smaller size in skb1∆ versus wild-type cells (Supplemental Figure S2), indicating that Skb1 protein is a mitotic inhibitor. The role of Skb1 in cell cycle regulation is likely independent of its methyltransferase activity, as mutations predicted by the animal PRMT5 crystal structure to abolish catalytic activity (Sun et al., 2011) do not affect cell size at division (Supplemental Figure S3).
FIGURE 3:
Skb1 controls cell size at division through negative regulation of Cdr1. (A) Length of dividing, septated cells of the indicated genotypes (mean ± SD; n > 50 for each value). The p values for two-tailed Student's t tests for unpaired data with unequal variance are indicated in brackets. Temperature-sensitive wee1-50 strains were grown at 36°C for 6 h before analysis. (B) The indicated cdr1+ overexpression strain was transformed with control pREP3X plasmid or Skb1 overexpression plasmid. Differential interference contrast images were taken at 0 and 20 h after induction. Scale bar, 10 μm.
The skb1∆ size phenotype partially suppressed a cdc25-22 mutation, but skb1∆ did not reduce the size of cdr1∆, cdr2∆, or wee1-50 mutants (Figure 3A). This places Skb1 as an upstream inhibitor of Cdr2-Cdr1-Wee1 in regulation of cell size at division. We tested this possibility further by overexpressing both Skb1 and Cdr1 in fission yeast cells. Overexpression of Cdr1 causes a “wee” cell phenotype due to inhibition of Wee1 kinase (Russell and Nurse, 1987). We found that overexpression of Skb1 partially suppressed this “wee” phenotype caused by increased Cdr1 levels (Figure 3B), and this suppression was not due to changes in Cdr1 expression (Supplemental Figure S4). By combining our genetic epistasis experiments and physical interactions, we conclude that Skb1 is a novel input to the Cdr2-Cdr1-Wee1 module that acts in part by negatively regulating Cdr1. In cells, this regulation may be facilitated by additional Skb1 interactions with Wee1. This possibility is supported by the observation that the elongated cell phenotype caused by Skb1 overexpression is suppressed by wee1∆ but not by cdr1∆, cdr2∆, pom1∆, or nif1∆ (Supplemental Figure S5).
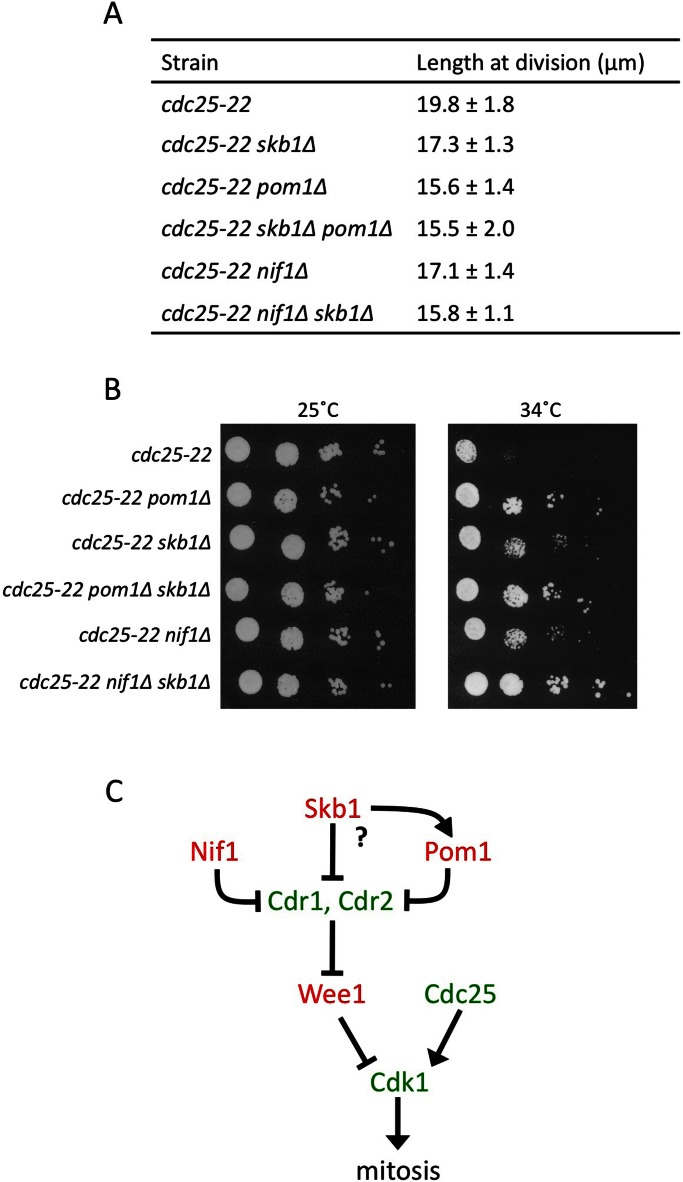
We next examined the relationship between Skb1 and other inputs to Cdr2-Cdr1 signaling. The cell polarity kinase Pom1 forms a spatial gradient that inhibits Cdr2 in a cell size–dependent manner (Martin and Berthelot-Grosjean, 2009; Moseley et al., 2009). pom1∆ cells enter into mitosis and divide at a reduced size, and we found that the pom1∆ and skb1∆ size phenotypes were not additive (Figures 3A and 4A). This indicates that Skb1 may act upstream of Pom1 in regulation of Cdr2-Cdr1 signaling. An alternative possibility is that Skb1 regulates Cdr1 in a manner that depends on upstream control of Cdr2 by Pom1. Additional work is needed to decipher between these possibilities. In contrast, the skb1∆ phenotype was additive with nif1∆ (Figure 4A), which has been proposed to regulate Cdr1 (Wu and Russell, 1997). These genetic relationships were verified by both cell length measurements and suppression of cdc25-22 growth (Figure 4, A and B) and suggest that Skb1 and Nif1 are separate inputs to the mitotic size control system. These separate signals may converge on a common target, as Skb1 and Nif1 physically interact with the same region of Cdr1 (Wu and Russell, 1997). These combined genetic epistasis experiments show that Skb1 acts in a Pom1-dependent pathway to regulate mitotic entry through Cdr2-Cdr1-Wee1 (Figure 4C). The genetic and physical interactions that we uncovered suggest that the pathway might operate through complex combinatorial signals.
FIGURE 4:
Genetic analysis of Skb1 with Pom1 and Nif1. (A) Length of dividing, septated cells of the indicated genotypes (mean ± SD; n > 50 for each value). Measurements were performed in the elongated cdc25-22 strain background to increase sensitivity. (B) Growth assay for indicated strains. Tenfold serial dilutions of cells from the indicated genotypes grown at 25 and 34°C. Note that skb1∆ and nif1∆ exhibit additive suppression of cdc25-22 temperature sensitivity, consistent with cell length measurements. (C) Schematic of genetic pathway for Skb1. Proteins in red are mitotic inhibitors and those in green are mitotic inducers. Question mark denotes unclear role for Pom1 in Skb1 function.
Skb1 forms novel growth-positioned cortical nodes
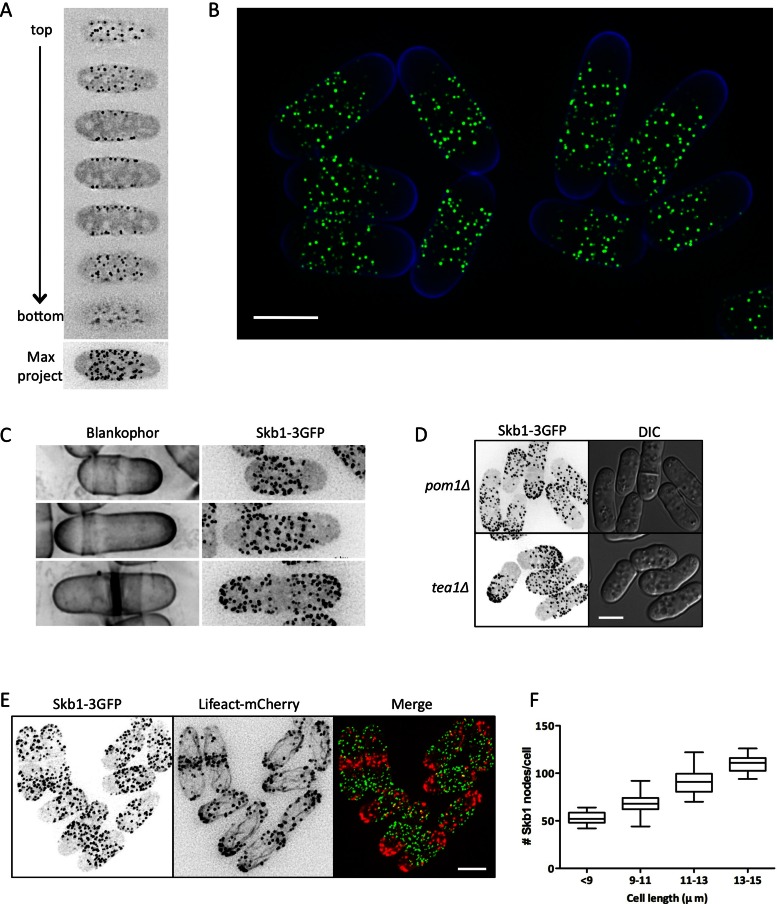
Protein–protein interactions and genetic epistasis often present a picture of ordered pathways with linear connections, but signal transduction occurs in the dynamic cellular environment in which spatial constraints shape the behavior of signaling pathways. Therefore we next examined how the subcellular distribution of Skb1 might affect signaling through the Cdr2-Cdr1-Wee1 pathway. We integrated a C-terminal triple–green fluorescent protein (3GFP) tag at the endogenous skb1+ locus and found that Skb1-3GFP localized to a set of nodes that were restricted to the cell cortex (Figure 5A). An additional pool of Skb1-3GFP was present in the cytoplasm. Our Skb1 localization results differ from those of a previous study (Bao et al., 2001), in which Skb1 overexpressed by a plasmid was found at cell tips and the nucleus. However, we note that integrated Skb1-3GFP is fully functional (Supplemental Figure S3), and our results are supported by a genome-wide localization study (Matsuyama et al., 2006).
FIGURE 5:
Skb1 forms cortical nodes positioned by growth. (A) Localization of Skb1-3GFP in vegetative cells. Single focal planes from deconvolved z-series and maximum projection for a single cell are shown. (B) Localization of Skb1-3GFP. Green indicates Skb1-3GFP, and blue indicates Blankophor staining. Image is maximum intensity from deconvolved z-series. Scale bar, 3 μm. (C) Skb1 nodes are excluded from sites of cell growth. Images of Skb1-3GFP are inverted maximum projections. Blankophor marks sites of cell growth. (D) Skb1 localization in monopolar pom1∆ and tea1∆ mutants. Images are inverted maximum projections from deconvolved z-series. (E) Skb1 cortical nodes do not overlap with cortical actin patches. Lifeact-mCherry labels actin patches and cables. Images are inverted maximum projections from deconvolved z-series. (F) The number of Skb1-3GFP cortical nodes scales with cell length (n = 194 cells), graphed as box-and-whisker plot.
The distribution of Skb1-3GFP suggested a link with cellular growth patterns. We found that Skb1 nodes were excluded from sites of cell growth, which were marked with the cell wall dye Blankophor (Figure 5, B and C). During interphase, Skb1 nodes were excluded from the single growing end of small monopolar cells and then restricted from both ends of larger bipolar cells. On cell division, when growth is redirected to the cell middle, Skb1 nodes were absent from the division septum. Further, Skb1 nodes were restricted only from one end of monopolar mutants such as tea1∆ and pom1∆ (Figure 5D) and did not overlap with cortical actin patches at growing ends (Figure 5E). We conclude that Skb1 nodes cover nongrowing regions of the cell cortex. This pattern could result from a set number of Skb1 nodes that move away from each other during growth or alternatively from the formation of new Skb1 nodes as the cell cortex expands. The number of Skb1 nodes scales with cell size (Figure 5F), indicating that new Skb1 nodes assemble during cell growth.
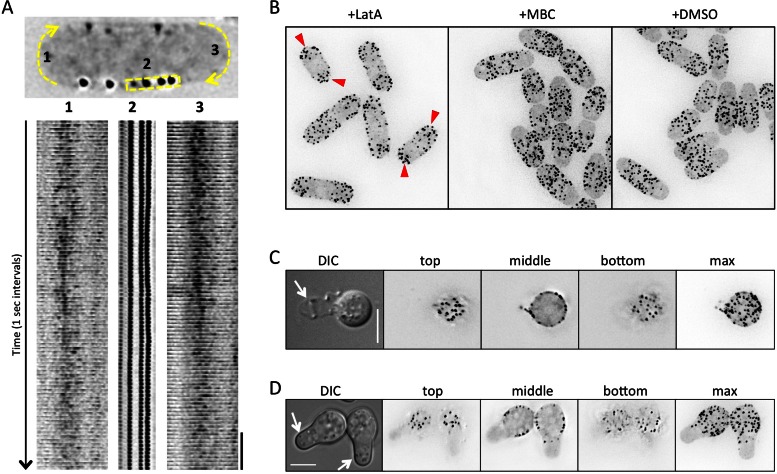
Time-lapse imaging revealed that Skb1 nodes are stable structures that do not move or rapidly disassemble (Supplemental Movie S1). At growing cell tips, we observed weak and transient localization of Skb1-3GFP puncta (Figure 6A and Supplemental Movie S2). This suggests a mechanism that actively prevents the formation of Skb1 nodes at growth zones. This possibility was supported by node dynamics during cell division. When growth was redirected to the cell middle for septation, we observed both formation of new nodes at cell ends and movement of existing nodes away from the cell middle (Supplemental Movie S3). Many aspects of polarized cell growth require the cytoskeleton, and so we tested the role of cytoskeletal structures in this growth zone exclusion of Skb1 nodes. Disruption of microtubules by the drug MBC (carbendazim) did not affect Skb1 node distribution, but treatment of cells with latrunculin A to disrupt F-actin structures led to a dramatic reorganization of Skb1 nodes (Figure 6B). In the absence of F-actin, Skb1 nodes became concentrated at cell ends, where they are normally excluded. These cell-end Skb1 nodes appeared to form de novo in time-lapse movies, similar to node dynamics during cell division (Supplemental Movies S4 and S5). We conclude that an actin-dependent mechanism actively inhibits the assembly of Skb1 nodes at cellular growth zones. This restricts the formation of stable Skb1 nodes to the nongrowing cell cortex.
FIGURE 6:
Skb1 cortical nodes are stable structures. (A) Time-lapse imaging of Skb1-3GFP localization at cell tips and cell sides. The yellow areas are shown below the cell as a kymograph; cell tip regions were contrast enhanced due to low Skb1-3GFP signal intensity. Scale bar, 10 s. (B) Exclusion of Skb1 nodes from cell ends depends on an intact actin cytoskeleton. Red arrowheads mark Skb1 cortical nodes at cell ends after latrunculin A treatment (+LatA) to disrupt F-actin structures. MBC (carbendazim) was used to disrupt microtubules; dimethyl sulfoxide was used as control treatment. (C) Skb1 nodes remain cortical in the absence of the cell wall. Arrow denotes cell wall ghost next to osmotically stabilized spheroplast. (D) In regenerating spheroplasts, Skb1 nodes are excluded from de novo growth zones. Arrows mark growth zones.
Given their stability, we considered that Skb1 nodes might associate with or require the yeast cell wall. We tested this possibility by digesting the cell wall with enzymes to generate spheroplasts. During this process, the spheroplast emerges from one cell end and leaves behind a cell wall ghost. Skb1 nodes remained intact in the spheroplast cell cortex and not the cell wall ghost (Figure 6C), indicating that nodes do not require a cell wall. On removal of cell wall digestion enzymes, spheroplasts generate a new growth zone (Kelly and Nurse, 2011). We found that Skb1 nodes were specifically excluded from these new growth zones (Figure 6D), supporting the conclusion that cellular growth patterns actively position Skb1 nodes.
Skb1 nodes and Cdr1/2 nodes are functionally distinct structures
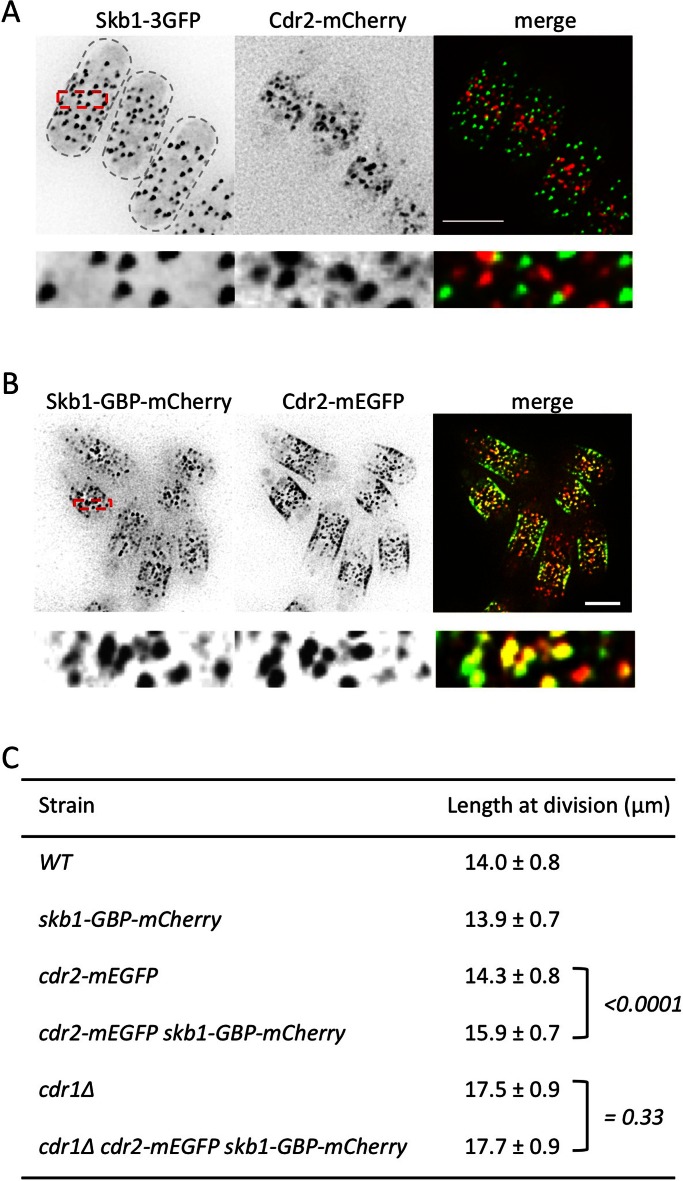
What is the relationship between Skb1 nodes and the previously described nodes containing both Cdr1 and Cdr2? We used Cdr2 as a marker for Cdr1/2 nodes due to functional defects associated with integrated Cdr1 tags (Martin and Berthelot-Grosjean, 2009; Moseley et al., 2009). In cells expressing both Skb1-3GFP and Cdr2-mCherry, we observed no detectable colocalization between these two proteins (Figure 7A). This indicates that Skb1 nodes and Cdr1/2 nodes represent distinct stable structures at the cell cortex. In addition, Cdr1/2 nodes were not affected by skb1∆, and Skb1 nodes localized properly in cdr2∆ cells (Supplemental Figure S6, A and B), which lack Cdr1/2 nodes (Martin and Berthelot-Grosjean, 2009; Moseley et al., 2009). We conclude that Skb1 nodes are distinct from Cdr1/2 nodes, meaning that Skb1 nodes are a novel cortical structure. This raises the possibility that the formation of these different cortical nodes controls the Skb1-Cdr1 signaling pathway.
FIGURE 7:
Compartmentalization of Skb1-Cdr1 nodes controls mitotic entry signaling. (A) Skb1 nodes and Cdr1/2 nodes do not colocalize. Images are maximum projections of z-planes in the top half of the cell. Region boxed in red is magnified in bottom row. Scale bar, 5 μm. (B) Forced recruitment of Skb1 to Cdr1/2 nodes by GBP. Images are maximum projections of z-planes in the top half of the cell. Region boxed in red is magnified in bottom row. Scale bar, 5 μm. (C) Length of dividing, septated cells of the indicated genotypes (mean ± SD; n > 50 for each value). The p values for two-tailed Student's t tests for unpaired data with unequal variance are indicated in brackets.
We considered that separate sets of nodes might function to sequester an inhibitor (Skb1) from its target (Cdr1). To test this, we targeted Skb1 to Cdr1/2 nodes using GFP-binding protein (GBP), a single-chain antibody peptide that binds to GFP with nanomolar affinity (Rothbauer et al., 2006). We integrated an in-frame GBP-mCherry tag at the 3′ end of the endogenous skb1+ locus, which allows simultaneous targeting by GBP and imaging by mCherry. We first confirmed that Skb1-GBP-mCherry localizes similarly to Skb1-3GFP (Supplemental Figure S6C). Next we combined Skb1-GBP-mCherry with Cdr2–monomeric enhanced GFP (mEGFP). In the resulting strain, Skb1-GBP-mCherry and Cdr2-mEGFP showed clear colocalization, such that most Cdr1/2 nodes contained Skb1 (Figure 7B). This targeting is predicted to delay mitotic entry because Skb1 is now concentrated with its inhibitory target Cdr1. Indeed, the forced interaction of Skb1 with Cdr1/2 nodes led to an increased cell length at division (Figure 7C). In contrast, the forced colocalization of Skb1 and Cdr2 had no effect in cdr1∆ cells (Figure 7C). We conclude that targeting Skb1 to Cdr1/2 nodes delays mitotic entry through Cdr1. Taken together, these results indicate that Skb1 nodes and Cdr1/2 nodes are functionally distinct structures that impart spatial control to the Skb1-Cdr1 signaling pathway.
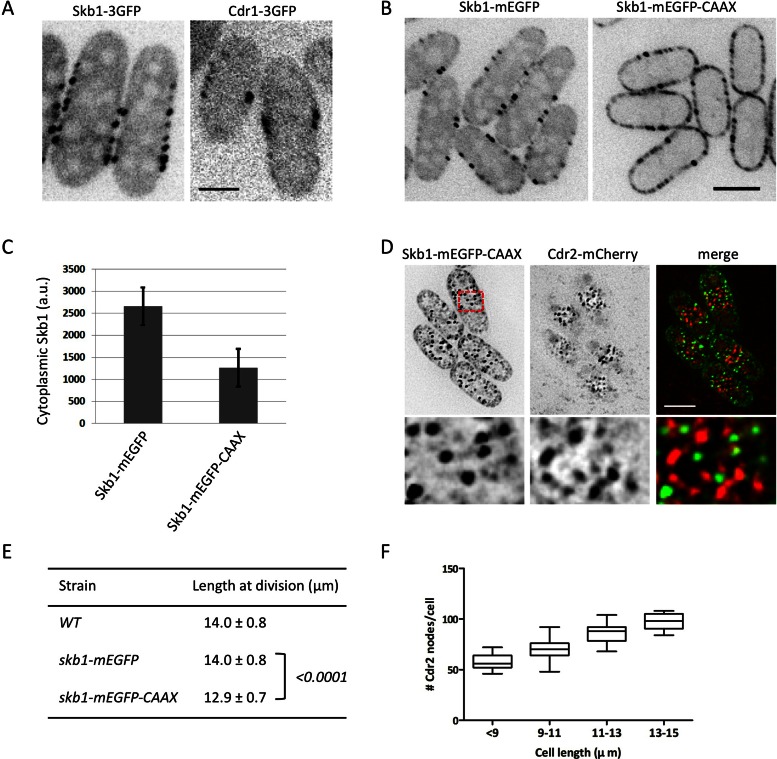
If Skb1 nodes and Cdr1/2 nodes are distinct structures, where do Skb1-Cdr1 interactions occur in the cell? Both Cdr1 and Skb1 are present in the cytoplasm in addition to their respective cortical nodes (Figure 8A), raising the possibility that Skb1 inhibits cytoplasmic Cdr1 to restrict Cdr1-Cdr2-Wee1 signals to the cell cortex. To test this, we removed Skb1 from the cytoplasm by fusing a short CAAX motif to the C-terminus of Skb1-mEGFP (Figure 8B). The CAAX motif is lipid modified, leading to constitutive membrane targeting. The CAAX motif increased total cellular levels of Skb1 but dramatically reduced Skb1 levels in the cytoplasm (Figure 8C and Supplemental Figure S6D). Of importance, cortical Skb1-mEGFP-CAAX still localized to stable nodes that were compartmentalized from Cdr1/2 nodes (Figure 8D). Depleting Skb1 from the cytoplasm in this manner led to a reduced cell size at division, similar to skb1∆ (Figure 8E). This phenotype was not caused by mislocalization of Pom1 (Supplemental Figure S6E). This result suggests that Skb1 restricts Cdr1 activity to the cell cortex, where Cdr1 and Skb1 are compartmentalized in distinct node structures. We found that the number of Cdr1/2 nodes increases with cell size (Figure 8F), similar to Skb1 nodes. This increase in protected microdomains for Cdr1 has the potential to increase mitotic entry signals as cells grow.
FIGURE 8:
Depletion of cytoplasmic Skb1 accelerates mitotic entry. (A) Single confocal section of Skb1-3GFP and Cdr1-3GFP cells. Both Skb1 and Cdr1 are present in the cytoplasm and cortical nodes. Scale bar, 2 μm. (B) Localization of Skb1-mEGFP and Skb1-mEGFP-CAAX. Images are single confocal section; scale bar, 5 μm. (C) Quantification of Skb1 cytoplasmic concentration in the indicated strains. Levels are presented as arbitrary fluorescence units (a.u.) and represent mean ± SD for 100 cells. (D) Skb1-mEGFP-CAAX does not colocalize with Cdr2. Images are inverted maximum projections for z-planes in the top half of the cells. Region boxed in red is magnified in bottom row. Scale bar, 5 μm. (E) Length of dividing, septated cells of the indicated genotypes (mean ± SD; n > 50 for each value). The p values for two-tailed Student's t tests for unpaired data with unequal variance are indicated in brackets. (F) Number of Cdr2 cortical nodes scales with cell length (n = 134 cells), graphed as box-and-whisker plot.
DISCUSSION
We identified a number of novel physical interactions between the cell polarity and cell cycle systems and used this information as a basis to study the spatial regulation of Skb1-Cdr1 signaling. We showed that Skb1 physically interacts with Cdr1 and inhibits mitotic entry through Cdr1. Cdr1 and Skb1 are spatially segregated at the cell cortex by the formation of distinct node structures. The formation of distinct node populations provides a striking example of signaling compartmentalization by microdomains in the plasma membrane. These node compartments contrast the connection between Hsl7 (Skb1-like) and Hsl1 (Cdr1-like) in budding yeast, where these proteins colocalize at the bud neck and function together to promote mitotic entry (Ma et al., 1996; McMillan et al., 1999, 2002; Shulewitz et al., 1999; Cid et al., 2001; Theesfeld et al., 2003). The opposite phenotypes of hsl7 and skb1 mutants may be related to the dramatic spatial differences in the signaling pathways, such that major changes in both the wiring and positioning of this pathway have occurred during evolution. The formation of these stable signaling nodes at the fission yeast cortex opens a vast number of questions: How do these nodes assemble? What are their structures? What are the various components and their stoichiometries? Answering these questions will uncover organizational principles that might operate in a wide range of cell types and signaling pathways.
We propose a model in which the formation of distinct cortical nodes ensures timely entry into mitosis through the Skb1-Cdr1 pathway. In the model, Cdr1/2 nodes act as positive clusters to promote entry into mitosis through Wee1 and Cdk1. In these nodes, Cdr1 is protected from Skb1 due to compartmentalization of the cell cortex. Thus, in addition to concentrating signaling proteins, the formation of Cdr1/2 nodes might function to protect Cdr1 from inhibition by Skb1 and/or other factors. We showed that the number of Cdr1/2 nodes scales with cell size. This size-dependent increase likely promotes mitotic entry by increasing local Cdr1 signaling at sites protected from Skb1. Inhibition of Cdr1/2 signaling by Pom1 also decreases in larger cells (Martin and Berthelot-Grosjean, 2009; Moseley et al., 2009). This suggests the presence of two spatial mechanisms to increase mitotic entry signaling by Cdr1/2 as cells grow.
Our data suggest that Skb1 negatively regulates Cdr1 in the cytoplasm, restricting Cdr1 activity and regulation to these cortical nodes. This would effectively buffer the cytoplasm against excess Cdr1 activity. At cortical nodes, Cdr1/2 signaling is subject to additional layers of regulation, for example, by the cell polarity kinase Pom1. We note that the growing list of “input” signals to Cdr1 and Cdr2—including Skb1, Pom1, Nif1, and Fin1—act through largely undefined molecular mechanisms (Wu and Russell, 1997; Martin and Berthelot-Grosjean, 2009; Moseley et al., 2009; Grallert et al., 2012). Our genetic data suggest that Skb1 inhibits Cdr1, but additional interactions between Skb1 and Wee1 likely contribute to pathway regulation. Moreover, the skb1∆ and pom1∆ cell size phenotypes are nonadditive, raising the possibility that Skb1 acts upstream of Pom1. However, we did not detect changes in Pom1 localization upon deletion or overexpression of Skb1, leaving the potential mechanism unknown. It seems likely that this growing pathway might not function as a simple linear system, but instead combined signals and/or feedback control could enhance the precision and robustness of this cellular size control system. A key future challenge will be to define the biochemical interactions and mechanisms of these multiple inputs to Cdr1 and Cdr2, both as individual and combinatorial molecular signals.
Control of signaling by compartmentalized nodes is ideally suited for yeast cells but might represent a general organizational principle that operates in many cell types. Diffusion in the yeast plasma membrane is much slower than in other cell types (Greenberg and Axelrod, 1993; Valdez-Taubas and Pelham, 2003), providing a more static environment for nodes and other signaling platforms. The nongrowing region of the fission yeast cell cortex contains at least three independent and static structures—Cdr1/2 nodes, Skb1 nodes, and Pil1 eisosomes (Kabeche et al., 2011)—suggesting a nondynamic and ordered environment. In animal cells with faster membrane diffusion rates, the cytoskeleton anchors an array of signaling nanoclusters that are believed to concentrate signaling proteins, promoting pathway robustness (Cebecauer et al., 2010; Hartman and Groves, 2011). Our findings suggest that nodes and clusters might also spatially segregate signaling components to link pathway activity with changes at the cell cortex. These higher-order structures assemble by multivalent interactions of proteins and lipids, with the potential to generate emergent properties beyond the sum of their parts. The role of such nodes in a wide range of biological processes indicates a common organizational principle to control diverse signaling pathways.
MATERIALS AND METHODS
Yeast two-hybrid assay
The Matchmaker yeast two-hybrid system (Clontech, Mountain View, CA) was used to test protein–protein interactions. Bait and prey plasmids were generated using standard cloning techniques; details are available upon request. Plasmids are listed with sequencing details in Supplemental Table S2. For all interaction tests, bait and prey plasmids were cotransformed into yeast strain Y2H-Gold and selected on double dropout (DDO) plates (SD-Leu-Trp). Interactions were initially tested on a QDO/A plate (SD-Leu-Trp-Ade-His with 125 ng/ml aureobasidin A). Bait plasmids that autoactivated growth on QDO/A plates (Supplemental Figure S1A) were removed from further tests. Interactions were confirmed and classified by retransforming bait and prey plasmids, followed by selection on DDO and subsequent scoring of interactions on both QDO/A and TDO/3AT plates (SD-Leu-Trp-His with 30 mM 3-amino-1,2,4-triazole).
Yeast strains and growth
Standard Schizosaccharomyces pombe media and methods were used (Moreno et al., 1991), and strains are listed in Supplemental Table S3. For cell length measurements, >50 septated cells grown in EMM4S at 25°C were measured by Blankophor staining in log phase. Spheroplasts were generated by treatment of zymolyase and novozyme enzymes as described (Kabeche et al., 2011), and growth was recovered by washing into medium lacking digestive enzymes. For latrunculin A and MBC treatment, cells were treated with 100 μM latrunculin A, 50 μg/ml MBC (carbendazim), or dimethyl sulfoxide control for 1 h before imaging. Gene tagging and deletion were performed using PCR and homologous recombination (Bahler et al., 1998), and integrations were verified by colony PCR. For Skb1-mEGFP-CAAX, we generated a pFA6a-mEGFP-CAAX-natR plasmid by insertion of amino acids LYKGKKKKKKSKTKCVIM to the C-terminus of mEGFP in the plasmid pFA6a-mEGFP-natR. Tetrad dissections were performed to create double mutants. Skb1 methyltransferase dead mutant allele was generated by QuikChange II mutagenesis (Stratagene, Santa Clara, CA) and integrated into the genome with the marker switch approach using KanMX6 as a marker and JM909 as host strain.
Coimmunoprecipitation and immunoblotting
Experiments in Figure 2, C and D, were performed using strain JM496 (P41nmt1-GFP-cdr1), JM548 (P41nmt1-GFP-wee1), or JM837 (no GFP tag). Strains carried pREP3x-6His-Skb1 or empty pREP3x plasmids. Cells were grown at least eight generations at 32°C in minimal medium with 10 μg/ml thiamine and then washed into medium lacking thiamine. After 20 h of induction, 25 OD595 cells were washed twice with 1 ml of lysis buffer (20 mM 4-(2-hydroxyethyl)-1-piperazineethanesulfonic acid pH 7.4, 1 mM EDTA, 150 mM NaCl, 0.2% Triton X-100, 1 mM phenylmethylsulfonyl fluoride, complete EDTA-free protease inhibitor tablets [Roche, Indianapolis, IN]) and then resuspended in 200 μl of lysis buffer together with 400 μl of glass beads and lysed using a Mini-beadbeater-16 (BioSpec, Bartlesville, OK; two cycles of 30 s at maximum speed). Lysates were then spun at 16,000 × g for 20 min at 4°C, and supernatants were recovered. We incubated 2 mg of total protein in 700 μl of IP buffer (lysis buffer supplemented with 10 mM imidazole) with 10 μl of nickel-nitriloacetic acid agarose (Qiagen, Valencia, CA) on a rotating runner at 4°C for 2 h. Beads were then washed five times with IP buffer, resuspended in 2× SDS–PAGE sample buffer, and boiled. Western blots were probed with anti-hexahistidine (SC-8036; Santa Cruz Biotechnology, Santa Cruz, CA), anti-GFP (Moseley et al., 2009), and anti-Wee1 antibodies. Anti-Wee1 antibody was generated in rabbits against recombinant Wee1 (836-877) purified from bacteria. Immune serum was affinity purified using standard techniques (Harlow and Lane, 1988). In Supplemental Figure S6D, mouse monoclonal anti-TAT1 antibody was used to blot α-tubulin as loading control.
Microscopy and image analysis
Cells were imaged on agar pads or in liquid medium using a DeltaVision Imaging System (Applied Precision, Issaquah, WA), comprising a customized Olympus IX-71 inverted wide-field microscope (Olympus, Tokyo, Japan), a CoolSNAP HQ2 camera (Photometrics, Tucson, AZ), and an Insight solid-state illumination unit (Applied Precision). Stacks of z-series were acquired at 0.5-μm intervals and processed by iterative deconvolution in SoftWoRx software (Applied Precision). Images were rendered by two-dimensional maximum intensity projection by ImageJ 1.45 (National Institutes of Health, Bethesda, MD). In Figure 8, A and B, cells were imaged by spinning-disk confocal microscopy on an Eclipse Ti (Nikon, Melville, NY) equipped with a Yokogawa spinning disk, a Nikon 100×/1.4 numerical aperture Plan Apo VC objective, and an ImagEM C9100-13 electron-multiplying charge-coupled device camera (Hamamatsu, Hamamatsu, Japan). This system was controlled by MetaMorph 7 (Molecular Devices, Sunnyvale, CA) and assembled by Quorum Technologies (Guelph, Canada). In Figure 6A, a 5-pixel-wide line around curved cell ends was straightened using Straighten plug-in for ImageJ 1.45. In Supplemental Movies S3–S5, photobleaching was corrected by Histogram Matching algorithm in Bleach Correction (EMBO) in ImageJ 1.45. For Figure 8C, wild-type (no GFP), Skb1-mEGFP, and Skb1-mEGFP-CAAX cells were imaged under identical parameters. GFP intensity in the cytoplasm (12 pixel × 12 pixel box) was measured, and the background signal from wild-type cells was subtracted.
Supplementary Material
Acknowledgments
We thank S. Baldissard for technical help; C. Barlowe, W. Wickner, D. Madden, and E. Schaller for reagents and shared equipment; M. Sato for the pMS-GBP-mCherry vector; and S. Marcus and M. Balasubramanian for strains. We thank A. Gladfelter, R. Carazo-Salas, and B. Goode for discussions and comments on the manuscript. J.B.M. is a Pew Scholar in the Biomedical Sciences. This work was funded by National Institutes of Health Grant GM099774 (J.B.M.).
Abbreviations used:
- GBP
GFP-binding protein
- GFP
green fluorescent protein
Footnotes
This article was published online ahead of print in MBoC in Press (http://www.molbiolcell.org/cgi/doi/10.1091/mbc.E13-02-0104) on April 24, 2013.
REFERENCES
- Bahler J, Wu JQ, Longtine MS, Shah NG, McKenzie A 3rd, Steever AB, Wach A, Philippsen P, Pringle JR. Heterologous modules for efficient and versatile PCR-based gene targeting in Schizosaccharomyces pombe. Yeast. 1998;14:943–951. doi: 10.1002/(SICI)1097-0061(199807)14:10<943::AID-YEA292>3.0.CO;2-Y. [DOI] [PubMed] [Google Scholar]
- Bao S, Qyang Y, Yang P, Kim H, Du H, Bartholomeusz G, Henkel J, Pimental R, Verde F, Marcus S. The highly conserved protein methyltransferase, Skb1, is a mediator of hyperosmotic stress response in the fission yeast Schizosaccharomyces pombe. J Biol Chem. 2001;276:14549–14552. doi: 10.1074/jbc.C100096200. [DOI] [PubMed] [Google Scholar]
- Barral Y, Parra M, Bidlingmaier S, Snyder M. Nim1-related kinases coordinate cell cycle progression with the organization of the peripheral cytoskeleton in yeast. Genes Dev. 1999;13:176–187. doi: 10.1101/gad.13.2.176. [DOI] [PMC free article] [PubMed] [Google Scholar]
- Cebecauer M, Spitaler M, Serge A, Magee AI. Signalling complexes and clusters: functional advantages and methodological hurdles. J Cell Sci. 2010;123:309–320. doi: 10.1242/jcs.061739. [DOI] [PubMed] [Google Scholar]
- Cid VJ, Shulewitz MJ, McDonald KL, Thorner J. Dynamic localization of the Swe1 regulator Hsl7 during the Saccharomyces cerevisiae cell cycle. Mol Biol Cell. 2001;12:1645–1669. doi: 10.1091/mbc.12.6.1645. [DOI] [PMC free article] [PubMed] [Google Scholar]
- Coleman TR, Tang Z, Dunphy WG. Negative regulation of the wee1 protein kinase by direct action of the nim1/cdr1 mitotic inducer. Cell. 1993;72:919–929. doi: 10.1016/0092-8674(93)90580-j. [DOI] [PubMed] [Google Scholar]
- Gilbreth M, Yang P, Bartholomeusz G, Pimental RA, Kansra S, Gadiraju R, Marcus S. Negative regulation of mitosis in fission yeast by the shk1 interacting protein skb1 and its human homolog, Skb1Hs. Proc Natl Acad Sci USA. 1998;95:14781–14786. doi: 10.1073/pnas.95.25.14781. [DOI] [PMC free article] [PubMed] [Google Scholar]
- Gilbreth M, Yang P, Wang D, Frost J, Polverino A, Cobb MH, Marcus S. The highly conserved skb1 gene encodes a protein that interacts with Shk1, a fission yeast Ste20/PAK homolog. Proc Natl Acad Sci USA. 1996;93:13802–13807. doi: 10.1073/pnas.93.24.13802. [DOI] [PMC free article] [PubMed] [Google Scholar]
- Grallert A, Connolly Y, Smith DL, Simanis V, Hagan IM. The S. pombe cytokinesis NDR kinase Sid2 activates Fin1 NIMA kinase to control mitotic commitment through Pom1/Wee1. Nat Cell Biol. 2012;14:738–745. doi: 10.1038/ncb2514. [DOI] [PMC free article] [PubMed] [Google Scholar]
- Greenberg ML, Axelrod D. Anomalously slow mobility of fluorescent lipid probes in the plasma membrane of the yeast Saccharomyces cerevisiae. J Membr Biol. 1993;131:115–127. doi: 10.1007/BF02791320. [DOI] [PubMed] [Google Scholar]
- Hachet O, Berthelot-Grosjean M, Kokkoris K, Vincenzetti V, Moosbrugger J, Martin SG. A phosphorylation cycle shapes gradients of the DYRK family kinase Pom1 at the plasma membrane. Cell. 2011;145:1116–1128. doi: 10.1016/j.cell.2011.05.014. [DOI] [PubMed] [Google Scholar]
- Harlow E, Lane D. Antibodies: A Laboratory Manual. Cold Spring Harbor, NY: Cold Spring Harbor Laboratory; 1988. [Google Scholar]
- Hartman NC, Groves JT. Signaling clusters in the cell membrane. Curr Opin Cell Biol. 2011;23:370–376. doi: 10.1016/j.ceb.2011.05.003. [DOI] [PMC free article] [PubMed] [Google Scholar]
- Kabeche R, Baldissard S, Hammond J, Howard L, Moseley JB. The filament-forming protein Pil1 assembles linear eisosomes in fission yeast. Mol Biol Cell. 2011;22:4059–4067. doi: 10.1091/mbc.E11-07-0605. [DOI] [PMC free article] [PubMed] [Google Scholar]
- Kanai M, Kume K, Miyahara K, Sakai K, Nakamura K, Leonhard K, Wiley DJ, Verde F, Toda T, Hirata D. Fission yeast MO25 protein is localized at SPB and septum and is essential for cell morphogenesis. EMBO J. 2005;24:3012–3025. doi: 10.1038/sj.emboj.7600782. [DOI] [PMC free article] [PubMed] [Google Scholar]
- Kelly FD, Nurse P. De novo growth zone formation from fission yeast spheroplasts. PLoS One. 2011;6:e27977. doi: 10.1371/journal.pone.0027977. [DOI] [PMC free article] [PubMed] [Google Scholar]
- Lu R, Niida H, Nakanishi M. Human SAD1 kinase is involved in UV-induced DNA damage checkpoint function. J Biol Chem. 2004;279:31164–31170. doi: 10.1074/jbc.M404728200. [DOI] [PubMed] [Google Scholar]
- Ma XJ, Lu Q, Grunstein M. A search for proteins that interact genetically with histone H3 and H4 amino termini uncovers novel regulators of the Swe1 kinase in Saccharomyces cerevisiae. Genes Dev. 1996;10:1327–1340. doi: 10.1101/gad.10.11.1327. [DOI] [PubMed] [Google Scholar]
- Martin SG, Berthelot-Grosjean M. Polar gradients of the DYRK-family kinase Pom1 couple cell length with the cell cycle. Nature. 2009;459:852–856. doi: 10.1038/nature08054. [DOI] [PubMed] [Google Scholar]
- Matsuyama A, et al. ORFeome cloning and global analysis of protein localization in the fission yeast Schizosaccharomyces pombe. Nat Biotechnol. 2006;24:841–847. doi: 10.1038/nbt1222. [DOI] [PubMed] [Google Scholar]
- McMillan JN, Longtine MS, Sia RA, Theesfeld CL, Bardes ES, Pringle JR, Lew DJ. The morphogenesis checkpoint in Saccharomyces cerevisiae: cell cycle control of Swe1p degradation by Hsl1p and Hsl7p. Mol Cell Biol. 1999;19:6929–6939. doi: 10.1128/mcb.19.10.6929. [DOI] [PMC free article] [PubMed] [Google Scholar]
- McMillan JN, Theesfeld CL, Harrison JC, Bardes ES, Lew DJ. Determinants of Swe1p degradation in Saccharomyces cerevisiae. Mol Biol Cell. 2002;13:3560–3575. doi: 10.1091/mbc.E02-05-0283. [DOI] [PMC free article] [PubMed] [Google Scholar]
- Moreno S, Klar A, Nurse P. Molecular genetic analysis of fission yeast Schizosaccharomyces pombe. Methods Enzymol. 1991;194:795–823. doi: 10.1016/0076-6879(91)94059-l. [DOI] [PubMed] [Google Scholar]
- Moseley JB, Mayeux A, Paoletti A, Nurse P. A spatial gradient coordinates cell size and mitotic entry in fission yeast. Nature. 2009;459:857–860. doi: 10.1038/nature08074. [DOI] [PubMed] [Google Scholar]
- Parker LL, Walter SA, Young PG, Piwnica-Worms H. Phosphorylation and inactivation of the mitotic inhibitor Wee1 by the nim1/cdr1 kinase. Nature. 1993;363:736–738. doi: 10.1038/363736a0. [DOI] [PubMed] [Google Scholar]
- Rothbauer U, et al. Targeting and tracing antigens in live cells with fluorescent nanobodies. Nat Methods. 2006;3:887–889. doi: 10.1038/nmeth953. [DOI] [PubMed] [Google Scholar]
- Russell P, Nurse P. The mitotic inducer nim1+ functions in a regulatory network of protein kinase homologs controlling the initiation of mitosis. Cell. 1987;49:569–576. doi: 10.1016/0092-8674(87)90459-4. [DOI] [PubMed] [Google Scholar]
- Shulewitz MJ, Inouye CJ, Thorner J. Hsl7 localizes to a septin ring and serves as an adapter in a regulatory pathway that relieves tyrosine phosphorylation of Cdc28 protein kinase in Saccharomyces cerevisiae. Mol Cell Biol. 1999;19:7123–7137. doi: 10.1128/mcb.19.10.7123. [DOI] [PMC free article] [PubMed] [Google Scholar]
- Sun L, Wang M, Lv Z, Yang N, Liu Y, Bao S, Gong W, Xu RM. Structural insights into protein arginine symmetric dimethylation by PRMT5. Proc Natl Acad Sci USA. 2011;108:20538–20543. doi: 10.1073/pnas.1106946108. [DOI] [PMC free article] [PubMed] [Google Scholar]
- Theesfeld CL, Zyla TR, Bardes EG, Lew DJ. A monitor for bud emergence in the yeast morphogenesis checkpoint. Mol Biol Cell. 2003;14:3280–3291. doi: 10.1091/mbc.E03-03-0154. [DOI] [PMC free article] [PubMed] [Google Scholar]
- Valdez-Taubas J, Pelham HR. Slow diffusion of proteins in the yeast plasma membrane allows polarity to be maintained by endocytic cycling. Curr Biol. 2003;13:1636–1640. doi: 10.1016/j.cub.2003.09.001. [DOI] [PubMed] [Google Scholar]
- Verde F, Wiley DJ, Nurse P. Fission yeast orb6, a ser/thr protein kinase related to mammalian rho kinase and myotonic dystrophy kinase, is required for maintenance of cell polarity and coordinates cell morphogenesis with the cell cycle. Proc Natl Acad Sci USA. 1998;95:7526–7531. doi: 10.1073/pnas.95.13.7526. [DOI] [PMC free article] [PubMed] [Google Scholar]
- Wiley DJ, Marcus S, D'Urso G, Verde F. Control of cell polarity in fission yeast by association of Orb6p kinase with the highly conserved protein methyltransferase Skb1p. J Biol Chem. 2003;278:25256–25263. doi: 10.1074/jbc.M209703200. [DOI] [PubMed] [Google Scholar]
- Wu L, Russell P. Nim1 kinase promotes mitosis by inactivating Wee1 tyrosine kinase. Nature. 1993;363:738–741. doi: 10.1038/363738a0. [DOI] [PubMed] [Google Scholar]
- Wu L, Russell P. Nif1, a novel mitotic inhibitor in Schizosaccharomyces pombe. EMBO J. 1997;16:1342–1350. doi: 10.1093/emboj/16.6.1342. [DOI] [PMC free article] [PubMed] [Google Scholar]
- Yamada A, Duffy B, Perry JA, Kornbluth S. DNA replication checkpoint control of Wee1 stability by vertebrate Hsl7. J Cell Biol. 2004;167:841–849. doi: 10.1083/jcb.200406048. [DOI] [PMC free article] [PubMed] [Google Scholar]
Associated Data
This section collects any data citations, data availability statements, or supplementary materials included in this article.


