Abstract
Under starvation conditions, a population of myxobacteria aggregates to build a fruiting body whose shape is species-specific and within which the cells sporulate. Early in this process, cells often pass through a “ripple phase” characterized by traveling linear, concentric, and spiral waves. These waves are different from the waves observed during slime mold aggregation that depend on diffusible morphogens, because myxobacteria communicate by direct contact. The difference is most dramatic when waves collide: rather than annihilating one another, myxobacterial waves appear to pass through one another unchanged. Under certain conditions, the spacing and location of the nascent fruiting bodies is determined by the wavelength and pattern of the waves. Later in fruiting body development, waves are replaced by streams of cells that circulate around small initial aggregates enlarging and rounding them. Still later, pairs of motile aggregates coalesce to form larger aggregates that develop into fruiting bodies. Here we present a mathematical model that quantitatively explains these wave and aggregation phenomena.
The morphogenesis of myxobacteria colonies as they form their sporulating fruiting bodies is elaborate and beautiful. Their pattern formation is unlike that of the slime molds whose development is organized by diffusible chemoattractants (1, 2), for the myxobacteria coordinate their movements by direct cell contact (3). In this regard they provide an analog system to study morphogenesis in higher organisms, a process that in many cases is known to be coordinated by direct cell contact (4). Here we present a mathematical model that reproduces all of the major features of these patterns. The model is based on experimental observations summarized below.
Cell Motility
Individual myxobacteria move by using two types of molecular motors that are concentrated at the cell poles. The two motors are constructed by separate genetic systems. The adventurous (A)-motility motor generates propulsive force by extruding slime from nozzle-like organelles at the posterior pole. The pressure generated as the slime hydrates pushes the cell forwards (5). The social (S)-motility system operates when the cells are in proximity of other cells. Type 4 pili extend from the forward pole, attach to fibrils secreted by nearby cells, and retract, pulling the cell forward (6). Cells change direction not by making a U turn but by exchanging their head and tail motors, so that slime pushing is replaced by pili pulling and vice versa. Because both engines are polar devices, reversal represents a concerted repolarization of both propulsion systems (3). As fruiting bodies develop, the speed of cell movement and the frequency of reversals change (7, 8).
Cell Signaling
Fruiting body development requires coordinated cell movements. The C-signaling system orchestrates morphogenesis of the fruiting body by modifying the movement behavior of cells. The C-signal is a 17-kDa cell-surface protein that is not diffusible but is transmitted directly by end-to-end contact between pairs of cells (9, 10). Once inserted onto the cell surface, the signal molecule is processed to 17 kDa from the 25-kDa protein product of the csgA gene by a cell-surface protease (11, 12).
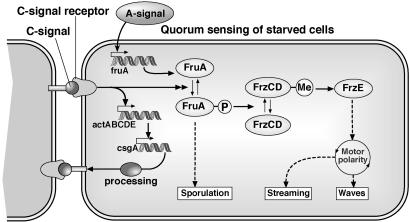
In response to a C-signal protein binding to its receptor, the proteins of the act operon increase transcription of the csgA gene. This positive feedback increases the number of C-signal molecules on the cell surface after each signaling event (13, 14). Beginning at 3 h after starvation conditions are initiated the C-signal begins to increase from an average of a few molecules per cell up to several hundred molecules at the time of sporulation (13). The major features of the signal-response circuit are shown in Fig. 1.
Fig. 1.
The C-signal transduction circuit. Two cells are shown signaling each other, and both have the same transduction circuit; for clarity it is shown only in the cell on the right. Evidence for the circuit is detailed in refs. 8, 21, and 36. Responding to the C-signal, FruA∼P sets three processes in motion sequentially: waves, streams, and sporulation. Starting with a few C-signal molecules on the signal donor, the responding cell phosphorylates a few molecules of FruA that signal the Frz chemosensory system via a chain of covalent modifications. The cell's response to a low C-signal input is to reverse its gliding direction. This reversal response to the C-signal gives rise to the traveling wave patterns in the “ripple phase” (9, 17–19).
The “frizzy” (Frz) system of genes is homologous to chemosensory genes in enteric bacteria (15), and mutations in those genes affect the cell's reversal frequency (16). C-signal is required to trigger waves and streams at different stages of development via the Frz system. When the density of C-signaling protein on the cells' surface is low, cells respond to collision and signaling by reversing their gliding direction. This reversal response to the C-signal gives rise to the traveling wave patterns characterizing the ripple phase (Fig. 1) (9, 17–19).
However, the ripple phase is self-limiting because with each C-signaling event, more C-signal molecules are exported to the cell surface. When the number of C-signal proteins on the surface exceeds a threshold, the responding cell decreases its reversal frequency and increases its speed, and streaming commences (7, 8). Streaming behavior can be observed inside nascent fruiting bodies by tracking individual cells. Within an aggregation, cells circulate clockwise and counterclockwise in roughly equal proportions. Within each stream cells do not reverse, but cells outside the aggregate, where C-signaling is less intense, do reverse (20, 21). That an increased C-signal concentration is necessary for streaming is shown by ΔactA and ΔactB mutants that fail to raise the C-signal level to the streaming threshold (13). These mutants continue in wave mode for several days. Cells in a stream have many more opportunities to C-signal each other as they move, and there is more positive feedback (22). With repeated signaling several hundred molecules of C-signal accumulate on the cell surface; the responding cell phosphorylates most of its FruA, which in turn induces expression of sporulation genes and eventually sporulation itself (13, 23).
Waves and Aggregation in Submerged Cultures
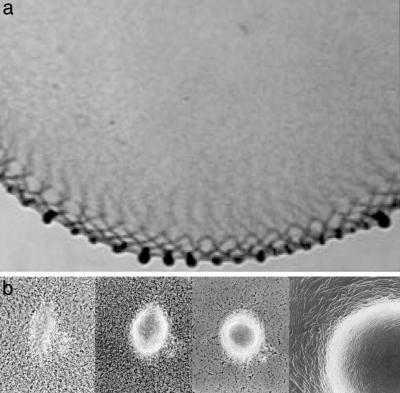
Fruiting body development of Myxococcus xanthus can be followed by using time-lapse photography in submerged agar cultures (3, 17). Fig. 2a shows a frame from a movie showing waves and aggregations (Movie 1, which is published as supporting information on the PNAS web site). As waves counterpropagate along the colony edge, the cells begin to form stationary clusters spaced one ripple wavelength apart along the edge of the culture.
Fig. 2.
Waves and aggregations. (a) A portion of the submerged culture showing the counterpropagating waves around the colony periphery and the aggregations accumulating at the colony edge. (b) Photographs of the same aggregate at 8, 11, and 24 h. Development of a traffic jam into a fruiting body (31). The leftmost panel shows an initial traffic jam that enlarges and rounds in the middle two panels. The fruiting body in the rightmost panel shows the circumferential alignment of cells resulting from the swirling motion of the aggregating cells (29).
Where each pair of countermigrating wave crests intersect at the high-density edge of the culture, the total cell density is much higher than elsewhere (17). These clusters have roughly equal numbers of cells entering from opposite directions. This creates “traffic jams” of oppositely oriented cells which stop as both engines stall. The jams are 3D, containing hundreds or even thousands of individuals. Scanning electron micrographs (SEM) of such an aggregate containing ≈103 cells has the appearance of a flattened traffic jam (see panel corresponding to 8 h in figure 1 of ref. 24). These aggregates remain stationary for >6 h. During that period, the aggregates grow in size and gradually acquire circular symmetry. Cell-tracking experiments show that aggregate growth is fed by the addition of cells streaming in closed orbits around the central core of jammed cells (cf. table 2 of ref. 3 and refs. 7, 8, and 25).
Streaming in closed orbits implies that cells turn as they stream along curved slime trails. The peptidoglycan of M. xanthus is a set of articulating plates (26), so that cells can bend and turn when they encounter a barrier (3, 18, 27). Thus, cells within a traffic jam eventually turn and glide around the cells that block their paths. After 6 h of aggregate enlargement and resolution of the jams, the aggregates begin to fuse with each other. The fusion of a pair of aggregates to its center of mass indicates that all of their constituent cells are in motion. These steps are summarized in Fig. 2b, showing how an elongated traffic jam becomes a round motile aggregate and then a fruiting body.
The Mathematical Model
Based on our earlier studies, we established the following characteristics of bacterial motion during the ripple phase (28).
Isolated bacteria glide for a few body lengths, then reverse direction and retrace their original path. The frequency of reversals is not exponentially distributed, indicating randomly timed reversals; instead, it displays a broad, but peaked, distribution about a mean of ≈8 min.
C-signaling between cells takes place by cell contact only and is most efficient if the contacts are end-to-end. The frequency of reversals increases with the frequency of cell collisions.
Ripple-phase waves cannot exist unless there is a “refractory” period after each signal-induced direction reversal wherein the cells are insensitive to C-signal; during this time, reversal of cell polarity takes place. Also, the response of a cell to C-signaling must be a nonlinear function of the local cell density.
To these characteristics of 1D ripples we add the following properties to describe aggregation and 2D rippling patterns based on the experimental observations summarized in the Introduction.
Cells gliding in the direction of their long axis tend to align for steric reasons. The degree of alignment increases with cell density. The aligned polymers of the slime trails record the cells' orientation field even when no cells are present. This is consistent with the micrograph shown in Fig. 2b (rightmost panel).
Cells tend to jam in regions of high density and at orientation field singularities. The jamming probability goes up with cell density early in fruiting body development.
Cells turn perpendicular to a cell density gradient as they enter into, or back out of, high-density traffic jams. This is consistent with the micrograph shown in Fig. 2b (rightmost panel). Experimental evidence for turning is presented in ref. 29.
The cell-density dependence of reversal frequency changes to promote streaming as the level of C-signal rises during aggregation, and these streams do not create jams but flow smoothly.
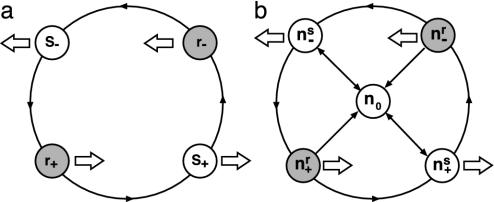
For simplicity, we begin with all cells aligned along the x axis, and we focus on the behavior of a single bacterium. During one reversal cycle, the cell passes through four states (Fig. 3a). A cell sensitive to C-signal moves to the right (s+). When a cell reverses in response to C-signal, and begins moving to the left, it enters a refractory state (r-). It emerges from the refractory state and continues to move to the left in a C-signaling-sensitive state (s-). When it reverses to move to the right once again, it enters a refractory state (r+). The arrows show that the reversal cycle can progress only in the counterclockwise direction.∥
Fig. 3.
Motility states of the model. (a) The reversal cycle for an individual cell. Cells can be in either refractory (r) or sensitive (s) states moving to the left (-) or right (+). (b) In a population of cells,  denotes cells in the states shown in a, plus one additional stationary state (0) when the cell is jammed by the proximity of many neighbors. All moving states can enter the jammed state with the probability increasing with total cell density,
  .
.
Now consider a population of cells. When cells are crowded at orientation singularities, they transiently form a traffic jam wherein their motility is blocked by their neighbors (29). We use the notation shown in Fig. 3b: (ns+, nr+, ns-, nr-, n0) denotes the local density of cells in the sensitive (s) or refractory (r) state, moving to the right (+) or left (-), or stopped (0), respectively. Transitions between states are denoted by arrows; only the transitions between ns0 and the two sensitive states are reversible. This is because moving cells trapped in a traffic jam at high density can escape by moving either forwards or backwards.
The equations describing the motion of the population have the following form:
 |
[1] |
Here n = (ns+, nr+, ns-, nr-, n0) is the vector of cell states shown in Fig. 3b. The transition rates between the states are described by the transition matrix K. The local average cell motion is described by the sum of a convective gliding flux, JGliding, and a random (diffusive) flux, JDiffusion. The exact form of these terms is given in the supporting information.
Because myxobacteria are cylindrical, steric alignment of cells strongly influences gliding motility and dominates dense swarms (30). In addition, cells align with and follow slime trails; thus, our description of cell motion should account for alignment (5, 31). We do this by introducing a vector field, T, describing the orientation of the slime and cells. We assume that cells move at constant speed, ±v0, so that the cell velocity is given by v =±v0T, and obeys the equation
 |
[2] |
where both α and τ are functions of ntot, the local density of cells in all states:  . The first term on the right side describes the tendency of cells to align with one another when crowded (a steric effect analogous to aligning pencils in a confined space). The second term accounts for the turning torque experienced by cells when moving in a region of impenetrably high cell density such as the edge of a traffic jam. The functional form of α and τ are given in Supporting Methods. The relationship of the model to other models (32, 33) describing the motion of oriented objects is also given in Supporting Methods. Table 1, which is published as supporting information on the PNAS web site, gives the numerical values of the model parameters used in the simulations.
Results and Discussion
Waves and Aggregation Patterns at the Colony Boundary. Time-lapse videos of aggregation in the submerged agar culture show several important features (supplemental materials of refs. 3 and 17). Those features are compared with numerical simulations of Eqs. 1 and 2 in Fig. 4 (corresponding movies are published as supporting information on the PNAS web site).
Fig. 4.
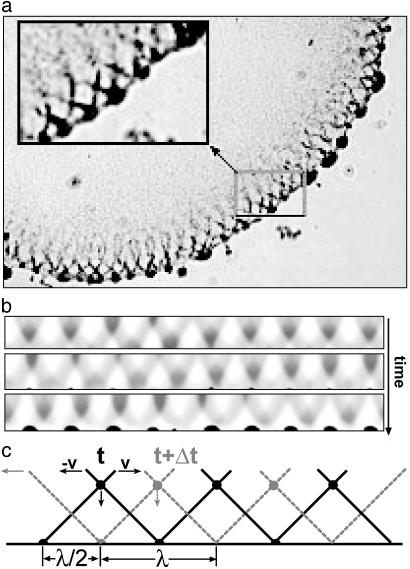
Simulated aggregation patterns in the submerged culture based on observations summarized in (3, 17). (a) Sector of the submerged culture showing a single row of interpenetrating waves and the peripheral aggregations they seed (3, 17). (b) Three frames from the simulation movie (Movie 2, which is published as supporting information on the PNAS web site) of the system in Fig. 2a. The 3D aggregations are represented by a typical cross-section as viewed from above. Periodic boundary conditions produce waves moving in both directions. Because of the curvature of the boundary, right-going waves are tilted to the right and left-going waves are tilted to the left. Wave intersections become the loci of initial aggregate formation at the colony edge (bottom of the strip). Aggregates tend to form one wavelength apart, with a few spaced a half wavelength apart. The larger aggregates grow at the expense of smaller adjacent ones. (c) Schematic representation of intersecting waves at the colony edge. At time t the intersection point of two wave crests hits the colony boundary. These intersection points correspond to the highest density and therefore the greatest jamming probability, so that initial aggregates form there. As the waves counterpropagate, intersection points move vertically downwards. At time t +Δt the crest intersection points hit the boundary again and triple intersections form half way in between. The time interval Δt can be estimated as ½λ/v ≈ Trev.
Waves. The density waves in the ripple phase of myxobacteria differ in a fundamental way from those observed aggregating slime molds [e.g., Dictyostelium discoideum (34)]: counterpropagating waves do not annihilate one another but appear to interpenetrate and pass through each other, analogous to (but physically different from) soliton waves in fluids. In our previous analysis of these waves we explained how this phenomenon arises from two features of myxobacteria motion and communication (28). First, cell signaling is by direct contact exchange of C-signal protein, rather than diffusible chemotactic chemicals. Second, the periodic reversal cycle that characterizes individual cell motility manifests itself in collective waves of cell density wherein each cell shuttles back and forth between wave crests. The wavelength, λ, is given by
 |
where v is the mean gliding velocity and Trev the mean time between reversals (28). The qualitative description of the cells behavior in the waves is given below.
Near the edge of the submerged culture (Fig. 2a), cells are predominately aligned parallel to the boundary, so we can simplify the model in this region by fixing the cell orientation vector to be parallel to the boundary: T = (1, 0). Most of the cells move in the high-density crests separated by the less dense troughs. Two effects maintain the stability of the waves. Cells in the crests encounter and signal counterpropagating cells entering the crests from the trough, causing them to reverse and join the crest. As two crests traveling in opposite directions collide, all of the sensitive cells receive enough C-signal to elicit reversal, and the two waves exchange cells (10). Cells that were in a refractory state continue through the collision with their parent wave, so that the outgoing waves are populated by cells from both incoming waves. This effect refocuses the wave at each collision, countering the dispersive effect of randomizing diffusive motion of the cells. The curvature of the boundary produces a wave tilt equivalent to a small (≈5%) velocity gradient along the y axis. This is because cells closer to the colony center move with higher angular velocities than those near the edge of the colony. Collisions between counterpropagating crests stabilize the tilt at ≈45° (Fig. 2).
Aggregations. Cells in high-density regions have a tendency to form temporary traffic jams wherein their motion is arrested. The probability of a jammed state increases with cell density. Therefore, jamming is more likely at loci where waves intersect. Experiments show that the initial jams only occur at the boundary of the colony, that is, at “triple points” where wave intersections meet the boundary. As the waves counterpropagate around the periphery of the colony, the intersection points are spaced one-half wavelength apart and move vertically downwards (Fig. 4 b and c). Because the cell density is higher where waves intersect, the intersection loci periodically deposit a bolus of cells at the boundary spaced one-half wavelength apart. Each such deposition increases the probability of a traffic jam at these loci of high density.
However, not every triple intersection jam forms an initial aggregate. Cells in a jam are temporarily stalled but, with some probability, can extricate themselves by their back-and-forth motions. If they do succeed in leaving the jam, they glide parallel to the boundary until they encounter another aggregation. Because cells travel a distance ≈λ/2 = vTrev before reversing, jams that are separated by less than a wavelength can exchange cells. When a cell enters an aggregate, its mean residence time before escaping increases with the size of the aggregate. Thus, cells in larger aggregates tend to accumulate cells at the expense of smaller neighboring aggregates (a process analogous to “ripening” in colloids). Initially, aggregates form where each wave overlap intersects the boundary. However, smaller aggregates fade away and the eventual aggregate spacing tends to be one wavelength. Because this process is stochastic, the spacing is not perfectly regular: the dominant spacing is λ but may be interspersed with aggregates ≈λ/2 apart. Further ripening proceeds as jams are resolved and aggregates turn into swirls capable of moving along the boundary. We address these phenomena below.
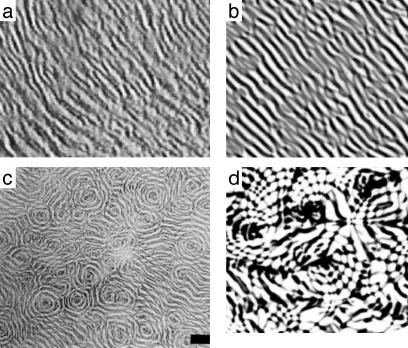
2D Patterns in the Ripple Phase. The waves discussed above are essentially 1D near the culture periphery. However, in Kuner-type submerged cultures the ripple phase develops both parallel as well as concentric and spiral waves, as shown in Fig. 5 (see also ref. 10). In these complex patterns, waves appear to pass through one another as in the planar waves discussed above. Myxobacterial cells tend to align with one another, and with the slime trails on which they glide. The tendency to align is modeled by diffusion of orientation in Eq. 2. That is, diffusion of density tends to make the density homogeneous; similarly, diffusion of orientation tends to make cell orientations homogeneous. This is equivalent to assuming that each cell's orientation relaxes to the average orientation of the surrounding cells (see Supporting Methods and ref. 33). Because the orientation field is remodeled by gliding cells, the time for orientation relaxation increases with total cell density (see supporting information for details). Fig. 5 shows that the model accurately captures these features, along with the interpenetration of counterpropagating waves.
Fig. 5.
2D rippling fields. (a) Experimentally observed interpenetrating planar waves (Movie 3, which is published as supporting information on the PNAS web site). (b) Frame from simulation movie (Movie 4, which is published as supporting information on the PNAS web site). (c) Planar waves coexist with concentric and spiral waves (10). (Scale bar = 200 μm.) (d) Frame from simulation movie shows similar patterns (Movie 5, which is published as supporting information on the PNAS web site).
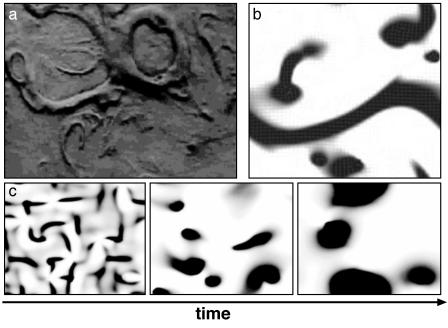
Streaming and Swirling During Aggregation. As described in the Introduction, the increased number of C-signal molecules per cell changes the cells' responses from rippling to streaming. In streams, reversals are suppressed and wave behavior ceases (7, 35). Streams in the myxobacterium Chondromyces crocatus are frequently seen to coalesce into rotating swirls, as shown in Fig. 6a (18, 27). To model this behavior we modify the reversal frequency so that it is a decreasing function of the density of cells moving in the same direction, producing a decrease in reversal frequencies of cells in dense streams (see supporting information). This results in segregation of n+ and n- cells into countercurrent streams. Fig. 6b shows that, starting with initially random orientations, streams form and sometimes swirl in clockwise and counterclockwise streams.
Fig. 6.
Swirling, streaming, and aggregation. (a) Top left panel shows a frame from the swirling movies of Reichenbach (18, 27). (b) Frame from simulation movie showing streaming and swirling (Movie 6, which is published as supporting information on the PNAS web site). (c) Swirling and aggregation in a large field of cells starting from random orientation (Movie 7, which is published as supporting information on the PNAS web site). Swirls form and coalesce, eventually achieving the circumferential organization shown in Fig. 2.
Although swirling structures such as those in Fig. 6a are not prominent in M. xanthus, cells are observed to circulate around the traffic jams. This circulation underlies the fusion of motile aggregates in Fig. 2. The model captures this circulation via the turning torque in Eq. 2. This term ensures that, at sufficiently high densities when the traffic jams cannot be penetrated, the cells turn at the edge of the jam. Thus, a circulation flow is maintained around the aggregate, enlarging it while its core remains stationary. In a 3D fruiting body aggregate, some countercirculating streams would climb over the top and down the other side and create the spheroidal shape of the M. xanthus fruiting body.
The simulations shown in Fig. 6c were started with square orientation patches (i.e., cell orientation is the same within a patch and varies randomly between neighboring patches). After a short transient period (corresponding to the choice of initial conditions), traffic jams are formed at the boundaries between patches with streams leading into them. The positions of the initial aggregations correspond to orientation field singularities. At the simulation time corresponding to ≈3 h in culture, several regularly shaped aggregates have formed. Circulating swirls of cells streaming into larger aggregates can be seen. As time progresses aggregates grow and absorb smaller ones.
To summarize, to model fruiting body formation in the colony center (in Kuner-type submerged culture) the model must combine (i) initiation by jamming in regions of high density, (ii) orientation field singularities, (iii) suppression of reversals in streams, and (iv) a dynamic orientation field. Rounded (convex) aggregates require that cells turn perpendicular to a density gradient as they enter into, or back out of, high-density aggregates.
Conclusions
We have constructed a computational model that accurately describes the 2D waves and aggregation morphogenesis of myxobacteria. The model accounts for the observed planar, concentric, and spiral rippling fields. Experimentally, aggregation commences at the very high cell density regions of the culture periphery where two wave crests interpenetrate. The model explains the position and spacing of the aggregates of M. xanthus. It accounts for the enlargement of the initial aggregates, and for their conversion to the observed motile aggregates that merge and organize circumferentially. The model also explains the swirling motions that are pronounced in C. crocatus. Finally, it is consistent with the 3D spherical shape of M. xanthus fruiting bodies.
Supplementary Material
Acknowledgments
G.O. and D.K. were supported by National Institutes of Health Grant GM23441. O.A.I. was supported by a Howard Hughes Medical Institute predoctoral fellowship.
Footnotes
In our earlier model the reversal cycle was modeled as a continuous phase variable on the circle. The relationship to the current formulation is given in Supporting Methods, which is published as supporting information on the PNAS web site.
References
- 1.Bonner, J. T. (1967) The Cellular Slime Molds (Princeton Univ. Press, Princeton).
- 2.Bonner, J. T. (2000) First Signals: The Evolution of Multicellular Development (Princeton Univ. Press, Princeton).
- 3.Kaiser, D. (2003) Nat. Rev. Microbiol. 1, 46-54. [DOI] [PubMed] [Google Scholar]
- 4.de Joussineau, C., Soule, J., Martin, M., Anguille, C., Montcourrier, P. & Alexandre, D. (2003) Nature 426, 555-559. [DOI] [PubMed] [Google Scholar]
- 5.Wolgemuth, C., Hoiczyk, E., Kaiser, D. & Oster, G. (2001) Curr. Biol. 12, 369-377. [DOI] [PubMed] [Google Scholar]
- 6.Nudleman, E. & Kaiser, D. (2003) J. Mol. Microbiol. Biotechnol., in press. [DOI] [PubMed]
- 7.Jelsbak, L. & Sogaard-Andersen, L. (1999) Proc. Natl. Acad. Sci. USA 96, 5031-5036. [DOI] [PMC free article] [PubMed] [Google Scholar]
- 8.Jelsbak, L. & Sogaard-Anderson, L. (2002) Proc. Natl. Acad. Sci. USA 99, 2032-2037. [DOI] [PMC free article] [PubMed] [Google Scholar]
- 9.Kim, S. & Kaiser, D. (1990) Science 249, 926-928. [DOI] [PubMed] [Google Scholar]
- 10.Sager, B. & Kaiser, D. (1994) Genes Dev. 8, 2793-2804. [DOI] [PubMed] [Google Scholar]
- 11.Kruse, T., Lobedanz, S., Berthelsen, N. & Søgaard-Andersen, L. (2001) Mol. Microbiol. 40, 156-168. [DOI] [PubMed] [Google Scholar]
- 12.Lobedanz, S. & Sogaard-Andersen, L. (2003) Genes Dev. 17, 2151-2161. [DOI] [PMC free article] [PubMed] [Google Scholar]
- 13.Gronewold, T. & Kaiser, D. (2001) Mol. Microbiol. 40, 744-756. [DOI] [PubMed] [Google Scholar]
- 14.Gronewold, T. M. A. & Kaiser, D. (2002) J. Bacteriol. 184, 1172-1179. [DOI] [PMC free article] [PubMed] [Google Scholar]
- 15.McBride, M. J., Weinberg, R. A. & Zusman, D. R. (1989) Proc. Nat. Acad. Sci. USA 86, 424-428. [DOI] [PMC free article] [PubMed] [Google Scholar]
- 16.Blackhart, B. D. & Zusman, D. R. (1985) Proc. Natl. Acad. Sci. USA 82, 8767-8770. [DOI] [PMC free article] [PubMed] [Google Scholar]
- 17.Welch, R. & Kaiser, D. (2001) Proc. Natl. Acad. Sci. USA 98, 14907-14912. [DOI] [PMC free article] [PubMed] [Google Scholar]
- 18.Reichenbach, H. (1965) Ber. Dtsch. Bot. Ges. 78, 102-105. [Google Scholar]
- 19.Shimkets, L. J. & Kaiser, D. (1982) J. Bacteriol. 152, 451-461. [DOI] [PMC free article] [PubMed] [Google Scholar]
- 20.Sager, B. & Kaiser, D. (1993) Genes Dev. 7, 1645-1653. [DOI] [PubMed] [Google Scholar]
- 21.Julien, B., Kaiser, A. D. & Garza, A. (2000) Proc. Natl. Acad. Sci. USA 97, 9098-9103. [DOI] [PMC free article] [PubMed] [Google Scholar]
- 22.Søgaard-Andersen, L., Overgaard, M., Lobedanz, S., Ellehauge, E., Jelsbak, L. & Rasmussen, A. (2003) Mol. Microbiol. 48, 1-8. [DOI] [PubMed] [Google Scholar]
- 23.Li, S., Lee, B. U. & Shimkets, L. (1992) Genes Dev. 6, 401-410. [DOI] [PubMed] [Google Scholar]
- 24.Kuner, J. & Kaiser, D. (1982) J. Bacteriol. 151, 458-461. [DOI] [PMC free article] [PubMed] [Google Scholar]
- 25.Sager, B. & Kaiser, D. (1993) Proc. Natl. Acad. Sci. USA 90, 3690-3694. [DOI] [PMC free article] [PubMed] [Google Scholar]
- 26.Dworkin, M. & Kaiser, D. (1993) Myxobacteria II (Am. Soc. Microbiol., Washington, DC).
- 27.Kuhlwein, H. & Reichenbach, H. (1968) in Schwarmentwicklung und Morphogenese bei Myxobakterien, ed. Wolf, G. (Inst. Wissenschaftliche Film, Göttingen, Germany), C893/1965 Vol 2A, pp. 335-359. [Google Scholar]
- 28.Igoshin, O., Mogilner, A., Welch, R., Kaiser, D. & Oster, G. (2001) Proc. Natl. Acad. Sci. USA 98, 14913-14918. [DOI] [PMC free article] [PubMed] [Google Scholar]
- 29.Kaiser, D. (2004) J. Bacteriol. 186, 919-927. [DOI] [PMC free article] [PubMed] [Google Scholar]
- 30.Wall, D. & Kaiser, D. (1998) Proc Natl. Acad. Sci. USA 95, 3054-3058. [DOI] [PMC free article] [PubMed] [Google Scholar]
- 31.Fontes, M. & Kaiser, D. (1999) Proc. Natl. Acad. Sci. USA 96, 8052-8057. [DOI] [PMC free article] [PubMed] [Google Scholar]
- 32.Lee, H. Y. & Kardar, M. (2001) Phys. Rev. E 64, 056113. [DOI] [PubMed] [Google Scholar]
- 33.Vicsek, T. (2001) Fluctuations and Scaling in Biology (Oxford Univ. Press, Oxford).
- 34.Monk, P. B. & Othmer, H. G. (1990) Proc. R. Soc. London 240, 555-589. [Google Scholar]
- 35.Jelsbak, L. & Sogaard-Andersen, L. (2000) Curr. Opin. Microbiol. 3, 637-642. [DOI] [PubMed] [Google Scholar]
- 36.Ellehauge, E., Norregaard-Madsen, M. & Sogaard-Andersen, L. (1998) Mol. Microbiol. 30, 807-817. [DOI] [PubMed] [Google Scholar]
Associated Data
This section collects any data citations, data availability statements, or supplementary materials included in this article.


