

Abstract
The RabGAP protein TBC1D5 controls cellular endomembrane trafficking processes and binds the retromer subunit VPS29 and the ubiquitin-like protein ATG8 (LC3). Here, we describe that TBC1D5 also associates with ATG9 and the active ULK1 complex during autophagy. Moreover, ATG9 and TBC1D5 interact with clathrin and the AP2 complex. Depletion of TBC1D5 leads to missorting of ATG9 to late endosomes upon activation of autophagy, whereas inhibition of clathrin-mediated endocytosis or AP2 depletion alters ATG9 trafficking and its association with TBC1D5. Taken together, our data show that TBC1D5 and the AP2 complex are important novel regulators of the rerouting of ATG9-containing vesicular carriers toward sites of autophagosome formation.
Keywords: AP2, ATG9, autophagy, clathrin endocytosis, TBC1D5
Introduction
Macroautophagy (autophagy) is a membrane-dependent process, critical for delivery of various cytoplasmic cargo (e.g., protein aggregates, damaged organelles, and pathogens) to the lysosomes (for degradation) 1 and secretion of molecules that mediate immune responses 2. Numerous membrane sources are implicated in the formation of autophagosomes: endoplasmic reticulum 3, mitochondria 4, 5, plasma membrane 6, and Golgi complex 7–10. This suggests that autophagy closely intersects with and depends on various membrane trafficking events inside cell 11. More than 30 autophagy-related genes take part in phagophore formation 12 including the essential ULK1/ATG13/FIP200 kinase complex and ATG9. While the trafficking of yeast ATG9 appears better understood, knowledge on its mammalian homologue is far more elusive 13. Mammalian ATG9 localizes to the trans-Golgi network and to late endosomes under basal conditions and cycles between its reservoirs and phagophore assembly site (PAS) upon autophagy induction 14. Dispersal of ATG9 during autophagy is dependent on ULK1 14 and contributes to the formation of autophagosome precursors initiated by DFCP1 15. However, the nature of ATG9 spatio-temporal redistribution remains unclear. Moreover, recent studies suggest that ATG9 traffic carriers may not incorporate into autophagosomes, but only transiently associate with them 15.
Previously, we proposed that proteins known to accelerate hydrolysis of GTP on small Rab GTPases (RabGAP) act as autophagic adaptors that regulate autophagy-endocytosis crosstalk via direct interaction with the autophagy ubiquitin-like protein LC3 16. TBC1D14 and TBC1D25 play a role in early and late stages of autophagosome maturation, respectively 17, 18. TBC1D5 binds directly to LC3 and retromer subunit VPS29, via LC3 interacting region 1 (LIR1), and regulates internalization and TGN retrieval of CI-M6PR. During autophagy, mutually exclusive binding to LC3 mediates its transfer from retromer to the autophagosomal membrane 16. Although retromer complex associates with the autophagic machinery 19, its role in autophagy is unclear 20. ATG9 is the only autophagic protein reported to co-fractionate with retromer, TGN46, and CI-M6PR-containing compartments 14. We therefore hypothesized that TBC1D5 may impact on ATG9 trafficking within the endosomal system and we aimed to define the link between coordinated trafficking patterns of ATG9, retromer, and TBC1D5.
Here, we report the functional interaction between TBC1D5, ATG9, and AP2 complex. During autophagy, TBC1D5 dissociates from retromer and associates with ATG9 and active ULK1. Additionally, we show that ATG9 trafficking is regulated by AP2 and TBC1D5. We propose that during autophagy, the efficient rerouting of ATG9 carriers toward PAS requires the dynamic transition of TBC1D5 to autophagosomes and that AP2 complex mediates such trafficking reorganization.
Results and Discussion
TBC1D5 associates with ATG9 and ULK1
ATG9 has 6 transmembrane regions and localizes to TGN and Rab7-, Rab9-, and CI-M6PR-containing endosomes 14. Upon autophagy stimuli, ATG9 relocates to peripheral sites driving the growth of the phagophore. In U2OS cells stably expressing mCherry-ATG9, endogenous TBC1D5, retromer subunit VPS35, and mCherry-ATG9 co-localized in steady state as well as during autophagy induced by the mTOR inhibitor KU0063974 (Fig 1A). Closer inspection of ATG9-containing vesicles showed that ATG9 does not enter retromer-associated endosomal tubules (Supplementary Fig S1A). Co-localization of TBC1D5 with ATG9 was steadily high in both tested conditions (Fig 1B), while retromer co-localization decreased upon autophagy induction (Fig 1C). Endogenous ATG9, LC3, and TBC1D5 also co-localized in cells (Supplementary Fig S1B). Next, we tested whether TBC1D5 and retromer associate with ATG9. TBC1D5 and ATG9 co-precipitated with retromer subunit VPS29 (Fig 1D and E) or VPS35 (Fig 1F) only in non-stimulated conditions. Upon autophagy induction, HA-Flag-TBC1D5 bound less endogenous VPS29, but interacted stronger with ATG9 (Fig 1G).
Figure 1.

TBC1D5 and retromer associate with ATG9.
A Co-localization of endogenous TBC1D5 and VPS35 with mCherry-ATG9A, in steady state and autophagy induced by mTOR inhibitor KU0063794 (6 h).
B, C Quantification of co-localization experiments presented in (A).
D Co-immunoprecipitation of HA-Flag-TBC1D5 with myc-VPS29, transiently overexpressed in 293T cells, DMSO or KU0063794 (6 h) treated.
E, F Co-immunoprecipitation of endogenous TBC1D5 and ATG9 with myc-VPS29 (E) transiently overexpressed in 293T cells or with HA-Flag-VPS35 (F) transiently overexpressed in 293T cells, treated with DMSO or KU0063794 (6 h).
G Co-immunoprecipitation of endogenous VPS29 and ATG9 with HA-Flag-TBC1D5 stably expressed in 293T cells, treated with DMSO or KU0063794 (6 h).
H Co-immunoprecipitation of endogenous ULK1 and pATG13 (Ser318) with HA-Flag-TBC1D5, stably expressed in T-REx 293T cells, induced by doxycycline (50 ng/ml) for 20 h prior to DMSO or KU0063794 (6 h) treatment.
I Magnified still images extracted from Supplementary Movie S2. mCherry-TBC1D5 co-localizes with GFP-ATG9 upon autophagy induction by mTOR inhibitor, KU0063794.
Data information: Bar graphs (B, C), mean ± s.d. n = 3, unpaired two-tailed t-test, P-values: ns P > 0.05, *P ≤ 0.05, **P ≤ 0.01, ***P ≤ 0.001.
TBC1D5 association with autophagosomes is regulated via binding to LC3 16. As expected from our previous study, autophagosomes containing TBC1D5 were negative for retromer staining (Supplementary Fig S1C). The early autophagosomal marker DFCP1 partially co-localized with TBC1D5 (Supplementary Fig S2B), while ATG16 did not (Supplementary Fig S2B), indicating that TBC1D5 specifically associates with ATG9 labeled early autophagosomes. Live-cell imaging of U2OS cells stably expressing GFP-ATG9 and mCherry-TBC1D5 revealed co-localization of ATG9- and TBC1D5-containing vesicles at steady state (Supplementary Movie S1) and during autophagy (Fig 1I, Supplementary Movies S2 and S3).
In addition, the major upstream kinase ULK1 co-localized with TBC1D5 (Supplementary Fig S3A) and together with the phosphorylated form of ATG13 co-precipitated with TBC1D5 (Fig 1H), suggesting that TBC1D5 associates with the active kinase as well.
TBC1D5 is required for ATG9 trafficking
Recently, it has been suggested that retromer is both required and dispensable for autophagy 15, 19. To test whether retromer contributes to ATG9 trafficking, we stably depleted U2OS cells of TBC1D5 or retromer subunit VPS29 and compared them with control shRNA-expressing cells (Fig 2A). In VPS29-deficient cells, we observed destabilization of all retromer subunits, but no apparent defect in autophagy flux upon autophagy stimulation (Fig 2A, Supplementary Fig S4A). Depletion of TBC1D5 severely affected the LC3 level and stabilized ATG9, suggesting that TBC1D5 acts also independently of retromer (Fig 2A). Separate regulation of retromer and ATG9 by TBC1D5 is possible because neither retromer co-localizes with LC3 (Supplementary Fig S1C) nor ATG9 associates with retromer during autophagy. TBC1D5-deficient cells showed decreased number of ATG9 vesicular structures in fed conditions (Fig 2B and C) while, upon autophagy induction, ATG9 was enriched in late endosomes as indicated by LAMP1 staining (Fig 2B and D). Importantly, retromer depletion did not lead to similar defect in ATG9 localization, indicating that retromer is dispensable for ATG9 trafficking during autophagy. We rescued the effect on ATG9 by introducing shRNA-resistant TBC1D5 to assure that observed phenotype is specific for TBC1D5 depletion (Fig 2F and G).
Figure 2.

- Lysates of U2OS cells stably expressing control shRNA or shRNA targeting VPS29 or TBC1D5. Cells were treated with DMSO or KU0063794 (6 h), lysed in RIPA buffer (1% SDS) and lysates were subjected to SDS–PAGE.
- U2OS cells stably expressing mCherry-ATG9 were depleted of VPS29 and TBC1D5 using shRNAs, treated with DMSO or KU0063794 (6 h), fixed with 2% PFA, and immunostained with anti-LAMP1 antibody.
- Quantification of ATG9 vesicular structures in cells from (B) under non-stimulated conditions.
- Quantification of ATG9 and LAMP1 co-localization in cells presented in (B).
- Quantification of ATG9 and LAMP1 co-localization in cells stably depleted for TBC1D5 (shRNA#1) or VPS29 (shRNA#2), transiently transfected with myc-TBC1D5 plasmid resistant to TBC1D5 shRNA#1. Cells were treated with KU0063794 (6 h), 20 h post-transfection, fixed, and immunostained with anti-LAMP1 and anti-myc antibodies.
- Control shRNA and U2OS cell lysates depleted for TBC1D5 (shRNA#1), transfected with empty plasmid or with shRNA-resistant myc-TBC1D5.
- Immunofluorescence of TBC1D5 (shRNA#1) cells transiently transfected with shRNA-resistant myc-TBC1D5, treated with KU0063794 (6 h). 20 h post-transfection cells were treated, subsequently fixed, and immunostained with anti-myc and anti-LAMP1 antibodies.
Data information: Bar graphs (C, E), mean ± s.d. n = 3, unpaired two-tailed t-test, P-values: ns P > 0.05, *P ≤ 0.05, **P ≤ 0.01, ***P ≤ 0.001. Bar graph (D), mean ± s.d. n = 3, one-way ANOVA with Bonferroni′s multiple comparison test, ns P > 0.05, *P ≤ 0.05, **P ≤ 0.01, ***P ≤ 0.001.
TBC1D5 and ATG9A interact with AP2 complex
As ATG9 accumulated in late endosomes and lysosomes upon TBC1D5 depletion, we hypothesized that TBC1D5 regulates sorting or recycling of ATG9. Interestingly, our published mass spectrometry interactome of TBC1D5 contained two subunits of AP2 complex, but no other endosome-TGN regulatory proteins such as TIP47 or PACS1 21. Available PPI (protein-protein interaction) database (Biogrid) reports TBC1D5 as an AP2M1 interactor 22. We purified AP2M1 subunit and confirmed its binding to overexpressed HA-Flag-TBC1D5 expressed in cells (Fig 3A), as well as purified GST-TBC1D5 (Supplementary Fig S5A). TBC1D5 interaction with AP2 complex was independent on LIR1 or GAP activity (Supplementary Fig S5B). TBC1D5 depletion led to the destabilization of AP2 complex (Fig 3B) and AP2 redistribution to the perinuclear area (Fig 3C). Moreover, TBC1D5 and ATG9 co-localized with the AP2 complex (Fig 3D, Supplementary Fig S6A). Importantly, co-localization of ATG9 with AP2 was enhanced during autophagy (Fig 3E, Supplementary Fig S6B) and readily disturbed upon the depletion of TBC1D5 (Supplementary Fig S6B). Imaging of GFP-ATG9 stably expressing U2OS cells (Supplementary Movie S4) revealed numerous highly mobile vesicles. Based on this notion, we hypothesized that ATG9 is incorporated into AP2-clathrin-coated vesicles (CCVs) of plasma membrane origin. Diameter of ATG9-containing vesicles has been estimated to be 30–60 nm 20, which is somewhat close to CCV size 23. As proposed, AP2 complex and clathrin readily co-precipitated with ATG9 (Fig 3F), prominently upon autophagy induction, while retromer dissociated from ATG9 (Fig 3F). Taken together, our data indicate that TBC1D5 regulates ATG9 via AP2 complex.
Figure 3.

- HA-Flag-TBC1D5 expression was induced in T-REx HeLa cells for 20 h, lysates were subjected to GST pull-down, using GST and GST-AP2M1. Co-precipitated TBC1D5 was detected with anti-Flag antibody.
- Control cells and TBC1D5 (shRNA#1) U2OS cell lysates subjected to SDS–PAGE, subsequently blotted with endogenous antibodies for AP2 subunits AP2A1 and AP2M1.
- Immunofluorescent staining of AP2A1 in U2OS shRNA control, or shRNA#1 TBC1D5 cells treated with KU0063974 or DMSO (6 h).
- U2OS cells stably expressing HA-Flag-ATG9A were fixed and stained for endogenous AP2A1 and TBC1D5. Regions of co-localization are indicated with arrows.
- U2OS cells stably expressing HA-Flag-ATG9A were starved in EBSS (4 h) or treated with KU0063794 (6 h), subsequently fixed and stained with anti-AP2A1 antibody.
- U2OS cells stably expressing mCherry-ATG9A were treated with KU0063794 (6 h), lysed in co-immunoprecipitation buffer. Lysates from DMSO- or KU0063794-treated cells were split and equal volumes were incubated with RFP-Trap beads or GFP-Trap beads, or agarose as a negative control, overnight at 4°C. Precipitated proteins were analyzed by SDS–PAGE.
AP2 and clathrin-mediated endocytosis (CME) are required for ATG9 sorting and autophagy
AP2 complex binds to clathrin and acts as a major hub for protein interactions in clathrin-coated pits. Its recruitment during the last stage of CCV formation at the plasma membrane precedes Dynamin 2-dependent pinching-off 24. To understand the role of ATG9 interaction with AP2 and clathrin, we silenced expression of AP2 or blocked maturation of CCVs by expressing a dominant-negative form of Dynamin 2. In normal growing conditions, AP2 depletion enhanced ATG9 localization on the plasma membrane (Fig 4A), while upon autophagy induction, ATG9 accumulated mostly in the TGN if compared to control siRNA-treated cells (Fig 4A and B, Supplementary Fig S7A). Moreover, lack of AP2 induced accumulation of p62 (Fig 4C) and significantly impaired LC3 lipidation (Supplementary Fig S7B) consistent with reported data 6. Differently, the dominant-negative form of Dynamin 2 (K44A) dispersed ATG9 toward the plasma membrane (Fig 4D).
Figure 4.
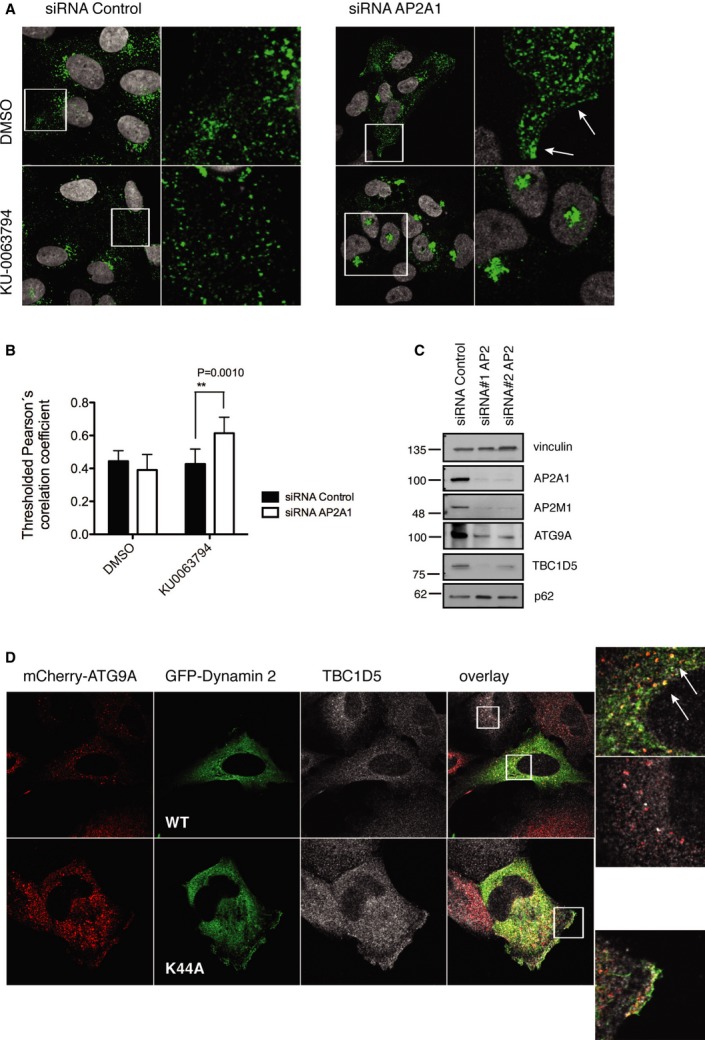
- U2OS cells stably expressing HA-Flag-ATG9A transfected with siRNA targeting AP2A1 (40 nM), or siRNA AllStar control (40 nM) were treated with KU0063794 or DMSO (6 h) 4 days post-transfection, fixed, and stained with anti-HA antibody.
- Co-localization of HA-Flag-ATG9A with TGN46.
- Lysates of U2OS cells transfected with siRNA targeting AP2A1, or siRNA control AllStars analyzed by SDS–PAGE.
- U2OS cells stably expressing mCherry-ATG9 were transiently transfected with GFP-Dynamin 2 or GFP-Dynamin 2 (K44A), 20 h post-transfection cells were fixed and immunostained with anti-TBC1D5 antibody. ATG9A and Dynamin 2 co-localization is indicated by arrows.
Data information: Bar graphs (B), mean ± s.d. n = 3, unpaired two-tailed t-test, P-values: ns P > 0.05, *P ≤ 0.05, **P ≤ 0.01, ***P ≤ 0.001.
Next, we treated cells with the Dynamin 2 inhibitor Dynasore 25, which led to a significant increase in ATG9 and TBC1D5 co-localization with AP2 (Fig 5A-C), similar to the effect of starvation (Fig 5D, Supplementary Fig S8A). This co-localization became even more pronounced when cells were pretreated with Dynasore and subsequently starved (Fig 5D, Supplementary Fig S8A). However, the plasma membrane regions enriched with AP2/ATG9/TBC1D5 excluded LC3 (Supplementary Fig S8B) and the number of LC3-positive puncta was reduced (Fig 5E), indicating that Dynasore delayed autophagosome formation. Inspection of live cells showed that Dynasore treatment led to co-localization of ATG9 and TBC1D5 in static vesicles (Supplementary Movie S5). Notably, depletion of AP2 complex abolished the TBC1D5 interaction with ATG9 (Fig 5F), suggesting that TBC1D5-ATG9 association is dynamic and is restricted to the AP2-clathrin-associated fraction of ATG9.
Figure 5.
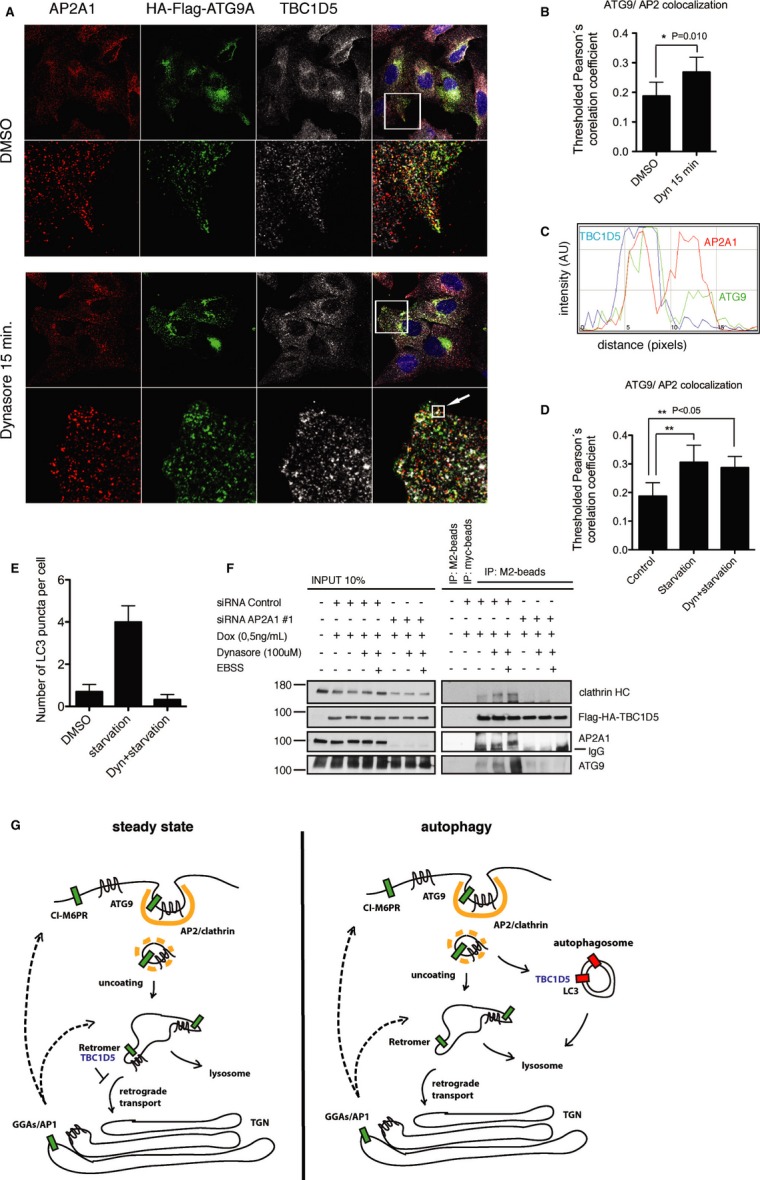
- U2OS cells stably expressing HA-Flag-ATG9A treated with DMSO or Dynasore (100 μM) 15 min, fixed and immunostained with anti-HA and anti-TBC1D5 antibodies.
- Quantification of ATG9A and AP2 co-localization from experiment in (A), pictures from 3 independent experiments were analyzed and co-localization quantified, statistics is calculated as described in Supplementary Materials and Methods.
- RGB-line profile across the vesicle indicated with arrow in (B); red—AP2; green—ATG9A; blue—TBC1D5.
- Quantification of ATG9A and AP2 co-localization. Cells were starved in EBSS media (45 min) or pretreated with Dynasore (15 min) and subsequently starved for 45 min in combination with Dynasore. Control cells were treated with DMSO.
- Quantification of LC3 puncta in cells stably expressing HA-Flag-ATG9A, treated and presented as in (D). 100 cells were quantified in 3 independent experiments.
- T-REx HeLa cells were transfected with siRNA Control oligo or siRNA oligo#1 targeting AP2A1 (40 nM). 72 h post-transfection, expression of HA-Flag-TBC1D5 was induced with doxycycline (50 ng/ml), and 96 h post-transfection cells were treated with Dynasore for 15 min, or pretreated with Dynasore and subsequently starved in combination with Dynasore for additional 45 min. Cells were lysed in co-immunoprecipitation buffer, and lysates were incubated with Myc antibody or M2 antibody coupled with agarose overnight at 4°C. Beads were washed 3 times with incubation buffer and subjected to SDS–PAGE.
- Proposed model for AP2 and TBC1D5 role in ATG9 trafficking toward autophagosomes. At steady state ATG9 traffics from Golgi to the endosomes and to the plasma membrane. Plasma membrane fraction gets internalized via AP2. During autophagy ATG9-AP2 vesicles redistribute toward autophagosomes via interaction of TBC1D5 with AP2 and LC3.
Data information: Bar graphs (B, D, E), mean ± s.d. n = 3, unpaired two-tailed t-test, P-values: ns P > 0.05, *P ≤ 0.05, **P ≤ 0.01, ***P ≤ 0.001.
Direct TBC1D5 interaction with LC3 16 and AP2 complex prompted us to hypothesize that TBC1D5 regulates the recruitment of ATG9-AP2-containing vesicles to the autophagic membranes (Fig 5G). Further experiments, however, are needed to gain mechanistic understanding of TBC1D5 connection to AP2, and to pinpoint regulatory mechanisms underlying this interaction in cells 26.
Few reports agree on the relevance of the AP2 complex in ATG16 trafficking and lysosome biogenesis 6, 27. Our findings indicate that TBC1D5 and AP2 complex directly affect ATG9 trafficking. During the revision of our manuscript, Puri et al 28 have also reported that ATG9 traffics from plasma membrane in the clathrin-positive carriers that are routed differently from ATG16 carriers 6, 27. In that study, ATG9 has been co-localized with early endosomal GTPase Rab5, whereas ATG16 failed to do so. However, both ATG9 and ATG16 would coalesce at stage of recycling endosomes in dependence on SNARE protein VAMP1. Interestingly, TBC1D5 associates with ATG9 but does not co-localize with ATG16, while depletion of TBC1D5 enhances endosomal localization of ATG9. Our data support the idea that TBC1D5 might specifically regulate the recruitment of ATG9 from early stage of endocytosis to the site of forming autophagosomes. It remains to be addressed by what mechanisms ATG9 and ATG16 are targeted to a different population of clathrin-coated vesicles, and whether additional components of endocytic machinery participate in their segregation or collision.
In conclusion, we propose a dual role for TBC1D5: it regulates membrane trafficking, upon autophagy induction, and it contributes to different routes of endosomal sorting including clathrin-AP2-mediated sorting and retromer-Rab7-dependent retrograde transport.
Materials and Methods
Dynasore treatments
Dynasore (Sigma Aldrich Cat. Nr. D7693) was dissolved in DMSO according to the manufacturer, and used at final concentrations of 100 μM.
Autophagy stimulation
Autophagy was stimulated by starvation or chemical inhibition of mTOR. First, cells were washed 2 times in starvation media (EBSS, Gibco Cell Culture) and subsequently incubated for 45 min or 4 h. For mTOR inhibition, we used a KU0063794 inhibitor 29, dissolved in DMSO according to the manufacturer (Axon Medchem, Cat. Nr. 1472), and used at a final concentration of 1 μM. Control cells were treated with DMSO only.
Statistical analysis
Co-localization thresholded Pearson's correlation coefficients were calculated in Volocity Demo software (Perkin Elmer). For each co-localization analysis, pictures of fields containing 3–5 cells have been analyzed using tool “Colocalization” and “Automatic Thresholding”, thresholded Pearson's correlation coefficient has been calculated for 100–150 cells in three independent experiments, and subsequently, mean and s.d. were calculated for the total number of fields analyzed (considering normal distribution for each experiment performed on same cells in same conditions/treatment). Number of LC3 puncta and number of ATG9 vesicles were calculated using ImageJ software plugin for particle analysis. Fields of cells have been analyzed from three independent experiments, and bar graph represents mean number of puncta/vesicles per cell, of 100-150 cells in total. P-values were calculated using unpaired two-tailed t-test (GraphPad Prism), or one-way ANOVA followed by Bonferroni's multiple comparison test for grouped analysis (Fig 2D). Statistical significance (GraphPad Prism): ns P > 0.05, *P ≤ 0.05, **P ≤ 0.01, ***P ≤ 0.001.
Extended experimental procedures
Details of the plasmids, cell culture procedures, knock-down cell lines, antibodies, microscopy experiments, immunoprecipitation, and in vitro binding assays can be found in Supplementary Materials and Methods.
Acknowledgments
We thank Daniela Höller, David McEwan, Ivana Novak, Paolo Grumati, and Aliaksandr Khaminets for critical reading and comments on the manuscript. The work was supported by the Cluster of Excellence “Macromolecular Complexes” of the Goethe University Frankfurt (EXC115), LOEWE Oncology Signaling Network, and the LineUB European Research Council Advanced Grant to ID.
Author contributions
D.P. conducted the experiments. D.P and I.D. designed the research, analyzed the data, and wrote the manuscript.
Conflict of interest
The authors declare that they have no conflict of interest.
Supplementary information for this article is available online: http://embor.embopress.org
References
- 1.Mizushima N. Autophagy: process and function. Genes Dev. 2007;21:2861–2873. doi: 10.1101/gad.1599207. [DOI] [PubMed] [Google Scholar]
- 2.Bruns C, McCaffery JM, Curwin AJ, Duran JM, Malhotra V. Biogenesis of a novel compartment for autophagosome-mediated unconventional protein secretion. J Cell Biol. 2011;195:979–992. doi: 10.1083/jcb.201106098. [DOI] [PMC free article] [PubMed] [Google Scholar]
- 3.Hayashi-Nishino M, Fujita N, Noda T, Yamaguchi A, Yoshimori T, Yamamoto A. A subdomain of the endoplasmic reticulum forms a cradle for autophagosome formation. Nat Cell Biol. 2009;11:1433–1437. doi: 10.1038/ncb1991. [DOI] [PubMed] [Google Scholar]
- 4.Hailey DW, Rambold AS, Satpute-Krishnan P, Mitra K, Sougrat R, Kim PK, Lippincott-Schwartz J. Mitochondria supply membranes for autophagosome biogenesis during starvation. Cell. 2010;141:656–667. doi: 10.1016/j.cell.2010.04.009. [DOI] [PMC free article] [PubMed] [Google Scholar]
- 5.Hamasaki M, Furuta N, Matsuda A, Nezu A, Yamamoto A, Fujita N, Oomori H, Noda T, Haraguchi T, Hiraoka Y, et al. Autophagosomes form at ER-mitochondria contact sites. Nature. 2013;495:389–393. doi: 10.1038/nature11910. [DOI] [PubMed] [Google Scholar]
- 6.Ravikumar B, Moreau K, Jahreiss L, Puri C, Rubinsztein DC. Plasma membrane contributes to the formation of pre-autophagosomal structures. Nat Cell Biol. 2010;12:747–757. doi: 10.1038/ncb2078. [DOI] [PMC free article] [PubMed] [Google Scholar]
- 7.Ohashi Y, Munro S. Membrane delivery to the yeast autophagosome from the Golgi-endosomal system. Mol Biol Cell. 2010;21:3998–4008. doi: 10.1091/mbc.E10-05-0457. [DOI] [PMC free article] [PubMed] [Google Scholar]
- 8.Yen WL, Shintani T, Nair U, Cao Y, Richardson BC, Li Z, Hughson FM, Baba M, Klionsky DJ. The conserved oligomeric Golgi complex is involved in double-membrane vesicle formation during autophagy. J Cell Biol. 2010;188:101–114. doi: 10.1083/jcb.200904075. [DOI] [PMC free article] [PubMed] [Google Scholar]
- 9.van der Vaart A, Griffith J, Reggiori F. Exit from the Golgi is required for the expansion of the autophagosomal phagophore in yeast Saccharomyces cerevisiae. Mol Biol Cell. 2010;21:2270–2284. doi: 10.1091/mbc.E09-04-0345. [DOI] [PMC free article] [PubMed] [Google Scholar]
- 10.Geng J, Nair U, Yasumura-Yorimitsu K, Klionsky DJ. Post-Golgi Sec proteins are required for autophagy in Saccharomyces cerevisiae. Mol Biol Cell. 2010;21:2257–2269. doi: 10.1091/mbc.E09-11-0969. [DOI] [PMC free article] [PubMed] [Google Scholar]
- 11.Lamb CA, Yoshimori T, Tooze SA. The autophagosome: origins unknown, biogenesis complex. Nat Rev Mol Cell Biol. 2013;14:759–774. doi: 10.1038/nrm3696. [DOI] [PubMed] [Google Scholar]
- 12.Mizushima N, Yoshimori T, Ohsumi Y. The role of Atg proteins in autophagosome formation. Annu Rev Cell Dev Biol. 2011;27:107–132. doi: 10.1146/annurev-cellbio-092910-154005. [DOI] [PubMed] [Google Scholar]
- 13.Zavodszky E, Vicinanza M, Rubinsztein DC. Biology and trafficking of ATG9 and ATG16L1, two proteins that regulate autophagosome formation. FEBS Lett. 2013;587:1988–1996. doi: 10.1016/j.febslet.2013.04.025. [DOI] [PubMed] [Google Scholar]
- 14.Young AR, Chan EY, Hu XW, Kochl R, Crawshaw SG, High S, Hailey DW, Lippincott-Schwartz J, Tooze SA. Starvation and ULK1-dependent cycling of mammalian Atg9 between the TGN and endosomes. J Cell Sci. 2006;119:3888–3900. doi: 10.1242/jcs.03172. [DOI] [PubMed] [Google Scholar]
- 15.Orsi A, Razi M, Dooley HC, Robinson D, Weston AE, Collinson LM, Tooze SA. Dynamic and transient interactions of Atg9 with autophagosomes, but not membrane integration, are required for autophagy. Mol Biol Cell. 2012;23:1860–1873. doi: 10.1091/mbc.E11-09-0746. [DOI] [PMC free article] [PubMed] [Google Scholar]
- 16.Popovic D, Akutsu M, Novak I, Harper JW, Behrends C, Dikic I. Rab GTPase-activating proteins in autophagy: regulation of endocytic and autophagy pathways by direct binding to human ATG8 modifiers. Mol Cell Biol. 2012;32:1733–1744. doi: 10.1128/MCB.06717-11. [DOI] [PMC free article] [PubMed] [Google Scholar]
- 17.Itoh T, Kanno E, Uemura T, Waguri S, Fukuda M. OATL1, a novel autophagosome-resident Rab33B-GAP, regulates autophagosomal maturation. J Cell Biol. 2011;192:839–853. doi: 10.1083/jcb.201008107. [DOI] [PMC free article] [PubMed] [Google Scholar]
- 18.Longatti A, Lamb CA, Razi M, Yoshimura S, Barr FA, Tooze SA. TBC1D14 regulates autophagosome formation via Rab11- and ULK1-positive recycling endosomes. J Cell Biol. 2012;197:659–675. doi: 10.1083/jcb.201111079. [DOI] [PMC free article] [PubMed] [Google Scholar]
- 19.Dengjel J, Høyer-Hansen M, Nielsen MO, Eisenberg T, Harder LM, Schandorff S, Farkas T, Kirkegaard T, Becker AC, Schroeder S, et al. Identification of autophagosome-associated proteins and regulators by quantitative proteomic analysis and genetic screens. Mol Cell Proteomics. 2012;11(M111):014035. doi: 10.1074/mcp.M111.014035. [DOI] [PMC free article] [PubMed] [Google Scholar]
- 20.Yamamoto H, Kakuta S, Watanabe TM, Kitamura A, Sekito T, Kondo-Kakuta C, Ichikawa R, Kinjo M, Ohsumi Y. Atg9 vesicles are an important membrane source during early steps of autophagosome formation. J Cell Biol. 2012;198:219–233. doi: 10.1083/jcb.201202061. [DOI] [PMC free article] [PubMed] [Google Scholar]
- 21.Chen C, Garcia-Santos D, Ishikawa Y, Seguin A, Li L, Fegan KH, Hildick-Smith GJ, Shah DI, Cooney JD, Chen W, et al. Snx3 regulates recycling of the transferrin receptor and iron assimilation. Cell Metab. 2013;17:343–352. doi: 10.1016/j.cmet.2013.01.013. [DOI] [PMC free article] [PubMed] [Google Scholar]
- 22.Rual JF, Venkatesan K, Hao T, Hirozane-Kishikawa T, Dricot A, Li N, Berriz GF, Gibbons FD, Dreze M, Ayivi-Guedehoussou N, et al. Towards a proteome-scale map of the human protein-protein interaction network. Nature. 2005;437:1173–1178. doi: 10.1038/nature04209. [DOI] [PubMed] [Google Scholar]
- 23.Perrais D, Merrifield CJ. Dynamics of endocytic vesicle creation. Dev Cell. 2005;9:581–592. doi: 10.1016/j.devcel.2005.10.002. [DOI] [PubMed] [Google Scholar]
- 24.Krauss M, Haucke V. Shaping membranes for endocytosis. Rev Physiol Biochem Pharmacol. 2011;161:45–66. doi: 10.1007/112_2008_2. [DOI] [PubMed] [Google Scholar]
- 25.Macia E, Ehrlich M, Massol R, Boucrot E, Brunner C, Kirchhausen T. Dynasore, a cell-permeable inhibitor of dynamin. Dev Cell. 2006;10:839–850. doi: 10.1016/j.devcel.2006.04.002. [DOI] [PubMed] [Google Scholar]
- 26.Ricotta D, Conner SD, Schmid SL, von Figura K, Honing S. Phosphorylation of the AP2 mu subunit by AAK1 mediates high affinity binding to membrane protein sorting signals. J Cell Biol. 2002;156:791–795. doi: 10.1083/jcb.200111068. [DOI] [PMC free article] [PubMed] [Google Scholar]
- 27.Rong Y, Liu M, Ma L, Du W, Zhang H, Tian Y, Cao Z, Li Y, Ren H, Zhang C, et al. Clathrin and phosphatidylinositol-4,5-bisphosphate regulate autophagic lysosome reformation. Nat Cell Biol. 2012;14:924–934. doi: 10.1038/ncb2557. [DOI] [PubMed] [Google Scholar]
- 28.Puri C, Renna M, Bento CF, Moreau K, Rubinsztein DC. Diverse autophagosome membrane sources coalesce in recycling endosomes. Cell. 2013;154:1285–1299. doi: 10.1016/j.cell.2013.08.044. [DOI] [PMC free article] [PubMed] [Google Scholar]
- 29.Garcia-Martinez JM, Moran J, Clarke RG, Gray A, Cosulich SC, Chresta CM, Alessi DR. Ku-0063794 is a specific inhibitor of the mammalian target of rapamycin (mTOR) Biochem J. 2009;421:29–42. doi: 10.1042/BJ20090489. [DOI] [PMC free article] [PubMed] [Google Scholar]
Associated Data
This section collects any data citations, data availability statements, or supplementary materials included in this article.