

Abstract
Segregating cells into compartments during embryonic development is essential for growth and pattern formation. Physical mechanisms shaping compartment boundaries were recently explored in Drosophila, where actomyosin-based barriers were revealed to be important for keeping cells apart. In vertebrates, interhombomeric boundaries are straight interfaces, which often serve as signaling centers that pattern the surrounding tissue. Here, we demonstrate that in the hindbrain of zebrafish embryos cell sorting sharpens the molecular boundaries and, once borders are straight, actomyosin barriers are key to keeping rhombomeric cells segregated. Actomyosin cytoskeletal components are enriched at interhombomeric boundaries, forming cable-like structures in the apical side of the neuroepithelial cells by the time morphological boundaries are visible. When myosin II function is inhibited, cable structures do not form, leading to rhombomeric cell mixing. Downregulation of EphA4a compromises actomyosin cables and cells with different rhombomeric identity intermingle, and the phenotype is rescued enhancing myosin II activity. Moreover, enrichment of actomyosin structures is obtained when EphA4 is ectopically expressed in even-numbered rhombomeres. These findings suggest that mechanical barriers act downstream of EphA/ephrin signaling to segregate cells from different rhombomeres.
Keywords: actomyosin cable, cell sorting, compartments, rhombomeric boundaries, segmentation
Introduction
During embryonic development, cells are partitioned into distinct groups or compartments separated by sharp boundaries. Cells do not intermingle across compartment boundaries, ensuring that their fates and/or positional information remain segregated as they proliferate and move. Thus, the establishment of these interfaces is critical to embryonic pattern formation and tissue differentiation, and importantly, tissue interface deregulation plays a key role during tumor progression and metastasis (Dahmann et al, 2011; Batlle & Wilkinson, 2012).
In Drosophila and vertebrates, cell sorting between compartments is governed both by transcription factors that confer compartment-specific identities and by signaling centers localized to the boundaries, such as EphA/ephrin, Hedgehog, or Notch signaling (for review, see Dahmann et al, 2011). Downstream of these factors, several mechanisms have been proposed for cell sorting, mainly differential adhesion, regulation of the cytoskeleton, control of cell proliferation or formation of extracellular matrix fences, although the causal relationship among them has not been unveiled. Lately, it has been shown that local regulation of actomyosin contractility and mechanical tension are the primary mechanisms for sorting cells at some compartmental boundaries in Drosophila (Monier et al, 2010; Aliee et al, 2012). However, in vivo support for these hypotheses in vertebrates is scarce, and the molecular and cellular mechanisms responsible for maintaining sharp boundaries during growth and morphogenesis are not fully explored.
Here, we investigate this question in the embryonic zebrafish hindbrain, which undergoes a segmentation process leading to the formation of seven morphological compartments called rhombomeres (r). These segments are transiently visible during development as a series of bulges in the neuroepithelium. The appearance of morphologically visible rhombomeres requires the segment-restricted expression of transcription factors. The expression in boundaries of these genes and some of their downstream targets is initially diffuse and jagged but eventually sharpens, and prefigures the positions of rhombomeric boundaries. Over the same period, morphological boundaries appear, followed by the expression of boundary-specific markers (for review, see Moens & Prince, 2002). Cell mixing is restricted across rhombomere boundaries (Fraser et al, 1990; Jimenez-Guri et al, 2010), and several works have stressed the importance of EphA/ephrin signaling in rhombomeric cell segregation. In zebrafish, two mechanisms have been proposed to operate in parallel: repulsive interactions between ephrinB-expressing and EphA4-expressing cells at rhombomeric boundaries (Xu et al, 1995, 1999), and adhesive interactions between cells of the same cohort (Cooke et al, 2005; Kemp et al, 2009). We wanted to determine whether multiple mechanisms were additionally required to achieve cell segregation, such as the interplay between adhesion and physical mechanisms.
We demonstrate that in the hindbrain of zebrafish embryos, once gene expression domains have achieved sharp boundaries due to cell sorting, actomyosin cytoskeletal components are enriched at interhombomeric boundaries. These actomyosin-based barriers stop cells from invading neighboring compartments especially upon cell division; when the formation of the actomyosin cable is compromised, rhombomeric cell mixing can occur. Interestingly, the EphA/ephrin signaling pathway plays an important role in cable stabilization because downregulation of EphA4a is sufficient for the disruption of actomyosin cables and cell intermingling. Moreover, when EphA4a is ectopically expressed in even-numbered rhombomeres, enrichment of actomyosin structures is observed. We propose that actomyosin cables at the interhombomeric boundaries act downstream of EphA/ephrin signaling to segregate cells from different rhombomeres and therefore prevent cell mixing.
Results
The refinement of molecular boundaries in the hindbrain is achieved by cell sorting
The segregation of rhombomeric cell populations involves the formation of a sharp interface between adjacent segments with different identity. The segregation of cells and the formation of well-defined boundaries can be visualized by observing gene expression within the rhombomeres. Initially, krx20 displays a jagged border of expression in r3 and r5 boundaries at 10 hpf (Fig 1B–D, see arrow in D), but becomes sharply defined at 14 hpf (Fig 1E and F; Cooke & Moens, 2002). Gene expression boundary sharpening can occur by a number of possible mechanisms: cells on the “wrong” side of a boundary can move across it by a cell adhesion/repulsion-based mechanism—cell sorting (Xu et al, 1999; Cooke et al, 2005; Kemp et al, 2009)—or they can switch their identity to that of their neighbors—cell plasticity (Schilling et al, 2001; Zhang et al, 2012); however, there are contradictory evidences to support one or the other mechanism applying. To study deeper how this molecular refinement is generated, we analyzed the behavior of cells with different rhombomeric identities during early embryonic development. We took advantage of two transgenic fish lines that express stable fluorescent protein reporters (mCherry or GFP) in r3 and r5 under the control of different krx20 regulatory elements (Mü4127 and Tg[elA:GFP]; Fig 1A; see Materials and Methods for exhaustive description).
Figure 1. Characterization of the zebrafish transgenic lines used in the study.

A Scheme of the inserted transgenes in the zebrafish lines.
B–P Spatiotemporal characterization of the expression of the transgene (kalTA4, gfp) in the different transgenic lines by in situ hybridization compared with endogenous expression of krx20 in wt embryos. Note that at early stages of embryonic development in all zebrafish strains, krx20, kalTA4, or gfp-positive cells are found surrounded by cells of different identity (D,I,N, for magnifications, see arrows); later on, clear and sharp gene expression domains are generated (E–F, J, O). (K, P) Double in situ hybridization with krx20 (green) and kalTA4 or gfp (red); note the krx20 expression domain overlaps with the expression of the reporter genes.
Q–S Spatial characterization of the reporter fluorescence protein expression in the two different transgenic lines injected with mRNA driving expression to the plasma membrane such as lyn:GFP or memb:mCherry. (R) Anti-GFP immunostaining of Tg[elA:GFP] embryos at 3 ss (11 hpf). Note that GFP-positive cells within the jagged boundary of r3 are surrounded by GFP-negative cells (see white arrows). Dorsal views with anterior to the left.
First, we characterized the two transgenic fish lines and revealed that in the Mü4127 line expression of kalTA4 mRNA spatially recapitulated endogenous krx20 expression: fuzzy boundaries of expression at 11 hpf (Fig 1G–I, see arrows in I) and sharp borders by 14 hpf (Fig 1J, K, Q), with a slight temporal delay in respect to krx20 mRNA (Distel et al, 2009). Analysis of gfp transcript expression and GFP protein in Tg[elA:GFP] fish line also showed first jagged activation in r3 (Fig 1L–N, R, see arrows), and then in r3 and r5, equivalent to krx20 expression, with complete straight gene expression boundaries by 14 hpf (Fig 1O, P, S). The krx20 expression domain overlapped with the expression of the reporter genes (Fig 1K, P).
Given that the two lines recapitulate the dynamics of krx20 expression, we used them to trace cells using two approaches: (i) in vivo imaging to follow single cells from different rhombomeres (Fig 2, Supplementary Movies S1–S3), using Tg[elA:GFP] embryos injected with H2B-mCherry mRNA, and (ii) fake cell tracing analysis in fixed embryos (Fig 3). We first focused on detailed cell trajectories in the vicinity of rhombomeric borders and followed in vivo single r5 or r6 cells by tracking cell nuclei. We observed that cells located on either side of the r5/r6 boundary did not change their molecular identity (Fig 2A–L, see blue dots for single cells, Supplementary Movies S1–S2). r5 GFP-positive cells were kept into r5 and maintained the GFP during the length of the movie (Fig 2A–F, see blue dot and white arrow for a given example; Supplementary Movie S1). r6 GFP-negative cells behaved in the same manner, namely r6 cells that incurred into the r5 territory were sorted out and never changed their molecular identity even after cell division (Fig 2G–L, see blue dots and white arrows; Supplementary Movie S2). These results show that cells of a given identity found within an environment of different identity are sorted out.
Figure 2. Tracking of single cells shows that rhombomeric cells are sorted out from territories with different rhombomeric identity. In vivo imaging of Tg[elA: GFP] embryos injected with H2B-mCherry mRNA at 4- to 8-cell stage.

A–L Time-lapse of an embryo from 12 hpf onwards where we tracked: (A–F) a single GFP-positive cell from r5 (see blue dot pointed with white arrow); (G–L) a single GFP-negative cell from r6 that divides into two GFP-negative cells (see blue dots pointed with white arrows). Single confocal stacks. See Supplementary Movies S1 and S2 for original data.
M–R Time-lapse of an embryo at 11 hpf where several single cell trajectories within r3–r6 were back-tracked. Merge of the maximal projections of the green and red channels, displaying in green the emergence of r3 first and later r5 and in red all labeled cell nuclei.
M'–R' Green channel displayed in white, to observe the appearance of r3 first and then r5, and the position of all tracked cells with colored dots. Light-blue dots correspond to r4 cells, yellow dots to r5 cells, and green dots to r6 cells. See Supplementary Movie S3 for original data. Note that cells at the boundaries that at the last time point are segregated were intermingled at the beginning of the movie. Dorsal views with anterior to the left.
Figure 3. Cell sorting is the main cellular mechanism involved in molecular boundary refinement.

A–I Fluorescent krx20 in situ hybridization (red) followed by anti-GFP immunostaining (green) to detect the expression of the reporter gene under the control of krx20 in the different transgenic zebrafish lines: (A–C) Tg[elA:GFP] and (D–F) double transgenic Mü4127 4xKaloop embryos, which express GFP in r3 and r5; (G–I) Tg[elA:GFP] embryos injected with MO-EphA4a. Note that in all cases cells co-express krx20 (red) and GFP (green). Even upon disruption of cell sorting after EphA4a-morpholino injection, when a given cell is found isolated, it expresses either both markers (see white arrow heads) or none (see white arrows). All images are dorsal views with anterior to the left.
J, K Quantification of cells expressing krx20 and GFP in the vicinity of all rhombomeric boundaries. Green bars: non-injected Tg[elA:GFP] embryos; dashed bars: Tg[elA:GFP] embryos injected with MO-EphA4a; gray bars: Tg[elA:GFP] embryos injected with MO-CTRL.
To explore the behavior of groups of cells in adjacent territories, we followed several individual cells by time-lapse analysis for 5 h (from 11 to 16 hpf). Single red nuclei of GFP-positive and GFP-negative cells mainly located in the r3–r6 region, and at different positions along the rhombomeres (close/far to the boundary) were manually back-tracked (Fig 2M–R, M'–R'; n = 43). Thus, cells located at the end of the movie in given positions of the hindbrain were traced back to their original position at the beginning of the movie. As shown in Fig 2M–R' and Supplementary Movie S3, analysis of several individual cell trajectories indicated that cells at the beginning of the analysis (11 hpf) near their future position but somehow intermingled (Fig 2M'–O'; see mixed blue, yellow, and green dots) were sorted out from the distinct molecular identity neighboring territory by the end of the analysis (Fig 2P'–R'; see segregated blue, yellow, and green dots). In Supplementary Movie S3, it can be observed that cells do not migrate long distances, but they mainly intermingle. Thus, cells that are early located in the fuzzy boundary region end up segregated along the sharp boundary of gene expression.
These results support cell sorting as the mechanism operating in the refinement of molecular rhombomeric boundaries in zebrafish, independently of the identity of the cell. However, to fully support this hypothesis, we did a fake cell tracing analysis in the transgenic zebrafish lines Tg[elA:GFP] and Mü4127 (Fig 3). The rationale of the experiment was that cells expressing krx20 will switch on the reporter gene mCherry/gfp and then mCherry/GFP proteins will be synthesized. Since fluorescent proteins are more stable than krx20 mRNA, we will be able to trace cells that once activated krx20 by the expression of the fluorescent reporter even at a stage when krx20 gene has already been switched off. If cell plasticity was the cellular mechanism operating, we would find ectopic fluorescent cells in r2, r4, or r6 that no longer expressed krx20 mRNA at late developmental stages when molecular boundaries were already refined (18 hpf; Fig 1). On the other hand, if cell sorting was the main mechanism accounting for the sharpening of gene expression, we should not expect any ectopic fluorescent cells, since krx20 cells located in the “wrong” side (r2, r4, and r6) would segregate to the “right” side (r3 and r5). Following this hypothesis, we performed fluorescent in situ hybridization for krx20 combined with antibody staining to detect the reporter fluorescent protein (Fig 3A–F). When the expression of krx20 was analyzed in Tg[elA:GFP] embryos, no ectopic krx20-positive cells were found in adjacent rhombomeres (Fig 3A). Moreover, in these same embryos, no ectopic GFP-positive cells were observed (Fig 3B). Accordingly, most of cells expressing GFP also expressed krx20 mRNA (Fig 3C, J–K). To follow the derivatives of the original kalTA4 cells for longer periods, we crossed the Mu4127 line with the 4xKaloop stable transgenic UAS effector strain driving GFP expression (see Materials and Methods), which allows KalTA4-mediated self-maintenance of cell labeling, and same results were obtained (Fig 1D–F). To quantify this, we counted the number of cells close to boundary regions that expressed both krx20 and GFP, and reconfirm that over 95% of the cells in any of the rhombomeric boundaries shared both markers (Fig 3J and K). Since we observed jagged expression of kalTA4 and gfp/GFP at early developmental stages (see arrows in Fig 1D, I, N, R), these results strongly suggest that cell sorting plays a major role in the sharpening of krx20 expression. However, to unveil any possible cell plasticity events taking place but masked by the strength of the sorting mechanism, we knocked down EphA4a, which is expressed in r3 and r5 and plays a known role in cell sorting (Xu et al, 1999). When EphA4a function was downregulated, boundaries were more jagged at later stages than in control embryos but all GFP-positive cells still expressed krx20 (Fig 3G–I, see white arrowhead pointing to an isolated cell expressing both markers). Cells not expressing krx20 did not have any GFP either (Fig 3G–I, see white arrows). No changes were detected when different rhombomeric boundaries were analyzed (Fig 3J and K), pointing to cell sorting as the sharpening mechanism in all hindbrain boundaries independent of the cell position along the antero-posterior (AP) axis.
Presence of an actomyosin cable in the interhombomeric boundaries
The border of expression of transcription factors prefigures the position of the morphological rhombomeric boundaries. As shown above, once gene expression domains achieve sharp boundaries due to cell sorting, morphological boundaries are visible as shallow indentations on the outside of the neural tube and cell mixing is restricted between rhombomeres. In zebrafish, hindbrain morphological boundaries are visible around 15 hpf (Supplementary Fig S4; Maves et al, 2002). From this stage onwards, cells with different rhombomeric identities do not mix. We performed live imaging in the proliferating tissue and looked at cell behaviors upon cell division close to the boundaries. We found that interhombomeric boundaries could be transiently challenged by cell division, since some cells incurred into the neighboring compartment while dividing (Fig 4A–E, B'–E', see red cell indicated with white arrow heads, n = 7; see as well Supplementary Movie S5). Interestingly, when a dividing cell rounded up and transiently invaded the adjacent compartment, it was pushed back to the original rhombomere (Fig 4B–E), suggesting that there was an elastic barrier at boundary interfaces. Thus, we wanted to address how cell segregation is physically restricted during growth and morphogenesis.
Figure 4. Actomyosin cables are present at the interrhombomeric boundaries.

A–E' Dorsal views of time-lapse stacks of rhombomeres 3 (red) and 4 of Tg[βactin:HRAS-GFP]/Mü4127 embryos from 21 hpf onwards. (B–E′) Inserts of the region framed in (A). Note that a cell upon division challenges the boundary (see white arrow head). Anterior is to the top. See Supplementary Movie S5 for the original data.
F–O Presence of F-actin and myosin II in the hindbrain. (H,J,L) Dorsal views of Tg[utrophin:GFP] embryos from 14 to 18 hpf. (I,K,M) Sagittal-optical sections of same embryos obtained as maximal intensity projections of the XZ apical planes depicted in (H,J,L) within the orange frame. See scheme in (F–G) for further clarity and Supplementary Fig S7A for more exhaustive explanations. Arrows point to the enrichment of F-actin. Note that the enrichment of F-actin structures can be observed from 15 hpf onwards, once the morphological rhombomeric bulges are visible (Supplementary Fig S4). (N–N′) Sagittal-optical views obtained as in (G) of double transgenic Tg[lifeactin:GFP]/Tg[myoII:mCherry] embryos showing that interhombomeric cables are formed by F-actin and myosin II (see arrows). Myosin II can be seen in red (N), and its merge with F-actin in yellow (N′). (O) Sagittal-optical view from double transgenic Tg[myoII:GFP]/Mü4127 embryos where myosin II cables are located in the interhombomeric boundaries (see arrows).
P–P′′′ Sagittal section of Tg[myoII:mCherry] embryos immunostained for anti-EphA4. (P–P′) Merge of anti-EphA4 staining (green) and myosin II (red); (P′–P′′′) are inserts from the region framed in (P). (P′′) displays only the EphA4 staining (the border of expression is outlined), and (P′′′) the actomyosin cable position is compared with the EphA4-expression border (white line). Anterior is always to the left.
Several mechanisms have been proposed for keeping cells segregated, mainly differential cell adhesion and also extracellular matrix fences (for review, see Batlle & Wilkinson, 2012). We investigated the role of mechanical barriers in maintaining distinct rhombomeric cells segregated, exploring two possible mechanisms: a barrier made of extracellular matrix deposition such as the embryonic intersomitic boundaries in zebrafish (Jülich et al, 2009), and a barrier based on actomyosin fibers as previously described in Drosophila (Major & Irvine, 2005, 2006; Monier et al, 2010; Becam et al, 2011; Aliee et al, 2012). First, we investigated whether there was any contribution of fibronectin (FN) matrix deposition in the interhombomeric boundaries by analyzing the presence of FN matrix assembly between rhombomeres. When embryos at 18 hpf were immunostained with anti-FN, no FN matrix deposition was observed in the hindbrain boundaries (Supplementary Fig S6A) although a clear staining was visible at the somites interface (Supplementary Fig S6B). Comparable results were obtained when visualizing integrin clustering in rhombomeric boundaries by the injection of embryos with mRNA of the α5 integrin subunit (Supplementary Fig S6C–E), a FN receptor that clusters upon activation (Jülich et al, 2009). Our results suggest that fibronectin fences do not play a major role in keeping rhombomeric cells apart.
Next, we explored the presence of actomyosin structures in the hindbrain at the time morphological bulges appeared. For this purpose, we used the transgenic lines Tg[lifeactin:GFP] and Tg[utrophin:GFP] that allow the visualization of F-actin, and Tg[myoII:mCherry/GFP], which let us visualize myosin II when bound to actin filaments (Behrndt et al, 2012; Maître et al, 2012). Since actomyosin cables have been reported to be at the apical side of the cells, we did analyze the presence of actin filaments in the hindbrain observing the apical side of the rhombomeric cells, which is located close to the midline (see scheme in Fig 4F and G; G displays a view of the apical stacks contained within the orange frame in F). For this, we took confocal images of embryos in dorsal views, re-constructed sagittal-view images, and did maximal intensity projections of only the most apical stacks (see Materials and Methods, and Supplementary Fig S7A). Indeed, an enrichment of actin cable-like structures was observed from 15 hpf, coinciding with the stage when morphological boundaries are already visible (Fig 4J–M). These cables were not detected earlier (Fig 4H and I) and were visible at least until 24 hpf (Fig 4J–M; data not shown). To demonstrate that these cables were formed by F-actin and myosin II, we sought the presence of actomyosin fibers by crossing Tg[lifeactin:GFP] with Tg[myoII:mCherry] and showed that rhombomeric cables contained both elements of the actomyosin structure (Fig 4N–N'). Finally, we demonstrated that cables were specifically located at the interhombomeric boundaries, coinciding with the border of mCherry expression as a landmark of r3 and r5 in Mü4127/Tg[myoII:GFP] embryos (Fig 4O). Next, we investigated in which rhombomere the cable was located by staining Tg[myoII:mCherry] embryos with anti-EphA4a. The EphA4 staining colocalized with the actomyosin cables in r3 and r5 (Fig 4P–P'''); however, since membranes are in close apposition, we cannot completely exclude the presence of the cable in even-numbered rhombomeres.
These data demonstrate the local enrichment of barrier-like elements such as F-actin and myosin II in hindbrain boundaries, as reported previously in Drosophila at the parasegmental boundaries in the embryonic epidermis (Monier et al, 2010) and boundaries on different larval imaginal disks (Major & Irvine, 2005, 2006; Landsberg et al, 2009; Becam et al, 2011; Curt et al, 2013). These results argue that actomyosin cables could be major players for restricting intermingling of different rhombomeric cells.
Actomyosin barriers sort cells at rhombomeric boundaries
To know whether actomyosin cables were effectors of boundary formation, it was important to determine their ability for restricting cell mixing. Therefore, to test whether actomyosin cables create a barrier, we disrupted them by inhibiting myosin II function using two different drugs: (i) Blebbistatin, which inhibits myosin II by blocking the myosin heads in a complex with low actin affinity (Kovács et al, 2004), and (ii) Rockout, an ATP-competitive inhibitor that specifically blocks Rho kinase activity and therefore inhibits MRLC (non-muscle myosin II regulatory light chain) by preventing its phosphorylation (Ernst et al, 2012). When double transgenic Mü4127/Tg[utrophin:GFP] embryos were treated either with Blebbistatin or Rockout, the actomyosin cables in the apical side of the cells were dismantled (compare Fig 5C and D, n = 12/18 for Blebbistatin; n = 14/16 for Rockout, data not shown) and r3 and/or r5 ectopic cells were found in adjacent rhombomeres (Fig 5H, n = 12/21 for Blebbistatin, see white arrows pointing at ectopic cells; n = 7/11 for Rockout, data not shown) when compared with control embryos (Fig 5G, n = 0/21). These results support the idea that actomyosin cables serve as mechanical barriers that restrict cell movement between rhombomeres during hindbrain segmentation. Interestingly, when myosin II activity was artificially enhanced exposing embryos to Calyculin A (a compound that overactivates myosin II inhibiting a myosin phosphatase; Filas et al, 2012), the morphological bulges were more evident (see the indentations in the neural tube in Fig 5E, n = 7/7). As expected, no cell mixing was observed (Fig 5I, n = 0/7), indicating that these actomyosin cables are indeed functional. We detected a clear correlation between the lack/disorganization of actomyosin cables and the extent of cell intermingling. These results support the hypothesis that vertebrates share a conserved mechanism based on actomyosin-dependent mechanical barriers to maintain straight interfaces between different cell populations, which helps to keep them segregated.
Figure 5. Actomyosin barriers prevent cell intermingling between rhombomeres.
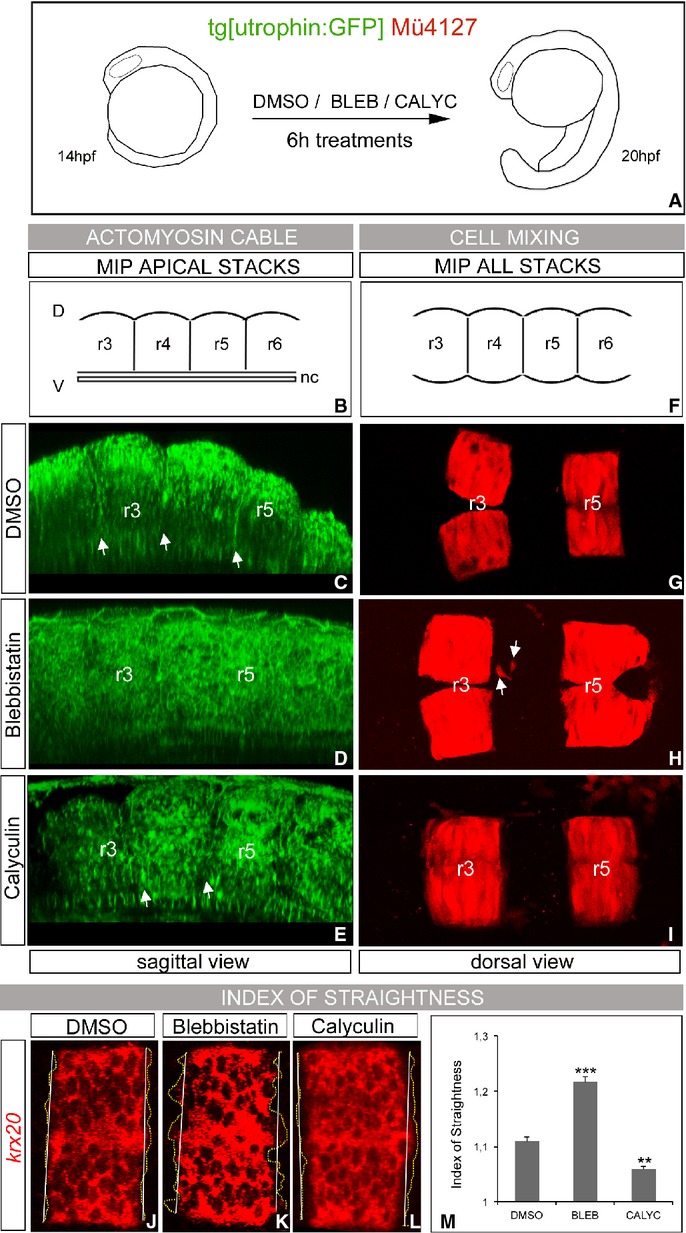
A–I Presence of actomyosin cables and effects in rhombomeric cell segregation. (A) Scheme depicting the experiment: double transgenic Tg[utrophin:GFP]/Mü4127 embryos at 14 hpf were treated with DMSO as control (C, G), or with different pharmacological agents that modulate the function of the actomyosin cable, such as (D, H) Blebbistatin and (E–I) Calyculin A. (C–E) show the presence/absence of the actomyosin cable in sagittal-optical sections obtained as maximal intensity projections of the XZ apical planes, and (G–I) display maximal intensity projections of dorsal views of r2–r6 region to observe the extent of cell mixing. Note that once the actomyosin cable is disrupted (D), ectopic r3/r5 cells are found in r4 (H, white arrows). Anterior is always to the left. (B,F) are schemes to help in the comprehension of the 3D-tissue organization.
J–M Analysis of the index of straightness (IS) within the krx20 expression border: (J–L) wt embryos were treated with same pharmacological agents as in previous experiment and assayed for krx20 in situ hybridization. Note that upon Blebbistatin treatment, the border of krx20-expression is very fuzzy compared with the sharp border displayed by DMSO- or Calyculin A-treated embryos. Anterior is to the left. (M) Quantification of the index of straightness (IS) upon different conditions. IS was measured according to Supplementary Fig S7B. ***P < 0.001, **P < 0.005.
Rhombomeric cells on both sides of boundaries are perfectly aligned and form a straight interface (Fig 5G, J). We quantified the degree upon inhibition of myosin II function (Fig 5K) using as a readout krx20-expression. We measured the index of straightness (IS, Fig 5M; Supplementary Fig S7B; Monier et al, 2010; see Materials and Methods) considering that the straighter the boundary, the closer will be IS to 1. Quantification of the IS confirmed that interhombomeric interfaces were straighter in control embryos (Fig 5J,M, IS = 1.1, n = 10) than in Blebbistatin-treated embryos (Fig 5K,M, IS = 1.2, n = 13), and even straighter boundaries were observed in embryos where myosin II activity was enhanced by the addition of Calyculin A (Fig 5L and M, IS = 1.05 n = 8). These results support our previous conclusion that mechanical barriers maintain the straightness of the boundaries.
To confirm that the disassembly of the actomyosin cable was the result of the direct targeting of our time-controlled pharmacological treatments, and not a side effect of the drugs activity on other cellular processes, we made sure the dismantling of cables was reversible. For this, we incubated Tg[myoII:mCherry] embryos with Rockout for four hours; then, the pharmacological agent was washed out and embryos let to develop for three additional hours. As shown in Fig 6B, actomyosin cables were already dismantled after 4 h of treatment (Fig 6B; n = 1/6), compared with DMSO-treated embryos (Fig 6A; n = 5/5). After washing out the drug, the cables were restored within 3 h (Fig 6C; n = 8/10). As shown previously, DMSO-treated control embryos displayed actomyosin cables at 21 hpf (n = 9/10, data not shown), and no cables were found in embryos treated with Rockout up to 21 hpf (n = 2/10; data not shown). As an additional control, given that actomyosin has been reported to be important for interkinetic nuclear migration (Spear & Erickson, 2012), a process that occurs within a time frame of a few hours (Leung et al, 2011), we wanted to ascertain that the observed phenotype—lack of interhombomeric cables—was not due to the overall changes in morphogenesis and, in particular, to specific basal-to-apical nuclear migration defects in rhombomeric cells. To investigate this issue, we closely analyzed the effects of myosin II inhibitors and activators in the interkinetic nuclear migration (INM) process upon our previous experimental conditions (Fig 6D–I). For this purpose, we sought the position and number of mitotic cells in the hindbrain (Fig 6D–H) and calculated the interkinetic nuclear migration ratio (apical nuclei/basal nuclei, Fig 6I, Supplementary Fig S8). No significant differences in the apical positioning of the mitotic cell nuclei of embryos treated with DMSO, Blebbistatin, Rockout, or Calyculin A (Fig 6D–G), or in the total number of pH3-positive cells, were observed (Fig 6H). Thus, our experimental conditions do not compromise the overall pattern of proliferation of the neural progenitors. On the other hand, when the INM ratio was assessed, for both Blebbistatin- and Calyculin A-treated embryos, we consistently observed more apical cell nuclei (Fig 6I). Nevertheless, given both antagonistic treatments interfere similarly with the basal-to-apical INM, but have opposed effects on cable formation, the dismantling of the cable could not be explained by a disruption in basal-to-apical INM of rhombomeric cell progenitors.
Figure 6. Drug treatments have specific effects on actomyosin cable assembly.
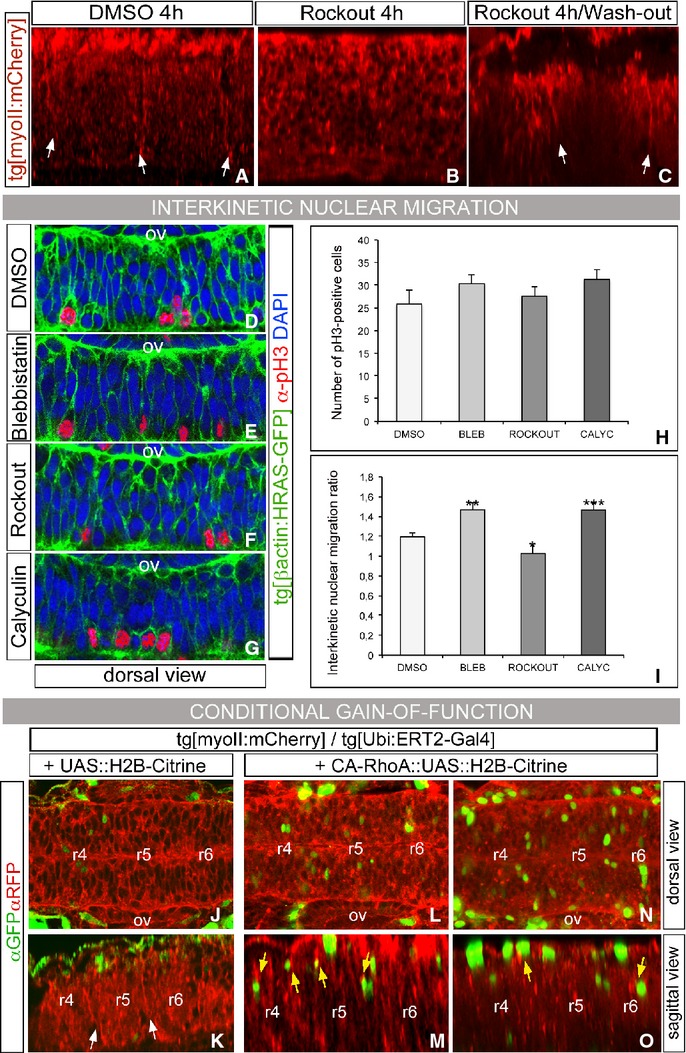
A–C Wash-out experiments: Tg[myoII:mCherry] embryos at 14 hpf were treated with DMSO (A) or Rockout for 4 h (B–C). Then, embryos were either analyzed (A–B) or let to develop for 3 h after washing out the Rockout (C). The presence of cables was revealed with anti-DsRed immunostaining. Sagittal-optical sections obtained as maximal intensity projections of the XZ apical planes with anterior to the left.
D–I Tg[βactin:HRAS-GFP] embryos upon different treatments were stained for anti-pH3 to visualize mitotic cells and counterstained with DAPI to singularize cell nuclei. Dorsal views of half-side rhombomeres (r4–r6 region), with anterior to the left and apical to the bottom. Images were analyzed according to Supplementary Fig S8 and the data obtained were plotted as: (H) number of cells undergoing mitosis in the hindbrain (pH3-positive cells), and (I) interkinetic nuclear migration ratio, which is calculated as the number of nuclei located in the apical side of the cells divided by the number of nuclei located in the basal side of the cells (DAPI-positive cells). ***P < 0.001 **P < 0.005.
J–O Conditional ectopic expression of H2B-Citrine or CA-RhoA:H2B-Citrine using the Ubi::ERT2-Gal4 system. Tg[myoII:mCherry]/Tg[Ubi:ERT2-Gal4] embryos were injected either with UAS::H2B-Citrine as control (J–K) or with CA-RhoA::UAS::H2B-Citrine (L–O) and incubated from 14 hpf with hydroxytamoxifen for 4 h to conditionally activate the transgene. The expression of the corresponding transgene can be followed in green, and myosin II structures in red after αGFP/αRFP immunostaining. Note the enrichment of myosin II structures upon CA-RhoA (M, O) induction in two different embryos. Ectopic CA-RhoA is sufficient to assemble myosin II structures in any rhombomere (see yellow arrows in r4, r5, and r6). (J, L, N) are dorsal views and (K, M, O) are sagittal-like views. Anterior is always to the left.
To assess the direct role of actomyosin contractile structures in boundary formation, we conditionally activated a CA-RhoA form, which is involved in the assembly of actomyosin structures, in Tg[myoII:mCherry] embryos at 14 hpf and the phenotype was scored at 18 hpf (Fig 6J–O). When ectopic CA-RhoA was expressed in the hindbrain, myosin II enrichment was obtained at sites of CA-RhoA induction (Fig 6L–O, see yellow arrows in sagittal views). Interestingly, this enrichment of myosin II structures could be observed in all rhombomeres, independent of their odd/even identity, and in non-apical locations (Fig 6M, O), suggesting that constitutive RhoA activity is able to recruit myosin II to these sites. Thus, we support that the cell sorting phenotypes observed before are specific to the role of rhombomeric actomyosin cables, and activation of RhoA is sufficient to induce the assembly of actomyosin structures.
Our next question was to address how these mechanical barriers were established. Remarkably, when cell sorting was compromised by EphA4a-MO injections, not only ectopic r3 and/or r5 cells were found outside their territory as expected (Fig 7C, n = 8/9, see white arrows; Cooke et al, 2005), but actomyosin cables were also highly disrupted (Fig 7G, n = 8/9) when compared with control embryos (Fig 7B,F, respectively). In line with this observation, IS in the boundaries of EphA4a morphants was increased when compared to control embryos (Fig 7M; CTRL-MO: IS = 1.1, n = 31; EphA4a-MO: IS = 1.25, n = 23), and accordingly, interfaces between rhombomeres were jagged (compare Fig 7J to Fig 5J as control, n = 10). To further support this, when EphA4a-morphants were treated with Blebbistatin the phenotype was enhanced (Fig 7D, H) and hindbrain boundaries were further jagged, hence displaying a higher IS (Fig 7K, M; IS = 1.3 n = 10); as expected, cell intermingling was observed for all cases (Fig 7D; n = 9/9). Interestingly, when actomyosin filament stability was enhanced treating EphA4a-morphants with Calyculin A, in many fewer cases r3/r5 cells were found ectopically (Fig 7E, n = 1/7) and actomyosin cables were partially rescued (Fig 7I, n = 5/9), which strongly suggests that the assembly of actomyosin cables is an event downstream of Eph/ephrin signaling. Accordingly, boundaries were straighter and consequently the IS was closer to 1 (Fig 7L and M; IS = 1.13 n = 8). Furthermore, when EphA4a was ectopically activated in r4 or r6 cells—where its ephrin ligands are expressed—enrichment of actomyosin fiber components was observed around the EphA4a-positive cells (Fig 8C and D, see yellow arrows). This phenotype was observed when ectopic cells were close to the apical side of the neural tube and only in even-numbered rhombomeres. When ectopic EphA4a cells were located in r3 or r5 territories—where there is no ephrin ligand—no ectopic enrichment of cable structures was found (Fig 8C and D, see white arrow head). As an additional control, no effects were observed when only H2B-Citrine was ectopically expressed (Fig 8A and B). Overall, these results provide evidences to suggest that Eph/ephrin is the main molecular pathway required for the assembly of the actomyosin cable and that mechanical barriers form downstream of Eph/ephrin signaling to help to segregate cells from different rhombomeres.
Figure 7. EphA/ephrin signaling is upstream of the generation of the actomyosin cables.
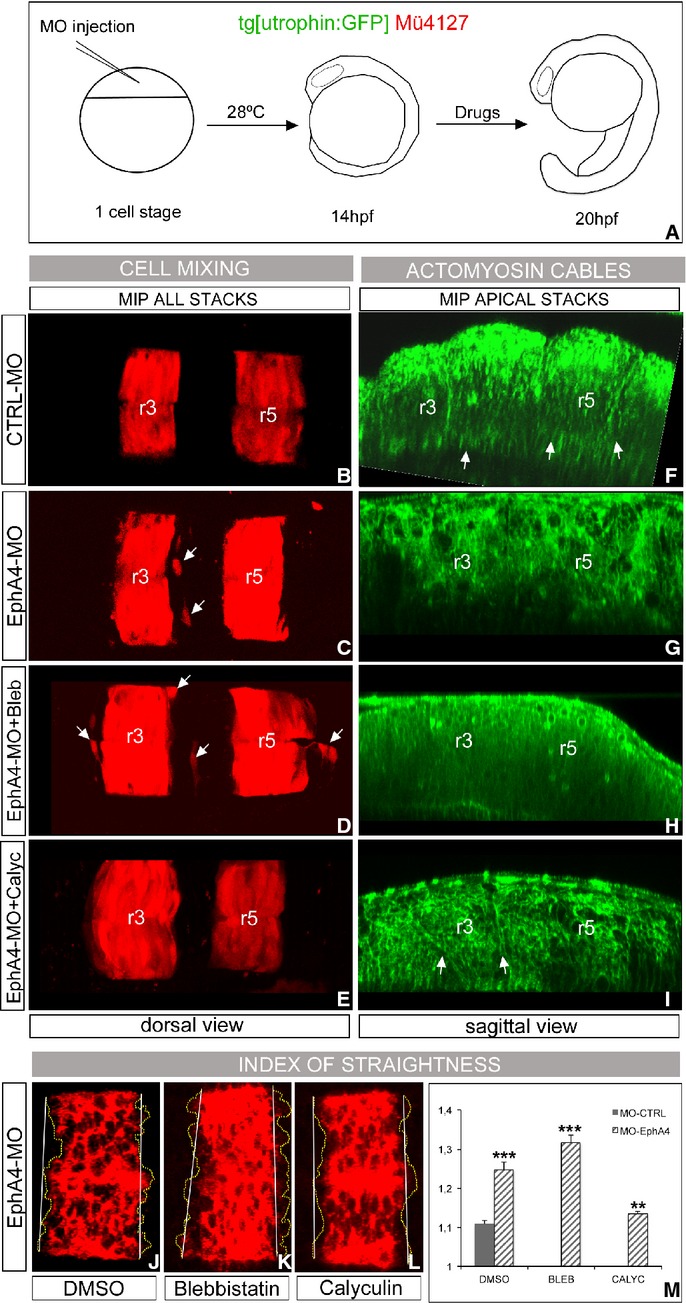
A–I Presence of actomyosin cables and effects in rhombomeric cell segregation. (A) Scheme of the functional experiment: double transgenic Mü4127/Tg[utrophin:GFP] embryos injected with CTRL-MO (B, F) or EphA4a-MO (C–I) at 1- to 2-cell stage, incubated from 14 hpf for 6 h with DMSO (B–G), Blebbistatin (D, H), or Calyculin A (E, I). After the treatment, the degree of cell mixing (B–E) and the presence of actomyosin cables (F–I, see arrows) were assessed. Embryos injected with CTRL-MO behave as control embryos (DMSO) in previous experiments. Note the cell mixing in embryos in which the cable was dismantled (white arrows, in C–D, G–H), and the partial rescue of the cable in EphA4a-MO embryos treated with Calyculin A (white arrows in I) resulting in no cell mixing (E). Dorsal views (B–E) and sagittal-optical views of apical stacks (F–I); in all cases anterior is to the left.
J–M Analysis of the index of straightness (IS) in wt embryos injected with EphA4a-MO at 1- to 2-cell stage, incubated from 14 hpf for 6 h with different pharmacological agents, and assayed for krx20 in situ hybridization. Note the jagged krx20 expression domains upon Blebbistatin treatment, and how the effect of EphA4a-MO is enhanced. IS is partially rescued in morphants upon Calyculin A treatment. Dorsal views with anterior to the left. (M) Quantification of the IS for embryos in experiment (J–L) (dashed bars), and comparison with control embryos (solid bar). ***P < 0.001, **P < 0.005.
Figure 8. Conditional activation of EphA/ephrin signaling can induce ectopic enrichment of cable structures.
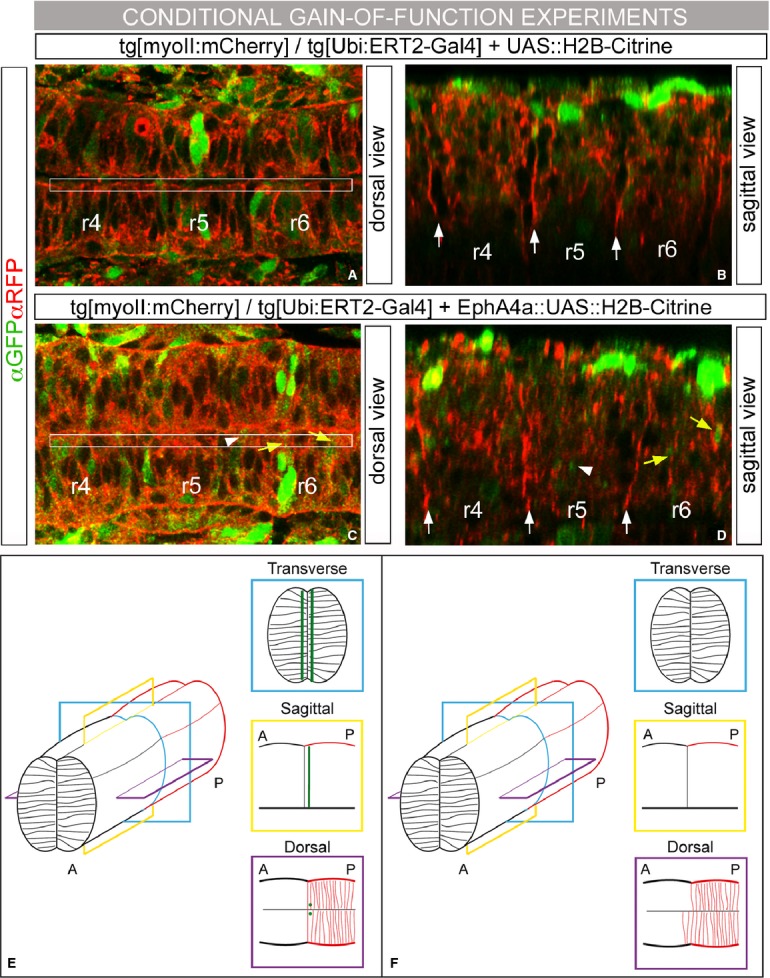
A–D Conditional ectopic expression of H2B-Citrine or EphA4a:H2B-Citrine using the Ubi::ERT2-Gal4 system. Tg[myoII:mCherry]/Tg[Ubi:ERT2-Gal4] embryos were injected either with UAS::H2B-Citrine as control (A–B) or with EphA4a::UAS::H2B-Citrine (C–D), and incubated from 14 hpf with hydroxytamoxifen for 4 h to conditionally activate the transgene. The expression of the corresponding transgene can be followed in green, and myosin II structures in red after aGFP/aRFP immunostaining. (A, C) are dorsal views and (B, D) sagittal-like views of the region framed in (A) and (C) of the same embryo with anterior to the left.
E, F Model for the requirement of actomyosin cables in the interhombomeric boundaries to keep distinct rhombomeric cell populations segregated. Schematic 3D-representation of the hindbrain territory depicting two adjacent rhombomeres. Three different orthogonal views are taken from this scheme: transverse (blue), sagittal (yellow), and dorsal (purple). Actomyosin cables are represented as green lines in transverse and sagittal views and as green dots in the dorsal view. To help clarity, in the dorsal view cells are represented only for the posterior rhombomere (red cells). (E) DMSO-, CRTL-MO-, or Calyculin A-treated embryos. Note the sharp boundary in the dorsal view. (F) Blebbistatin-, Rockout- and EphA4a-MO-treated embryos. Actomyosin cables are dismantled and cells from the posterior compartment cross the boundary to the anterior compartment. The AP axis is indicated in the diagram.
Discussion
We demonstrate by different approaches that cell sorting is the major mechanism operating in the sharpening of gene expression in rhombomeric boundaries, independently of the cell identity and the position along the AP axis. A recent report suggested that an attenuation mechanism relying on intracellular noise induces cells to switch their identity during r4/r5 boundary sharpening (Zhang et al, 2012). Their model proposes that noise in the retinoic acid (RA) morphogen gradient leads to rough gene expression boundaries initially, and that sharpening is driven by noise in the expression of hoxb1a and krx20, due to induced switching between expression of one gene and the other (Zhang et al, 2012). However, we observe only cell sorting events at the rhombomeric boundaries, either by: (i) analyzing single cell trajectories and behaviors (such as cell division), (ii) cell tracing using high stability of fluorescent proteins versus less stability of mRNA, or (iii) trying to unveil any possible cell plasticity events by downregulating cell sorting. In none of the cases, we could find evidences for cell fate switching. Nevertheless, this difference between our results and theirs might be explained by the fact that cells undergoing plasticity display very low krx20 expression, as pointed out in their work, which might not be detectable by our transgenic lines. Interestingly, another difference in our study is that all rhombomeric boundaries behave similarly, regardless of their AP position, meanwhile Zhang et al describe cell switching depending on RA fluctuations mainly in r4/r5. Since r4/r5 is the first rhombomeric boundary to appear (Maves et al, 2002; Lecaudey et al, 2004) and it is evolutionary conserved (Jimenez-Guri & Pujades, 2011), it is possible that r4/r5 is under such evolutionary pressure to be properly regulated that it might undergo dual refining mechanism based on both cell sorting and cell plasticity events, acting with different temporal specificities, since we do not see cells losing krx20 expression and changing identity in our temporal frame study. Interestingly, a recent report showed that the sharply delineated pattern of neural progenitor domains along the DV axis forms through sorting of specified cells (Xiong et al, 2013). They found that specified progenitors of different fates are spatially mixed and cell sorting rearranges them into sharply bordered domains. Maybe krx20 activation is the result of both interpretation of morphogen concentration and a gene regulatory network, which are spatially inaccurate, and a cell autonomous mechanism—cell sorting—is needed for refinement. Since the formation of spatially distinct domains faces noise at multiple scales, most likely multiple strategies are used to achieve robust patterning.
The key challenge to rhombomeric boundaries we have detected is cell division. Mitotic cells incurring into adjacent rhombomeres are pushed back to their rhombomere of origin, suggesting that an elastic barrier is involved in keeping different cell populations segregated. Here, we provide evidences of actomyosin cables at the interhombomeric boundaries and show that myosin II function is required for restricting cell intermingling. Experiments with pharmacological drugs that enhance or decrease the stability of the actomyosin complex in a very precise time window demonstrate that actomyosin cables are functional and can be modulated. Interestingly, it has been reported that myosin II is active in the hindbrain from 18 hpf and peaking at 21 hpf (Gutzman & Sive, 2010), a period when morphological rhombomeric bulges are visible. In addition, mutants for mypt1, a myosin II phosphatase mutant that promotes overactivation of myosin II, display similar defects to our experiments with Calyculin A: the neural tube is narrower with deep indentations at morphological boundaries. We have detected actomyosin cables in the apical side of the neuroepithelial cells, although a readout of myosin II activity, pMRLC (phosphorylated myosin regulatory light chain), was reported to localize in the basal as well as in the apical side of the neural tube during lumen formation (Gutzman & Sive, 2010). In line with this, when CA-RhoA is conditionally induced to get mosaic expression, we observe enrichment of myosin II structures in the hindbrain even in non-apical positions, supporting the hypothesis that indeed activation of RhoA is sufficient to assemble the myosin II available in any location in the rhombomeric cells. The wide cellular distribution of these molecules is probably due to the fact that myosin II and actin have pleiotropic functions: they are important for neuroepithelial cell shape, rhombomere morphogenesis, and ventricle expansion from 24 hpf onwards (Gutzman & Sive, 2010), and for actomyosin fiber assembly from 15 hpf as we show in our report. We demonstrate that actomyosin-based barriers are involved in segregating cells at rhombomeric boundaries and keep them apart, since embryos in which the actomyosin fiber has been dismantled display a certain degree of rhombomeric cell mixing (see Fig 8 for model). Our experiments reveal that some cells dividing close to the boundaries at the time we disrupt the cable are found in the neighboring territory because cannot be brought back to their rhombomere of origin. In vivo imaging experiments show that this might be a passive mechanism; cells do not migrate within the neural tube since they are in a tight epithelium and remain attached to both sides of the neural tube—basal and apical. The farther a cell is found from the territory of origin may depend on the number of divisions neighboring cells undergo, as observed when cell proliferation is abolished upon dismantling of the cable (Supplementary Fig S9). Although cell divisions are certainly a possibility, there are multiple other processes that might also be involved.
Previous models for cell sorting predicted that boundaries formed as a consequence of different rhombomeric cell types having distinct adhesive properties. They also brought up Eph/ephrin signaling as a key factor in maintaining sharp boundaries between adjacent odd (displaying Eph receptors) and even rhombomeres (expressing ephrin ligands) (for reviews, see Dahmann et al, 2011; Batlle & Wilkinson, 2012). Our data help to understand how the juxtaposition of different rhombomeric cells triggers actomyosin assembly interfaces along rhombomeric boundaries through Eph/ephrin signaling. We showed that actomyosin cables are colocalized apically with EphA4a. Upon abrogation of EphA/ephrin signaling, actomyosin cables are perturbed and cells mix with adjacent rhombomere neighbors. In addition, this phenotype is partially rescued by enhancing myosin II function, since those cables not completely dismantled in the EphA4a-morphants, upon specific conditions, can be partially restored to a wild-type phenotype. Moreover, conditional gain-of-function experiments in which EphA4a is ectopically expressed result in partial enrichment of actomyosin structures around the EphA4a ectopic cell only in even-numbered rhombomeres. Interestingly, when we activate the downstream effector CA-RhoA, enrichment of actomyosin structures is found in any rhombomere, independently of their odd/even identity. To this end, one possible molecular mechanism would be that Eph receptor upon ligand binding enhances Rock activation, which inhibits F-actin depolymerization and MLCP activity, favoring the accumulation of actomyosin cables as shown in a recent work where actomyosin-based contraction is responsible for specific sorting of neuronal auditory projections (Defourny et al, 2013). However, since membranes are in close apposition, we cannot completely confirm the absence of the cable in the even-numbered rhombomeres. The other option is that ephrin-reverse signaling is responsible for recruiting PDZ domain proteins involved in actomyosin assembly and therefore the key factor for assembling the mechanical barrier (Klein, 2012). Interestingly, it has been recently shown that ephrinB1 plays a key role in regulating the separation of embryonic germ layers, since differential interactions between Smurfs and ephrinB1 regulate the maintenance of tissue boundaries through the control of ephrinB protein levels (Hwang et al, 2013). Recent studies in Xenopus have involved EphB/ephrinB signaling in the control of embryonic germ layer separation, by regulating the cell detachment at the boundary through forward signaling across the boundary in both directions (Rohani et al, 2011). In addition, in the notochord boundary, EphB/ephrinB signaling-dependent myosin activity is responsible for the inhibition of cadherin clustering and ultimately for tissue separation (Fagotto et al, 2013). Whether similar mechanical dynamics control the hindbrain boundaries is an exciting idea to explore in future studies.
Overall, the evidences provided in this article strongly suggest that assembly of actomyosin fibers is downstream of EphA/ephrin signaling, and this is a crucial event to maintain rhombomere sharpening (see Fig 8 for model). Whether this mechanism acts in parallel or downstream to other known roles in cell adhesion/repulsion of EphA/ephrin signaling remains to be shown.
The picture that emerges from our results is the existence of a conserved strategy between vertebrates and Drosophila based on actomyosin-driven mechanical forces to sort cells at compartment boundaries. Another relevant aspect of our study, also related to EphA/ephrin being upstream of actomyosin cable formation, is that this sharpening mechanism might be a common strategy during the development to be used for other boundaries where this signaling pathway is involved, such as germ layers, gut, or somites. In the same line, it would be interesting to look for the presence, or absence, of these structures when the pathway is misregulated during cancer progression.
Materials and Methods
Zebrafish strains and maintenance
Zebrafish embryos were obtained by mating of adult fish by standard methods. All fish strains were maintained individually as inbred lines. All procedures used have been approved by the institutional animal care and use ethic committee (PRBB–IACUC) and implemented according to national rules and European regulations. Mü4127 is an enhancer trap line in which the trap cassette containing a modified version of Gal4 (KalT4) and mCherry (KalTA4-UAS-mCherry cassette) was inserted in the 1.5 Kb downstream of krx20 gene (Distel et al, 2009). 4xKaloop is a stable transgenic effector strain that carries a bicistronic 4xUAS effector construct driving GFP expression as a reporter followed by a peptide backbone breaking T2A sequence, which mediates stoichiometric expression of KalTA4. Once activated, this effector should continuously maintain its own expression by constantly providing the KalTA4 activator in a feedback loop (Distel et al, 2009). We used the crosses from Mü4127 with 4xKaloop to visualize the activity of the KalT4 in green due to the expression of GFP under its control. Tg[elA:GFP] line is a stable reporter line where chicken element A was cloned upstream of the gfp reporter in a modified pTol2 vector (Chomette et al, 2006; Stedman et al, 2009; Laballete et al, 2011). Tg[lifeactin:GFP] and Tg[utrophin:GFP] lines are reporters that allow the visualization of F-actin, and Tg[myoII:mCherry/GFP] visualizes myosin II (non-cardiac myosin) (Behrndt et al, 2012; Maître et al, 2012). Tg[βactin:HRAS-EGFP] homogenously labels cell membranes (Cooper et al, 2005). Tg[Ubi::ERT2-Gal4] is a broadly expressed inducible ERT2-Gal4 zebrafish line under the ubiquitin (Ubi) enhancer (Gerety et al, 2013).
Whole-mount in situ hybridization and immunostaining
Whole-mount in situ hybridization was adapted from Thisse et al (1993). Riboprobes were as follows: krx20 (Oxtoby & Jowett, 1993), kalTA4 (Distel et al, 2009), and gfp. The chromogenic and fluorescent in situ hybridizations were developed with NBT/BCIP and FastRed substrates, respectively. For double fluorescent in situ hybridization, DIG-labeled riboprobes for kalTA4 and gfp were developed with FastRed and FLUO-labeled krx20 with fluorescein-tyramide substrate (TSA system).
For immunostaining, embryos were blocked in 5% GS/PBT for 1 h at RT and incubated overnight at 4°C with primary antibody. Primary pAbs were the following: anti-DsRed (1:500, Clontech), anti-EphA4 (1:450; Irving et al, 1996), anti-FN (1:200, Sigma), anti-GFP (1:200, Torrey Pines), anti-pH3 (1:200, Upstate), and anti-RFP (1:500, Clontech). After extensive washings with PBST, embryos were incubated with secondary Ab conjugated with Alexa Fluor®488 or Alexa Fluor®555 (1:500, Invitrogen). Embryos were flat-mounted and imaged under a Leica DM6000B fluorescence microscope or SP5 confocal microscope with 20× or 40× objective.
Antisense morpholinos and mRNA injections
For morpholino knockdowns, embryos were injected at 1 cell/stage with translation-blocking morpholino oligomers (MOs) obtained from GeneTools, Inc. MOs were as follows: MO-EphA4a, 5′-AAC ACA AGC GCA GCC ATT GGT GTC-3′ (Cooke et al, 2005), p53-MO, 5′-GCG CCA TTG CTT TGC AAG AAT TG-3′ (Langheinrich et al, 2002).
For mRNA expression, capped H2B-mCherry (Olivier et al, 2010), itgα5:GFP (Jülich et al, 2009), and lyn:GFP/memb:mCherry mRNAs were synthesized with mMessage mMachine (Ambion). Embryos were injected at 1 cell/stage unless otherwise stated and developed until the desired stages.
Conditional overexpression
CA-RhoA construct (Fagotto et al, 2013) was cloned into the MCS of a custom dual UAS::H2B-Citrine vector, also called NU3 (Nikolaou et al, 2009). The vector expresses H2B-Citrine from one side of a 5xUAS sequence and our target cDNA from the opposite side. The plasmids described have a miniTOL2 backbone to facilitate genomic integration in zebrafish (Balciunas et al, 2006).
EphA4a::UAS::H2B-Citrine vector was created by cloning the CDS of EphA4a into the MCS of the NU3 vector. The CDS was obtained by RT-PCR from a 24 hpf zebrafish embryo cDNA library. Maps, plasmids, and additional information are available upon request.
Plasmids were injected together with Tol2 transposase mRNA at 1-cell stage into embryos from the offspring of Tg[Ubi::ERT2-Gal4] crossed with Tg[myoII:mCherry]. NU3 plasmid (UAS::H2B-Citrine) was injected as control. To activate the different UAS constructs, 14 hpf injected embryos were placed in fish water with 2 μM of 4-hydroxytamoxifen (H7947, Sigma). All embryos were fixed at 18–20 hpf to proceed for their staining.
Time-lapse movies
Cell tracking experiments
Anesthetized live embryos were embedded in 1% low melting point (LMP) agarose with the hindbrain positioned toward the glass bottom of the Petri dish in order to have a dorsal view with an inverted objective. For cell tracking experiments, and in order to have a mosaic expression, Tg[elA:GFP] embryos were injected with H2B-mCherry mRNA at 4- to 8-cell stage. Briefly, back-tracking of red nuclei of GFP+ and GFP- cells was performed in three independent experiments, and cells were tracked manually at different DV level using ImageJ software. Experimental parameters for Supplementary Movies S1 and S2 were: voxel dimension (nm): x 378.8, y 378.8, z 1510.6, time frame: 90 s; total time: 2 h 21 min; pinhole: 60.6 μm; zoom: 2; objective: 20x dry; NA: 0.70. Experimental parameters for Supplementary Movie S3 were the following: voxel dimension (nm): x 378.8, y 378.8, z 1510.6; time frame: 155 s; total time: 4 h 36 min; pinhole: 66.7 μm; zoom: 2; objective: 20x immersion; NA: 0.70. Videos were performed using SP5 Leica confocal system.
In vivo analysis of cell divisions in the rhombomeric boundaries
Anesthetized live double transgenic Mu4127/Tg[βactin:HRAS-EGFP] embryos for Fig 4 and Supplementary Movie S5 were embedded and mounted as previously described. Experimental parameters for the video were: voxel dimension (nm): x 303.0, y 303.0, z 1216.9; time frame: 423,1 s; total time: 3 h 58 min; pinhole: 60.8 μm; zoom: 2.5; objective: 20x immersion; NA: 0.70.
Assessment of cable-like structures
Live embryos from Tg[lifeactin:GFP], Tg[utrophin:GFP], and Tg[myoII:GFP/mCherry] lines were anesthetized with tricaine and mounted as described before. In some cases, cables were imaged in fixed embryos after immunostaining for the reporter protein, either flat-mounted or in sagittal cryostat sections.
For cable-structure analysis, 0.6-μm z stacks were acquired in dorsal view and re-sliced to generate YZ confocal cross-sections. Images were re-sliced in XZ, and finally, a maximal projection of the XZ sections corresponding to the apical side of cells in the neural tube was generated (Supplementary Fig S7A). We did not observe qualitative differences between live and fixed embryos.
Cryostat sectioning
Embryos were fixed in 4% PFA, cryoprotected in 15% sucrose, and embedded in 7.5% gelatin/15% sucrose. Blocks were frozen in 2-methylbutane (Sigma) to improve tissue preservation. 20-μm sections were done on a Leica CM 1510-1 cryostat.
Pharmacological treatments
We found very important to apply the treatments once the neural tube was already formed to avoid interfering with its early morphogenesis, but at a stage that we could still tackle the process of interest, the formation of rhombomeric bulges. In all experiments, embryos at 14 hpf were dechorionated and treated for 4–6 h at 28°C with: (i) myosin II inhibitors such as Blebbistatin (25 μM), or Rockout (50 nM); and (ii) Calyculin A (100 nM), an inhibitor of myosin phosphatase to enhance the contractility of actomyosin cables; (iii) Aphidicolin (150 μM) or Hydroxyurea (100 mM), which blocks cell cycle at S phase, (iv) Nocodazole (0.1 μM), which interferes with microtubules producing mitotic arrest; and (v) DMSO for control experiments. Afterward, embryos were either taken to the confocal microscope for in vivo analysis or fixed in 4% PFA for immunostaining or in situ hybridization.
For the wash-out experiments, we used Rockout because in our hands it dismantles actomyosin cables more effectively than Blebbistatin. Thus, Tg[myoII:mCherry] embryos were treated at 14 hpf with 50 nM Rockout for 4 h—once the cable has been disrupted— and were let into E3 medium to develop for 3 additional hours. As controls, 14 hpf embryos were treated with DMSO or Rockout for 4 or 7 h, before analysis.
Quantification of the index of straightness (IS)
The quantification of the index of straightness was based on the sharpness of the border of krx20 expression. Whole-mount in situ hybridization for krx20 was performed on 18 hpf fixed embryos from the same batch, after different experimental conditions: control embryos, CTRL-MO-, or EphA4a-MO-injected embryos treated with either DMSO, Blebbistatin, or Calyculin A. Confocal images were acquired in dorsal view of flat-mounted hindbrains covering the r3–r5 region with 1-μm z distance. Images were then reconstructed to generate YZ confocal cross-sections to properly orient the embryos along the DV axis, and finally, the same 5-μm DV portion in every embryo was selected and re-sliced back to XY to obtain dorsal views. These stacks were then projected into a single dorsal view image (Supplementary Fig S7B). Once images were obtained, we addressed the index of straightness (IS) of the krx20 expression border doing the following: longitudes of the krx20 expression border for r2/r3, r3/r4, r4/5, and r5/r6 boundaries were calculated with FIJI (yellow dotted line, α; Supplementary Fig S7B), and also the theoretical straight length of the krx20-expression border (white dotted line, β; Supplementary Fig S7B). The IS is the ratio between α and β. Since IS = 1 would represent a completely straight boundary, we plotted the values as a deviation from 1, representing a better indication of the deviation from straightness (Fig 5M, Fig 7M). In the plots, SEM was used and the significance of results was assessed using the two-tailed Student's t-test.
Quantification of the interkinetic nuclear migration (INM) ratio
Tg[βactin:HRAS-GFP] embryos at 18 hpf after different pharmacological treatments were immunostained with: (i) anti-pH3 to analyze the cells undergoing mitosis, (ii) anti-GFP to visualize the plasma membranes and therefore singularize the cells, and (iii) DAPI to position cell nuclei. Confocal image stacks with 1-μm z and identical zoom were taken in the hindbrain region extending from r2 to r6. Then, an identical XY frame covering half of the neural tube from apical to basal side of the neuroepithelial cells was selected for each embryo (Supplementary Fig S8A). Channels were split and green channel was subtracted from both blue channel and red channel to help to segment the cell nuclei (Supplementary Fig S8B–D). Finally, we divided our chosen frame in two halves, one apical and one basal, and counted the number of nuclei located in both sides (Supplementary Fig S8B'). To assess the interkinetic nuclear migration ratio, we divided the number of apical and basal nuclei. The total number of pH3-positive cells was used as readout of mitotic cells (Supplementary Fig S8D'). Results were plotted in Fig 6H and I, SEM was used, and the significance of the results was assessed using the two-tailed Student's t-test.
Acknowledgments
We are grateful to S Dyballa for her enormous help in imaging and developing ImageJ/FIJI analysis tools, M Linares for technical assistance and to M Milan and R Bradley for critical reading of the manuscript. We thank the people who kindly provided us transgenic fish lines and reagents, especially P Charnay, CP Heisenberg, G Koster, SA Holley, N Peyrieras, and DG Wilkinson. JT was a recipient of a postdoctoral Beatriu de Pinos fellowship (AGAUR, Generalitat de Catalunya). The work was funded by BFU2009-07010 and BFU2012-31994 (Spanish Ministry of Economy and Competitiveness, MINECO) to CP.
Author contributions
SC and JT contributed to the design, execution, and analysis of the experiments. CP contributed to the concept, design, and analysis of the experiments, provided funding, and wrote the manuscript.
Conflict of interest
The authors declare that they have no conflict of interest.
Supplementary information for this article is available online: http://emboj.embopress.org
References
- Aliee M, Röper JC, Landsberg KP, Pentzold C, Widmann TJ, Jülicher F, Dahmann C. Physical mechanisms shaping the Drosophila dorsoventral compartment boundary. Curr Biol. 2012;22:967–976. doi: 10.1016/j.cub.2012.03.070. [DOI] [PubMed] [Google Scholar]
- Balciunas D, Wangensteen KJ, Wilber A, Bell J, Geurts A, Sivasubbu S, Wang X, Hackett PB, Largaespada DA, McIvor RS, Ekker SC. Harnessing a high cargo-capacity transposon for genetic applications in vertebrates. PLoS Genet. 2006;2:e169. doi: 10.1371/journal.pgen.0020169. [DOI] [PMC free article] [PubMed] [Google Scholar]
- Batlle E, Wilkinson DG. Molecular mechanisms of cell segregation and boundary formation in development and tumorigenesis. Cold Spring Harb Perspect Biol. 2012;4:a008227. doi: 10.1101/cshperspect.a008227. [DOI] [PMC free article] [PubMed] [Google Scholar]
- Becam I, Rafel N, Hong X, Cohen SM, Milán M. Notch-mediated repression of bantam miRNA contributes to boundary formation in the Drosophila wing. Development. 2011;138:3781–3789. doi: 10.1242/dev.064774. [DOI] [PubMed] [Google Scholar]
- Behrndt M, Salbreux G, Campinho P, Hauschild R, Oswald F, Roensch J, Grill SW, Heisenberg CP. Forces driving epithelial spreading in zebrafish gastrulation. Science. 2012;338:257–260. doi: 10.1126/science.1224143. [DOI] [PubMed] [Google Scholar]
- Chomette D, Frain M, Cereghini S, Charnay P, Ghislain J. Krox20 Hindbrain Cis-Regulatory Landscape: interplay between Multiple Long-Range Initiation and Autoregulatory Elements. Development. 2006;133:1253–1262. doi: 10.1242/dev.02289. [DOI] [PubMed] [Google Scholar]
- Cooke JB, Moens CB. Boundary formation in the hindbrain: Eph only it were simple. Trends Neurosci. 2002;25:260–267. doi: 10.1016/s0166-2236(02)02134-3. [DOI] [PubMed] [Google Scholar]
- Cooke JE, Kemp HA, Moens CB. EphA4 is required for cell adhesion and rhombomere-boundary formation in the zebrafish. Curr Biol. 2005;15:536–542. doi: 10.1016/j.cub.2005.02.019. [DOI] [PubMed] [Google Scholar]
- Cooper MS, Szeto DP, Sommers-Herivel G, Topczewski J, Solnica-Krezel L, Kang HC, Johnson I, Kimelman D. Visualizing morphogenesis in transgenic zebrafish embryos using BODIPY TR methyl ester dye as a vital counterstain for GFP. Dev Dyn. 2005;232:359–368. doi: 10.1002/dvdy.20252. [DOI] [PubMed] [Google Scholar]
- Curt JR, de Navas LF, Sánchez-Herrero E. Differential activity of Drosophila hox genes induces Myosin expression and can maintain compartment boundaries. PLoS ONE. 2013;8:e57159. doi: 10.1371/journal.pone.0057159. [DOI] [PMC free article] [PubMed] [Google Scholar]
- Dahmann C, Oates AC, Brand M. Boundary formation and maintenance in tissue development. Nat Rev Genet. 2011;12:43–55. doi: 10.1038/nrg2902. [DOI] [PubMed] [Google Scholar]
- Defourny J, Poirrier AL, Lallemend F, Mateo Sánchez S, Neef J, Vanderhaeghen P, Soriano E, Peuckert C, Kullander K, Fritzsch B, Nguyen L, Moonen G, Moser T, Malgrange B. Ephrin-A5/EphA4 signalling controls specific afferent targeting to cochlear hair cells. Nat Commun. 2013;4:1438. doi: 10.1038/ncomms2445. [DOI] [PubMed] [Google Scholar]
- Distel M, Wullimann MF, Köster RW. Optimized Gal4 genetics for permanent gene expression mapping in zebrafish. Proc Natl Acad Sci. 2009;106:13365–13370. doi: 10.1073/pnas.0903060106. [DOI] [PMC free article] [PubMed] [Google Scholar]
- Ernst S, Liu K, Agarwala S, Moratscheck N, Avci ME, Dalle Nogare D, Chitnis AB, Ronneberger O, Lecaudey V. Shroom3 is required downstream of FGF signalling to mediate proneuromast assembly in zebrafish. Development. 2012;139:4571–4581. doi: 10.1242/dev.083253. [DOI] [PubMed] [Google Scholar]
- Fagotto F, Rohani N, Touret AS, Li R. A molecular base for cell sorting at embryonic boundaries: contact inhibition of cadherin adhesion by ephrin/eph-dependent contractility. Dev Cell. 2013;27:1–16. doi: 10.1016/j.devcel.2013.09.004. [DOI] [PubMed] [Google Scholar]
- Filas BA, Oltean A, Majidi S, Bayly PV, Beebe DC, Taber LA. Regional differences in actomyosin contraction shape the primary vesicles in the embryonic chicken brain. Phys Biol. 2012;9:066007. doi: 10.1088/1478-3975/9/6/066007. [DOI] [PMC free article] [PubMed] [Google Scholar]
- Fraser S, Keynes R, Lumsden A. Segmentation in the chick embryo hindbrain is defined by cell lineage restrictions. Nature. 1990;344:431–435. doi: 10.1038/344431a0. [DOI] [PubMed] [Google Scholar]
- Gerety SS, Breau MA, Sasai N, Xu Q, Briscoe J, Wilkinson DG. An inducible transgene expression system for zebrafish and chick. Development. 2013;140:2235–2243. doi: 10.1242/dev.091520. [DOI] [PMC free article] [PubMed] [Google Scholar]
- Gutzman JH, Sive H. Epithelial relaxation mediated by the myosin phosphatase regulator Mypt1 is required for brain ventricle lumen expansion and hindbrain morphogenesis. Development. 2010;137:795–804. doi: 10.1242/dev.042705. [DOI] [PMC free article] [PubMed] [Google Scholar]
- Hwang YS, Lee HS, Kamata T, Mood K, Cho HJ, Winterbottom E, Ji YJ, Singh A, Daar IO. The Smurf ubiquitin ligases regulate tissue separation via antagonistic interactions with ephrinB1. Genes Dev. 2013;27:491–503. doi: 10.1101/gad.208355.112. [DOI] [PMC free article] [PubMed] [Google Scholar]
- Irving C, Nieto A, DasGupta R, Charnay P, Wilkinson DG. Progressive spatial restriction of Sek-1 and Krox-20 gene expression during hindbrain segmentation. Dev Biol. 1996;173:26–38. doi: 10.1006/dbio.1996.0004. [DOI] [PubMed] [Google Scholar]
- Jimenez-Guri E, Pujades C. An ancient mechanism of hindbrain patterning has been conserved in vertebrate evolution. Evol Dev. 2011;13:38–46. doi: 10.1111/j.1525-142X.2010.00454.x. [DOI] [PubMed] [Google Scholar]
- Jimenez-Guri E, Udina F, Colas JF, Sharpe J, Padron-Barthe L, Torres M, Pujades C. Clonal analysis in mice underlines the importance of rhombomeric boundaries in cell movement restriction during hindbrain segmentation. PLoS ONE. 2010;5:e10112. doi: 10.1371/journal.pone.0010112. [DOI] [PMC free article] [PubMed] [Google Scholar]
- Jülich D, Mould AP, Koper E, Holley SA. Control of extracellular matrix assembly along tissue boundaries via Integrin and EphA/Ephrin signaling. Development. 2009;136:2913–2921. doi: 10.1242/dev.038935. [DOI] [PubMed] [Google Scholar]
- Kemp HA, Cooke JE, Moens CB. EphA4 and EfnB2a maintain rhombomere coherence by independently regulating intercalation of progenitor cells in the zebrafish neural keel. Dev Biol. 2009;327:313–326. doi: 10.1016/j.ydbio.2008.12.010. [DOI] [PMC free article] [PubMed] [Google Scholar]
- Klein R. EphA/Ephrin signaling during development. Development. 2012;139:4105–4109. doi: 10.1242/dev.074997. [DOI] [PubMed] [Google Scholar]
- Kovács M, Tóth J, Nyitray L, Sellers JR. Two-headed binding of the unphosphorylated nonmuscle heavy meromyosin ADP complex to actin. Biochemistry. 2004;43:4219–4226. doi: 10.1021/bi036007l. [DOI] [PubMed] [Google Scholar]
- Laballete C, Bouchoucha YX, Wassef MA, Gonagl PA, Le Men J, Becjer T, Gilardi-Hebenstreit P, Charnay P. Hindbrain patterning requires fine-tuning of early krox20 transcription by Sprouty 4. Development. 2011;138:317–326. doi: 10.1242/dev.057299. [DOI] [PubMed] [Google Scholar]
- Landsberg KP, Farhadifar R, Ranft J, Umetsu D, Widmann TJ, Bittig T, Said A, Jülicher F, Dahmann C. Increased cell bond tension governs cell sorting at the Drosophila anteroposterior compartment boundary. Curr Biol. 2009;19:1950–1955. doi: 10.1016/j.cub.2009.10.021. [DOI] [PubMed] [Google Scholar]
- Langheinrich U, Hennen E, Stott G, Vacun G. Zebrafish as a model organism for the identification and characterization of drugs and genes affecting p53 signaling. Curr Biol. 2002;12:2023–2028. doi: 10.1016/s0960-9822(02)01319-2. [DOI] [PubMed] [Google Scholar]
- Lecaudey V, Anselme I, Rosa F, Schneider-Maunoury S. The zebrafish iroquois gene iro7 positions the r4/r5 boundary and controls neurogenesis in the rostral hindbrain. Development. 2004;131:3121–3131. doi: 10.1242/dev.01190. [DOI] [PubMed] [Google Scholar]
- Leung L, Klopper AV, Grill SW, Harris WA, Norden C. Apical migration of nuclei during G2 is a prerequisite for all nuclear motion in zebrafish neuroepithelia. Development. 2011;138:5003–5013. doi: 10.1242/dev.071522. [DOI] [PMC free article] [PubMed] [Google Scholar]
- Maître JL, Berthoumieux H, Krens SF, Salbreux G, Jülicher F, Paluch E, Heisenberg CP. Adhesion functions in cell sorting by mechanically coupling the cortices of adhering cells. Science. 2012;338:253–256. doi: 10.1126/science.1225399. [DOI] [PubMed] [Google Scholar]
- Major RJ, Irvine KD. Influence of Notch on dorsoventral compartmentalization and actin organization in the Drosophila wing. Development. 2005;132:3823–3833. doi: 10.1242/dev.01957. [DOI] [PubMed] [Google Scholar]
- Major RJ, Irvine KD. Localization and requirement for Myosin II at the DV compartment boundary of the Drosophila wing. Dev Dyn. 2006;235:3051–3058. doi: 10.1002/dvdy.20966. [DOI] [PubMed] [Google Scholar]
- Maves L, Jackman W, Kimmel CB. FGF3 and FGF8 mediate a rhombomere 4 signaling activity in the zebrafish hindbrain. Development. 2002;129:3825–3837. doi: 10.1242/dev.129.16.3825. [DOI] [PubMed] [Google Scholar]
- Moens CB, Prince VE. Constructing the hindbrain: insights from the zebrafish. Dev Dyn. 2002;224:1–17. doi: 10.1002/dvdy.10086. [DOI] [PubMed] [Google Scholar]
- Monier B, Pélissier-Monier A, Brand AH, Sanson B. An actomyosin-based barrier inhibits cell mixing at compartmental boundaries in Drosophila embryos. Nat Cell Biol. 2010;12:60–65. doi: 10.1038/ncb2005. [DOI] [PMC free article] [PubMed] [Google Scholar]
- Nikolaou N, Watanabe-Asaka T, Gerety S, Distel M, Köster RW, Wilkinson DG. Lunatic fringe promotes the lateral inhibition of neurogenesis. Development. 2009;136:2523–2533. doi: 10.1242/dev.034736. [DOI] [PMC free article] [PubMed] [Google Scholar]
- Olivier N, Luengo-Oroz MA, Duloquin L, Faure E, Savy T, Veilleux I, Solinas X, Debarre D, Bourgine P, Santos A, et al. Cell lineage reconstruction of early zebrafish embryos using label-free nonlinear microscopy. Science. 2010;329:967–971. doi: 10.1126/science.1189428. [DOI] [PubMed] [Google Scholar]
- Oxtoby E, Jowett T. Cloning of the zebrafish krox-20 gene (krx-20) and its expression during hindbrain development. Nucleic Acids Res. 1993;21:1087–1095. doi: 10.1093/nar/21.5.1087. [DOI] [PMC free article] [PubMed] [Google Scholar]
- Rohani N, Canty L, Luu O, Fagotto F, Winklbauer R. EphrinB/EphB signaling controls embryonic germ layer separation by contact-induced cell detachment. PLoS Biol. 2011;9:e1000597. doi: 10.1371/journal.pbio.1000597. [DOI] [PMC free article] [PubMed] [Google Scholar]
- Schilling TF, Prince V, Ingham PW. Plasticity in zebrafish hox expression in the hindbrain and cranial neural crest. Dev Biol. 2001;231:201–216. doi: 10.1006/dbio.2000.9997. [DOI] [PubMed] [Google Scholar]
- Spear PC, Erickson CA. Interkinetic nuclear migration: a mysterious process in search of a function. Dev Growth Differ. 2012;54:306–316. doi: 10.1111/j.1440-169X.2012.01342.x. [DOI] [PMC free article] [PubMed] [Google Scholar]
- Stedman A, Lecaudey V, Havis E, Anselme I, Wassef M, Gilardi-Hebenstreit P, Schneider-Maunoury S. A functional interaction between Irx and Meis patterns the anterior hindbrain and activates krox20 expression in rhombomere 3. Dev Biol. 2009;327:566–577. doi: 10.1016/j.ydbio.2008.12.018. [DOI] [PubMed] [Google Scholar]
- Thisse C, Thisse B, Schilling TF, Postlethwait JH. Structure of the zebrafish snail1 gene and its expression in wild-type, spadetail and no tail mutant embryos. Development. 1993;119:1203–1215. doi: 10.1242/dev.119.4.1203. [DOI] [PubMed] [Google Scholar]
- Xiong F, Tentner AR, Huang P, Gelas A, Mosaliganti KR, Souhait L, Rannou N, Swinburne IA, Obholzer ND, Cowgill PD, Schier AF, Megason SM. Specified neural progenitors sort to form sharp domains after noisy Shh signaling. Cell. 2013;153:550–561. doi: 10.1016/j.cell.2013.03.023. [DOI] [PMC free article] [PubMed] [Google Scholar]
- Xu Q, Alldus G, Holder N, Wilkinson DG. Expression of truncated Sek-1 receptor tyrosine kinase disrupts the segmental restriction of gene expression in the Xenopus and zebrafish hindbrain. Development. 1995;121:4005–4016. doi: 10.1242/dev.121.12.4005. [DOI] [PubMed] [Google Scholar]
- Xu Q, Mellitzer G, Robinson V, Wilkinson DG. In vivo cell sorting in complementary segmental domains mediated by Eph receptors and ephrins. Nature. 1999;399:267–271. doi: 10.1038/20452. [DOI] [PubMed] [Google Scholar]
- Zhang L, Radtke K, Zheng L, Cai AQ, Schilling TF, Nie Q. Noise drives sharpening of gene expression boundaries in the zebrafish hindbrain. Mol Syst Biol. 2012;8:613. doi: 10.1038/msb.2012.45. [DOI] [PMC free article] [PubMed] [Google Scholar]
Associated Data
This section collects any data citations, data availability statements, or supplementary materials included in this article.