

Abstract
Aims: High circulating long chain fatty acids (LCFAs) are implicated in diabetic neuropathy (DN) development. Expression of the long-chain acyl-CoA synthetase 1 (Acsl1) gene, a gene required for LCFA metabolic activation, is altered in human and mouse diabetic peripheral nerve. We assessed the significance of Acsl1 upregulation in primary cultured Schwann cells. Results: Acsl1 overexpression prevented oxidative stress (nitrotyrosine; hydroxyoctadecadienoic acids [HODEs]) and attenuated cellular injury (TUNEL) in Schwann cells following 12 h exposure to LCFAs (palmitate, linoleate, and oleate, 100 μM). Acsl1 overexpression potentiated the observed increase in medium to long-chain acyl-carnitines following 12 h LCFA exposure. Data are consistent with increased mitochondrial LCFA uptake, largely directed to incomplete beta-oxidation. LCFAs uncoupled mitochondrial oxygen consumption from ATP production. Acsl1 overexpression corrected mitochondrial dysfunction, increasing coupling efficiency and decreasing proton leak. Innovation: Schwann cell mitochondrial function is critical for peripheral nerve function, but research on Schwann cell mitochondrial dysfunction in response to hyperlipidemia is minimal. We demonstrate that high levels of a physiologically relevant mixture of LCFAs induce Schwann cell injury, but that improved mitochondrial uptake and metabolism attenuate this lipotoxicity. Conclusion: Acsl1 overexpression improves Schwann cell function and survival following high LCFA exposure in vitro; however, the observed endogenous Acsl1 upregulation in peripheral nerve in response to diabetes is not sufficient to prevent the development of DN in murine models of DN. Therefore, targeted improvement in Schwann cell metabolic disposal of LCFAs may improve DN phenotypes. Antioxid. Redox Signal. 21, 588–600.
Introduction
Diabetic neuropathy (DN) is a prevalent complication of diabetes and affects ∼60% of the 26 million people with prediabetes and diabetes in the United States (6, 32). The consequences of DN, including chronic pain or loss of sensation, recurrent foot ulcerations, and amputation, are responsible for significant morbidity and high economic impact (10). Dyslipidemia is a recognized risk factor for the development of DN (1, 30, 40). Lipid profiles are commonly abnormal early in the course of type 2 diabetes and correlate with the onset of early DN (7). While glucose-induced oxidative stress is a well-studied mechanism underlying the pathogenesis of DN (16, 19, 26, 36–38), recent data from both diabetic subjects and murine models of type 2 diabetes strongly suggest a role for dyslipidemia and lipid-mediated oxidative stress in the onset and progression of DN (30, 34). The goal of our research is to understand how both glucose- and lipid-mediated oxidative stress lead to injury in cells of the peripheral nervous system, resulting in DN. Our hope is to ultimately discover mechanism-based therapies that can prevent this injury cascade and ameliorate the signs and symptoms of DN (33, 35–38).
Innovation.
Schwann cell mitochondrial function is critical for peripheral nerve function. Hypertriglyceridemia and elevated circulating long chain fatty acids (LCFAs) are implicated in type 2 diabetic neuropathy (DN) pathology, however, there is little research focusing on Schwann cell mitochondrial dysfunction in response to a high LCFA environment. We demonstrate that high levels of a physiologically-relevant mixture of saturated, monounsaturated, and polyunsaturated LCFAs induce mitochondrial bioenergetic changes associated with oxidative stress and cellular injury in primary cultured Schwann cells, and that improved mitochondrial metabolism of LCFAs attenuate this lipotoxicity. Targeted improvement in Schwann cell mitochondrial metabolic disposal of LCFAs may therefore have implications for the treatment of DN.
Schwann cells are the support cells of the peripheral nervous system and are required for peripheral nerve health, maintenance, and recovery from injury. Schwann cell-specific knockout of the mitochondrial transcription factor A gene (Tfam) in mice (29) induces peripheral nerve disease that strikingly resembles that seen in mouse models of DN (25), highlighting the necessity of normal Schwann cell mitochondrial function for long-term support of peripheral axons (8).
Our laboratory has completed a series of microarray studies on human and mouse diabetic peripheral nerves (13, 21), primarily assessing gene expression changes within Schwann cells. We have found increased mitochondrial long-chain acyl-CoA synthetase 1 (Acsl1), carnitine palmitoyltransferase 1a (Cpt1a), carnitine palmitoyltransferase 1b (Cpt1b), and carnitine/acylcarnitine translocase (CACT) gene expression in sciatic nerves (SCN) from a murine model of type 2 diabetes with DN, the leptin receptor-deficient db/db mouse (21). The proteins encoded by these genes are involved in long chain fatty acid (LCFA) transport across the mitochondrial membrane (14). In parallel, we discovered the Acsl1 gene is significantly regulated in sural nerves from patients with diabetes and DN (13). The encoded Acsl1 enzyme catalyzes the addition of a CoA group to LCFAs of 16–18 carbons in length, a step required for mitochondrial uptake and LCFA metabolism (17). Circulating triglycerides and very low density lipoprotein (VLDL) triglycerides (11) comprised of LCFAs are elevated in diabetes and serve as substrates for Acsl1. We questioned whether local Acsl1 upregulation could serve as a protective compensatory mechanism in DN in response to lipotoxic peripheral nerve dysfunction.
In the current study, we examined mitochondrial metabolism, oxidative stress, and cellular injury in response to a high LCFA environment in primary Schwann cells. We report that high levels of a physiologically relevant mixture of LCFAs induce mitochondrial dysfunction and oxidative stress in primary Schwann cells. Acsl1 overexpression significantly improves mitochondrial function, ameliorates oxidative stress, and restores Schwann cell viability. We conclude that Acsl1 overexpression improves Schwann cell function and survival in an in vitro high LCFA environment. However, endogenous Acsl1 upregulation in the db/db mouse SCN is not sufficient to prevent the development of DN in the complex and chronic in vivo diabetic environment. Our data support the growing body of literature that lipotoxicity is a pathomechanism underlying DN and suggest that therapeutically targeting Schwann cell metabolic disposal of LCFAs could provide a novel therapy for DN.
Results
db/db mice exhibit hypertriglyceridemia, nerve-specific oxidative stress, and Acsl1 protein upregulation
A mutation in the leptin receptor of the db/db mouse results in hyperphagia, severe obesity, hyperlipidemia, hyperinsulinemia, and hyperglycemia beginning at ∼4 weeks of age (Jackson Laboratories; 000642). Significant increases in oxidative modification were observed in db/db mouse SCN extracts compared with those of their age-matched controls, as evidenced by increased nitrotyrosine (nitrosylated proteins) and increased hydroxyoctadecadienoic acids (HODEs) (lipid peroxidation) (Supplementary Fig. S1A, B; Supplementary Data are available online at www.liebertpub.com/ars). Significant elevation of fasting plasma triglycerides in db/db mice at 8 and 24 weeks of age compared with age-matched db/+ controls (p<0.01) was also confirmed, with this diabetic elevation significantly increased between 8 and 24 weeks of age (p<0.01) (Supplementary Fig. S1C). We performed fast protein liquid chromatography (FPLC) fractionation to compare the plasma lipoprotein profiles and confirmed these triglycerides are predominantly held within the VLDL class of lipoproteins (Supplementary Fig. S1D). VLDL triglycerides are comprised of LCFAs and are thus substrates for Acsl1, leading us to explore the significance of regulated Acsl1 gene expression in the db/db SCN. To verify that the upregulated mRNA is translated to a biological protein, we performed Western immunoblotting on homogenized whole SCN (Fig. 1). Acsl1 protein expression was significantly increased in db/db SCN compared with age-matched db/+ SCN (8 weeks, 3.5-fold increase, p<0.05; 24 weeks, 4.0-fold increase, p<0.01). Together, these data confirm that the db/db type 2 diabetes mouse model exhibits altered triglyceride profiles and oxidative modifications that are correlated with Acsl1 gene and protein regulation.
FIG. 1.

Acsl1 protein expression is increased in db/db SCN at 8 and 24 weeks of age. The expression of Acsl1 protein in 10 μg homogenized SCN from control (db/+) and diabetic (db/db) mice was determined with Western immunoblotting (A). Pixel density of the Acsl1 band in each condition was normalized to the corresponding GAPDH band (B). Data are mean±SEM for four nerves per group. *p<0.05, **p<0.01 versus age-matched db/+. GAPDH, glyceraldehyde-3-phosphate dehydrogenase; SCN, sciatic nerve.
Incubation in high LCFAs increases Acsl1 protein expression in primary cultured Schwann cells
To examine the relationship between LCFA metabolism and Acsl1 expression in vitro, we used primary Schwann cell cultures. We confirm that Schwann cells express Acsl1 protein under basal media conditions (5.5 mM glucose) (Supplementary Fig. S2). In response to incubation in high LCFA (+100 μM) media, Schwann cells increase Acsl1 protein expression by 2.7-fold (p<0.001) (Fig. 2). These data confirm that Acsl1 protein is expressed in cultured Schwann cells (Supplementary Fig. S2) and increased in response to high LCFAs (Fig. 2).
FIG. 2.

Incubation in high LCFAs increases Acsl1 protein expression in primary cultured Schwann cells. Schwann cells were incubated in control defined media, defined media containing +100 μM LCFA (for a total concentration of 100 μM) for 12 h. Cells were harvested and a Western immunoblot was performed using 20 μg Schwann cell protein lysate (A). Pixel density of the Acsl1 band in each condition was normalized to the corresponding GAPDH band (B). High LCFAs (FA) increased Acsl1 expression 2.7-fold above control media. Data are mean±SEM, n=3 replicate cultures, ***p<0.001 versus control. LCFAs, long chain fatty acids.
LCFA-induced increases in mitochondrial transport genes and metabolites of beta-oxidation are potentiated by Acsl1 overexpression
We next examined the effects of lentiviral overexpression of Acsl1 on specific responses to LCFAs. Overexpression was confirmed by visual confirmation of simultaneously-expressed mCherry fluorescence (data not shown) and via Western immunoblot (Supplementary Fig. S3). Subcellular fractionation of Schwann cell pellets followed by Western immunoblotting confirmed mitochondrial enrichment of the overexpressed Acsl1 (Supplementary Fig. S4).
Mitochondrial LCFA metabolism first requires transport of Acsl1-activated LCFAs into the mitochondria, and the rate-limiting enzyme in this process is Cpt1. Real-time PCR (RT-PCR) was performed for Acsl1 and the three known Cpt1 isoforms. Exposure to LCFAs increased mRNA levels of Acsl1, Cpt1a, Cpt1b, and Cpt1c compared with control media (Fig. 3). Further, Acsl1 overexpression significantly increased these LCFA-induced changes in Cpt1a and Cpt1b transcription (p<0.05) (Fig. 3).
FIG. 3.

LCFA-induced increase in Schwann cell mitochondrial transport genes is potentiated by Acsl1 overexpression. Control and Acsl1-overexpressing Schwann cells were incubated in defined media and defined media containing +100 μM LCFAs (Control+FA and Acsl1 +FA, respectively) for 12 h. Cells were harvested in RLT buffer and real-time PCR (RT-PCR) was performed on isolated RNA. mRNA levels are expressed as a fold-change in relative mRNA expression for control and Acsl1 cells incubated in high LCFAs compared with cells incubated in control defined media (A) These data are expressed as a log2 transformation for improved visual comparison (B) Acsl1 overexpression significantly increased LCFA-induced changes in transcription of Cpt1a and Cpt1b. Data are mean±SEM. *p<0.05 versus Ctrl+FA. Cpt1a, carnitine palmitoyltransferase 1a; Cpt1b, carnitine palmitoyltransferase 1b.
Once the activated LCFAs (acyl-CoAs) have entered the mitochondrial matrix, they undergo consecutive turns of beta oxidation, removing two carbons in the form of acetyl-CoA with each cycle. The consecutively shortened acyl-CoAs can be completely converted to acetyl-CoA through beta-oxidation cycling, or can be directed to form acyl-carnitines at any stage. To begin to assess the metabolic fate of Acsl1-activated LCFAs, we performed directed liquid chromatography triple quadrupole mass spectrometry (LC/MS/MS) for acetyl-CoA, acetyl-carnitine, and medium to long-chain acyl-carnitines on control and Acsl1-overexpressing Schwann cells incubated with 100 μM LCFA for 12 h (control+FA or Acsl1+FA, respectively). High LCFAs were associated with a significant increase in Schwann cell acetyl-CoA (p<0.001), acetyl-carnitine (p<0.05), and medium to long-chain acyl-carnitines (dodecanoylcarnitine, C12, p<0.05; myristoylcarnitine, C14, p<0.01; palmitoylcarnitine, C16, p<0.001) (Fig. 4A, B, F–H). This effect of high LCFAs is further increased by Acsl1 overexpression, with all measured metabolites significantly greater in the Acsl1 +FA Schwann cells compared with the control+FA cells (p≤0.05 for all metabolites) (Fig. 4). Together, these findings confirm that Acsl1 potentiates LCFA mitochondrial transport and has an effect on LCFA metabolism.
FIG. 4.
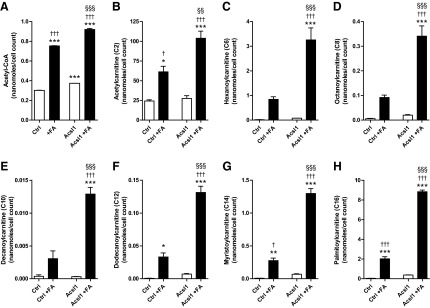
LCFA-induced increase in Schwann cell mitochondrial metabolites is potentiated by Acsl1 overexpression. Control and Acsl1-overexpressing Schwann cells were incubated in defined media and defined media containing +100 μM fatty acids (Control+FA and Acsl1+FA, respectively) for 12 h. Cells were snap frozen with liquid nitrogen and directed LC/MS/MS was performed for the presented metabolites. LCFAs (100 μM) significantly increased Schwann cell acetyl-CoA (A), acetyl-carnitine (B), and medium to long-chain acyl-carnitines (F–H). Acsl1 overexpression significantly increased this LCFA-mediated response (A–H). Data are mean±SEM. *p<0.05, **p<0.01, ***p<0.001 versus Ctrl; §§p<0.01, §§§p<0.001 versus Ctrl+FA; †p<0.05, †††p<0.001 versus Acsl1. LC/MS/MS, liquid chromatography triple quadrupole mass spectrometry.
Measurement of mitochondrial function in primary cultured Schwann cells
To determine the impact of these changes on mitochondrial bioenergetic function, the bioenergetic profile of control and Acsl1-overexpressing Schwann cells incubated in control-defined media or defined media containing +100 μM LCFA for 12 h was determined using the XF24 Analyzer following the sequential addition of oligomycin (ATP synthase inhibitor), carbonyl cyanide-p-trifluoromethoxyphenylhydrazone (FCCP) (uncoupling protonophore), and antimycin (complex III inhibitor) (Fig. 5).
FIG. 5.

Measurement of mitochondrial function in primary cultured Schwann cells using the XF24 Analyzer. OCR was measured at basal level and with the sequential addition of oligomycin (1.25 μM), FCCP (300 nM), and antimycin (1 μM) to control (A) and Acsl1-overexpressing (B) Schwann cells following a 12 h incubation in +100 μM LCFAs (+FA). OCR levels are normalized to μg protein. The OCR measurements in (A) and (B) are plotted in (C) and (D) as a percentage of baseline respiration. Basal OCR (E), coupling efficiency (F), respiratory control ratio (G), and spare respiratory capacity (H) were calculated after subtracting nonmitochondrial respiration as described in (1). Data are mean±SEM of 3 replicate cultures, with 10 replicate measures (10 wells) per condition per experiment; *p<0.05, **p<0.01 versus Ctrl; §p<0.05 versus Ctrl+FA; †p<0.05, ††p<0.01, †††p<0.001 versus Acsl1. FCCP, carbonyl cyanide-p-trifluoromethoxyphenylhydrazone; OCR, oxygen consumption rate.
The oxygen consumption rate (OCR) remaining following antimycin A addition (1 μM) gives a measure of nonmitochondrial respiration. Nonmitochondrial Schwann cell oxygen consumption is unaffected by LCFA treatment or Acsl1 overexpression (derived from Fig. 5A, B) (Control 3.3±0.3; Control+FA 3.4±0.4; Acsl1 3.4±0.5; Acsl1+FA 2.9±0.4 pMoles/min/μg protein). LCFA treatment was associated with significant decreases in coupling efficiency (Fig. 5F), respiratory control ratio (Fig. 5G) and spare respiratory capacity (Fig. 5E). Acsl1 overexpression significantly attenuated this LCFA-induced effect on coupling efficiency (Fig. 5F) (p<0.05). Extracellular acidification rate (ECAR) (a measure of glycolysis) was not significantly different between groups, indicating no effect of LCFAs or Acsl1 overexpression on glycolysis (data not shown). These data suggest an improvement in basal mitochondrial efficiency (less proton leak, more ATP-linked respiration) in LCFA-treated Acsl1 cells compared with LCFA-treated control cells.
To allow us to assess the implications of these changes on dynamic cellular bioenergetics, these oxygen consumption data are expressed in terms of maximal respiratory capacity (FCCP response) in the respective groups (Fig. 6). Comparison of charts between untreated and LCFA-treated control cells (Fig. 6A, B) shows a 23% increase in proton leak (14% to 37%), with a decrease in spare respiratory capacity of a similar magnitude (43% to 21%). The ATP-linked oxygen consumption is maintained in terms of maximal cellular respiratory capacity (33% to 29%). Comparison of data between LCFA-treated control and Acsl1-overexpressing cells (Fig. 6B, D) shows that Acsl1 overexpression normalizes proton leak (37% to 18%), spare respiratory capacity (21% to 40%), and ATP-linked oxygen consumption (29% to 33%) to untreated control levels (Fig. 6A). Nonmitochondrial oxygen consumption was unaffected by 12 h exposure to high LCFA or by Acsl1 overexpression. Together, these data indicate that Acsl1 expression impacts mitochondrial bioenergetic function in response to LCFA exposure by improving mitochondrial coupling efficiency, and improving spare respiratory capacity.
FIG. 6.

Parameters of Schwann cell mitochondrial function expressed as percentage maximal respiratory capacity. (A–D) Illustrate the parameters of mitochondrial function (spare respiratory capacity, ATP-linked O2 consumption, proton leak, and nonmitochondrial O2 consumption) expressed as a percentage of maximal OCR (FCCP response) from each of the respective groups of Schwann cells. (A) Control cells, (B) control+100 μM LCFAs (Control+FA), (C) Acsl1-overexpressing cells, (D) Acsl1-overexpressing cells+100 μM LCFAs (Acsl1+FA).
Acsl1 overexpression does not increase mitochondrial mass
To assess the contribution of adaptive effects on mitochondrial biogenesis to the improved mitochondrial bioenergetic profile, we examined changes in mtDNA expression as a measure of mitochondrial biogenesis. Twelve hours LCFA treatment significantly decreased mtDNA expression, with no significant effect of Acsl1 overexpression (Supplementary Fig. S5). These data suggest that the improvements in bioenergetic parameters are not due to an increase in mitochondrial mass.
Acsl1 overexpression protects against LCFA-induced oxidative stress and cellular injury in primary cultured Schwann cells
Finally, to assess whether Acsl1 is a modifier of LCFA-induced lipotoxicity, we examined the effects of Acsl1 overexpression on oxidative stress and cell viability changes in response to LCFAs using CellROX Green Reagent, FPLC quantification of nitrotyrosine (nitrosylated proteins) and HODEs (lipid peroxidation), and the TUNEL assay. CellROX Green Reagent was used to assess cellular reactive oxygen species (ROS) production in control (empty vector) and Acsl1-overexpressing (Acsl1) Schwann cells. Thirty μM LCFA increased CellROX signal in control cells after 1 h (Fig. 7). This LCFA treatment effect was attenuated with Acsl1 overexpression and with 3 h pretreatment in antioxidants that target global cellular oxidative stress (Fig. 7). This pro-oxidant effect of LCFA was maintained following 12 h in high LCFA media (100 μM LCFA), with nitrotyrosine and HODEs levels increased by 3.5-fold (p<0.05) and 2.3-fold (p<0.01), respectively in control Schwann cells (Fig. 8A, B). This LCFA-induced increase in markers of protein and lipid oxidative stress did not occur in Acsl1-overexpressing cells; levels of nitrotyrosine and HODEs in LCFA-treated Acsl1-overexpressing cells and untreated control cells were not significantly different (Fig. 8A, B). One hundred μM LCFAs was associated with almost 100% TUNEL positivity in control cells (p<0.001 compared with untreated control cells), while in Acsl1-overexpressing Schwann cells only 15% of LCFA-treated cells were TUNEL positive (p<0.001 compared with untreated Acsl1-overexpressing cells) (Fig. 8C). These data suggest that the LCFA-induced increase in oxidative stress in control Schwann cells is injurious and can be blocked by anti-oxidant pretreatment.
FIG. 7.

Acsl1 overexpression and antioxidant pretreatment protect against LCFA-induced oxidative stress in Schwann cells. CellROX Green Reagent was used to assess ROS production in Control (empty vector) and Acsl1-overexpressing (Acsl1) Schwann cells. Following a 3 h pretreatment with antioxidants (+AO) (N-acetyl-L-cysteine, 30 mM; alpha-lipoic acid, 500 μM; and catalase, 500 U/ml), Schwann cells were incubated with LCFA (30 μM FA) or menadione (100 μM) for 1 h. The level of ROS production was assessed by staining green (white arrows) with CellROX Green Reagent, and nuclei visualized using dapi. Scale bar is 100 μm. ROS, reactive oxygen species.
FIG. 8.

Acsl1 overexpression protects against LCFA-induced oxidative stress and cellular injury in Schwann cells. Control and Acsl1-overexpressing Schwann cells were exposed to high LCFAs (FA; 100 μM) for 12 h. Protein nitration (nitrotyrosine) (A) and lipid peroxidation (HODEs) (B) were assessed in Schwann cell samples by reverse-phase high-performance liquid chromatography. Treatment of control cells with +100 μM LCFAs (Control+FA) for 12 h increased nitrotyrosine and HODEs by 3.50-fold and 2.3-fold, respectively. Nitrotyrosine and HODEs levels in Acsl1-overexpressing cells did not differ from untreated control Schwann cells, even in the presence of 100 μM LCFAs (Acsl1+FA). Cellular injury was quantitated by TUNEL assay and is plotted as percentage TUNEL-positive cells (C). After LCFA treatment, almost 100% of control cells were TUNEL positive, while only 15% of Acsl1-overexpressing cells were TUNEL positive. Data are mean±SEM, n=3 replicate cultures, *p<0.05, **p<0.01, ***p<0.001 versus Ctrl; §p<0.05, §§p<0.01, §§§p<0.001 versus Ctrl+FA; †††p<0.001 versus Acsl1. HODEs, hydroxyoctadecadienoic acids.
Discussion
High circulating triglycerides and LCFAs are implicated in the development and progression of DN (1, 7, 34, 40). Microarray studies have allowed us to explore the role of hyperlipidemia-driven gene changes in the diabetic peripheral nerve (13, 21). Given that Schwann cells are the primary cellular components of peripheral nerves (28) and Schwann cell dysfunction contributes to DN (8), we sought to understand the implications of our identified gene changes on Schwann cell function and survival. Post-hoc analysis of microarray data uncovered cross-species regulation of Acsl1 in both human and mouse diabetic peripheral nerves (13, 21). In a murine model of type 2 diabetes with elevated VLDL triglycerides, the db/db mouse (Supplementary Fig. S1D), we confirmed that Acsl1 gene upregulation translates to an increase in Acsl1 protein expression (Fig. 1). In parallel, we also observed significant increases in both protein and lipid oxidative modifications in SCN from db/db mice (Supplementary Fig. S1A, B), supporting our contention that oxidative stress is a major mechanism of hyperglycemia- and lipid-induced DN in humans and rodents, particularly through the oxidation of proteins and lipids (32, 34, 39). In the current study, we explored the biological significance of Acsl1 overexpression in DN and the intersection of Acsl1 activity and oxidative stress as an underlying mechanism in DN.
Acsl1 is required for metabolic activation of LCFAs, a process necessary for LCFA entry into mitochondrial beta-oxidation (17). We demonstrated that Acsl1 protein is expressed in primary Schwann cells in vitro (Supplementary Fig. S2), and that Ascl1 levels are increased in response to high LCFAs (Fig. 2). These data suggest that modulation of LCFA metabolism by Acsl1 in Schwann cells may be instrumental in maintaining normal nerve homeostasis and in response to elevated LCFAs, commonly seen in type 2 diabetes, there is a compensatory increase in Ascl1. Given the increased levels of Acsl1 after LCFA treatment, we next explored whether this translated to increased mitochondrial uptake and metabolism of LCFAs.
Mitochondrial LCFA metabolism first requires transport of Acsl1-activated LCFAs into the mitochondria. We therefore overexpressed Ascl1 in primary Schwann cells (Supplementary Figs. S3 and S4) concurrent to LCFA treatment to investigate changes in LCFA transport. The transport proteins involved are Cpt1, Cpt2, and CACT, where Cpt1 is the rate-limiting enzyme of the complex (14). We observed LCFA-induced transcriptional upregulation of Cpt1, which is potentiated by Acsl1 overexpression (Fig. 3). This is consistent with the finding that palmitic, oleic, and linoleic acids, either directly or in their activated acyl-CoA forms, each markedly induce Cpt1 gene expression in the pancreatic beta cell line INS-1 (3).
Once the activated LCFAs (acyl-CoAs) have entered the mitochondrial matrix, they undergo consecutive cycles of beta oxidation. Each cycle shortens the acyl-CoA chain by two carbons in the form of acetyl-CoA, and produces reducing equivalents (NADH, FADH2) for oxidative phosphorylation. The acyl-CoAs can be completely catabolized to acetyl-CoA when reducing equivalents are required for ATP production, or they can be directed away from beta-oxidation and oxidative phosphorylation to form acyl-carnitines and acetyl-carnitine. We observed an increase in acetyl-CoA, acetyl-carnitine, and medium to long-chain acyl-carnitines following LCFA treatment (Fig. 4). Our data suggest that the LCFA are entering the mitochondrial matrix, and entering the beta-oxidation cycle. This is in agreement with the report that LCFA-induced Cpt1 gene upregulation leads to increased activity of Cpt1 and a higher LCFA oxidation capacity in INS-1 cells (3). However, after a limited number of turns (based on the species we see that is, medium to long-chain acyl-carnitines), the LCFA are not fully catabolized through beta-oxidation. Overexpression of Acsl1 leads to a potentiation of this response, suggesting that Acsl1 is not only promoting mitochondrial metabolism of LCFAs, but is also increasing the direction of acyl-CoAs to acyl-carnitine production (Fig. 4). In parallel, we also observed that Acsl1 overexpression ameliorated LCFA-induced cellular injury (Fig. 8C), further supporting the idea that Acsl1 overexpression leads to an increase in incomplete beta-oxidation of LCFA and diverts unrequired energy substrates from oxidative phosphorylation to offer protection from electron transport chain overload (5).
Electron transport overload is associated with increased proton leak, resulting in mitochondrial uncoupling and reduced mitochondrial efficiency (5, 37). Therefore, we performed bioenergetic profiling to assess the impact of high LCFA treatment on mitochondrial function. We observed that 12 h LCFA treatment significantly decreased mitochondrial efficiency via uncoupling oxygen consumption from ATP production (Fig. 5). The resulting mitochondrial substrate overload is associated with increased mitochondrial dysfunction in a number of cell types (5, 26). Further, in primary Schwann cells, hyperglycemic conditions decrease mitochondrial efficiency via uncoupling oxygen consumption from ATP production, while also decreasing spare respiratory capacity (41). Under these hyperglycemic conditions there is a concurrent increase in the ECAR, suggesting that Schwann cells shift to glycolytic metabolism in a hyperglycemic environment (41). Importantly, we did not observe any significant changes in ECAR (data not shown) in the current study, indicating that Schwann cells did not compensate for the decrease in ATP-coupled mitochondrial respiration by increasing glycolysis.
Another measure of mitochondrial energetic status is spare respiratory capacity, which represents the cells ability to respond to changes in bioenergetic needs. We observed a decrease in the spare respiratory capacity of the Schwann cells following LCFA treatment (Fig. 5). A decrease in spare respiratory capacity limits the ability of cells to respond to changes in bioenergetic needs (4), suggesting that the LCFA-treated Schwann cells are less able to respond to changes in metabolic load. This decrease in spare respiratory capacity was also reported in hyperglycemia-treated Schwann cells (41); however, under hyperglycemic conditions, the cells have the potential to utilize glycolysis to produce ATP in response to changes in energy demands. Taken together, the increased incomplete beta-oxidation (Fig. 4), uncoupling of oxygen consumption from ATP production, and decreased spare respiratory capacity following LCFA treatment (Figs. 5 and 6) suggest a LCFA-induced mitochondrial bioenergetic crisis, which ultimately results in Schwann cell injury (Fig. 8C). Our data strongly suggest that Acsl1 is instrumental in modulating the Schwann cell response to the observed LCFA-induced lipotoxicity. Overexpression of Acsl1 normalized ATP-linked oxygen consumption and proton leak, and hence, coupling efficiency (Figs. 5 and 6). In addition, with respect to the increased incomplete beta-oxidation (Fig. 4), mitochondrial function was normal in Acsl1-overexpressing cells despite 12 h of LCFA-treatment when compared with LCFA-treated control cells (Figs. 5 and 6). These data suggest that mitochondria in Acsl1-overexpressing cells are able to direct surplus energy substrates to acyl-carnitines rather than direct the reducing equivalents to the electron transport chain, perhaps decreasing the energetic overload on the electron transport chain.
Finally, we hypothesized that overexpression of Acsl1 would decrease both oxidative stress and cellular injury in response to LCFAs. As a first step, we examined the effects of LCFA treatment on empty vector control cells. In LCFA-treated control Schwann cells, we demonstrated an increase in Schwann cell ROS production after only 1 h exposure to LCFA (Fig. 7), and after 12 h exposure to 100 μM LCFAs we observed oxidative damage to both proteins and lipids (Fig. 8A, B) and significant cellular injury (Fig. 8C). Our data in control Schwann cells are consistent with reports that overwhelming mitochondrial substrate load is associated with increased oxidative stress and cellular apoptosis (5, 26). Our data are also consistent with the report that palmitate is lipotoxic to immortalized cultured Schwann cells, with ROS production significantly and persistently elevated from 12 h onward following 150 μM palmitate exposure (20). Pretreatment of control Schwann cells with the antioxidant cocktail (N-acetyl-L-cysteine, alpha-lipoic acid, and catalase) blocked LCFA-mediated oxidative stress (Fig. 7). These data agree with our own previous reports that increasing endogenous antioxidant defense in Schwann cells prevents oxidative mediated damage (35).
As predicted, Acsl1 overexpression prevented LCFA-mediated oxidative stress in Schwann cells (Figs. 7 and 8A, B) and attenuated Schwann cell injury (Fig. 8C). These data further support our contention that Acsl1 overexpression diverts surplus energy away from oxidative phosphorylation, preventing mitochondrial overload, bioenergetics failure, and ROS and cellular oxidative damage. Alternatively, it could be that Acsl1 is promoting LCFA uptake from the cytosol into the mitochondria, with a corresponding decrease in cytosolic oxidative stress. This idea is supported by reports that oleate-facilitated clearance of palmitate from the cytosol attenuates palmitate-induced oxidative stress, endoplasmic reticulum stress, and apoptosis in myocytes (18). The contribution of increased cytosolic clearance and decreased endoplasmic reticulum stress to our understanding of Acsl1 action on Schwann cells will be the focus of future experiments.
In summary, we report that Acsl1 overexpression normalized high LCFA-induced mitochondrial dysfunction and oxidative stress, significantly improving Schwann cell viability. We postulate that this is due to (i) increased mitochondrial LCFA activation and entry into the mitochondrial matrix, without direction of excess substrate to the electron transport chain and (ii) decreased cytosolic LCFAs, reducing cellular oxidative stress. Our data suggest that Acsl1 upregulation may be a compensatory response to elevated LCFAs in Schwann cells, and that extreme Acsl1 upregulation allows the cells to cope with high LCFAs. However, endogenous upregulation is not sufficient to prevent lipotoxicity in either cultured Schwann cells or db/db mouse SCN. If this endogenous compensation can be amplified by drug intervention, targeted improvement in Schwann cell mitochondrial metabolic disposal of LCFAs may have implications for altering DN phenotypes.
Materials and Methods
Materials
Chemicals were purchased from Sigma-Aldrich Corp. or Fisher Scientific unless otherwise stated.
Diabetic mice
Male type 2 diabetic (BKS.Cg-m+/+Leprdb; db/db) and control (db/+) mice were purchased from Jackson Laboratories. A mutation in the leptin receptor of the db/db mouse results in hyperphagia, severe obesity, hyperinsulinemia, and hyperglycemia beginning at 4 weeks of age (Jackson Laboratories; 000642). At 24 weeks of age (20 weeks of diabetes), db/db mice exhibit insensitivity to mechanical and thermal stimuli, along with slowed nerve conduction velocities and reduced intraepidermal nerve fiber density Sullivan et al. (25). Animals were maintained at the University of Michigan in a pathogen-free environment and cared for following the University of Michigan Committee on the Care and Use of Animals guidelines. Mice were given continuous access to food (Purina 5001; Purina Mills LLC) and water.
Terminal metabolic phenotyping and SCN collection
Mice were euthanized by sodium pentobarbital overdose at 8 and 24 weeks of age (6 db/+ and db/db at 8 weeks; 6 db/+ and db/db at 24 weeks). The left and right SCN were dissected. The left SCN was frozen in liquid nitrogen and stored at −80°C until Western immunoblotting was performed. The right SCN was prepared for quantification of markers of oxidative damage as previously described (12). Plasma was collected for total triglyceride and lipoprotein triglyceride measurements as previously described (11).
Acsl1 plasmid and lentivirus production
Total RNA was extracted from frozen mouse spinal cord from C57BL/6 mice using the RNeasy RNA extraction kit (Qiagen). cDNA was obtained by reverse transcription with the IScript cDNA synthesis kit (Bio-Rad) using 1 μg of total RNA in a 20 μl reaction according to the manufacturer's protocol. The cDNA was diluted 1:5 with ddH2O. Acsl1 was amplified by PCR in a 50 μl reaction using 1 μl of the diluted mouse spinal cord cDNA, 2 μl of 10 mM dNTPs (Denville Scientific, Inc.) (final concentration 200 μM each), 5×Phusion HF buffer, Phusion High-Fidelity DNA polymerase (New England BioLabs), and 50 pmol of forward and reverse primers: 5′-CGGGATCCATGGAAGTCCATGAATTGTT-3 and 5′-GTTTAGCGGCCGCAATTAGATCTTGATGGTGGCGTA-3′ (Integrated DNA Technologies). The following thermocycler protocol was used for the reaction: 98°C for 30 s, (98°C for 5 s, 55°C for 30 s, 72°C for 30 s)×30 cycles; and a final extension of 72°C for 10 min. The amplified product was directionally cloned into BamH1 and Not1 of the pLVX-IRES-mCherry vector (Clontech). The construct was confirmed by sequencing at the University of Michigan Sequencing Core. 10×Lentiviral stocks were generated by the University of Michigan Vector Core.
Schwann cell culture and fatty acid preparation
Schwann cells were isolated from SCN of P3 rat pups as previously described (35). Cells were plated on Primaria surface-modified plates in Dulbecco's Modification of Eagle's Medium (DMEM)/10% FBS. At confluence, fibroblasts were removed by complement lysis by using thy1.1 antibody and rabbit complement. Schwann cells were maintained in low glucose (1 g/L) DMEM containing 10% heat-inactivated FBS, 2 μM forskolin, 20 μg/ml bovine pituitary extract, and penicillin/streptomycin/neomycin (feed media).
For lentiviral transduction, Schwann cells were incubated in feed media containing 1×Acsl1-containing lentivirus construct or empty vector for 24 h. Cells were then washed twice with Hank's balanced salt solution, fresh feed media was added, and cells were maintained for 7 days prior to treatment experiments. During optimization experiments, transduction efficiency was confirmed by visualization of mCherry fluorescence every 2 days, and a Western immunoblot for Acsl1 protein was performed on day 7. Following confirmation that mCherry fluorescence correlated with Acsl1 overexpression, visual determination was used to confirm transduction efficiency in all subsequent experiments.
Prior to LCFA treatment experiments, Schwann cells were switched to defined media for 12 h (1:1 mix of low glucose [1 g/L] DMEM and Ham's F12K media containing 10 μg/ml transferrin, 10 μM putrescine, 20 nM progesterone, and 30 nM sodium selenite). Mitochondrial uptake of activated LCFAs is facilitated through the temporary replacement of the CoA group by carnitine (27). Carnitine (2 mM) and CoA (200 μM) were therefore added to culture media for the duration of high LCFA incubations. For CellROX, TUNEL, and XF24 Analyzer assays, Schwann cells were plated on poly-L-lysine-coated coverslips and XF24 Analyzer culture plates.
A single, 100×solution of linoleate, oleate, and palmitate (Nu-Chek Prep, Inc.) was prepared in 0.5% fatty acid-free bovine serum albumin (Equitech-Bio, Inc.) in low glucose DMEM heated to 37°C and added to culture wells for a final concentration of 100 μM. Treatment media were placed in a water bath at 37°C for 30 min before they were added to cells. LCFA treatment durations were 12 h unless otherwise stated.
Subcellular fractionation and Western immunoblotting
Subcellular fractionation was performed based on the methods of Arnoult et al. (2). Schwann cells were harvested in isotonic mitochondrial buffer (MB: 210 mM mannitol, 70 mM sucrose, 1 mM EDTA, and 10 mM HEPES [pH 7.5]) supplemented with the protease inhibitor mixture Complete (Roche Molecular Biochemicals) and homogenized for 30–40 strokes with a Dounce homogenizer. Samples were transferred to Eppendorf centrifuge tubes, homogenized for a further 20 strokes with a 28 gauge needle, and centrifuged (500 g, 5 min, 4°C) to remove nuclei and unbroken cells. The resulting supernatant was then centrifuged (10,000 g, 45 min, 4°C) to obtain the heavy membrane fraction enriched for mitochondria, and the resulting supernatant was collected as the cytosolic fraction. Cytosolic and heavy membranes fractions (30 and 10 μg of protein, respectively) were subject to Western immunoblotting.
Western immunoblotting was performed as previously described (36–38). Polyclonal antibodies against long-chain acyl-CoA synthetase 1 (Acsl1; Pierce Biotechnology), glyceraldehyde-3-phosphate dehydrogenase (GAPDH; Millipore), actin (Abcam), and anti-porin/voltage-dependent anion channel (VDAC; Millipore) were used.
Real-time PCR
Assessment of mRNA for specific mitochondrial proteins was performed by real-time PCR (RT-PCR) as previously described (31). Reverse transcription was performed using the iScript cDNA Synthesis kit (Bio-Rad). Real-time PCR amplification and SYBR green fluorescence detection were performed using the iCycler iQ Real-time Detection System (Bio-Rad). The fluorescence threshold value (Ct) was calculated using iCycler iQ system software. The mRNA levels were normalized to an endogenous reference gene (GAPDH, encoding glyceraldehyde-3-phosphate dehydrogenase; ΔCt) and then relative to a control group (ΔΔCt), and were expressed as 2−ΔΔCt. The average was calculated from two runs per sample.
Targeted metabolomic analysis by LC/MS/MS
Targeted metabolomic analysis was performed as previously described (12). Briefly, frozen Schwann cell samples were extracted with 150 μl of chilled 8:1:1 methanol:chloroform:water containing 13C-labeled standards and chromatographic separation of eight targeted metabolic intermediates was performed based on the methods of Lorenz et al. (15). The ratio of each metabolite peak area to that of the closest-matching 13C-labeled standard was calculated. Metabolite concentration was determined using calibration curves generated from known concentrations of authentic standards and equal concentrations of 13C-labeled compounds as were present in the samples. Concentrations were normalized to cell counts from TUNEL assays (number of cells per 20×objective field of view; four fields of view per coverslip; five coverslips per condition). Final values are expressed as nmol/cell count.
Mitochondrial respiration and extracellular acidification measures
The XF24 Extracellular Flux Analyzer (Seahorse Biosciences) was used to measure bioenergetic function in intact primary cultured Schwann cells. The XF24 culture plates allow simultaneous measurement of real-time OCR and ECAR (indirect assessment of glycolytic activity due to lactic acid production and proton extrusion) with negligible disruption to the cells. Bioenergetic measurements using the XF24 Analyzer require buffer-free media, thus, 1 h prior to mitochondrial respiration measurements, media was changed to unbuffered DMEM, supplemented with 1 mM sodium pyruvate and 5.5 mM D-glucose (pH 7.4). Based on initial optimization experiments, Schwann cells were seeded at 2.5×10⁵ cells per well 24 h prior to treatments. At this seeding density, optimal concentrations of respiratory chain inhibitors oligomycin and antimycin A were 1.25 and 1 μM, respectively. An FCCP (uncoupling protonophore) concentration of 300 nM was determined to give maximal flux without significant toxicity (data not shown). Following stable baseline OCR and ECAR measurements, bioenergetic profile experiments were performed by the sequential injection of oligomycin, FCCP, and antimycin A. Loop Start, Mix, Wait, and Measure times were 4, 3, 2, and 3 min, respectively. ATP-linked oxygen consumption, non-ATP-coupled mitochondrial oxygen consumption (proton leak), maximal respiratory capacity, and nonmitochondrial oxygen consumption were calculated from the response curves (4, 22). Additional bioenergetic parameters, including coupling efficiency, respiratory control ratio, and spare respiratory capacity, were derived from the response curves as described (4, 23).
Following mitochondrial respiration measurements, cells were harvested and the protein concentration of each well was determined for normalization of experimental rate values to protein content. Bioenergetic profile respiration experiments were repeated thrice, with 10 replicate measures (10 wells in the XF24 culture plate) per condition per experimental repeat.
Mitochondrial DNA quantification
Levels of mtDNA were measured by normalizing the mitochondrial gene (cytochrome b) to the nuclear gene (actin) as previously described (9, 31). A total of 10 ng genomic DNA was used for mtDNA and nuclear DNA markers.
Oxidative stress measures
SCN and Schwann cell samples were analyzed for nitrated protein (3-nitrotyrosine) and oxidized lipids (HODEs) as previously described (12).
CellROX Green Reagent (Invitrogen) is a cell-permeant dye that exhibits bright green photostable fluorescence upon oxidation by ROS and subsequent binding to DNA. CellROX was applied to Schwann cells at a final concentration of 5 μM for 30 min at 37°C. Cells were washed with PBS, fixed in 2% paraformaldehyde, and mounted with ProLong antifade mounting media containing dapi (Invitrogen). Green fluorescence was imaged using the 488 nm filter and 20×objective on a Nikon Microphot FXA fluorescent microscope.
TUNEL analysis
Cellular injury was assessed by counting the number of TUNEL-positive cells identified using the ApopTag Peroxidase In Situ Apoptosis Detection Kit as previously described (37, 38). Mean values were calculated from four fields of view per coverslip using a 20×objective, with five coverslips per condition.
Statistical analysis
Data analysis was performed using GraphPad Prism 5.0 (GraphPad Software). Comparisons between groups were performed using one-way ANOVA with Tukey post-test for multiple comparisons, two-way ANOVA with Bonferroni post-test for multiple comparisons, or an unpaired t-test, as applicable. Assumptions about the Gaussian distribution of data and rules for transformation of non-normative data were made as previously described (24). Significance was assigned when p<0.05.
Supplementary Material
Abbreviations Used
- Acsl1
long-chain acyl-CoA synthetase 1
- CACT
carnitine/acylcarnitine translocase
- Cpt1
carnitine palmitoyltransferase 1
- Cpt2
carnitine palmitoyltransferase 2
- DMEM
Dulbecco's Modification of Eagle's Medium
- DN
diabetic neuropathy
- ECAR
extracellular acidification rate
- FCCP
carbonyl cyanide-p-trifluoromethoxyphenylhydrazone
- GAPDH
glyceraldehyde-3-phosphate dehydrogenase
- HODEs
hydroxyoctadecadienoic acids
- LCFAs
long chain fatty acids
- LC/MS/MS
liquid chromatography triple quadrupole mass spectrometry
- OCR
oxygen consumption rate
- ROS
reactive oxygen species
- SCN
sciatic nerve
- VLDL
very low density lipoprotein
Acknowledgments
LMH is funded by the Juvenile Diabetes Research Foundation Angelika Bierhaus Postdoctoral Fellowship in Diabetic Complications. This work was supported by the National Institutes of Health (NIH 1RC 1NS068182, NIH 1 UO1 DK076160, NIH 1 R24 DK082841, and NIH 1 DP3 DK094292 to ELF), the American Diabetes Association, the A. Alfred Taubman Medical Research Institute, and the Program for Neurology Research and Discovery.
This work utilized Core Services supported by grants DK089503 (Seahorse) and DK097153 (Lipidomics) of the National Institute of Diabetes and Digestive and Kidney Diseases at the University of Michigan; and the Mouse Metabolic Phenotyping Center Core at the University of Washington, Seattle, Washington (U24 DK076126).
We thank Drs. J. Simon Lunn, Stacey A. Sakowski Jacoby, and Catrina Sims-Robinson for critical review of the article, Mrs. Judith Bentley for assistance with preparation of the article, and Mr. Sydney Bridges for expert technical assistance with the Seahorse experiments.
Author Disclosure Statement
No competing financial interests exist.
References
- 1.Ansquer JC, Foucher C, Aubonnet P, and Le Malicot K. Fibrates and microvascular complications in diabetes—insight from the FIELD study. Curr Pharm Des 15: 537–552, 2009 [DOI] [PubMed] [Google Scholar]
- 2.Arnoult D, Grodet A, Lee YJ, Estaquier J, and Blackstone C. Release of OPA1 during apoptosis participates in the rapid and complete release of cytochrome c and subsequent mitochondrial fragmentation. J Biol Chem 280: 35742–35750, 2005 [DOI] [PubMed] [Google Scholar]
- 3.Assimacopoulos-Jeannet F, Thumelin S, Roche E, Esser V, McGarry JD, and Prentki M. Fatty acids rapidly induce the carnitine palmitoyltransferase I gene in the pancreatic beta-cell line INS-1. J Biol Chem 272: 1659–1664, 1997 [DOI] [PubMed] [Google Scholar]
- 4.Brand MD. and Nicholls DG. Assessing mitochondrial dysfunction in cells. Biochem J 435: 297–312, 2011 [DOI] [PMC free article] [PubMed] [Google Scholar]
- 5.Brownlee M. Biochemistry and molecular cell biology of diabetic complications. Nature 414: 813–820, 2001 [DOI] [PubMed] [Google Scholar]
- 6.CDCP. National diabetes fact sheet: national estimates and general information on diabetes and prediabetes in the United States. U.S. Department of Health and Human Services, Centers for Disease Control and Prevention, Atlanta, GA, 2011 [Google Scholar]
- 7.Clemens A, Siegel E, and Gallwitz B. Global risk management in type 2 diabetes: blood glucose, blood pressure, and lipids—update on the background of the current guidelines. Exp Clin Endocrinol Diabetes 112: 493–503, 2004 [DOI] [PubMed] [Google Scholar]
- 8.Eckersley L. Role of the Schwann cell in diabetic neuropathy. Int Rev Neurobiol 50: 293–321, 2002 [DOI] [PubMed] [Google Scholar]
- 9.Edwards JL, Quattrini A, Lentz SI, Figueroa-Romero C, Cerri F, Backus C, Hong Y, and Feldman EL. Diabetes regulates mitochondrial biogenesis and fission in mouse neurons. Diabetologia 53: 160–169, 2010 [DOI] [PMC free article] [PubMed] [Google Scholar]
- 10.Edwards JL, Vincent AM, Cheng HT, and Feldman EL. Diabetic neuropathy: mechanisms to management. Pharmacol Ther 120: 1–34, 2008 [DOI] [PMC free article] [PubMed] [Google Scholar]
- 11.Hinder LM, Vincent AM, Hayes JM, McLean LL, and Feldman EL. Apolipoprotein E knockout as the basis for mouse models of dyslipidemia-induced neuropathy. Exp Neurol 239: 102–110, 2013 [DOI] [PMC free article] [PubMed] [Google Scholar]
- 12.Hinder LM, Vivekanandan-Giri A, McLean LL, Pennathur S, and Feldman EL. Decreased glycolytic and tricarboxylic acid cycle intermediates coincide with peripheral nervous system oxidative stress in a murine model of type 2 diabetes. J Endocrinol 216: 1–11, 2013 [DOI] [PMC free article] [PubMed] [Google Scholar]
- 13.Hur J, Sullivan KA, Pande M, Hong Y, Sima AA, Jagadish HV, Kretzler M, and Feldman EL. The identification of gene expression profiles associated with progression of human diabetic neuropathy. Brain 134: 3222–3235, 2011 [DOI] [PMC free article] [PubMed] [Google Scholar]
- 14.Lee K, Kerner J, and Hoppel CL. Mitochondrial carnitine palmitoyltransferase 1a (CPT1a) is part of an outer membrane fatty acid transfer complex. J Biol Chem 286: 25655–25662, 2011 [DOI] [PMC free article] [PubMed] [Google Scholar]
- 15.Lorenz MA, Burant CF, and Kennedy RT. Reducing time and increasing sensitivity in sample preparation for adherent Mammalian cell metabolomics. Anal Chem 83: 3406–3414, 2011 [DOI] [PMC free article] [PubMed] [Google Scholar]
- 16.Low PA, Nickander KK, and Trischler HJ. The roles of oxidative stress and antioxidant treatment in experimental diabetic neuropathy. Diabetes 46 (2S): 38S–42S, 1997 [DOI] [PubMed] [Google Scholar]
- 17.Mashek DG, Li LO, and Coleman RA. Long-chain acyl-CoA synthetases and fatty acid channeling. Future Lipidol 2: 465–476, 2007 [DOI] [PMC free article] [PubMed] [Google Scholar]
- 18.Miller TA, LeBrasseur NK, Cote GM, Trucillo MP, Pimentel DR, Ido Y, Ruderman NB, and Sawyer DB. Oleate prevents palmitate-induced cytotoxic stress in cardiac myocytes. Biochem Biophys Res Commun 336: 309–315, 2005 [DOI] [PubMed] [Google Scholar]
- 19.Osawa T. and Kato Y. Protective role of antioxidative food factors in oxidative stress caused by hyperglycemia. Ann N Y Acad Sci 1043: 440–451, 2005 [DOI] [PubMed] [Google Scholar]
- 20.Padilla A, Descorbeth M, Almeyda AL, Payne K, and De Leon M. Hyperglycemia magnifies Schwann cell dysfunction and cell death triggered by PA-induced lipotoxicity. Brain Res 1370: 64–79, 2011 [DOI] [PMC free article] [PubMed] [Google Scholar]
- 21.Pande M, Hur J, Hong Y, Backus C, Hayes JM, Oh SS, Kretzler M, and Feldman EL. Transcriptional profiling of diabetic neuropathy in the BKS db/db mouse: a model of type 2 diabetes. Diabetes 60: 1981–1989, 2011 [DOI] [PMC free article] [PubMed] [Google Scholar]
- 22.Readnower RD, Brainard RE, Hill BG, and Jones SP. Standardized bioenergetic profiling of adult mouse cardiomyocytes. Physiol Genomics 44: 1208–1213, 2012 [DOI] [PMC free article] [PubMed] [Google Scholar]
- 23.Roy Chowdhury SK, Smith DR, Saleh A, Schapansky J, Marquez A, Gomes S, Akude E, Morrow D, Calcutt NA, and Fernyhough P. Impaired adenosine monophosphate-activated protein kinase signalling in dorsal root ganglia neurons is linked to mitochondrial dysfunction and peripheral neuropathy in diabetes. Brain 135: 1751–1766, 2012 [DOI] [PMC free article] [PubMed] [Google Scholar]
- 24.Russell JW, Sullivan KA, Windebank AJ, Herrmann DN, and Feldman EL. Neurons undergo apoptosis in animal and cell culture models of diabetes. Neurobiol Dis 6: 347–363, 1999 [DOI] [PubMed] [Google Scholar]
- 25.Sullivan KA, Hayes JM, Wiggin TD, Backus C, Su Oh S, Lentz SI, Brosius F, 3rd, and Feldman EL. Mouse models of diabetic neuropathy. Neurobiol Dis 28: 276–285, 2007 [DOI] [PMC free article] [PubMed] [Google Scholar]
- 26.Tomlinson DR. and Gardiner NJ. Glucose neurotoxicity. Nat Rev Neurosci 9: 36–45, 2008 [DOI] [PubMed] [Google Scholar]
- 27.van der Leij FR, Huijkman NC, Boomsma C, Kuipers JR, and Bartelds B. Genomics of the human carnitine acyltransferase genes. Mol Genet Metab 71: 139–153, 2000 [DOI] [PubMed] [Google Scholar]
- 28.Verheijen MH, Chrast R, Burrola P, and Lemke G. Local regulation of fat metabolism in peripheral nerves. Genes Dev 17: 2450–2464, 2003 [DOI] [PMC free article] [PubMed] [Google Scholar]
- 29.Viader A, Golden JP, Baloh RH, Schmidt RE, Hunter DA, and Milbrandt J. Schwann cell mitochondrial metabolism supports long-term axonal survival and peripheral nerve function. J Neurosci 31: 10128–10140, 2011 [DOI] [PMC free article] [PubMed] [Google Scholar]
- 30.Vincent AM, Callaghan BC, Smith AL, and Feldman EL. Diabetic neuropathy: cellular mechanisms as therapeutic targets. Nat Rev Neurol 7: 573–583, 2011 [DOI] [PubMed] [Google Scholar]
- 31.Vincent AM, Edwards JL, McLean LL, Hong Y, Cerri F, Lopez I, Quattrini A, and Feldman EL. Mitochondrial biogenesis and fission in axons in cell culture and animal models of diabetic neuropathy. Acta Neuropathol 120: 477–489, 2010 [DOI] [PMC free article] [PubMed] [Google Scholar]
- 32.Vincent AM. and Feldman EL. New insights into the mechanisms of diabetic neuropathy. Rev Endocr Metab Disord 5: 227–236, 2004 [DOI] [PubMed] [Google Scholar]
- 33.Vincent AM, Hayes JM, McLean LL, Vivekanandan-Giri A, Pennathur S, and Feldman EL. Dyslipidemia-induced neuropathy in mice: the role of oxLDL/LOX-1. Diabetes 58: 2376–2385, 2009 [DOI] [PMC free article] [PubMed] [Google Scholar]
- 34.Vincent AM, Hinder LM, Pop-Busui R, and Feldman EL. Hyperlipidemia: a new therapeutic target for diabetic neuropathy. J Peripher Nerv Syst 14: 257–267, 2009 [DOI] [PMC free article] [PubMed] [Google Scholar]
- 35.Vincent AM, Kato K, McLean LL, Soules ME, and Feldman EL. Sensory neurons and schwann cells respond to oxidative stress by increasing antioxidant defense mechanisms. Antioxid Redox Signal 11: 425–438, 2009 [DOI] [PMC free article] [PubMed] [Google Scholar]
- 36.Vincent AM, McLean LL, Backus C, and Feldman EL. Short-term hyperglycemia produces oxidative damage and apoptosis in neurons. FASEB J 19: 638–640, 2005 [DOI] [PubMed] [Google Scholar]
- 37.Vincent AM, Olzmann JA, Brownlee M, Sivitz WI, and Russell JW. Uncoupling proteins prevent glucose-induced neuronal oxidative stress and programmed cell death. Diabetes 53: 726–734, 2004 [DOI] [PubMed] [Google Scholar]
- 38.Vincent AM, Perrone L, Sullivan KA, Backus C, Sastry AM, Lastoskie C, and Feldman EL. Receptor for advanced glycation end products activation injures primary sensory neurons via oxidative stress. Endocrinology 148: 548–558, 2007 [DOI] [PubMed] [Google Scholar]
- 39.Vincent AM, Russell JW, Low P, and Feldman EL. Oxidative stress in the pathogenesis of diabetic neuropathy. Endocr Rev 25: 612–628, 2004 [DOI] [PubMed] [Google Scholar]
- 40.Wiggin TD, Sullivan KA, Pop-Busui R, Amato A, Sima AAF, and Feldman EL. Elevated triglycerides correlate with progression of diabetic neuropathy. Diabetes 58: 1634–1640, 2009 [DOI] [PMC free article] [PubMed] [Google Scholar]
- 41.Zhang L, Yu C, Vasquez FE, Galeva N, Onyango I, Swerdlow RH, and Dobrowsky RT. Hyperglycemia alters the schwann cell mitochondrial proteome and decreases coupled respiration in the absence of superoxide production. J Proteome Res 9: 458–471, 2010 [DOI] [PMC free article] [PubMed] [Google Scholar]
Associated Data
This section collects any data citations, data availability statements, or supplementary materials included in this article.