Abstract
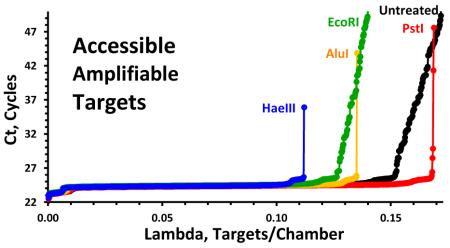
Polymerase chain reaction (PCR) multiplexed assays perform best when the input quantity of template DNA is controlled to within about a factor of √2. To help ensure that PCR assays yield consistent results over time and place, results from methods used to determine DNA quantity need to be metrologically traceable to a common reference. Many DNA quantitation systems can be accurately calibrated with solutions of DNA in aqueous buffer. Since they do not require external calibration, end-point limiting dilution technologies, collectively termed “digital PCR (dPCR)”, have been proposed as suitable for value assigning such DNA calibrants. The performance characteristics of several commercially available dPCR systems have recently been documented using plasmid, viral, or fragmented genomic DNA; dPCR performance with more complex materials, such as human genomic DNA, has been less studied. With the goal of providing a human genomic reference material traceably certified for mass concentration, we are investigating the measurement characteristics of several dPCR systems. We here report results of measurements from multiple PCR assays, on four human genomic DNAs treated with four endonuclease restriction enzymes using both chamber and droplet dPCR platforms. We conclude that dPCR does not estimate the absolute number of PCR targets in a given volume but rather the number of accessible and amplifiable targets. While enzymatic restriction of human genomic DNA increases accessibility for some assays, in well-optimized PCR assays it can reduce the number of amplifiable targets and increase assay variability relative to uncut sample.
Graphical abstract
Highly multiplexed polymerase chain reaction (PCR) genomic assays perform best when the quantity of template DNA is controlled within a fairly narrow range.1 Commercial short tandem repeat (STR) multiplexes for human identity have been developed that coamplify DNA at more than 20 genetic loci with 0.25 ng to 0.5 ng DNA as the recommended template quantity. Since PCR assays ideally double the quantity of amplified DNA (amplicon) with each amplification cycle, this requires control of the template quantity used with these multiplexes to within about a factor of √2 ≈ 1.4 (i.e., half of a PCR amplification cycle).
To better achieve this level of control, forensic laboratories routinely calibrate their DNA quantitation systems with reference solutions of human genomic DNA in aqueous buffer. To ensure that assay protocols can be successfully shared among laboratories and over time, the values assigned to these reference materials should be metrologically traceable2 to an accessible, internationally recognized reference system such as the International System of Units (SI).3 Measurement systems capable of counting the number of highly conserved, unique nucleotide sequences in a known sample volume have the potential to provide such traceability.
Dilutions assays have long been used in the biological sciences for estimating the number of uniquely distinguishable entities.4,5 The utility of combining PCR with end-point limiting dilution for estimating the number of targets in a given volume (copy number) was exploited soon after PCR's introduction,6 with the general technique being termed "digital PCR (dPCR)" some years later.7 Relatively recently, a number of commercial dPCR systems have become available, many aspects of their performance characterized, and guidelines proposed for publication of results from dPCR experiments.8 Many factors influencing the measurement of copy number using these systems have been evaluated and recently reviewed.9 Because dPCR results are obtained without relation to a DNA standard, the technology has been proposed as having the potential to be considered a primary method2. for estimating DNA copy number.10
However, the majority of studies that have explicitly addressed the metrological accuracy2. (a concept encompassing both precision and bias) of dPCR systems did so using viral, plasmid, or fragmented genomic DNA or probed intact genomic extracts with only a single PCR assay. Such studies have not addressed some potential sources of bias that could influence the accuracy of dPCR measurements of human genomic DNA.
As part of our effort to provide the forensic human identity and other interested communities with reference materials appropriate to their needs, we have used both chamber (cdPCR) and droplet (ddPCR) platforms to evaluate human genomic DNA extracts from several sources using a number of PCR assays. In cdPCR, samples are partitioned into a fixed number of fixed-size chambers. In ddPCR, samples are partitioned into a variable but large number of droplets of nominally equal and reproducible volume. In ideal digital systems, a sample is partitioned such that every target has an equal chance of being in any given partition (chamber or droplet), each partition contains zero to a few target sequences, and the fraction of partitions that contain no target is neither too small nor too large. When these conditions hold and every partition has an equal chance of being interrogated, then the number of partitions that contain at least one target sequence relative to the total number of partitions, Npos/Ntotal, estimates the average number of targets per partition, λ, via the Poisson relation: λ = ln(1 − Npos/Ntotal). Positive partitions are defined as those with fluorescence intensity above threshold after a suitably large number of PCR amplification cycles.
In this report we demonstrate that 1) dPCR systems do not estimate the absolute number of targets in a given volume but rather the number of accessible, amplifiable targets; 2) while enzymatic fragmentation can make targets more accessible to PCR amplification, it typically decreases the number of targets amplified; 3) different PCR assays may provide different estimates for the number of targets in a given volume due to differences in target accessibility; 4) accessibility can differ among cdPCR and ddPCR platforms, and 5) cdPCR and ddPCR results for several well-validated PCR assays have the potential to reliably value assign human genomic DNA reference materials.
MATERIALS AND METHODS
dPCR systems
Chamber-digital PCR (cdPCR)
We use a Fluidigm BioMark (South San Francisco, CA) cdPCR real time/end point limiting dilution assay system with BioMark 12.765 and 48.770 digital arrays. Each analysis uses a disposable microfluidic device ("chip"): the 12.765 chip has 12 panels each containing 765 chambers each of nominal volume 6 nL, the 48.770 chip has 48 panels each containing 770 reaction chambers each of nominal volume 0.85 nL. Any PCR master mix that contains the passive reference dye ROX can be used with this cdPCR system since the Fluidigm specific reagent that prevents sample binding with the microfluidic channels, 20X GE Loading Reagent, is added separately. Samples are amplified using a temperature ramp of 2 °C/s, an initial hold at 95 °C for 10 min then 60 cycles of 95 °C for 15 s with annealing at {58, 60, or 62} °C for 60 s. While this real-time cdPCR system monitors fluorescence intensity in all of the chip’s reaction chambers at the completion of each amplification cycle, to help ensure that all chambers containing at least one target are detected we use the Npos results at a 60-cycle amplification endpoint. Ntotal is always the number of chambers per panel (765 or 770).
Droplet-digital PCR (ddPCR)
We use a QX100 ddPCR system (Bio-Rad, Hercules, CA) where droplets are formed in a disposable microfluidic cartridge that mixes droplet generating oil with the DNA in a vacuum-operated droplet generator. The surfactant used to stabilize the emulsion is proprietary and included in the master mix; therefore only Bio-Rad master mixes are compatible with this system. Generated droplets from each sample are transferred to one well of a 96-well plate. After all samples are transferred, the plate is heat-sealed with foil and PCR amplified using a well-calibrated thermal cycler. Samples are amplified using a temperature ramp of 2.5 °C/s, an initial hold at 95 °C for 10 min then 40 cycles of 94 °C for 30 s with annealing at {58, 60, or 62} °C for 60 s, a hold at 98 °C for 10 min to harden the droplets and a final hold at 4 °C until the samples are removed. The manufacturer suggests amplifying for more than 40 cycles may reduce the number of countable droplets. After amplification, the 96-well plate is transferred to the Droplet reader which determines Nneg and Ntotal, where Ntotal is the subset of droplets (typically 10,000 to 20,000) in each well that are read and accepted as valid.
Samples
DNA extracts from four sources were evaluated. The stock solution of each material consisted of 50 ng/μL to 200 ng/μL of human genomic DNA in TE−4 buffer: 10 mmol/L tris (hydroxymethyl)aminomethane HCl (Tris), 0.1 mmol/L ethylenediaminetetraacetic acid (EDTA), pH 8.0. The mass concentration of these extracts was estimated from their absorbance at 260 nm11 to enable more efficient dilution into the desired dPCR working range.
Material NIST1
This material derives from component #16 of SRM 2390 DNA Profiling Standard.12 Each unit of SRM 2390 provided approximately 25 μL of 200 ng/μL extracted single-donor male human genomic DNA in TE−4 pH 7.5 buffer. These solutions had been stored at −80 °C from the time they were vialed in the late 1980s. Following discontinuation of the SRM in 2009, the solution in the remaining vials was pooled, diluted with TE−4 buffer to a DNA concentration, [DNA], of about 50 ng/μL and stored in perfluoroalkoxy fluoropolymer (PFA) containers at 4 °C. Gel electrophoresis revealed that by mid-2015 the majority of the NIST1 DNA had become somewhat fragmented, but with electrophoretic mobilities consistent with lengths of 10171 to above 48502 nucleotide basepairs (bp). (See file TAA_Gel Images.pdf in the Supplemental Information, NIST1 DNA, sample TE.)
Material NIST2
This material is the master solution for the multi-source female component B of SRM 2372 Human DNA Quantitation Standard.13 This genomic DNA was isolated in 2006 from the white blood component of human Buffy coat cells using a modified “salting out” procedure14 The extracted DNA was air-dried in a laminar flow hood, solubilized in TE−4 pH 8.0 buffer, and stored in a PFA container at 4 °C. The [DNA] of this solution is about 100 ng/μL Gel electrophoresis in mid-2015 indicated that the NIST2 DNA is very little fragmented; the majority of the DNA sufficiently large to not migrate into the gel and the remainder with electrophoretic mobilities consistent with lengths greater than 10171 bp (see Figure 1, sample TE).
Figure 1.
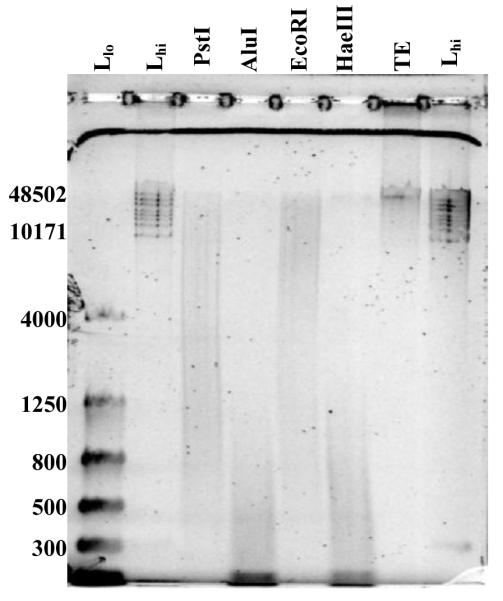
Gel image of the NIST2 DNA after enzymatic restriction. Samples are labeled above each well: “Llo” is the Flash gel DNA Marker (Lonza, Basel), “Lhi” is the Gene Ruler High Range DNA Ladder (Life Technologies). Values to the left of the image mark the bp size of representative bands of the two ladders.
Material NIST3
This material was freshly prepared from an aliquot of the Buffy coat cells used for the single-source male component A of SRM 2372. This genomic DNA was extracted using the procedure described for the NIST2 material. The [DNA] of this solution is about 200 ng/μL. Gel electrophoresis confirmed that the NIST3 DNA is very little fragmented. (See file TAA_Gel Images.pdf in the Supplemental Information, NIST3 DNA, sample TE.)
Material NIST4
This material was freshly prepared from single-source female Buffy coat cells using the procedure described for the NIST2 material. The [DNA] of this solution is about 170 ng/μL. Gel electrophoresis confirmed that the NIST4 DNA is very little fragmented. (See file TAA_Gel Images.pdf in the Supplemental Information, NIST4 DNA, sample TE.)
PCR assays
Assays developed for other PCR-based technologies can often be adapted, with suitable modification of reagents and conditions, for use with dPCR systems. Nine uniplex PCR assays were used in this study, one commercial and eight developed at NIST. All assays report amplification via the fluorescence intensity of a 6-carboxyfluorescein (FAM) fluorophore. Table 1 details the primer and probe sequences for these assays.
Table 1.
Primers and Probe for NIST-Developed Assays
| Assay / Target / Locus |
Primers and Probe | Anneal Temp |
|---|---|---|
| NEIF Gene EIF5B Chr 2 p11.1-q11.1 |
F gccaaacttcagccttctcttc R ctctggcaacatttcacactaca Pa tcatgcagttgtcagaagctg |
62 °C |
| 2PR4 Gene RPS27A Chr 2 p16 |
F cgggtttgggttcaggtctt R tgctacaatgaaaacattcagaagtct Pc tttgtctaccacttgcaaagctggccttt |
60 °C |
| NR4Q Gene DCK Chr 4 q13.3-q21.1 |
F tggtgggaatgttcttcagatga R tcgactgagacaggcatatgtt Pa tgtatgagaaacctgaacgatggt |
60 °C |
| Quantifiler (Qf) Gene hTERT Chr 5 p15.33 |
F proprietary R proprietary Pb proprietary |
60 °C |
| D5 STR D5S2500 Chr 5 q11.2 |
F ttcatacaggcaagcaatgcat R cttaaagggtaaatgtttgcagtaatagat Pb ataatatcagggtaaacaggg |
58 °C |
| ND6 STR D6S474 Chr 6 q21-22 |
F gcatggctgagtctaaagttcaaag R gcagcctcagggttctcaa Pa cccagaaccaaggaagatggt |
60 °C |
| HBB1 Gene HBB Chr 11 p15.5 |
F gctgagggtttgaagtccaactc R ggtctaagtgatgacagccgtacct Pa agccagtgccagaagagccaagga |
62 °C |
| ND14 STR D14S1434 Chr 14 q32.13C |
F tccaccactgggttctatagttc R ggctgggaagtcccacaatc Pa tcagactgaatcacaccatcag |
58 °C |
| 22C3 Gene PMM1 Chr 22 q13.2 |
F cccctaagaggtctgttgtgttg R aggtctggtggcttctccaat Pc caaatcacctgaggtcaaggccagaaca |
60 °C |
bp: basepair, F: Forward primer, R: Reverse primer, Pa: Blackhole Plus quencher probe, Pb: Taqman MGB probe, Pc: Blackhole quencher probe, Anneal Temp: annealing temperature
Quantifiler
The Quantifiler Human DNA Quantification Kit (Life Technologies)15 is used by the human identity community for quantifying the DNA concentration of extracted samples prior to short tandem repeat (STR) profiling. The primers and probe sequences used in this assay are proprietary as are the details of the composition of the kit's reagents.
NIST-Developed Assays
Eight PCR assays developed at NIST were used for this study. Five of these assays target nucleotide sequences related to housekeeping genes. The PCR targets for the other three assays were chosen to be upstream or downstream of well-documented short tandem repeat (STR) loci. The primer and probe sequences for these assays were designed using Primer Express (Applied Biosystem, Foster City, CA) and RealTimeDesign Software (Biosearch Technologies, Petaluma, CA). All assays were confirmed to target unique and relatively invariant sequences using NCBI/BLAST/blastn suite16. All primers were purchased from Eurofins MWG Operon (Huntsville, AL). Black Hole Quencher and Black Hole Quencher Plus probes were purchased from Biosearch Technologies. Taqman MGB probes were purchased from Life Technologies.
For every 20 μL cdPCR reaction prepared for these eight assays, we combined: 10 μL Gene Expression master mix (Life Technologies), 1.5 μL of each 5 μmol/L forward and reverse primers, 1 μL of 5 μmol/L probe, 2 μL PCR-grade water, 2 μL 20x GE Sample Loading Reagent (Fluidigm) and 2 μL DNA solution. For the 48:770 chips, the [DNA] of this solution was volumetrically diluted with TE−4 to be within the range 10 ng/μL to 25 ng/μL. To accommodate the ≈7-fold greater volume of the 12.765 chips, for these chips the [DNA] was diluted to be within the range 1.5 ng/μL to 3.6 ng/μL
For every 20 μL ddPCR reaction prepared for these assays we combined: 10 μL ddPCR Supermix for Probes (no dUTP) master mix (Bio-rad), 1.5 μL of each 5 μmol/L forward and reverse primers, 1 μL of 5 μmol/L probe, 4 μL PCR-grade water, and 2 μL DNA solution volumetrically diluted with TE−4 so that the [DNA] was within the range 10 ng/μL to 25 ng/μL
The [DNA] in the reaction mixtures were designed to provide λ values in the range of 0.2 to 0.5 copies per partition. Restricting λ to within this range helps ensure that dispersal of the genomic targets is random and independent while minimizing the variability intrinsic to Poisson processes.17
Restriction Enzymes
Restriction enzymes (endonucleases) cut DNA with high reliability at specific base-pair sequences.18 Table 2 lists the four enzymes that we chose to use and a few of their properties. Enzymes used in the study were purchased from New England Biolabs (Ipswich, MA).
Table 2.
Properties of Restriction Enzymes
| Property | AluI | HaeIII | EcoRI | PstI |
|---|---|---|---|---|
| Recognition 5′- sequence 3′- |
AG∣CT TC∣GA |
GG∣CC CC∣GG |
G∣AATTC CTTAA∣G |
CTGCA∣G G∣ACGTC |
| End type | Blunt | Blunt | Sticky | Sticky |
| Cuts ssDNA? | No | Some | Yes | No |
| ≈ No. Cut sites Mean fragment size |
11.5 106 280 bp |
5.1 106 630 bp |
1.0 106 3100 bp |
0.5 106 7000 bp |
| Units / mL | 10,000 | 10,000 | 20,000 | 20,000 |
One unit of enzyme is defined as the amount required to digest 1 μg of lambda DNA in one hour at 37 °C in a total reaction volume of 50 μL. To ensure complete restriction, 20 units were used for each 1 μg of human genomic DNA and the mixtures were incubated at 37 °C for two hours. See Table 3 for the composition of the reaction mixtures for the four enzymes.
Table 3.
Sample Preparation
| μL Component per 50 μL Solution | ||||
|---|---|---|---|---|
| Component | AluI | HaeIII | EcoRI | PstI |
| [Enzyme], 40 U | 4.0 | 4.0 | 2.0 | 2.0 |
| NEBuffer3 | 5.0 | |||
| NEBuffer4 | 5.0 | 5.0 | 5.0 | |
| BSA, 100 μg/mL | 0.5 | |||
| DNA, 2 μg | 2/[DNA] | 2/[DNA] | 2/[DNA] | 2/[DNA] |
| PCR-grade Water | 50-Σrest | 50-Σrest | 50-Σrest | 50-Σrest |
The SeqBuilder (DNASTAR, Madison WI) chromosome mapping software was used to determine the size of the fragment containing the target sequence after enzymatic restriction for the eight NIST-developed assays. Table 4 lists the size of the amplicon for these assays, the number of bps upstream and downstream of the amplicon, and the total fragment size. If cutting is complete, assays with target sequences containing a restriction site will not amplify the cut DNA.
Table 4.
Lengths of Amplicons and Enzyme-Restricted Fragments, in bp
| AluI | HaeIII | EcoRI | PstI | ||||||||||
|---|---|---|---|---|---|---|---|---|---|---|---|---|---|
| Assay | Amplicon | Upa | Downb | Totalc | Upa | Downb | Totalc | Upa | Downb | Totalc | Upa | Downb | Totalc |
| Qf | 62 | Unkd | Unkd | Unkd | Unkd | ||||||||
| NEIF | 67 | Cute | 22 | 502 | 591 | 96 | 3393 | 3556 | 8458 | 363 | 8888 | ||
| D5 | 75 | 877 | 231 | 1183 | 11 | 354 | 440 | 1037 | 4703 | 5815 | 6185 | 726 | 6986 |
| HBB1 | 76 | 100 | 573 | 749 | 23 | 28 | 127 | 3974 | 1515 | 5565 | 543 | 576 | 1195 |
| 22C3 | 78 | 49 | 90 | 217 | Cute | 1084 | 6350 | 7512 | 1100 | 1033 | 2211 | ||
| ND6 | 82 | 21 | 73 | 176 | Cute | 44 | 5479 | 5605 | 9685 | 748 | 10515 | ||
| NR4Q | 82 | 332 | 5 | 419 | 621 | 112 | 815 | 1483 | 16527 | 18092 | 1257 | 6015 | 7354 |
| 2PR4 | 97 | Cute | Cute | 1055 | 2960 | 4112 | 1256 | 2082 | 3435 | ||||
| ND14 | 109 | 44 | 152 | 305 | 91 | 475 | 675 | 4542 | 3306 | 7957 | 2499 | 2938 | 5546 |
Number of nucleotides between upstream restriction site and the forward primer
Number of nucleotides between reverse primer and the downstream restriction site
Total number of nucleotides between upstream and downstream restriction sites
Unknown, but restriction does not impair amplification
Restriction site between forward and reverse primers
After preparing the solutions, the DNA was cut by heating to 37 °C for 2 h, cooled, and stored at 4 °C until used. Heating was accomplished using a well-calibrated incubator. No attempt was made to deactivate these nuclease enzymes before initiating PCR amplification.
Control samples, hereafter referred to as “TE” controls, were prepared for each of the DNA materials by diluting 2/[DNA] μL of master solution with TE−4 buffer to a total volume of 50 μL. These TE controls were held without further manipulation at 4 °C until used. Secondary control materials for several of the DNAs, hereafter referred to as “Sham” controls, were prepared as described in Table 4 but using enzyme that had first been deactivated by heating to 98 °C for 1 h.
After cutting, the treated materials and the TE control were diluted four-fold with TE−4 buffer. Cutting completeness was determined by gel electrophoresis. Thirty mL of 0.7 % Trevigel 5000 gel matrix was prepared in 1X TAE buffer (40 mmol/L Tris, 20 mmol/L acetic acid, 1 mmol/L EDTA) in a 125 mL flask. The flask was sealed with durafilm, microwaved until the liquid boiled, swirled until the matrix appeared uniform, and then cast. After the gel solidified at room temperature, it was stored at 4 °C for 1 h prior to loading. Wells were loaded with 1 μL of loading buffer and 5 μL of the 1→4 diluted sample. The gel was electrophoresed at 45 V for 2-3 h. Gel electrophoresis confirmed the expected fragmentation patterns for the enzyme-treated materials. Figure 1 displays an image of the gel for the NIST2 DNA. Gels for the other DNAs were visually similar; see gel images in file TAA_Gel Images.pdf in the Supplemental Information.
Experimental Designs
For the cdPCR 48:770 determinations, a maximum of two assays were loaded into the 48 panels of a given chip, each chip using the annealing temperature appropriate to the assays. If the assays were compatible with all enzyme treatments then four panels were allocated to each of the four treatments, the TE control, and no temple controls (NTCs). For assays that were compatible with only three of the treatments, we doubled the number of TE controls. For assays that were compatible with only two of the treatments, we allocated six panels to each of the remaining two treatments, TE control, and NTC.
Since the 12:765 chips are more expensive than their 48:770 siblings, provide only a quarter of the information per chip, and take just as long to analyze, these chips were only used occasionally to compare platform performance issues. When used, a minimum of two panels were allocated to each of the assay-compatible assays, TE control, and NTCs.
Each ddPCR QX100 droplet generation cartridge has eight sample wells. We typically allocated two cartridge wells per sample and used as many cartridges as necessary to evaluate all assays at each of the {58, 60, or 62} °C annealing temperatures. For assays that were not compatible with all four enzyme treatments, we increased either the number of wells allocated to all remaining treatments or just the number of TE controls. Regardless of the number of cartridges used, the sample droplets were loaded as symmetrically as possible into the interior of the 96-well plate.
For all systems and all assays, once it was confirmed that the NTCs were routinely negative (typically zero and at most 0.02 % positive partitions), the analytical resources originally devoted to NTCs were used to increase either the number of replicate determinations of all remaining treatments or just the number of TE controls.
Computation
The Fluidigm Digital PCR Analysis Tool provided by the manufacturer was used for all primary reduction of cdPCR results using assay-specific global intensity thresholds and a quality score threshold of 0.1. “Detailed Table Results” were exported into a spreadsheet for further manipulation.
The QuantaSoft software provided by the manufacturer was used for all primary reduction of ddPCR results using analyst-specified assay-specific intensity thresholds. Summary results were exported into a spreadsheet for further manipulation.
All cdPCR and ddPCR export files used in this study are provided as spreadsheet workbooks in the file TAA_Files used in Figures.zip in the Supporting Information. The Supporting Information also provides exemplar diagnostic graphics for all assays, sample treatments, and DNAs.
RESULTS AND DISCUSSISON
In principle, selective fragmentation of complex genomic materials via restriction enzymes can make target sites more accessible to the primers and probe, polymerase, and other reagents required for successful PCR amplification and detection. Improving accessibility could increase the measured number of targets. However, restriction may result in other fragmentation either from incomplete restriction specificity or mechanical damage in the course of the cutting process. Such fragmentation may destroy or damage target sites, reducing the number of amplifiable targets and thus decreasing the measured copy number.
We investigated the relative influences of target accessibility and amplifiability in a series of analyses performed under repeatability conditions: over a relatively short period of time by one analyst using the same equipment, reagents, and sample stocks.
For each of the nine PCR assays studied, five treatment protocols were evaluated: cut with AluI, cut with HaeIII, cut with EcoRI, cut with PstI, and untreated control TE. For each assay and treatment combinations, the cut and TE control were evaluated using both 48.770 cdPCR and ddPCR at the optimized annealing temperature of each assay.
Fragmentation and increased accessibility
As documented elsewhere19, enzymatic restriction can dramatically reduce the number of “late start” cdPCR chambers. Figure 2 documents the differences in the Quantifiler assay’s amplification behavior with (Fig. 2A) and without (Fig 2B) AluI restriction. The effect is much reduced but still noticeable in ddPCR (Fig. 2C). We attribute the decrease in the number of atypical chambers and droplets to increased target accessibility following restriction.
Figure 2.
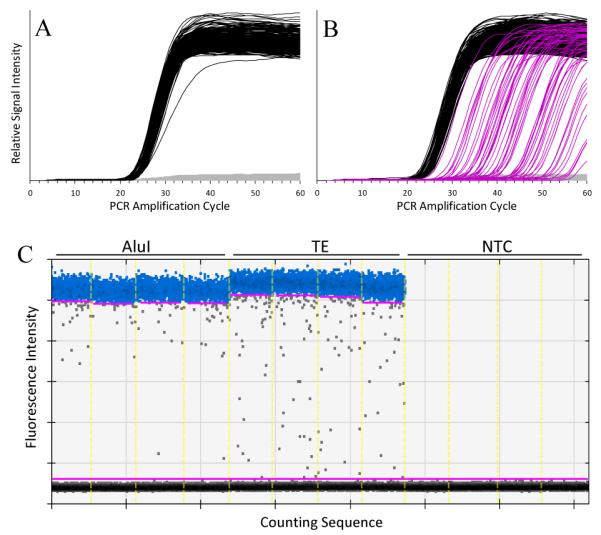
Panels A and B display the relative fluorescence intensity of 48.770 cdPCR chambers as functions of PCR amplification cycle for four panels each of AluI-cut and TE control NIST1 DNA amplified with the Quantifiler assay. The grey curves depict the background fluorescence of chambers where there was no target amplification. The black curves depict fluorescence intensity in “normal” chambers. The magenta curves depict the signal intensity for “late-start” chambers. Panel C displays the ddPCR droplet fluorescence intensities for four wells each of AluI-cut, TE control, and non-template controls (NTC) after 40 amplification cycles of the Quantifiler assay. The horizontal axis represents the droplet counting sequence. The light yellow vertical lines mark the well-boundaries. The lower and upper magenta horizontal lines represent two intensity threshold choices. The grey dots between these lines represent droplet “rain”.
We define late-start cdPCR chambers as those where the signal exceeds an assigned threshold after 0.5 half-cycle gap in the cumulative distribution of threshold crossings (Cts). While arbitrary, this decision rule is easily implemented and provides reproducible values. By this rule, there are no late-start chambers with the AluI treated material in Figure 1A and 13% late-starts for the untreated DNA of Figure 1B. Note that the shape of the late-start amplification curves does not significantly change with increasing cycles and that chambers continue to turn positive even 20 cycles beyond the typical 40 cycle termination.
While a distribution-based method for differentiating ddPCR positive from negative droplets has been developed,20 quantifying droplet rain is more problematic – particularly when the upper band of highly fluorescent droplets isn’t compact or well separated from the lower background band. With well-behaved assays, we estimate the rain on the basis of two visual assessments: droplets visually separate from the upper edge of the compact distribution of low-signal droplets and visually separate from the lower edge of the compact distribution high-signal droplets. By this rule, 1.9% of the 5700 positive droplets of AluI treated material that are above the lower threshold in Figure 2C are rain versus 2.7% of the 7825 positive droplets of the untreated material. Thus, only a minority of the rain in Figure 2C can be attributed to “late-start” droplets.
We also observe improved accessibility following restriction with HaeIII and PstI but not EcoRI. The target sequence for the Quantifiler assay is within the hTERT gene, a region of 41,881 bp. The AluI, HaeIII, and PstI enzymes all fragment this region into lengths of at most 3,800 bp. However, the EcoI enzyme has only four cut sites within this region, yielding beginning and end fragments of at least 17,758 bp and 15,081 bp. We speculate that the Quantifiler target lies within one of these long fragments.
While much less dramatic, late-start reduction also occurs with other assays. Figure 3 displays the percent of late-start cdPCR chambers and rain droplets, averaged over the eight assays and four DNAs. In cdPCR, the greatest reduction in the number of late-starts is with the enzymes that yield the smallest fragments. In ddPCR, all four enzymes yield the same small difference between rain in the untreated and enzyme-treated DNAs. This difference in enzyme-linked performance between the two platforms suggests that targets are more accessible in droplets than in chambers.
Figure 3.
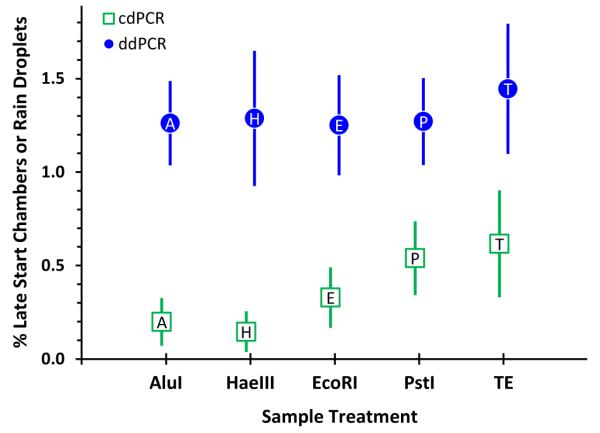
Percentage of cdPCR late-start chambers and ddPCR rain droplets. Each symbol represents the median of replicate determinations of eight assays and four DNAs; the label within each symbol is the first character of the enzyme name. The bars span approximate 95% confidence intervals about the medians. Later-starts and rain were estimated as described for Figure 2.
The marginal difference between the cut and untreated DNAs with ddPCR suggests that accessibility is not a major cause of droplet rain. However, it should be considered as a potential cause of droplet rain along with droplet size differences, coagulation, incomplete mixing of droplet reagents, and target sequence variants.18
Fragmentation and decreased amplifiability
While enzymatic fragmentation decreases the proportion of late-start chambers and rain droplets relative to untreated DNA, for the NIST-developed assays it almost always decreases the number of those positives. Figure 4 displays the change in λ for the four enzymatic treatments, λtreat, relative to the untreated materials, λTE. We attribute the decrease in λ to decreased target amplifiability. That is, damage to targets that prevents their amplification.
Figure 4.
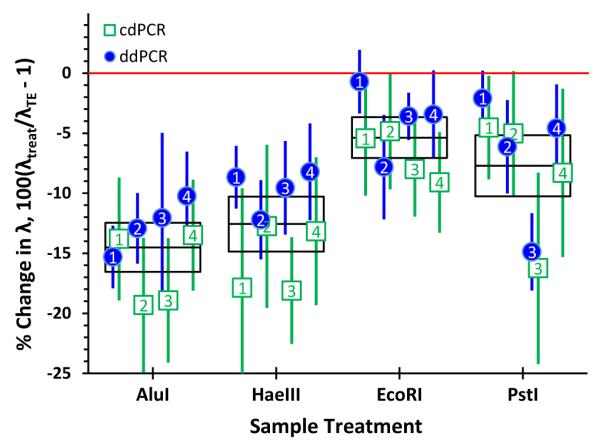
Change in the average number targets per partition, λ, of enzyme-treated relative to untreated genomic DNA. Each symbol represents the mean of replicate determinations of eight assays and four DNAs. The label within each symbol is the last character of the material’s name. The bars span approximate 95% confidence intervals about the means. The boxes enclose the central 50 % of the combined cdPCR and ddPCR results, with the central line marking the median of the combined distribution.
The reduction in positive partitions in both cdPCR and ddPCR is greatest for the enzymes that produce the smallest fragments. However, the PstI results suggest that the magnitude of reduction can be specific to each sample and enzyme combination. Unlike the accessibility evidence presented in Figure 3, there is no systematic difference in the enzyme linked loss of amplifiability between the cdPCR and ddPCR platforms.
While the relatively consistent differences between the enzymes suggests that the observed loss in amplifiability could be non-specific restriction either from the enzyme itself or DNAase impurities, this does not appear to be the primary cause of target loss. Figure 5 displays the relative change in λ between cut, λtreat, and sham-cut, λsham, samples (that is, samples treated exactly the same as the cut materials but using enzyme that had been thoroughly deactivated). Only for HaeIII is the reduction in targets reproducibly greater in the cut than in the sham-cut materials.
Figure 5.
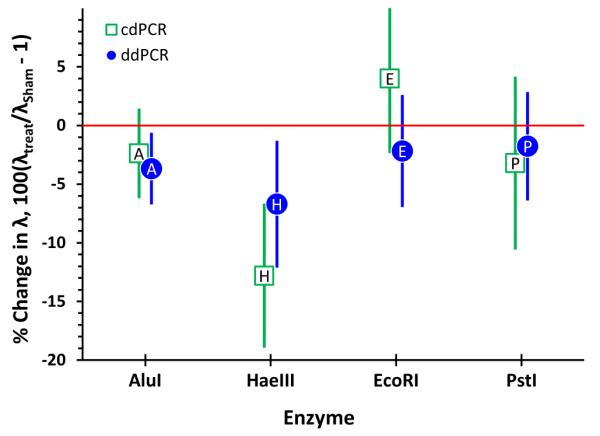
Change in the average number targets per partition, λ, of cut relative to sham-cut DNA. Each symbol represents the mean of replicate determinations of three assays and one or two DNAs. The label within each symbol is the first character of the restriction enzyme name. The bars span approximate 95% confidence intervals about the means.
Neither the buffer system used during restriction (see Table 3) nor its concentration in the final sample mixture seem related to amplifiability. We speculate that the loss of amplifiable targets may be related to mechanical damage during the extra sample manipulation required to cut DNA and possible irreversible conformational changes induced by the restriction process.
Differences among assays
Figure 6 displays the relative λ differences for each assay, λassay, relative to the mean, λmean, of the NIST assays for each DNA with each platform. The eight NIST assays have been optimized to have few late-start chambers or rain droplets with untreated DNA and to maximize λ for given samples on a given platform. Four of these assays were modified from their original qPCR implementations to achieve these goals. Seven successful qPCR assays did not translate well to dPCR.
Figure 6.
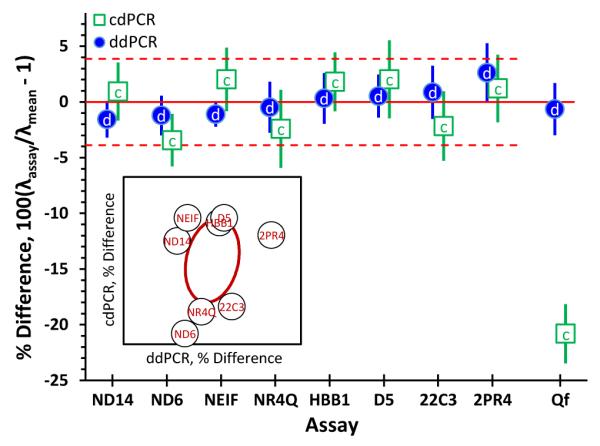
Differences between average number of targets per partition per assay, λ, relative to the mean λ of the NIST assays for a given DNA and platform. Each symbol represents the mean of replicate determinations of four DNAs. The label within each symbol is the first character of the dPCR platform. The bars span approximate 95% confidence intervals about the means. The dashed horizontal lines around the solid zero-difference line denote the 95 % confidence between-assay relative precision. The Quantifiler results displayed along the right edge are not used in estimating the confidence interval. The inset scattergram plots ddPCR differences against cdPCR for the NIST assays; the central ellipse within the inset bounds the joint 95% confidence region.
The 20% difference between the Quantifiler cdPCR and ddPCR results demonstrates that dPCR assays can have significant between-platform bias. For the eight NIST assays with samples of λ from 0.16 to 0.60, the 95 % confidence between-assay relative precision is 4 %. The lack of correlation between the cdPCR and ddPCR differences for these eight assays suggests that this variability cannot be assigned to assay- or platform-specific bias but rather represents the expected limiting imprecision among well-optimized dPCR assays.
CONCLUSIONS
dPCR systems do not directly assess the total number of targets originally in a sample, they assess only those targets that are accessible and amplifiable. Since any and every manipulation of a DNA extract may damage or destroy targets, ideally sample materials should not be enzymatically cut or otherwise fragmented before analysis. However, dPCR assays must either be confirmed to work efficiently with untreated material or the fraction of targets made inaccessible during fragmentation must be quantitatively determined. Both goals can be accomplished by comparing λ for untreated and enzyme-cut genomic DNAs. We have investigated only four of the many readily available restriction enzymes; based on this limited experience, we find that enzymes giving mean fragment lengths of several thousand bp do less damage than those that cut DNA into smaller fragments.
Since different PCR assays measure different targets, no single PCR assay is likely to provide sufficiently definitive dPCR results for accurate characterization of the amount of human genomic DNA. Results from several assays, with targets on different chromosomes, are needed to adequately characterize the assay variability.
While any successful qPCR assay is a reasonable candidate for use in dPCR, it must be separately validated for each dPCR platform used. Successful implementation in one platform does not necessarily imply success in another. We chose not to use assays unless they perform well in both our cdPCR and ddPCR systems. Among the more basic criteria of stability, acceptable linearity, good repeatability, and truly negative NTCs we require that there be: 1) few late-starts and little rain, 2) distinct separation between the signals for negative and positive partitions, 3) reasonable agreement among assays within each platform for several genomic DNAs from different donors, and 4) a consistent relationship between the cdPCR and ddPCR λ estimates. While we wish to directly compare cdPCR and ddPCR copy concentration estimates, meaningful characterization will require improved assessment of chamber and droplet volumes.
Supplementary Material
ACKNOWLEDGMENT
This work was supported in part through the NIST Special Programs Office. We thank Katherine Sharpless for her assistance in preparing this document and the anonymous reviewers of an earlier version of this report who requested detailed comparisons between cdPCR and ddPCR systems.
Footnotes
-
a)TAA_dMIQE Checklist.pdf: Table of “essential”dMIQE information,
-
b)TAA_Graphics_cd_Cut.PDF: Exemplar cdPCR graphics for enzyme-cut DNAs
-
c)TAA_Graphics_dd_Cut.PDF: Exemplar ddPCR graphics for enzyme-cut DNAs
-
d)TAA_Graphics_cd&dd_Sham-cut.PDF: Exemplar cdPCR and ddPCR for sham-cut DNAs
-
e)TAA_Gel Images.PDF: Gel images for cut and sham-cut DNAs
-
f)TAA_Files used in Figures.zip: Export .csv files for all analyses used in Figures.
Author Contributions
The manuscript was written with contributions of all authors. All authors have given approval to the final version of the manuscript.
DISCLAMER
Certain commercial equipment, instruments, or materials are identified in this report to specify adequately experimental conditions or reported results. Such identification does not imply recommendation or endorsement by the National Institute of Standards and Technology, nor does it imply that the equipment, instruments, or materials identified are necessarily the best available for the purpose.
REFERENCES
- 1.Kline MC, Duewer DL, Redman JW, Butler JM. Anal Chem. 2003;75(10):2463–2469. doi: 10.1021/ac026410i. [DOI] [PubMed] [Google Scholar]
- 2.JCGM . 200:2012 International vocabulary of metrology –Basic and general concepts and associated terms (VIM) Joint Committee for Guides in Metrology; Sèvres, France: 2012. http://www.bipm.org/en/publications/guides/vim.html. [Google Scholar]
- 3.De Bièvre P, Dybkaer R, Fajgelj A, Hibbert DB. Pure Appl Chem. 2011;83(10):1873–1935. [Google Scholar]
- 4.Fisher RA. Philos Trans R Soc Lond Ser A. 1922;222:309–368. [Google Scholar]
- 5.Fazekas de St Groth S. J Immunol Methods. 1982:49-R11–R23. doi: 10.1016/0022-1759(82)90269-1. [DOI] [PubMed] [Google Scholar]
- 6.Sykes PJ, Neoh SH, Brisco MJ, Hughes E, Condon J, Morley AA. Biotechniques. 1992;13(3):444–449. [PubMed] [Google Scholar]
- 7.Vogelstein B, Kinzler KW. Proc Natl Acad Sci USA. 1999;96:9236–9241. doi: 10.1073/pnas.96.16.9236. [DOI] [PMC free article] [PubMed] [Google Scholar]
- 8.Huggett JF, Foy CA, Benes V, Emslie K, Garson JA, Haynes R, Hellemans J, Kubista M, Mueller RD, Nolan T, Pfaffl MW, Shipley GL, Vandesompele J, Wittwer CT, Bustin SA. Clin Chem. 2013;59(6):892–902. doi: 10.1373/clinchem.2013.206375. [DOI] [PubMed] [Google Scholar]
- 9.Huggett JF, Cowen S, Foy CA. Clin Chem. 2015;61(1):79–88. doi: 10.1373/clinchem.2014.221366. [DOI] [PubMed] [Google Scholar]
- 10.Burke DG, Dong L, Bhat S, Forbes-Smith M, Fu S, Pinheiro L, Jing W, Emslie KR. Anal Chem. 2013;85(3):1657–1664. doi: 10.1021/ac302925f. [DOI] [PubMed] [Google Scholar]
- 11.Sambrook J, Russell DW. Molecular cloning a laboratory manual. Cold Spring Harbor Laboratory Press; Cold Spring Harbor, New York: 2001. [Google Scholar]
- 12.NIST SRM 2390 – DNA Profiling Standard. https://www-s.nist.gov/srmors/view_detail.cfm?srm=2390.
- 13.Kline MC, Duewer DL, Travis JC, Smith MV, Redman JW, Vallone PM, Decker AE, Butler JM. Anal Bioanal Chem. 2009;394(4):1183–1192. doi: 10.1007/s00216-009-2782-0. [DOI] [PubMed] [Google Scholar]
- 14.Miller SA, Dykes DD, Polesky HF. Nucleic Acids Res. 1988;16(3):1215. doi: 10.1093/nar/16.3.1215. [DOI] [PMC free article] [PubMed] [Google Scholar]
- 15.Applied Biosystems . Quantifiler human DNA quantitation kit and Quantifiler Y human male DNA quantitation kit user’s manual, Part Number 4344790 Rev A. Foster City, CA: 2003. [Google Scholar]
- 16.NCBI Standard Nucleotide BLAST. https://blast.ncbi.nlm.nih.gov/Blast.cgi?PAGE_TYPE=BlastSearch.
- 17.Warren LA, Weinstein JA, Quake SR. The Digital Array Response Curve. 2007 http://thebigone.stanford.edu/papers/Weinstein%20DigResCurve.pdf.
- 18.Fuchs R, Blakesley R. Methods Enzymol. 1983;100:3–38. doi: 10.1016/0076-6879(83)00043-9. [DOI] [PubMed] [Google Scholar]
- 19.Duewer DL, Kline MC, Romsos EL. Anal Bioanal Chem. 2015;407:9061–9069. doi: 10.1007/s00216-015-9073-8. [DOI] [PMC free article] [PubMed] [Google Scholar]
- 20.Trypsteen W, Vynck M, De Neve J, Bonczkowski P, Kiselinova M, Malatinkova E, Vervisch K, Thas O, Vandekerckhove L, De Spiegelaere W. Anal Bioanal Chem. 2015;407(19):5827–5834. doi: 10.1007/s00216-015-8773-4. [DOI] [PubMed] [Google Scholar]
Associated Data
This section collects any data citations, data availability statements, or supplementary materials included in this article.


