Abstract
Reversible protein phosphorylation is an essential cellular regulatory mechanism. Many proteins integrate and are modulated by multiple phosphorylation events derived from complex signaling cues. Simultaneous detection and quantification of temporal changes in all of a protein's phosphorylation sites could provide not only an immediate assessment of a known biochemical activity but also important insights into molecular signaling mechanisms. Here we show the use of stable isotope-based quantitative MS to globally monitor the kinetics of complex, ordered phosphorylation events on protein players in the canonical mitogen-activated protein kinase signaling pathway. In excellent agreement with activity assays and phosphospecific immunoblotting with the same samples, we quantified epidermal growth factor-induced changes in nine phosphorylation sites in the extracellular signal-regulated kinase (ERK)/p90 ribosomal S6 kinase-signaling cassette. Additionally, we monitored 14 previously uncharacterized and six known phosphorylation events after phorbol ester stimulation in the ERK/p90 ribosomal S6 kinase-signaling targets, the tuberous sclerosis complex (TSC) tumor suppressors TSC1 and TSC2. By using quantitative phosphorylation profiling in conjunction with pharmacological kinase inhibitors we uncovered a ERK-independent, protein kinase C-dependent pathway to TSC2 phosphorylation. These results establish quantitative phosphorylation profiling as a means to simultaneously identify, quantify, and delineate the kinetic changes of ordered phosphorylation events on a given protein and defines parameters for the rapid discovery of important in vivo phosphoregulatory mechanisms.
Keywords: extracellular signal-regulated kinase, quantitative mass spectrometry, stable isotope labeling, signal transduction
Temporal changes in protein phosphorylation can precipitate dramatic biological consequences. Pioneering methods to study reversible phosphorylation, such as phosphopeptide mapping of proteins from 32P phosphate-labeled cells and the generation of phosphorylation site-specific antibodies have been and continue to be invaluable to the field of signal transduction. In recent years, MS has become the tool of choice for initial identification of phosphorylation sites, and recent targeted MS-based approaches have permitted the absolute quantification of known phosphorylation events (1). Although knowing the state of phosphorylation of proteins at certain residues can give great predictive power with regard to protein function, it is ultimately the sum of modifications (phosphorylation and other) that most accurately defines a protein's biochemical state. Multiple targeted approaches can be labor intensive or costly. Furthermore, the transition of a protein from an inactive to an active state may require multiple stepwise modifications with different states of phosphorylation representing entirely different biochemical capacities. Thus, methods to globally quantify temporal changes in protein phosphorylation states are required to fully elucidate molecular signaling mechanisms. Such methods are of particular import when sites of protein modification are unknown, unanticipated, or coordinately regulated.
Recent advances made by using stable-isotope labeling by amino acids in cell culture (SILAC) (2, 3) have enabled quantification of growth factor-induced changes in a protein's general state of tyrosine phosphorylation (4) and the monitoring of changes in specific phosphorylation sites induced by a protein phosphatase inhibitor (5). Building on these important steps, we asked whether such methods could accurately profile the complex series of known phosphorylation events occurring in a core signaling pathway after the exposure of cells to a defined biological stimulus. Additionally, as the use of phosphospecific antibodies has become a workhorse tool for evaluating specific perturbations in a protein's phosphorylation state, we compared MS-based quantification with results obtained by using a panel of phosphospecific antibodies known to recognize mitogen-induced phosphorylation events.
By using SILAC and a Fourier transform-ion cyclotron resonance/ion trap hybrid mass spectrometer, we quantified acute changes in a linear signaling cascade involving the extracellular signal-regulated kinase 2 (ERK2), the 90-kDa ribosomal S6 kinase (RSK)1, and the tuberous sclerosis complex (TSC) tumor suppressor proteins TSC1 and TSC2.
In excellent agreement with results we obtained in parallel by using activity assays and phosphospecific immunoblotting, we profiled all known mitogen-induced phosphorylation events critical to ERK2 and RSK1 activation. Additionally, phosphorylation profiling of TSC1 and TSC2 quantified temporal changes in 20 phosphorylation sites, 14 of which were previously uncharacterized. The use of specific kinase inhibitors provided an initial assignment of the signaling pathways responsible for a specific phosphorylation event in TSC2. These results establish this strategy as a rapid method to globally identify and profile meaningful changes in a given protein's phosphorylation state in response to acute biological stimuli and as a way to delineate signaling events by employing specific pharmacological inhibitors.
Materials and Methods
Cell Culture, Stable-Isotope Labeling, Plasmids, and Transfections. Human embryonic kidney 293E cells were cultured for >5 days in DMEM formulated with either unlabeled l-Lys and l-Arg or labeled [13C6, 15N2]l-Lys and [13C6]l-Arg (Cambridge Isotope Laboratories, Cambridge, MA) at 0.04 mg/ml and 0.1 mg/ml, respectively, and supplemented with 10% dialyzed heat-inactivated FBS (Invitrogen), 50 units/ml penicillin, and 50 μg/ml streptomycin. Transfections of plasmid DNA were performed by using calcium phosphate precipitation. Briefly, the day before transfection, 2.5 × 10⁶ cells were seeded in each 10-cm dish. For each time point, two dishes of unlabeled cells and two dishes of labeled cells were transfected with 5-10 μg of plasmid DNA per dish. The precipitate was washed away after 6 h with warm PBS, and the cells were starved in labeling media containing 0.5% FBS for 24 h before stimulation with 25 ng/ml EGF (Invitrogen) or 100 ng/ml phorbol 12-myristate 13-acetate (PMA; Biomol, Plymouth Meeting, PA) for the indicated time points. Further quiescence of signaling pathways may be achieved by starvation in no serum. However, starvation in 0.5% serum was used to obtain a low amount of basal phosphorylation and thus assist in the identification of low-abundance phosphopeptides from unstimulated samples. Pretreatment with inhibitors 10 μM U0126 (Biomol) and 5 μM bisindolylmaleimide I (BIM; Biomol) was for 30 min. GST-S6 contains Lys-218/Lys-249 of rat S6 in pGEX-3X. pCDNA3-hemagglutinin (HA)-ERK2 (rat) was constructed by D. Fingar (University of Michigan Medical School, Ann Arbor) from cDNA in pCEP4L-HA-ERK2 obtained from M. Cobb (University of Texas Southwestern, Dallas). pKH3-RSK1 (human) (6), pRK7-FLAG-TSC1, pRK7-FLAG-TSC2 (human) (7), and pGEX-2T-RSK1 (avian)-D2 Lys-464-Arg (8) have been described.
Cell Lysis, Immunoprecipitations, Immunoblots, Antibodies, Immune Complex Kinase Assays, and In-Gel Digests. Cells were lysed as described in ref. 6. Immunoprecipitations were performed as described in ref. 9, except that immune complexes were washed three times in lysis buffer. After washing, the immune complexes were resuspended in 5 mM DTT and 50 mM ammonium bicarbonate (pH 8.0), boiled for 5 min, and left at room temperature for 30 min. Alkylation of Cys residues was then performed for ERK2 and RSK1 in 60 mM iodoacetamide and 50 mM ammonium bicarbonate (pH 8.0) for 1 h at room temperature in the dark. Samples were boiled in sample buffer (containing 2-mercaptoethanol at 5% vol/vol) and resolved by using SDS/PAGE for Coomassie staining and in-gel digests with trypsin (10) or immunoblotting. Immunoblots (6) and immune complex kinase reactions (9) were performed as described. Kinase substrates were either GST-S6 or GST-RSK1-D2 (K/R) as indicated. Antibodies were from the indicated sources: anti-RSK1 (11); ERK1 and ERK2 anti-pThr-202,pTyr-204 (Sigma); RSK anti-pSer-221, anti-pSer-363, anti-pSer-380, and anti-pThr-573 (R & D Systems); RSK anti-pThr-359, pSer-363, and anti-pAkt-substrate (Cell Signaling Technology, Beverly, MA); RSK anti-pSer-732 (BioSource International, Camarillo, CA).
MS and Spectral Analysis. Liquid chromatography tandem MS (LC-MS/MS) was performed by using a 7-T LTQ FT hybrid mass spectrometer (Thermo Electron, San José, CA). Peptides were transferred to the resolving column with a capillary autosampler (FAMOS, LC Packings, The Netherlands) and Agilent 1100 series binary HPLC pumps, with an in-line flow splitter. Peptides were delivered onto a 125-μm (inner diameter) resolving column packed with 17 cm of reverse-phase MagicC18 material (5 μm, 200 Å; Michrom Bioresources, Auburn, CA). Peptides were loaded onto the resolving column for 15 min at 120 bar (1 bar = 100 kPa) (≈1 μl/min) in buffer A (2.5% acetonitrile/0.15% formic acid). Peptides were then resolved stepwise by first applying a gradient of 0-5% buffer B (97.5% acetonitrile/0.15% formic acid) and by decreasing the pressure from 120 to 60 bar over 1 min (≈500 nl/min). Peptides were further resolved between 5% and 33% buffer B at 60 bar over 40 min. Ten LTQ MS/MS spectra were acquired per cycle in a data-dependent fashion from a preceding Fourier transform MS scan (400-1,800 m/z at 100,000 resolution with dynamic exclusion). Raw data were searched with no enzyme specificity against a database containing the sequence for the protein under study by using sequest set to a mass tolerance of 1.1 Da. Fully tryptic phosphopeptides with mass accuracies of <10 ppm were manually validated to assign phosphorylation sites. Relative abundances of each phoshopeptide were calculated by using the areas under the curves of the monoisotopic peaks as described in Fig. 7, which is published as supporting information on the PNAS web site.
Results
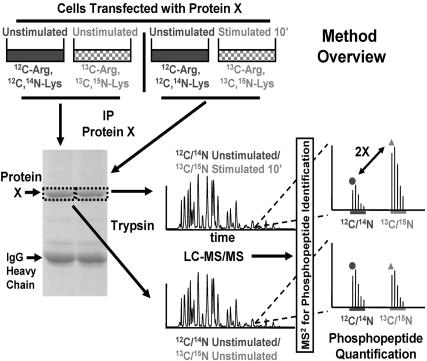
Phosphorylation Profiling of ERK2 After EGF Stimulation: Analysis of a Single-Step Activation Mechanism. ERK1 and ERK2 are the canonical mitogen-activated protein kinases and are activated in response to numerous extracellular stimuli (12). ERK1 and ERK2 become fully active after two phosphorylation events in their respective activation loops by dual-specificity mitogen-activated protein kinase kinase 1 or 2 (12). Given the rapid activation and subsequent inactivation kinetics of ERK after the stimulation of many cell types with EGF and the simple phosphorylation-dependent activation mechanism of ERK by a single kinase, we reasoned that EGF stimulation of ERKs would be an ideal signaling system to initially test our ability to perform phosphorylation profiling by standard biochemical techniques and quantitative MS. An overview of our method is presented in Fig. 1 and is similar in concept to that reported by Ibarrola et al. (5).
Fig. 1.
Method overview. Equal amounts of cells are grown in normal media or stable-isotope labeling media containing [13C6]Arg and [13C6, 15N2]Lys. All cells are then transfected with a given “protein X” under study. Sets of unlabeled and labeled cells are grouped, and acute stimulation with a biological factor is performed for different times (here, 0 and 10 min) on the labeled (here, on the labeled cells for 10 min) or unlabeled cells, exclusively. Cells are then lysed, and equal quantities of lysate from unstimulated and stimulated cells are mixed. Protein X is immunoprecipitated (IP) and subjected to SDS/PAGE. The band for protein X is excised and digested with trypsin. The resultant mixture of labeled and unlabeled peptides from each stimulation time point is subjected to LC-MS/MS. Full MS scans are detected in the Fourier transform-ion cyclotron resonance cell, and MS/MS analysis is performed in the linear ion trap. The data from the MS/MS scans are searched by using sequest against the sequence for protein X to identify (phosphorylated and nonphosphorylated) peptides. A return to the MS scans containing the identified peptide reveals its respective isotopic envelope as well as the envelope of its labeled counterpart, separated by an appropriate m/z. The ratio of labeled to unlabeled peptide (measured here by using the area under the unlabeled and labeled monoisotopic peaks) at time 0 is compared with the same ratio for the peptide at any given point in time after stimulation. This example depicts a 2-fold increase in the relative phosphopeptide abundance.
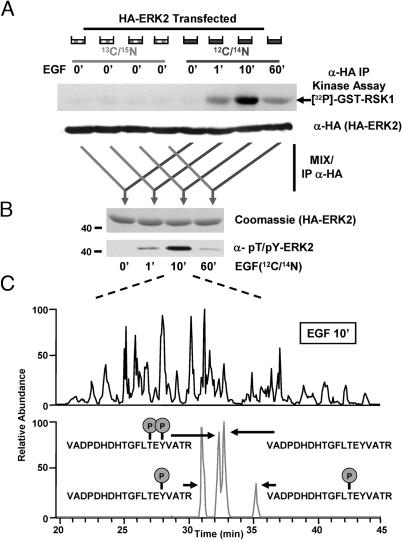
Human embryonic kidney 293 cells were either unlabeled or metabolically labeled for >5 days with [13C6, 15N2]Lys and [13C6]Arg. Because the cells are labeled to completion before transfection and the start of the experiment, the only differences between the two proteomes are protein mass differences due to the form of incorporated Arg and Lys. All cells were then transfected with a HA-ERK2 expression construct and starved in low serum. Unlabeled cells were stimulated with EGF for 0, 1, 10, or 60 min. Labeled cells were left unstimulated. All cells were then lysed, and the extracts were subjected to anti-HA immune complex kinase assays or immunoblotting (Fig. 2A). HA-ERK2 kinase activity peaked at 10 min after EGF stimulation in the unlabeled cells, indicative of a time point containing the highest concentration of doubly phosphorylated HA-ERK2.
Fig. 2.
Phosphorylation profiling of ERK2 after EGF stimulation. (A) Unlabeled cells or cells metabolically labeled with [13C6, 15N2]Lys and [13C6]Arg were transfected with an expression construct for HA-ERK2. Cells were then stimulated with EGF for the indicated time points. Cells were lysed, and a portion of each extract was subjected to either anti-HA immune complex kinase reactions (Upper) or anti-HA immunoblotting (Lower). (B) Equivalent amounts of unstimulated, labeled extract were mixed with stimulated unlabeled extract, and HA-ERK2 was immunoprecipitated. Portions of the immune complexes were subjected to SDS/PAGE and visualization by either Coomassie blue-staining (Upper) or immunoblotting by using phosphospecific antibodies to dually phosphorylated, activated ERK2 (Lower). (C) (Upper) Base peak chromatogram of a tryptic digest of the HA-ERK2 mixed sample (shown in B) containing peptides from the unstimulated, labeled state and the 10′ EGF-stimulated, unlabeled state. (Lower) The same chromatogram reduced to show only mass ranges of the unphosphorylated and phosphorylated peptides (± 5 ppm) derived from the activation loop of ERK2. Specific assignments for each peak were determined by using accurate mass measurements and the elution times at which MS/MS sequencing data were obtained for each peptide.
To measure the relative abundance of doubly phosphorylated HA-ERK2 with existing technologies and quantitative MS, stimulated (unlabeled) extracts were combined with an equal amount of unstimulated (labeled) extract. These mixtures were then subjected to anti-HA immunoprecipitation. Resultant immune complexes were resolved by SDS/PAGE and analyzed either by immunoblotting with a phosphospecific antibody that selectively recognizes doubly phosphorylated ERK2 or by Coomassie staining (Fig. 2B) and quantitative MS. The signal obtained from Western blotting with the phosphospecific ERK2 antibody was in good agreement with the corresponding levels of ERK2 phosphotransferase activity.
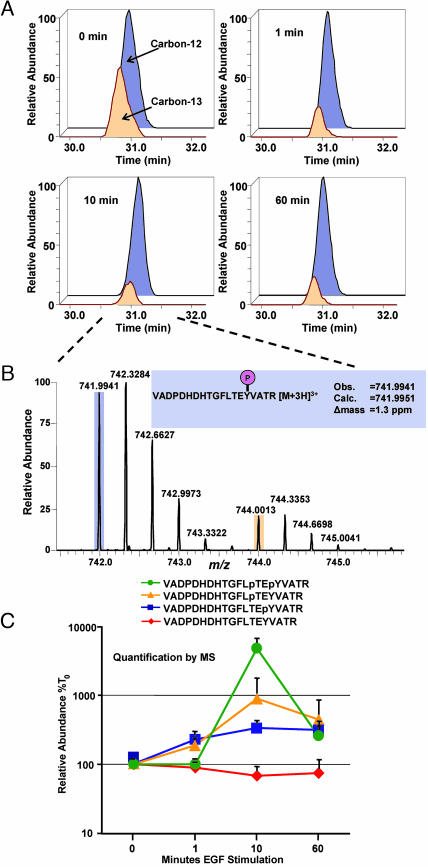
The Fourier transform-ion cyclotron resonance cell was used for detecting ions during MS analysis (Fig. 2C). The top 10 most abundant ions for each MS scan were selected for MS/MS analysis in the linear ion trap because of its high scan rate. Three distinct phosphopeptides were identified, each derived from a tryptic fragment of the kinase activation loop, VADPDHDHTGFLTEY- VATR, with Thr and Tyr residues (shown in italics) found independently or dually phosphorylated. The elution profile observed in the MS analysis (Fig. 2C Lower) for each of the phosphopeptides showed sufficient resolution for quantification. It is important to note that a simple comparison of the relative abundances of peptides as a function of elution time cannot guarantee reliable quantification results because they can be confounded by many factors, such as coeluting peptide species and differences in ionization efficiency. The relative abundance of unlabeled to labeled peptide was determined in m/z space for each time point after EGF stimulation. This ratio was achieved by comparing the areas under the curve for the detected monoisotopic masses (see Fig. 7 for additional information on quantification). Fig. 3A shows the quantification of the temporal profile of the Tyr monophosphorylated peptide of ERK2. The observed isotopic envelopes for this phosphopeptide after 10 min of EGF stimulation are depicted in Fig. 3B. After a repetition with EGF stimulation performed on the labeled cells, changes in the ratios of each phosphopeptide and the corresponding unphosphorylated peptide were graphed (Fig. 3C). Importantly, labeled cells were equally responsive to stimulus. As predicted, EGF stimulated an increased abundance in each of the three phosphopeptides, peaking at the 10-min time point and correlating perfectly with the activity assays and the phosphospecific immunoblot (Fig. 2).
Fig. 3.
Relative abundance of labeled to unlabeled phosphopeptides enables their quantitative and temporal profiling. (A) Measured areas of the unlabeled (741.9941 ± 5 ppm) and labeled (744.0013 ± 5 ppm) monoisotopic peaks for the monophosphorylated, phosphotyrosyl-peptide in the ERK2 activation loop are presented for each time point after EGF stimulation as indicated. (B) The measured isotopic envelopes for the same phosphopeptide are shown after 10 min of EGF stimulation. Note the separation in m/z space of the unlabeled and labeled peptides. (C) After a repetition of the experiment with EGF stimulation occurring on the labeled samples, the relative abundance ratios at each time point for each peptide were calculated. Error bars denote the standard deviation of the mean.
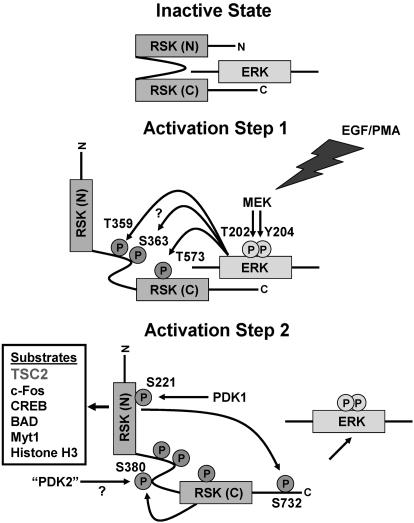
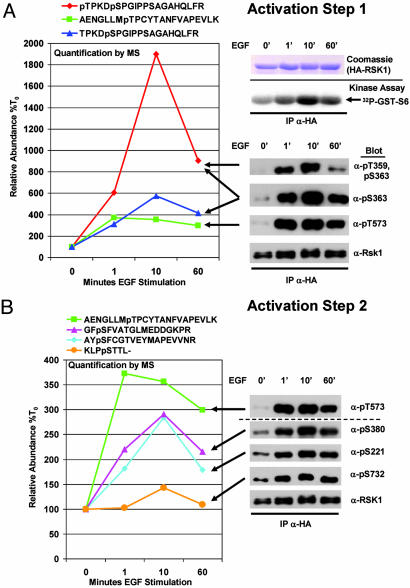
Phosphorylation Profiling of RSK1 After EGF Stimulation: Analysis of a Two-Step Activation Mechanism. The relative simplicity of ERK2 activation is in contrast to the multistepped activation of other kinases, such as the ERK2 substrates of the RSK family. The prototypical family member, RSK1, is activated after two primary activation steps. These two steps involve six ordered phosphorylation events, executed by at least four distinct kinase activities (Fig. 4) (12). To test the ability of quantitative MS methods to profile the kinetics of these six phosphorylation events after the introduction of a biological stimulus, we analyzed HA-RSK1 as was done for HA-ERK2. All of the six known mitogen-induced phosphorylation events were identified and quantified at each time point. Additionally, a previously uncharacterized phosphorylation site was identified (Fig. 8, which is published as supporting information on the PNAS web site). The phosphopeptide identified containing the previously uncharacterized phosphorylation site in RSK1 (pS369) did not increase in response to EGF stimulation (data not shown). Quantification of temporal changes in the six regulatory sites showed a strong correlation with the kinetics of the two activation steps of RSK1 as judged by immune complex kinase assays and immunoblotting with a panel of RSK1-phosphospecific antibodies (Fig. 5). The precision of these methods to profile the differential phosphorylation kinetics is particularly evident in Fig. 5B when comparing the most rapid initiating event (phosphorylation at Thr-573) with the slowest event (phosphorylation at Ser-732).
Fig. 4.
Ordered phosphorylation events occur in two main activation steps to fully activate RSK1. In its inactive state, RSK1 is in a complex with inactive ERK1 or ERK2. In activation step one, a variety of extracellular stimuli activate ERK1 and ERK2. Active ERK1 and ERK2 phosphorylate Thr-573 in the activation loop of the carboxyl-terminal kinase domain of RSK1, which leads to the phosphorylation of two sites in its linker region by ERKs or other kinases. Phosphorylation in the linker region is thought to unfold the kinase, priming it for the final activation step. In activation step two, the carboxyl-terminal kinase domain (and/or a putative 3-phosphoinositide-dependent kinase, “PDK2”) phosphorylates Ser-380 and thereby increases the docking of 3-phosphoinositide-dependent kinase-1 (PDK1), which phosphorylates Ser-221 in the activation loop of the amino-terminal kinase domain of RSK1. The final event is autophosphorylation of the carboxyl-terminus by the amino-terminal kinase domain. This event releases ERK, and fully active RSK1 finds a growing number of known substrates located throughout the cell. MEK, mitogen-activated protein kinase kinase; CREB, cAMP response element binding protein.
Fig. 5.
Phosphorylation profiling of RSK1 after EGF stimulation. HA-tagged RSK1 was expressed in labeled and unlabeled cells, and EGF stimulations for the indicated times were performed as was done for ERK2 as indicated. (A) (Right Upper) Anti-HA immune complexes of mixed labeled and unlabeled RSK1 were subjected to SDS/PAGE and visualized by staining with Coomassie blue. (Right Lower) Anti-HA immune complex kinase assays of stimulated extracts show peak RSK1 activity at 10 min after EGF stimulation. (Left) Phosphopeptide quantifications are depicted in the graph, and arrows indicate their relationship to corresponding phosphospecific antibody blots for the indicated sites occurring in activation step 1. (B) Phosphorylation profiling of activation step 2 was performed as for step 1. Duplication of the data for pThr-573 is provided to emphasize the kinetic differences between activation steps 1 and 2.
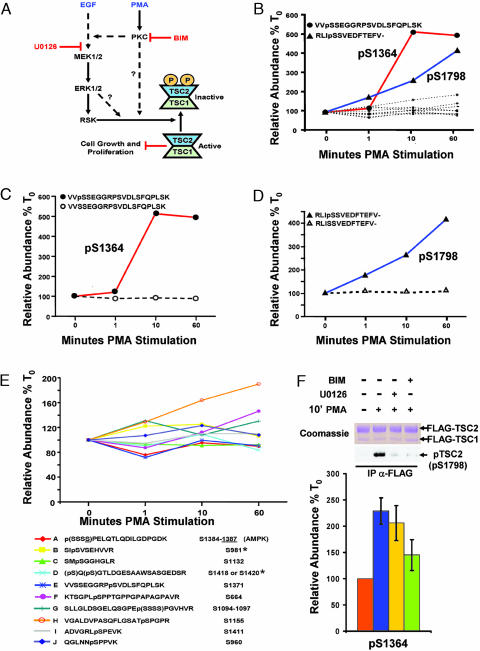
Phosphorylation Profiling of the ERK-RSK Targets, TSC1 and TSC2. Together, our data indicate that phosphorylation profiling by MS is very effective to accurately monitor known phosphorylation sites after cell stimulation. Characterization of a simple (ERK2) and complex (RSK1) phosphoprotein by phosphorylation profiling indicated the remarkable amenability of the technique for variably complex phosphoproteins. We then profiled poorly characterized phosphoproteins, TSC1 and TSC2, by using a similar technique. TSC1 and TSC2 are important integrators of signaling pathways regulating cell growth and proliferation (13). We recently showed RSK1 phosphorylation of Ser-1798 in TSC2 as a mechanism to negatively regulate its suppression of cell growth and proliferation (Fig. 6A) (14). TSC2 is also negatively regulated by phosphoinositide 3-kinase/Akt signaling (13) and is positively regulated by the AMP-activated protein kinase (AMPK) (15). Our previous work used the tumor-promoting phorbol ester PMA to selectively activate ERK-RSK signaling by means of PKC isoforms without activating Akt (14). In the course of that study, we observed previously unidentified phosphorylation sites in TSC1 and TSC2 that did not fit the minimal consensus target for RSK, Akt, or AMP-activated protein kinase (P.P.R., B.A.B., R. Anjum, S.P.G., and J.B., unpublished observations). We therefore queried whether PMA might dynamically regulate additional sites in TSC1 and TSC2. By using MS, we identified and profiled 12 phosphopeptides in TSC2 (Fig. 6 B-D). Eight of these sites have not to our knowledge been previously reported. In addition to the peptide containing pSer-1798, we found that PMA induced a marked increase in the relative abundance of a phosphopeptide containing pSer-1364 (the MS/MS spectrum of which is presented in Fig. 9, which is published as supporting information on the PNAS web site). Quantitative MS analyses of these two phosphopeptides along with their unphosphorylated counterparts are shown in Fig. 6 C and D. Fig. 6E presents phosphorylation profiles of the additional TSC2 phosphopeptides that did not show an increase of >2-fold. Phosphorylation profiling of TSC1 was performed on six novel and two known phosphopeptides (Fig. 10, which is published as supporting information on the PNAS web site). Although some of these phosphopeptides showed intriguing trends suggestive of regulation, their relative inductions were much less than those observed for phosphorylation of either Ser-1364 or Ser-1798 of TSC2 under the conditions studied.
Fig. 6.
Phosphorylation profiling of TSC2 after PMA stimulation. (A) Signaling diagram indicating PKC- and mitogen-activated protein kinase-dependent phosphoregulation of TSC1 and TSC2. Also indicated are the positions in the pathways where indicated pharmacological inhibitors are exerting their effects. (B) Quantification of changes in 12 TSC2 phosphopeptides over the time course of PMA stimulation from one run for each time point. Emphasis is placed on the two phosphopeptides (containing pSer-1364 and pSer-1798, respectively) showing a marked increase after PMA stimulation. (C-D) These phosphopeptides are graphed relative to the corresponding changes in their unphosphorylated counterparts. (E) Further examination of the TSC2 phosphopeptides from B that did not show large changes after PMA stimulation. When the MS/MS spectrum could not distinguish the precise site of phosphorylation, the possible sites allowed by the data were placed in parentheses. AMP-activated protein kinase has been shown to phosphorylate Ser-1387 in vivo, all other sites have not previously been reported, except for those marked with an asterisk, which have been shown to be phosphorylated by Akt in vitro. Human numbering is used for reference. (F) Pharmacological inhibitors define a previously uncharacterized PKC-dependent pathway to TSC2. Labeled and unlabeled cells transfected with FLAG-TSC1 and FLAG-TSC2 were starved and either left unstimulated or stimulated with PMA for 10 min with or without pretreatment for 30 min with the indicated inhibitors. Mixed extracts were immunoprecipitated with anti-FLAG antibodies and subjected to SDS/PAGE and either Coomassie staining for phosphorylation profiling or immunoblotting for TSC2 pSer-1798 with a phosphospecific motif antibody (as defined in ref. 14). Quantification of the tryptic peptide harboring pSer-1798 is shown as the average of three experiments; in two of the experiments, the stimulation was performed on the labeled cells, and, for the other experiment, the stimulation was performed on the unlabeled cells. Error bars denote the standard error of the mean. For the comparison between PMA stimulation with no drug and PMA stimulation with BIM, P = 0.05 for a one-tailed Student's t test.
To further define the kinase responsible for Ser-1364 phosphorylation of TSC2 and to determine whether this technique was amenable to the use of selective kinase inhibitors, we analyzed TSC2 phosphorylation at Ser-1364 from cells pretreated with or without U0126 (an inhibitor of mitogen-activated protein kinase kinase activation) and BIM (a selective inhibitor of PKC family members) before PMA stimulation. Whereas both pSer-1798 and pSer-1364 depended on PKC activity, the PMA-induced increase in Ser-1364 phosphorylation, unlike that for Ser-1798 phosphorylation, was not U0126-sensitive (Fig. 6F). Taken together, these data suggest a PKC-dependent TSC2 regulatory pathway being integrated at Ser-1364 and provide a clear example of the utility of quantitative MS in studying the phosphorylation events occurring in complex signaling systems.
Discussion
Temporal changes in protein phosphorylation govern the regulation of numerous cellular processes. Current biochemical methods to identify and temporally quantify changes at specific phosphorylation sites require multiple targeted approaches. The side-by-side comparison presented here of both immunoblotting and activity assays to data obtained by using quantitative MS clearly shows the reliable and rapid nature of MS-based methods for the elucidation of temporal changes in ordered phosphorylation events in complex signaling systems. Phosphorylation profiling using these methods offers advantages over classical biochemical methods employing multiple phosphospecific antibodies, as it can rapidly and simultaneously quantify changes in potentially all of a protein's phosphorylation sites (known and unknown). Additionally, unlike standard results obtained by using phosphospecific antibodies, quantitative MS measurements of the kinetics of different phosphorylation sites on the same protein can be confidently compared because they are simultaneously acquired and internally controlled.
It is important to note, however, that phosphospecific antibodies can be readily used on limiting amounts of primary tissues, and many can detect protein phosphorylation at levels below those required for analysis by standard MS. Thus, quantitative MS analyses of phosphorylation at low stoichiometry on rare endogenous proteins may only achieve success if sufficient amounts (≈10-100 fmol) of the phosphorylated protein can be enriched or purified. Finally, endogenous proteins may achieve a higher phosphorylation stoichiometry compared with overexpressed proteins and may thereby reduce the burden of their purification. Quantitative MS methods, as shown here, are thus an important and complementary addition to the classical biochemical methods to measure temporal, site-specific changes in protein phosphorylation.
By using quantitative MS, we show here the profiling of 30 phosphopeptides representing 28 phosphorylation events from four signaling proteins. The ability to simultaneously monitor temporal changes in multiple, ordered phosphorylation events provides not only a more complete accounting of a protein's biochemical state but also kinetic insights into signaling mechanisms. It is anticipated that such global quantitative studies capable of monitoring temporal changes in site-specific phosphorylation and ultimately all modifications on proteins and protein complexes will permit the formulation of biochemical signatures capable of more fully defining a cell's systematic capabilities.
Supplementary Material
Acknowledgments
We thank former and current members of S.P.G.'s and J.B.'s laboratories for their important advice and helpful discussions and M. Senko (Thermo Electron) for assistance with optimization of MS instrumentation. This work was supported by National Institutes of Health Grants HG00041 (to S.P.G) and GM051405 and CA046595 (to J.B.) and postdoctoral fellowships from the International Human Frontier Science Program Organization (to P.P.R.) and the American Cancer Society (to J.P.M.).
Author contributions: B.A.B., P.P.R., S.A.G., and S.P.G. designed research; B.A.B., P.P.R., S.A.G., and J.P.M. performed research; B.A.B., S.A.G., and S.P.G. contributed new reagents/analytic tools; B.A.B., P.P.R., S.A.G., J.B., and S.P.G. analyzed data; and B.A.B. wrote the paper.
Abbreviations: ERK, extracellular signal-regulated kinase; RSK, p90 ribosomal S6 kinase; TSC, tuberous sclerosis complex; HA, hemagglutinin; LC-MS/MS, liquid chromatography tandem MS; PMA, phorbol 12-myristate 13-acetate; BIM, bisindolylmaleimide I.
References
- 1.Gerber, S. A., Rush, J., Stemman, O., Kirschner, M. W. & Gygi, S. P. (2003) Proc. Natl. Acad. Sci. USA 100, 6940-6945. [DOI] [PMC free article] [PubMed] [Google Scholar]
- 2.Ong, S. E., Blagoev, B., Kratchmarova, I., Kristensen, D. B., Steen, H., Pandey, A. & Mann, M. (2002) Mol. Cell Proteomics 1, 376-386. [DOI] [PubMed] [Google Scholar]
- 3.Chen, X., Smith, L. M. & Bradbury, E. M. (2000) Anal. Chem. 72, 1134-1143. [DOI] [PubMed] [Google Scholar]
- 4.Blagoev, B., Ong, S. E., Kratchmarova, I. & Mann, M. (2004) Nat. Biotechnol. 22, 1139-1145. [DOI] [PubMed] [Google Scholar]
- 5.Ibarrola, N., Kalume, D. E., Gronborg, M., Iwahori, A. & Pandey, A. (2003) Anal. Chem. 75, 6043-6049. [DOI] [PubMed] [Google Scholar]
- 6.Roux, P. P., Richards, S. A. & Blenis, J. (2003) Mol. Cell. Biol. 23, 4796-4804. [DOI] [PMC free article] [PubMed] [Google Scholar]
- 7.Tee, A. R., Fingar, D. C., Manning, B. D., Kwiatkowski, D. J., Cantley, L. C. & Blenis, J. (2002) Proc. Natl. Acad. Sci. USA 99, 13571-13576. [DOI] [PMC free article] [PubMed] [Google Scholar]
- 8.Richards, S. A., Fu, J., Romanelli, A., Shimamura, A. & Blenis, J. (1999) Curr. Biol. 9, 810-820. [DOI] [PubMed] [Google Scholar]
- 9.Ballif, B. A., Shimamura, A., Pae, E. & Blenis, J. (2001) J. Biol. Chem. 276, 12466-12475. [DOI] [PubMed] [Google Scholar]
- 10.Ballif, B. A., Villen, J., Beausoleil, S. A., Schwartz, D. & Gygi, S. P. (2004) Mol. Cell Proteomics 3, 1093-1101. [DOI] [PubMed] [Google Scholar]
- 11.Chen, R.-H. & Blenis, J. (1990) Mol. Cell. Biol. 10, 3204-3215. [DOI] [PMC free article] [PubMed] [Google Scholar]
- 12.Roux, P. P. & Blenis, J. (2004) Microbiol. Mol. Biol. Rev. 68, 320-344. [DOI] [PMC free article] [PubMed] [Google Scholar]
- 13.Manning, B. D. & Cantley, L. C. (2003) Biochem. Soc. Trans. 31, 573-578. [DOI] [PubMed] [Google Scholar]
- 14.Roux, P. P., Ballif, B. A., Anjum, R., Gygi, S. P. & Blenis, J. (2004) Proc. Natl. Acad. Sci. USA 101, 13489-13494. [DOI] [PMC free article] [PubMed] [Google Scholar]
- 15.Corradetti, M. N., Inoki, K., Bardeesy, N., DePinho, R. A. & Guan, K. L. (2004) Genes Dev. 18, 1533-1538. [DOI] [PMC free article] [PubMed] [Google Scholar]
Associated Data
This section collects any data citations, data availability statements, or supplementary materials included in this article.


