Abstract
Hepatocellular carcinoma (HCC) accounts for a large proportion of liver cancer cases and has an extremely poor prognosis. Therefore, novel innovative therapies for HCC are strongly desired. As gene therapy tools for HCC, 2 hepatic transcription factors (TF), HNF4A and HNF1A, have been used to suppress proliferation and to extinguish cancer‐specific characteristics of target cells. However, our present data demonstrated that single transduction of HNF4A or HNF1A had only a limited effect on suppression of HCC cell proliferation. Thus, in this study, we examined whether combinations of TF could show more effective antitumor activity, and found that combinatorial transduction of 3 hepatic TF, HNF4A, HNF1A and FOXA3, suppressed HCC cell proliferation more stably than single transduction of these TF. The combinatorial transduction also suppressed cancer‐specific phenotypes, such as anchorage‐independent growth in culture and tumorigenicity after transplantation into mice. HCC cell lines transduced with the 3 TF did not recover their proliferative property after withdrawal of anticancer drugs, indicating that combinatorial expression of the 3 TF suppressed the growth of all cell subtypes within the HCC cell lines, including cancer stem‐like cells. Transcriptome analyses revealed that the expression levels of a specific gene set involved in cell proliferation were only decreased in HCC cells overexpressing all 3 TF. Moreover, combined transduction of the 3 TF could facilitate hepatic differentiation of HCC cell lines. Our strategy for inducing stable inhibition and functional differentiation of tumor cells using a defined set of TF will become an effective therapeutic strategy for various types of cancers.
Keywords: differentiation, growth inhibition, hepatocellular carcinoma, reprogramming, transcription factor
1. INTRODUCTION
Liver cancer is the second leading cause of cancer‐related death worldwide, and hepatocellular carcinoma (HCC) comprises approximately 80% of liver cancer cases.1 While the predominant cause of liver cancer, hepatitis virus infection, has been decreasing sharply with the advent of novel antiviral drugs,2, 3 other causes, such as non‐alcoholic fatty liver disease and non‐alcoholic steatohepatitis, have been increasing, especially in developed countries.4 Given the poor prognosis of liver cancer,1 development of innovative therapies for HCC is strongly desired.
Gene therapy, involving transduction of therapeutic nucleic acids such as mutated genes, has been extensively investigated in congenital anomalies for practical application.5 However, gene therapy for cancer is more difficult than that for other diseases like congenital metabolic disorders because the characteristics of the cancer cells requiring suppression are highly complex and broad. As a solution for cancer gene therapy, transcription factors (TF) are promising candidates for transduction into cancer cells because they can regulate a wide variety of gene sets and dramatically change the nature of the transduced cells. Xie and colleagues focused on the finding that some hepatic differentiation‐related TF are downregulated in HCC. They first reported that forced re‐expression of a hepatic TF, HNF4A, in HCC cell lines induced differentiation into mature hepatocyte‐like cells, followed by apoptosis, cell cycle arrest and cellular senescence.6 Subsequently, they found that another hepatic TF, HNF1A, had the potential to suppress liver tumor‐derived cell proliferation and re‐establish the expression of certain liver‐specific genes.7 These findings suggest that forced re‐expression of specific TF could be a practical tool for “differentiation therapy” in HCC. Forced ectopic expression of a specific set of TF is considered a powerful method to change cell fate.8 These reprogramming technologies have frequently employed defined combinations of TF, such as Oct4/Sox2/Klf4/c‐Myc for induced pluripotent cells,9 Brm2/Ascl1/Myt1l for induced neuronal cells,10 and Gata4/Hnf1α/Foxa3 with knockdown of p19Arf or Hnf4α/Foxa1, 2 or 3 for induced hepatocyte‐like cells.11, 12 Combinatorial expression of a defined set of TF has synergistic and stable effects on the host cells and efficiently induces cellular reprogramming.
In the present study, we used a combination of 3 hepatic TF, HNF4A, HNF1A and FOXA3. Although the effects of forced FOXA3 expression in HCC cells have not previously been reported, we chose this TF as a factor for differentiation therapy because it is suggested that FOXA3 is a pioneer factor supporting recruitment of other TF to specific loci13 and it has been used in many hepatic reprogramming studies.11, 12, 14, 15, 16 We found that combinatorial transduction of the 3 hepatic TF suppressed proliferation of HCC cells more stably than single transduction of these TF. The transduction also inhibited anchorage‐independent growth and tumorigenicity of HCC cells in a soft agar culture condition and a transplanted tumor model in mice, respectively. HCC cells expressing the 3 TF did not re‐proliferate even after withdrawal of anticancer drugs. Transcriptome analyses with RNA‐seq revealed that several cell growth‐related genes were downregulated during in vitro cell culture from days 7‐14 after transduction only in cells expressing all 3 TF. Moreover, combinatorial transduction of the 3 TF could induce hepatic differentiation of HCC cells. The present findings suggest that reprogramming‐related TF can be an effective tool for differentiation cancer therapies.
2. MATERIALS AND METHODS
2.1. Cell culture
The HCC cell lines HepG2 and HuH7 cells were purchased from RIKEN BioResource Center Cell Bank and cultured in DMEM (Nacalai Tesque, Kyoto, Japan) supplemented with 10% (v/v) FBS (Gibco, Carlsbad, CA, USA), 2 mmol/L L‐glutamine (Nacalai Tesque) and penicillin/streptomycin (Nacalai Tesque) in a 5% CO2 incubator at 37°C.
2.2. Retrovirus production and transduction of cells
Human HNF4A and FOXA3 cDNAs17 and human HNF1A cDNA were obtained by RT‐PCR. The cDNAs were subcloned into pGCDNsam‐IRES‐EGFP (a gift from M. Onodera, National Center for Child Health and Development, Tokyo, Japan), a retroviral vector with a long terminal repeat derived from murine stem cell virus.18 Recombinant retroviruses were produced as described.17 Briefly, plasmid DNA was transfected into Plat‐GP cells (Cell Biolabs, San Diego, CA, USA) using linear polyethylenimine (PEI) (Polysciences, Taipei, Taiwan). At 3 days before transfection, Plat‐GP cells (1.8 × 10⁶) were plated on poly‐L‐lysine‐coated 10‐cm dishes. Meanwhile, 36 μL of 1 mg/mL PEI, 10 μg of retroviral plasmid DNA and 2 μg of the VSV‐G expression plasmid pCMV‐VSV‐G (a gift from H. Miyoshi, Keio University, Tokyo, Japan) were diluted in 1 mL of DMEM and incubated for 15 minutes at room temperature. The mixture was then added to the plated Plat‐GP cells in a drop‐by‐drop manner. After 6 hours of incubation at 37°C under 5% CO2, the medium was replaced with fresh medium and the culture was continued. Supernatants from the transfected cells were collected at 24 hours after medium replacement, filtered through .2‐μm cellulose acetate filters (Sartorius, Göttingen, Germany) and concentrated by centrifugation (10 000 g for 16 hours at 4°C). The viral pellets were resuspended in Hanks’ balanced salt solution (1/140 of initial supernatant volume). HepG2 and HuH7 cells were plated in 12‐well plates at 1 × 10⁴ and 2 × 10⁴ cells/well, respectively, and cultured for 1 day. Then, these cells were incubated in the medium containing the concentrated viral supernatants and 5 μg/mL protamine sulfate (Nacalai Tesque) for 12 hours. The viral infection was serially repeated 3 times.
2.3. Crystal violet staining
HepG2 and HuH7 cells were plated in 12‐well plates at 1 × 10⁵ cells/well and subsequently stained with crystal violet (Cell Biolabs) for 5 minutes at room temperature. After washing with PBS, the cells were observed using a microscope. Crystal violet staining was also used to measure cell growth. Briefly, cells stained with crystal violet were lysed with RIPA buffer (50 mmol/L Tris‐HCl [pH 8.0], 150 mmol/L NaCl, 2 mmol/L EDTA, 1% [v/v] Nonidet P‐40, .5% [v/v] sodium deoxycholate and .1% [w/v] SDS [all from Nacalai Tesque]) and transferred into each well of 96‐well plates, and the absorbance at 540 or 595 nm was measured with a Multiskan FC Microplate Reader (Thermo Fisher Scientific, Waltham, MA, USA).
2.4. WST‐8 proliferation assay
HepG2 and HuH7 cells were plated in 96‐well plates at 1 × 10⁴ cells/well. Cell proliferation was measured using a Cell Counting Kit‐8 (Dojindo, Kumamoto, Japan) as described.19 Briefly, 10 μL of WST‐8 solution was added to each well and incubated for 30 minutes in a 5% CO2 incubator at 37°C. The absorbance at 450 nm was measured with a Multiskan FC Microplate Reader (Thermo Fisher Scientific).
2.5. Soft agar colony formation assay
A soft agar colony formation assay for anchorage‐independent cell growth was performed using a CytoSelect 96‐Well Cell Transformation Assay Kit (Cell Biolabs) in accordance with the manufacturer's instructions. Briefly, a cell agar layer containing 1 × 10⁴ HepG2 cells were spread onto a base agar layer in each well of 96‐well plates, and the cells were allowed to grow in the soft agar. In the analysis of cells, a homogeneous cell suspension was prepared from the soft agar by pipetting with PBS and centrifuged at 410 g for 3 minutes at room temperature to collect the cells, followed by colorimetric detection with crystal violet as described above. Colony sizes were measured with the Amira image processing software (Zuse Institute Berlin, Berlin, Germany) as described.20
2.6. In vivo tumorigenicity assay
HepG2 and HuH7 cells (1 × 10⁴) expressing control EGFP or TF (HNF4A, HNF1A and FOXA3) were transplanted into subcutaneous tissues in the back of NOD/SCID mice. The xenografts of HepG2 and HuH7 cells were allowed to grow for 9‐10 weeks, resected, and measured for tumor weights (g) and volumes (cm3). The volume was calculated with the following formula: .5 × width (cm) × width (cm) × length (cm).
2.7. Anticancer drug resistance assay
Anticancer drug resistance assays were conducted for HepG2 and HuH7 cells that were plated in 96‐well plates at 1 × 10⁴ cells/well and cultured for 14 days. The following drugs were used: cetuximab (1 mg/mL; Merck, Darmstadt, Germany), anti‐HER2 monoclonal antibody (10μg/mL; Roche, Basel, Switzerland), rapamycin (200 μg/mL; Sigma‐Aldrich, St. Louis, MO, USA), cyclosporine A (10 nmol/L; Sigma‐Aldrich), cisplatin (10 μg/mL; Sigma‐Aldrich), paclitaxel (10 μmol/L; Sigma‐Aldrich), doxorubicin (1 μg/mL; Sigma‐Aldrich), etoposide (10 μg/mL; Sigma‐Aldrich) and resveratrol (10 μg/mL; Sigma‐Aldrich).
2.8. Analysis of hepatic function in hepatocellular carcinoma cells
The amount of human albumin in the culture medium was measured by an enzyme‐linked immunosorbent assay after culture of transduced HCC cells for 24 hours. HCC cells cultured for 7 days after transduction were used. Albumin was detected using an Albuwell II (Exocell, Philadelphia, PA, USA) according to the manufacturer's instructions. The absorbance signals were measured with a Multiskan FC Microplate Reader. CYP2C9 and CYP3A4 activities were measured after culture of transduced HCC cells for 9 days using a P450‐Glo CYP2C9 Assay Kit and a P450‐Glo CYP3A4 Assay Kit (with Luciferin‐IPA) (both from Promega, Madison, WI, USA), respectively, according to the manufacturer's instructions. The luminescent signals were measured with a Luminescencer Octa (ATTO, Tokyo, Japan).
2.9. RNA‐seq and data analysis
HepG2 cells expressing the TF or EGFP were collected from 6‐well plates at days 7 and 14 after transduction. Total RNA was isolated from the cells using an ISOGEN II (NIPPON GENE, Tokyo, Japan). Library preparation and sequence analysis were performed as described.21 The arranged sequence data were mapped against the whole reference genome (UCSC hg19) using TopHat2/Bowtie2.22 Quantification of transcripts with normalization and analysis of differentially expressed genes (DEG) were performed with Cufflinks.23 The expression levels of genes were estimated as fragment per kilobase million (FPKM). A gene set enrichment analysis (GSEA) was performed with a “data set” calculated from a previously reported microarray data (Accession Number: GEO: GSE18269) for HepG2 cells and primary human hepatocytes24 and “gene sets” produced from RNA‐seq data for HepG2 cells transduced with the 3 TF (HNF4A, HNF1A and FOXA3) and EGFP from the present study. Briefly, for preparation of the “data set,” a transcriptome‐wide ranking list of gene expression fold change between hepatocytes and HepG2 cells were produced with the GEO2R program in the GEO website (https://www.ncbi.nlm.nih.gov/geo/). Gene symbols and log2 (fold change) data were extracted and sorted in descending order to create the ranking list. For preparation of the “gene sets,” FPKM data of HepG2 cells expressing the 3 TF or EGFP were used to calculate a fold change ranking list. After elimination of miRNA and snoRNA entries from the ranking list, the top and bottom 100 genes were extracted as the gene sets for HepG2 cells expressing the 3 TF or EGFP, respectively. Both “data set” and “gene sets” data were processed with the GSEAPreranked program.25, 26 Functional enrichment analysis of the DEG was performed with the Database for Annotation, Visualization, and Integrated Discovery (DAVID) program.27, 28 All sequencing experiments were performed in a HiSeq 2000 system (Illumina, San Diego, CA, USA). RNA‐seq data were uploaded to the Gene Expression Omnibus Database (Accession Number: GEO: GSE115423).
2.10. Gene expression analysis
Total RNA isolated from HepG2 and HuH7 cells were reverse‐transcribed using a SuperScript III First‐Strand Synthesis System for RT‐PCR (Invitrogen, Carlsbad, CA, USA), and quantitative PCR (qPCR) was conducted using THUNDERBIRD SYBR qPCR Mix (Toyobo, Osaka, Japan) and the 7300 Real‐Time PCR System (Applied Biosystems, Foster City, CA, USA), according to the manufacturer's instructions. qPCR primers for HNF4A (5′‐GCT CGG AGC CAC CAA GAG A‐3′ and 5′‐CTC GTC AAG GAT GCG TAT GGA‐3′), HNF1A (5′‐ACA AGC TGG CCA TGG ACA‐3′ and 5′‐ CAC TTG GTG GAG GGG TGT AGA‐3′), FOXA3 (5′‐CGG TGG CAG CAG CAG CT‐3′ and 5′‐GGA ACG CGC CAC CTT GA‐3′) and ACTB (5′‐TGG CAC CCA GCA CAA TGA A‐3′ and 5′‐CTA AGT CAT AGT CCG CCT AGA AGC A‐3′) were used. The values of ACTB were used as a normalization control.
2.11. TUNEL staining
HepG2 and HuH7 cells were plated in 6‐well plates at 3 × 10⁵ cells/well and cultured for 7 days. TUNEL staining was performed using an Apoptosis In Situ Detection Kit (Wako, Osaka, Japan) in accordance with the manufacturer's instructions. Briefly, fluorescein‐dUTP was added to the 3′‐terminals of fragmented DNAs by terminal deoxynucleotidyl transferase, followed by immunochemical detection with an anti‐fluorescein antibody conjugated with HRP using 3,3‐diaminobenzidine as a substrate. Nuclei were stained with hematoxylin. Digestion with 10 U/μL DNase I (Qiagen, Hilden, Germany) for 1 hour at 37°C was performed as a positive control.
2.12. Statistical analysis
Data are presented as means ± SD of multiple samples. Statistical analyses were performed with Student's or Welch's t test as appropriate after 1‐way analysis of variance using JMPv10 software (SAS Institute Inc., Tokyo, Japan). Values of P < .05 were considered statistically significant. See also Appendix S1 for other materials and methods.
3. RESULTS
3.1. Combinatorial transduction of the 3 transcription factors inhibits proliferation of hepatocellular carcinoma cells in vitro more stably than transduction of the single factors
Forced re‐expression of HNF4A or HNF1A in HCC cell lines was reported to induce cell growth arrest and reproduction of hepatic cell characteristics.6, 7 In the present study, the cell growth inhibitory effects of these TF were reproduced and confirmed, but the growth of the transduced cells was not completely suppressed during prolonged culture (Figure 1). We further clarified that single transduction of FOXA3 had similar effects on cell growth, with insufficient growth inhibitory effects in long‐term culture (Figure 1). Meanwhile, HCC cells with combinatorial transduction of all 3 TF showed a higher growth rate reduction than those with single transduction of each TF (Figure 1). These findings demonstrate that single transduction of the hepatic TF was not sufficient for stable suppression of HCC cell proliferation, while combinatorial transduction of all 3 TF could induce stable inhibition of HCC cell proliferation in long‐term culture. In contrast, combined transduction of paired TF, namely HNF4A and HNF1A, HNF4A and FOXA3, or HNF1A and FOXA3, did not completely suppress HCC cell proliferation in prolonged culture (Figure S1), suggesting that combinatorial transduction of all 3 TF was specifically required for stable inhibition of HCC cell properties in vitro.
Figure 1.
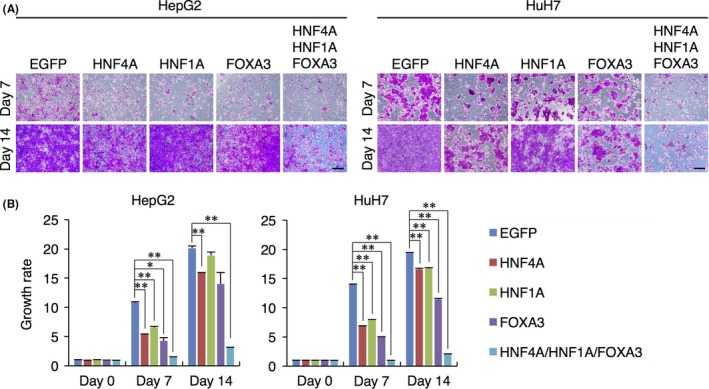
Forced expression of HNF4A, HNF1A and FOXA3 suppresses the cell growth of hepatocellular carcinoma (HCC) cell lines. A, Microscopic analysis of HepG2 (left panels) and HuH7 (right panels) cells transduced with the transcription factors (TF) and stained with crystal violet at days 7 (upper panels) and 14 (lower panels) after transduction. Scale bars: 100 μm. B, Absorbances of lysed HepG2 (left bar plots) and HuH7 (right bar plots) cells transduced with the TFand stained with crystal violet at days 7 and 14 after transduction. The growth rate was calculated as the relative ratio of absorbance at 540 nm of TF‐transduced cells to that of EGFP‐transduced cells at day 0 after transduction. Data represent means ± SD (n = 3). *P < .05, **P < .01
We confirmed that 97.6% of HepG2 cells and 96.9% of HuH7 cells expressed EGFP after infection with a retrovirus expressing EGFP, implying that almost all HepG2 and HuH7 cells could be successfully transduced with all 3 TF (Figure S2A). These EGFP‐positive cells could proliferate, similar to non‐treated HCC cells (Figure S2B). Thus, inhibitory effects on the proliferation of transduced HCC cells were not due to the toxicity of retrovirus infection. Moreover, overexpression of the 3 TF in HCC cells was confirmed by western blot analyses and RT‐qPCR analyses (Figure S2C). However, only an increase of HNF4A protein in the transduced HepG2 cells was not clearly detected (Figure S2C). This result is consistent with that in a previous study,6 in which HNF4A was introduced into HepG2 cells with an adenovirus vector, showing that HepG2 cells naturally expressed a large amount of HNF4A and thereby it was difficult to detect an increase of HNF4A protein by western blot analysis.
3.2. Combinatorial transduction of the 3 transcription factors attenuates colony formation ability of HepG2 cells in 3‐D culture
To assess anchorage‐independent growth, a typical characteristic of cancer cells, of HCC cells transduced with the combination of all 3 TF, 3‐D culture assays in soft agar were performed. The growth of HepG2 cell colonies in the soft agar medium was evaluated by microscopy at days 6 and 12 after transduction (Figure 2A), colony size measurements at day 12 after transduction (Figure 2B), and crystal violet assays at day 12 after transduction (Figure 2C). Although the HepG2 colony sizes at day 12 after transduction of the TF were significantly reduced when FOXA3 or the combination of all 3 TF were transduced (Figure 2B), data from the crystal violet assays revealed that the total cell number in the 3‐D cultures was only decreased when the combination of all 3 TF was transduced (Figure 2C). This would arise through a difference in cell density within the HepG2 cell colonies. Thus, it was clear that combinatorial transduction of the 3 TF had the potential to suppress anchorage‐independent growth of HCC cells.
Figure 2.
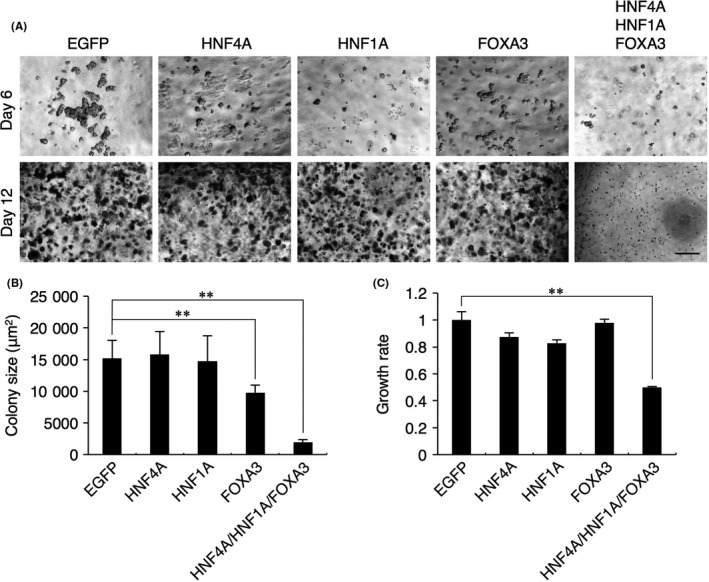
Combinatorial expression of HNF4A, HNF1A and FOXA3 inhibits anchorage‐independent colony formation of HepG2 cells. A, Soft agar colony formation assays. Phase‐contrast images at days 6 (upper) and 12 (lower) after transduction of the transcription factors (TF) are shown. Scale bar: 50 μm. B, Colony sizes of HepG2 cells transduced with the TF at day 12 after transduction. Data represent means ± SD (n = 3). **P < .01. C, Absorbances of lysed HepG2 cells transduced with the TF and stained with crystal violet at day 12 after transduction. The growth rate was calculated as the relative ratio of the absorbance at 595 nm of TF‐transduced cells to that of EGFP‐transduced cells. Data represent means ± SD (n = 3). **P < .01
3.3. HepG2 cells transduced with the 3 transcription factors lose tumorigenicity in vivo
Next, we transplanted HepG2 and HuH7 cells expressing the combination of all 3 TF or control EGFP into subcutaneous tissues in the back of NOD/SCID mice. The xenografts of HepG2 and HuH7 cells were excised from the mice at 70 and 63 days after transplantation, respectively. While control cells formed prominent tumors as previously reported, the cells expressing the combination of all 3 TF generated tiny tumors (Figure 3). The weight and volume of the neoplasms derived from HCC cells transduced with the 3 TF were significantly smaller than those derived from control HCC cells (Figure 3).
Figure 3.
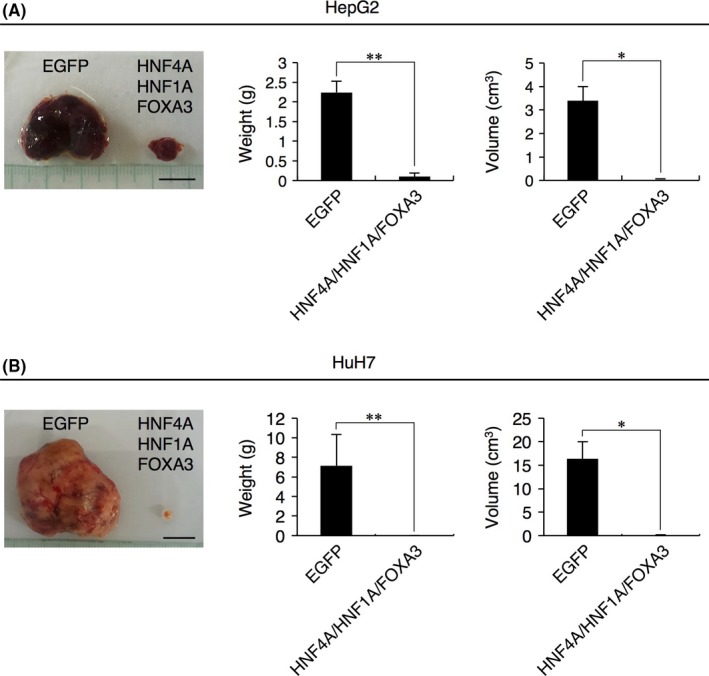
In vivo tumorigenicity of HepG2 and HuH7 cells transduced with the 3 transcription factors (TF) in NOD/SCID mice. A, B, Images of resected xenografts derived from HepG2 (A, left panel) and HuH7 (B, left panel) cells expressing control EGFP or the combination of all 3 TF (HNF4A, HNF1A and FOXA3) at days 70 and 63 after transplantation into mice, respectively, are shown. Tumor weights (left bar plots) and volumes (right bar plots) were measured. Scale bars: 1 cm. Data represent means ± SD (n = 3). *P < .05, **P < .01
3.4. Recovery of cell growth of HepG2 cells after withdrawal of anticancer drugs is suppressed by combinatorial transduction of the 3 transcription factors
We performed a sensitivity test for anticancer drugs. Various kinds of drugs, including a molecularly targeted drug (cetuximab), conventional anticancer drugs (cisplatin, paclitaxel, doxorubicin and etoposide) and anticancer drug candidates (anti‐HER2 monoclonal antibody, rapamycin, cyclosporine and resveratrol) were employed. While all drugs suppressed the growth of control HCC cells expressing EGFP, the cells started to regrow during the drug treatments and after drug withdrawal from the culture medium (Figure 4). These results suggested that some cells within the HCC cell lines were resistant to the drugs and escaped from cell death during or after drug treatment. Meanwhile, HCC cells expressing all 3 TF did not show regrowth of cells during and after treatment with the drugs (Figure 4). These data demonstrate that the combination of all 3 TF was effective for suppressing the proliferation of all cell subtypes within the HCC cell lines, while the cell growth inhibition was not caused by apoptosis of HCC cells following transduction of the 3 TF (Figure S3A and B).
Figure 4.
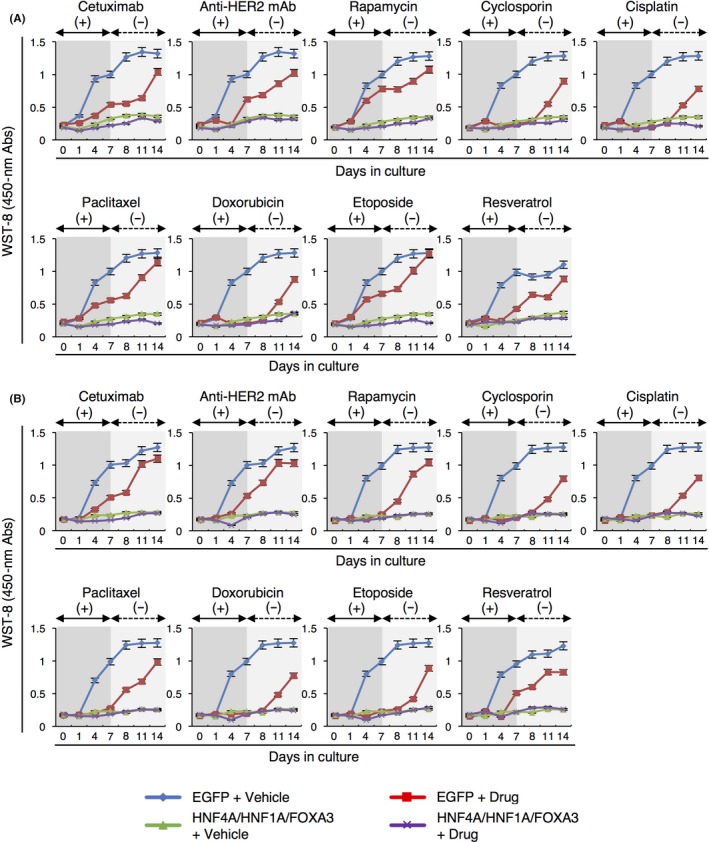
Combinatorial expression of HNF4A, HNF1A and FOXA3 is effective for suppressing the cell growth recovery of hepatocellular carcinoma (HCC) cells after withdrawal of anticancer drugs. A, B, The results of WST‐8 proliferation assays for HepG2 (A) and HuH7 (B) cells expressing control EGFP or the combination of all 3 transcription factors (TF) at days 0 to 7 (dark gray areas) and days 7 to 14 (light gray areas) after transduction with various anticancer drug treatments are shown as line plots. The absorbance (Abs) was measured at 450 nm. Data represent means ± SD (n = 3). mAb, monoclonal antibody
3.5. Downregulation of a specific gene set related to cell growth is only observed after combinatorial transduction of all 3 transcription factors into HepG2 cells
To elucidate the molecular background for the stable growth arrest of HCC cells by the combinatorial transduction of the 3 TF, we performed RNA‐seq analyses. Genes showing differential expression between day 7 and day 14 after transduction of the TF were determined and classified into upregulated and downregulated gene sets. Both gene sets were compared among all data to find common or unique DEG with the combination of the 3 TF. Interestingly, HepG2 cells expressing all 3 TF had few overlapping genes with cells expressing the single TF (Figure 5). Thus, we analyzed the enrichment of gene ontology (GO) terms for the unique DEG in HepG2 cells expressing all 3 TF between days 7 and 14 after transduction. A total of 28 and 48 genes were estimated to be upregulated and downregulated DEG, respectively. Most of the GO terms for the upregulated DEG were related to protein phosphorylation, although the relationship between genes involved in protein phosphorylation and those involved in cell proliferation remained unknown. Meanwhile, the downregulated DEG contained several cell growth‐related terms, such as “regulation of growth” and “regulation of cell growth” (Figure 5). Thus, it is suggested that downregulation of the expression levels of a specific gene set in HCC cells transduced with the 3 TF was important for inducing stable cell growth suppression of HCC cells in vitro as well as in vivo.
Figure 5.
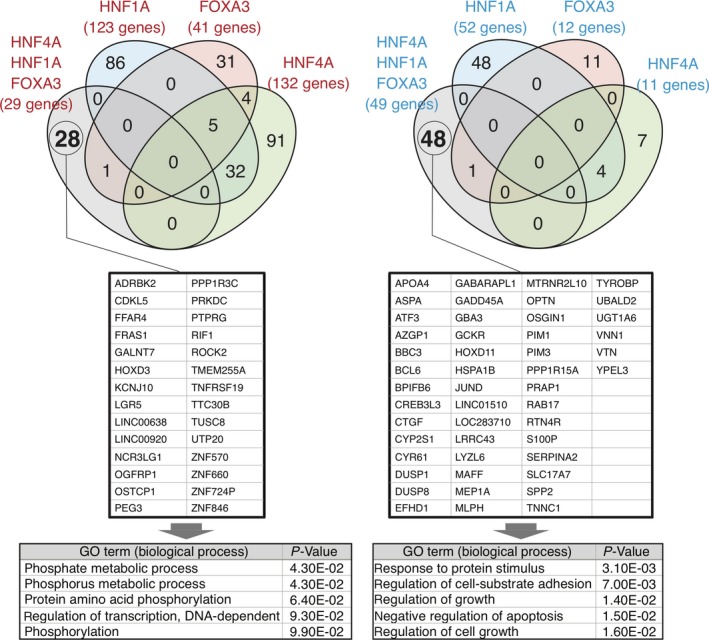
Venn diagrams representing the overlap of the differentially upregulated (left) and downregulated (right) genes between day 7 and day 14 after transduction of the transcription factors (TF) (upper panels). The number of genes in each category is indicated. Unique upregulated (left) and downregulated (right) differentially expressed genes (DEG) are listed in the middle panels. GO terms in the biological process category, and the P‐values for the unique DEG are listed in the bottom panels
3.6. Promotion of hepatic differentiation after combinatorial transduction of all 3 transcription factors into hepatocellular carcinoma cells
Finally, we examined whether combined transduction of the 3 TF could promote hepatic differentiation of HCC cells. Analyses of albumin secretion and P450 activity revealed that HCC cells overexpressing the 3 TF exhibited a significant increase in the level of hepatic functions (Figure 6A). A GSEA using a set of genes specifically expressed in human hepatocytes or HepG2 cells showed that the expression of hepatocyte‐specific genes was highly or poorly enriched in HepG2 cells transduced with the 3 TF or EGFP, respectively (Figure 6B). Moreover, a functional enrichment analysis revealed that a lot of genes in the gene list of HepG2 cells transduced with the 3 TF were correlated with hepatic functions, including drug metabolism, glycometabolism and bile secretion (Figure 6C). In contrast, the gene list of EGFP‐expressing HepG2 cells contained few genes involved in hepatic functions (Figure 6C). These data demonstrate that enforced expression of the 3 TF leads to a change in the transcriptomic profiles of HCC cells and induces hepatic differentiation.
Figure 6.
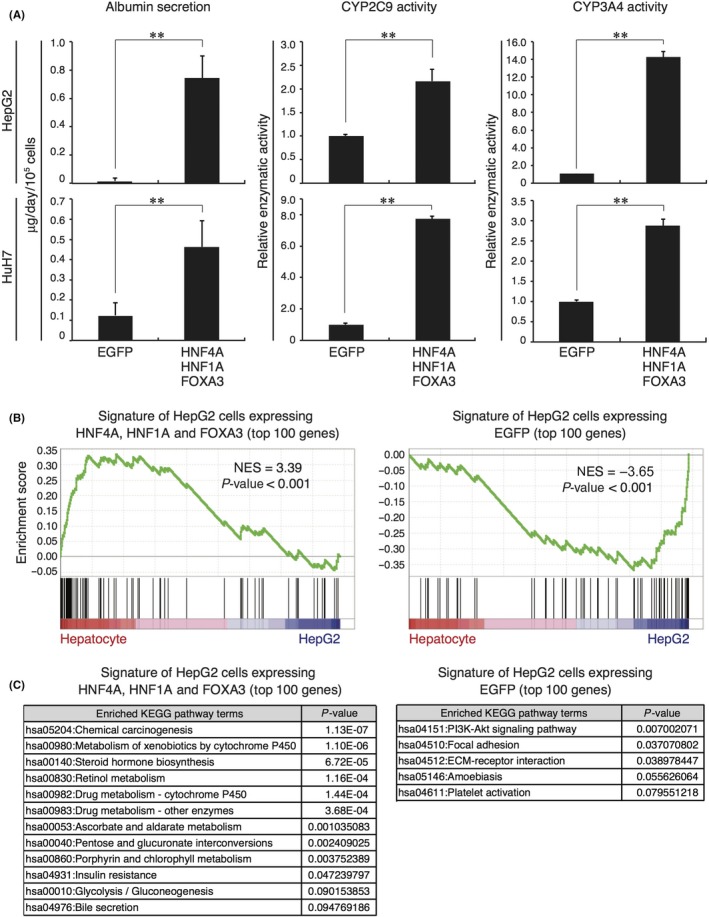
Combinatorial transduction of HNF4A, HNF1A and FOXA3 induces hepatic differentiation of hepatocellular carcinoma (HCC) cells. A, The amounts of albumin secreted between day 7 and day 8 after transduction and CYP2C9 and CYP3A4 activities at day 9 after transduction were measured in cultures of HepG2 and HuH7 cells that expressed control EGFP or the combination of all 3 transcription factors (TF). Data represent means ± SD (n = 3). **P < .01. B, A GSEA of RNA‐seq data for HepG2 cells expressing all 3 TF (left panel) or EGFP (right panel) was performed using a set of genes specifically expressed in human hepatocytes or HepG2 cells. C, Enriched Kyoto Encyclopedia of Genes and Genomes (KEGG) pathway terms in the gene list of HepG2 cells expressing all 3 TF (left panel) or EGFP (right panel)
4. DISCUSSION
Our study reproduced the findings in previous studies showing that forced re‐expression of HNF4A or HNF1A in HCC cells significantly suppressed cell proliferation in vitro.6, 7 However, the suppressive effect of the TF was insufficient to completely inhibit the HCC proliferation in prolonged culture. These results indicate that single transduction of these TF is not suitable for differentiation therapies of HCC. Recent studies in the field of direct reprogramming have demonstrated that combinatorial transduction of TF may have the potential to induce stable and dramatic differentiation of cells. Therefore, we tested combinations of 3 TF, HNF4A, HNF1A and additional candidate FOXA3 for differentiation therapy of HCC. Among the various combinatorial transductions of the TF, simultaneous transduction with all 3 TF almost completely suppressed the cell growth of HCC cells in vitro. The suppressive effect of the combinatorial transduction was also seen in 3‐D culture and in vivo after transplantation into mice. Moreover, functional properties and gene expression patterns of HCC cells neared those of hepatocytes after overexpression of the 3 TF. These findings raise the expectation that combinatorial transduction can be applied to practical cancer therapies.
The results for the in vitro growth inhibition assays with administration of anticancer drugs suggested that the combinatorial transduction of the 3 TF could suppress the proliferation of not only differentiated cancer cells, but also cancer stem‐like cells (CSC) contained within the HCC cell lines, which may be able to re‐proliferate after withdrawal of the anticancer drugs. It has been considered that CSC are the major causes of anticancer drug resistance, radioresistance and recurrence of tumors,29 and that HCC cell lines include these cell types as subpopulations.30 Anticancer drug therapy combined with TF‐mediated reprogramming of cancer cells may be a promising strategy for effective treatment of HCC patients.
We analyzed the transcriptome of HepG2 cells expressing single TF, the combination of all 3 TF, or control EGFP at early (day 7) and late (day 14) time points after viral transduction. The time‐dependent expression changes from day 7 to day 14 in the cultures of HepG2 cells transduced with TF showed that the transcriptomic behaviors could be separated into 3 groups: HNF4A and HNF1A, FOXA3, and the combination of all 3 TF. GO analyses revealed that a set of specifically upregulated genes in HepG2 cells between days 7 and 14 after combinatorial transduction of the 3 TF contained genes involved in “protein phosphorylation.” However, the functions of these genes in the inhibition of HCC cell proliferation remain to be examined. Meanwhile, a set of specifically downregulated genes in HepG2 cells expressing all 3 TF contained many genes related to “cell growth regulation.” Almost all these genes were upregulated in HCC cells transduced with single TF during the same time period. Thus, it is suggested that the set of 3 TF, namely HNF4A, HNF1A and FOXA3, synergistically downregulated the expression of genes involved in inhibition of HCC cell proliferation. Our strategy for inducing stable inhibition and functional differentiation of tumor cells by enforced expression of a defined set of TF can be developed into new therapeutic techniques for the treatment of various types of cancers.
CONFLICTS OF INTEREST
No conflicts of interest exist.
Supporting information
ACKNOWLEDGMENTS
We thank Drs Masafumi Onodera and Hiroyuki Miyoshi for sharing reagents and Yuuki Honda and Chiaki Kaieda for excellent technical assistance. We also thank Dr Alison Sherwin from Edanz Group (http://www.edanzediting.com/ac) for editing a draft of this manuscript.
Takashima Y, Horisawa K, Udono M, Ohkawa Y, Suzuki A. Prolonged inhibition of hepatocellular carcinoma cell proliferation by combinatorial expression of defined transcription factors. Cancer Sci. 2018;109:3543–3553. 10.1111/cas.13798
References
- 1. GLOBOCAN2012. http://globocan.iarc.fr/Default.aspx.
- 2. Puchades Renau L, Berenguer M. Introduction to hepatitis C virus infection: overview and history of hepatitis C virus therapies. Hemodial Int. 2018;22:S8‐S21. [DOI] [PubMed] [Google Scholar]
- 3. Sun D, Zhu L, Yao D, Chen L, Fu L, Ouyang L. Recent progress in potential anti‐hepatitis B virus agents: structural and pharmacological perspectives. Eur J Med Chem. 2018;147:205‐217. [DOI] [PubMed] [Google Scholar]
- 4. Araújo AR, Rosso N, Bedogni G, Tiribelli C, Bellentani S. Global epidemiology of non‐alcoholic fatty liver disease/non‐alcoholic steatohepatitis: what we need in the future. Liver Int. 2018;38:47‐51. [DOI] [PubMed] [Google Scholar]
- 5. Naldini L. Gene therapy returns to centre stage. Nature. 2015;526:351‐360. [DOI] [PubMed] [Google Scholar]
- 6. Yin C, Lin Y, Zhang X, et al. Differentiation therapy of hepatocellular carcinoma in mice with recombinant adenovirus carrying hepatocyte nuclear factor‐4α gene. Hepatology. 2008;48:1528‐1539. [DOI] [PubMed] [Google Scholar]
- 7. Zeng X, Lin Y, Yin C, et al. Recombinant adenovirus carrying the hepatocyte nuclear factor‐1alpha gene inhibits hepatocellular carcinoma xenograft growth in mice. Hepatology. 2011;54:2036‐2047. [DOI] [PubMed] [Google Scholar]
- 8. Xu J, Du Y, Deng H. Direct lineage reprogramming: strategies, mechanisms, and applications. Cell Stem Cell. 2015;16:119‐134. [DOI] [PubMed] [Google Scholar]
- 9. Takahashi K, Yamanaka S. Induction of pluripotent stem cells from mouse embryonic and adult fibroblast cultures by defined factors. Cell. 2006;126:663‐676. [DOI] [PubMed] [Google Scholar]
- 10. Pang ZP, Yang N, Vierbuchen T, et al. Induction of human neuronal cells by defined transcription factors. Nature. 2011;476:220‐223. [DOI] [PMC free article] [PubMed] [Google Scholar]
- 11. Huang P, He Z, Ji S, et al. Induction of functional hepatocyte‐like cells from mouse fibroblasts by defined factors. Nature. 2011;475:386‐389. [DOI] [PubMed] [Google Scholar]
- 12. Sekiya S, Suzuki A. Direct conversion of mouse fibroblasts to hepatocyte‐like cells by defined factors. Nature. 2011;475:390‐393. [DOI] [PubMed] [Google Scholar]
- 13. Zaret KS, Carroll JS. Pioneer transcription factors: establishing competence for gene expression. Genes Dev. 2011;25:2227‐2241. [DOI] [PMC free article] [PubMed] [Google Scholar]
- 14. Yu B, He ZY, You P, et al. Reprogramming fibroblasts into bipotential hepatic stem cells by defined factors. Cell Stem Cell. 2013;13:328‐340. [DOI] [PubMed] [Google Scholar]
- 15. Huang P, Zhang L, Gao Y, et al. Direct reprogramming of human fibroblasts to functional and expandable hepatocytes. Cell Stem Cell. 2014;14:370‐384. [DOI] [PubMed] [Google Scholar]
- 16. Song G, Pacher M, Balakrishnan A, et al. Direct reprogramming of hepatic myofibroblasts into hepatocytes In Vivo attenuates liver fibrosis. Cell Stem Cell. 2016;18:797‐808. [DOI] [PubMed] [Google Scholar]
- 17. Miura S, Suzuki A. Generation of mouse and human organoid‐forming intestinal progenitor cells by direct lineage reprogramming. Cell Stem Cell. 2017;21:456‐471. [DOI] [PubMed] [Google Scholar]
- 18. Kaneko S, Onodera M, Fujiki Y, Nagasawa T, Nakauchi H. Simplified retroviral vector gcsap with murine stem cell virus long terminal repeat allows high and continued expression of enhanced green fluorescent protein by human hematopoietic progenitors engrafted in nonobese diabetic/severe combined immunodeficient mice. Hum Gene Ther. 2001;12:35‐44. [DOI] [PubMed] [Google Scholar]
- 19. Takashima Y, Terada M, Udono M, Miura S, Yamamoto J, Suzuki A. Suppression of lethal‐7b and miR‐125a/b maturation by Lin28b enables maintenance of stem cell properties in hepatoblasts. Hepatology. 2016;64:245‐260. [DOI] [PubMed] [Google Scholar]
- 20. Takashima Y, Terada M, Kawabata M, Suzuki A. Dynamic three‐dimensional morphogenesis of intrahepatic bile ducts in mouse liver development. Hepatology. 2015;61:1003‐1011. [DOI] [PubMed] [Google Scholar]
- 21. Hara M, Kobayakawa K, Ohkawa Y, et al. Interaction of reactive astrocytes with type I collagen induces astrocytic scar formation through the integrin‐N‐cadherin pathway after spinal cord injury. Nat Med. 2017;23:818‐828. [DOI] [PubMed] [Google Scholar]
- 22. Kim D, Pertea G, Trapnell C, Pimentel H, Kellley R, Salzberg SL. TopHat2: accurate alignment of transcriptomes in the presence of insertions, deletions and gene fusions. Genome Biol. 2013;14:R36. [DOI] [PMC free article] [PubMed] [Google Scholar]
- 23. Trapnell C, Roberts A, Goff L, et al. Differential gene and transcript expression analysis of RNA‐seq experiments with TopHat and Cufflinks. Nat Protoc. 2012;7:562‐578. [DOI] [PMC free article] [PubMed] [Google Scholar]
- 24. Hart SN, Li Y, Nakamoto K, Subileau EA, Steen D, Zhong XB. A comparison of whole genome gene expression profiles of HepaRG cells and HepG2 cells to primary human hepatocytes and human liver tissues. Drug Metab Dispos. 2010;38:988‐994. [DOI] [PMC free article] [PubMed] [Google Scholar]
- 25. Mootha VK, Lindgren CM, Eriksson KF, et al. PGC‐1alpha‐responsive genes involved in oxidative phosphorylation are coordinately downregulated in human diabetes. Nat Genet. 2003;34:267‐273. [DOI] [PubMed] [Google Scholar]
- 26. Subramanian A, Tamayo P, Mootha VK, et al. Gene set enrichment analysis: a knowledge‐based approach for interpreting genome‐wide expression profiles. Proc Natl Acad Sci USA. 2005;102:15545‐15550. [DOI] [PMC free article] [PubMed] [Google Scholar]
- 27. Huang W, Sherman BT, Lempicki RA. Bioinformatics enrichment tools: paths toward the comprehensive functional analysis of large gene lists. Nucleic Acids Res. 2009;37:1‐13. [DOI] [PMC free article] [PubMed] [Google Scholar]
- 28. Huang W, Sherman BT, Lempicki RA. Systematic and integrative analysis of large gene lists using DAVID bioinformatics resources. Nat Protoc. 2009;4:44‐57. [DOI] [PubMed] [Google Scholar]
- 29. Wang K, Dianjun S. Cancer stem cells of hepatocellular carcinoma. Oncotarget. 2018;9:23306‐23314. [DOI] [PMC free article] [PubMed] [Google Scholar]
- 30. Xiang Y, Yang T, Pang BY, Zhu Y, Liu YN. The progress and prospects of putative biomarkers for liver cancer stem cells in hepatocellular carcinoma. Stem Cells Int. 2016;2016:7614971. [DOI] [PMC free article] [PubMed] [Google Scholar]
Associated Data
This section collects any data citations, data availability statements, or supplementary materials included in this article.
Supplementary Materials


