

SUMMARY
Throughout mammalian neocortex, layer 5 pyramidal (L5) cells project via the pons to a vast number of cerebellar granule cells (GrCs), forming a fundamental pathway. Yet it is unknown how neuronal dynamics are transformed through the L5→GrC pathway. Here, by directly comparing premotor L5 and GrC activity during a forelimb movement task using dual-site two-photon Ca2+ imaging, we found that in expert mice, L5 and GrC dynamics were highly similar. L5 cells and GrCs shared a common set of task-encoding activity patterns, possessed similar diversity of responses, and exhibited high correlations comparable to local correlations among L5 cells. Chronic imaging revealed that these dynamics co-emerged in cortex and cerebellum over learning: as behavioral performance improved, initially dissimilar L5 cells and GrCs converged onto a shared, low-dimensional, task-encoding set of neural activity patterns. Thus, a key function of cortico-cerebellar communication is the propagation of shared dynamics that emerge during learning.
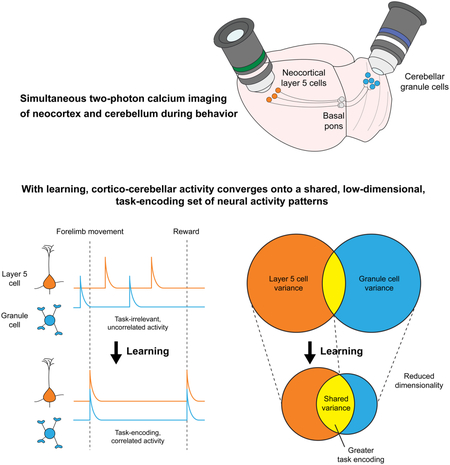
Graphical Abstract
In Brief
Simultaneous recordings of ensembles of individual neurons in the neocortex and cerebellum provide a view of how these two brain regions learn together
INTRODUCTION
Mammalian brain evolution has maintained a remarkably conserved ~4:1 ratio of total neurons in the cerebellum to that in neocortex, with these two structures containing ~99% of neurons in the human brain (Barton and Venditti, 2014; Herculano-Houzel, 2010). Cerebellum and neocortex are also densely interconnected: most neocortical regions send layer 5 (L5) projections to the pontine nuclei, which provide the largest input to the cerebellum through granule cells (GrCs) (Brodal and Bjaalie, 1997; Kelly and Strick, 2003; Suzuki et al., 2012). However, little is known about either the propagation of cortical dynamics into the GrC layer, or how properties of cortico-cerebellar communication develop with learning.
GrC anatomy is highly distinctive: each GrC receives only four inputs, called mossy fibers, which are fixed during development and can originate from neocortex via the pontine nuclei, as well as from the brainstem and spinal cord (Huang et al., 2013; Sillitoe et al., 2012). Moreover, different GrCs are unlikely to share the same set of four inputs. Therefore, any individual signal originating in L5 might recombine with three other disparate mossy fibers in a given GrC, and the vast number of GrCs (more than half of all neurons in the brain) could permit many distinct input recombinations. This basic, conserved anatomical feature is thought to allow the GrC layer to produce outputs highly distinct from those of cortex (Albus, 1971; Babadi and Sompolinsky, 2014; Billings et al., 2014; Cayco-Gajic et al., 2017; Chabrol et al., 2015; Litwin-Kumar et al., 2017; Marr, 1969).
Despite these anatomical clues, studies have yet to detail the functional properties of L5-GrC transmission and its evolution with learning. This stems from a few technical hurdles. First, recording granule cells is challenging due to their small size and high packing density, with recordings from ensembles of granule cells in behaving animals only recently achieved via two-photon Ca2+ imaging (Giovannucci et al., 2017; Knogler et al., 2017; Wagner et al., 2017). Second, simultaneous single-cell-resolution recordings have not yet been obtained from L5 cells and GrCs. As a result, prior studies of cortico-cerebellar interaction have not observed L5-GrC signal transmission and its evolution during learning. Here, we devised a strategy for simultaneous chronic two-photon imaging of premotor cortical L5 neurons and cerebellar GrCs, and uncovered surprisingly shared cortico-cerebellar dynamics that emerged as animals gained expertise on a forelimb movement task.
RESULTS
Simultaneous Imaging of Neocortex and Cerebellum in Behaving Mice
To characterize disynaptic projections from the neocortex to the cerebellum in mice, we performed projection-based monosynaptic retrograde rabies tracing (TRIO; Schwarz et al., 2015) to identify cortical neurons presynaptic to pontine neurons that project to the cerebellar cortex. We found neurons from nearly every cortical region were presynaptic to pontine neurons that project to the dorsal surface of the cerebellum (Figure S1), similar to previous reports in rats and monkeys using polysynaptic rabies tracing (Kelly and Strick, 2003; Suzuki et al., 2012). We focused on the premotor cortex, given the importance in theoretical models of cortical transmission of motor plans to the cerebellar cortex (Moberget and Ivry, 2016).
We devised a strategy to simultaneously monitor activity of premotor L5 cells (Rbp4-Cre+ pyramidal neurons) and the cerebellar input layer (GrCs) with single-cell resolution. We adapted a custom two-photon microscope that enabled imaging of two distant brain areas via a pair of mechanically articulated optical arms, each equipped with its own microscope objective lens (Lecoq et al., 2014) (Figure 1A, left; Figure S2). To image premotor cortex at the rostral forelimb area, we used a microprism for better optical access to layer 5b, which is enriched for subcortically-projecting pyramidal neurons. We also placed a cranial window over cerebellar lobules VI, simplex, and crus I (Wagner et al., 2017), regions that are forelimb-related and receive heavy inputs from the pontine nuclei (Huang et al., 2013; Suzuki et al., 2012) (Figure 1A, right). We used transgenic mice that expressed the genetically-encoded Ca2+ indicator GCaMP6f (Chen et al., 2013; Madisen et al., 2015) in both L5 cells and GrCs. Together, these methods allowed simultaneous 30-Hz two-photon imaging of somatic Ca2+ activity of 73±7 premotor L5 cells and 86±7 cerebellar GrCs (mean±SEM across n=28 imaging sessions in 10 mice) (Figure 1B and Movie S1). Due to Ca2+ indicator kinetics, the GCaMP6f transients in our imaging data likely correspond primarily to multiple spikes (Chen et al., 2013; Giovannucci et al., 2017) (STAR Methods). Thus, our recordings are more attuned to sustained activity, as observed in cortex during the planning or delay periods of motivated behaviors (Li et al., 2015), than to individual spikes. We therefore designed a movement planning task with the potential to engage sustained neural signaling.
Figure 1. Simultaneous Two-photon Ca2+ Imaging of Cerebellar GrCs and Premotor Cortex L5 Pyramidal Neurons during a Forelimb Movement Task.

(A) Experimental schematics. Mice voluntarily moved a manipulandum for sucrose water reward (left). We performed simultaneous Ca2+ imaging in cerebellar GrCs through a cranial window, and in L5 pyramidal neurons of the premotor cortex using an implanted 1 mm prism (right). GCaMP6f was expressed in L5 cells and GrCs using quadruple transgenic mice Rbp4-Cre/Math1-Cre/Ai93/ztTA.
(B) Mean images from representative two-photon Ca2+ imaging movies in L5 cells (left) and GrCs (right). The spatial filters used to extract fluorescence traces from cells with detected activity are highlighted in grayscale or red/blue (see G below; n=144 L5 cells/177 GrCs).
(C) Forelimb movement task. Water-restricted mice self-initiated trials. The task alternated blocks of 40 forward/left-turn movements with blocks of 40 forward/right-turn movements. No cues indicated trial type.
(D) Example movements on the virtual right-angle track (left panel, n=20 each of pure left and right turns; right panel, n=8 error-correction turns in each direction).
(E) Average motion over time in forward (black curve) and lateral (colored curves) directions for all pure turn trials in the session in D, aligned temporally to turn onset (n=51/63 pure-left/pure-right turns). Dashed vertical line denotes average forward movement onset.
(F) Behavioral performance: left, average duration of forward and turning portions of pure turn trials (n=28 imaging sessions in 10 expert mice). Right, pure turns are more common after learning (p=0.003, Wilcoxon rank sum test, n=7/21 for Day-1/Expert sessions in 7 mice).
(G) For the imaging session in B, example fluorescence traces from both cortex (top) and cerebellum (bottom). SD, standard deviation (fluorescence in z-scored units). Dashed vertical line indicates time of switch from a left-turn block to a right-turn block of trials. Solid vertical lines denote individual turn motions. Traces show direction-preferring cells colored by their direction preference (n=20 example L5 cells and GrCs, 10 preferring each direction; 11 turn motions in each direction). Corresponding cell spatial filters are colored in B.
See Figures S1–S3 for related anatomy, methods, and necessity of imaged areas for behavior.
Our task required mice to make a sequence of two perpendicular motions in a virtual track (STAR Methods): a 6-mm forward motion followed by a 6-mm lateral motion to the left or to the right, with reward delivered after a delay period of 1 s. Left and right trials occurred in alternating blocks of 40 trials, without a cue (Figures 1C–E). The common forward motion preceding both left and right turns implied that different neural states prior to turning likely reflected different movement sequence plans. For analyzing behavior, we classified “pure” turn trials as those in which the mouse did not push the handle in the incorrect lateral direction by more than 500 μm at any point during either the forward or lateral motion segments—a strict criterion to identify correctly planned motions. Trials in which the mouse exceeded this threshold were scored as error trials, regardless of the mouse’s paw motion subsequent to the erroneous motion (in some cases, the mouse “recovered” to successfully execute the correct motion, Figure 1D, while in other cases, it exceeded a physical threshold beyond which the trial automatically terminated, STAR Methods). After training (~3 weeks, ~30 min/day), expert mice executed pure turns on 60±3% of attempts, with movements spanning ~400 ms in total (Figure 1F). Optogenetic manipulations demonstrated that both the cortical and cerebellar regions that we imaged were critically necessary for task execution (Figure S3A–G). By examining single-cell activity traces, we found that both L5 cells and GrCs often appeared preferentially active during trials of one turn direction (Figure 1G).
Similar Task Representations in L5 Cells and GrCs in Expert Mice
We first characterized neural representations of the motor task in expert mice. To identify task-locked activity of each cell, we aligned its time-varying fluorescence on all trials to turn onset, and then computed the average across trials (separately for pure left and pure right turns). We often observed L5 cells with direction-preferring responses both during and substantially earlier than the onset of movement (Figures 2A and 2B, top). This is consistent with other planning tasks, in which premotor cortex activity precedes upcoming movements (Li et al., 2015; Shenoy et al., 2013). In addition to movement-locked signals, we computed time-varying trial-averaged fluorescence aligned to reward delivery and found that many L5 cells responded selectively prior to or during reward consumption, often preferentially following one turn direction (Figures 2C and 2D, top).
Figure 2. Similar Task Representations in L5 Cells and GrCs in Expert Mice.

(A–D) Trial-averaged activity in example L5 cells (top) or GrCs (bottom) that responded preferentially before and during either left- or right-turn movements (A and B), or reward consumption (C and D) following either successful left- or right-turn trials. Vertical lines from left to right in A and B denote average forward motion onset, turning motion onset, and average reward delivery time. Vertical lines in C and D denote average time of turning motion and reward delivery. Shaded areas denote SEM in this and all subsequent figures. (From left to right for L5 cells: 109/76/72/109 left- and 74/71/71/74 right-turn trials; for GrCs: n=68/97/72/109 left- and 69/99/71/74 right-turn trials).
(E) Individual neurons were scored by linearly regressing their concatenated single-trial activity onto a set of 8 behavioral regressors.
(F) Fraction of cells with significant coefficients for either turn direction (grey) or with significantly larger coefficients for one turn direction (colored) among L5 cells (left) and GrCs (right) (n=2,037/2417 for L5 cells/GrCs from 28 imaging sessions in 10 mice; these and all subsequent histogram error bars are from counting statistics).
(G) All GrCs or L5 cells that responded preferentially prior to one turn direction were grouped. The discrimination index for each trial was the time-varying difference between the average activity of left- and right-preferring pre-turn cell groups. Traces show average discrimination index across all pure-turn or all error trials (sign of index was inverted on right trials to match sign of left trials; n=1,498 pure-turn trials and 612 error trials, on which incorrect lateral motion exceeded 2.5 mm, from 5 mice. Index normalized to range from – 1 to 1). On error trials, neither ensemble discriminated turn direction prior to lateral motion onset (from −300 to −50 ms relative to turn onset; p=0.22/0.67 for 720/536 GrCs/L5 cells with pre-turn direction preference, Wilcoxon signed rank test).
(H) Time-varying trial-averaged activity of each L5 neuron was reproduced by linear regression from the activity of either L5 or GrC populations. Regressions performed at similarly high levels (R2, fraction of variance explained on held-out data; 28 sessions in 10 mice).
(I) PCA was performed across cells, using the fluorescence concatenated across all trials of each individual L5 cell or GrC. Fewer principal components are needed to explain 50% of GrC variance than are needed for L5 (p=0.002, Wilcoxon sign-rank test, n=28 imaging sessions from 10 mice).
We next examined the trial-averaged activity of GrCs, which exhibited response profiles with selectivity similar to that of L5 cells (Figures 2A–D, bottom). While we have previously reported reward-related signals in GrCs (Wagner et al., 2017), to our knowledge this is the first report of movement-planning-related signals in GrCs. To quantify the prevalence of different responses in L5 and GrC ensembles, we defined a set of behavioral regressors that each indicated a key task event: pre- and post-turn and pre- and post-reward, separately for left and right pure turn trials (Figure 2E). Cells were considered responsive to a task event if the corresponding regression coefficient was significant, and direction-preferring if the coefficient was significantly larger for one turn direction (STAR Methods). Overall, similar proportions of active L5 cells and GrCs were direction-selective during each task phase (Figures 2F), which was surprising given that input recombination in the GrC layer is thought to generate activity profiles distinct from those of the neocortex (Marr, 1969). However, while active L5 cells and GrCs contained broadly similar responses, the populations differed in the fraction of visible GCaMP-expressing cells without any detectable activity, suggesting differential recruitment of L5 cells vs. GrCs by our task. Of the cells with visible baseline fluorescence, 55% of GrCs and 18% of L5 cells were undetected by the cell-extraction algorithm, which only identifies neurons with activity. Manual analysis confirmed that such undetected neurons had near-zero Ca2+ event rates (STAR Methods). Since neurons that we did not extract were inactive (possibly due to spiking levels below detection threshold), L5 cells and GrCs hereafter denote the set of all extracted neurons.
To further assess and compare motor planning dynamics in L5 and GrC ensembles, we defined a metric to discriminate turn direction using each population’s activity prior to turn onset. On each trial, we computed the time-varying difference between the average activity of all pre-left-turn- and of all pre-right-turn-preferring L5 cells (Figure 2G, left) and GrCs (Figure 2G, right, normalized to range from −1 to 1; cells identified from regressions in Figure 2F). Direction discrimination rose at similar rates in both L5 cells and GrCs prior to pure turns, but was absent prior to motion on error trials. Hence, pre-turn L5 cells and GrCs exhibited similar motor planning dynamics.
We next used linear regression analysis to directly compare the similarity of active L5 and GrC ensembles. We found that GrC ensembles were as accurate as L5 ensembles at reproducing the trial-averaged time-varying activity of individual L5 cells (Figure 2H), indicating that most activity profiles in L5 were recoverable in the GrC layer. We also quantified the overall diversity of ensemble activity using principal components analysis (PCA). We performed PCA across all cells, using each cell’s concatenated activity on all movements (pure turns and errors). Thus, for each imaging session, we performed one PCA on a (T×N)-by-C matrix, where T is the number of trials, N is trial duration (−2 to 2 s relative to turn onset), and C is the number of cells. The resulting principal components are linearly independent activity patterns that account for the most variability across neurons. We found that the number of principal components needed to explain a given fraction of population activity in GrCs was slightly lower than in L5 cells (Figure 2I). Together, these results indicate that L5 cells and GrCs encoded the task similarly, had common trial-averaged response profiles, and exhibited comparable response dimensionality.
Highly Correlated Single-trial L5-GrC Activity in Expert Mice
In addition to sharing similar task representations in their trial-averaged activity, L5-GrC pairs often exhibited strong single-trial correlations (Figure 3A). We sought to quantify correlations within and across L5 and GrC populations. Although correlation magnitudes depend on how they are measured (Cohen and Kohn, 2011), all measurement factors were common to L5 and GrC recordings. Thus, the inter-areal and intra-areal correlations can be directly compared. We used the concatenated single trial activity of each cell [the (T×N)-by-C matrix described above] and computed the matrix of pairwise correlation coefficients between every pair of columns of the matrix. We first characterized each neuron’s correlation to other neurons via its “best-match” partner cell (Figure 3B). Remarkably, overall L5-GrC correlation magnitudes were nearly as high as those between different L5 cells in our small imaging fields (Figures 3B, 3C). L5-GrC correlations were also consistent across the cerebellar lobules we imaged (Figure 3D). Correlations between GrCs were even higher than L5-L5 or L5-GrC correlations (Figures 3B, 3C; Figure S3H). Analysis of the distribution of correlations among all cell pairings yielded similar results (Figure S3I).
Figure 3. Highly Correlated Single-trial L5-GrC Activity in Expert Mice.

(A) Example of a highly correlated L5 cell-GrC pair. Vertical lines denote individual turning motion onsets.
(B and C) Cumulative distributions of correlation coefficients between each GrC or L5 cell and its best-matching GrC or L5 cell (mean±SEM; n=2,037/2,417 L5 cells/GrCs; computed over the concatenated activity on all movements from −2 to 2 s relative to turn onset).
(D) Correlations with imaging sessions grouped by the cerebellar lobule that was imaged.
(E) Example highly correlated L5-GrC pair (r=0.59). Black asterisks indicate GrC events not present in the L5 cell.
(F) Scatter plot of all highly correlated L5-GrC pairs (defined as r>0.4; each dot is a pair) showing the proportion of total L5 events that were unique to the L5 cell (x-axis), compared to the proportion of GrC events that were unique to the GrC (y-axis). GrC-only events were substantially more common (p<10−6 Wilcoxon signed rank test, n=800 L5-GrC pairs with r>0.4 from 28 imaging sessions in 10 mice). Red dots indicate examples from E, G, and H, from left to right.
(G) Top, fluorescence traces from a highly correlated L5-GrC pair (r=0.43), with onset of individual turn motions denoted by vertical lines. Asterisks denote L5-GrC shared events (green) or GrC-only events (black). Bottom, the temporal distribution (relative to forelimb movement) of shared events is very similar to the temporal distribution of GrC-only events.
(H) Same as G, for a L5-GrC pair (r=0.41) in which the temporal distribution of GrC-only events strongly diverged from that of L5-GrC shared events.
(I) Histogram of the dissimilarity (Kullback-Leibler divergence, KL, STAR Methods) between the temporal distribution of shared events and the distribution of GrC-only events, for all highly correlated pairs. Red vertical lines indicate example pairs in G and H with KL divergences of 0.85 and 2.3, respectively. Most cell pairs are more similar to G than to H.
See Figure S3 for additional data analyses, and Figure S4 for theoretical analyses.
Control analyses suggest that L5-GrC correlations were contributed substantially by shared trial-to-trial variability, rather than resulting only from common task tuning (Figure S3J, K). To exclude the possibility that correlations result from systematic factors, we performed simultaneous imaging of GrCs and the orbitofrontal cortex (OFC), where the density of L5 cells that project to cerebellum via pons is similar to that of premotor cortex (Figure S1). Our OFC L5-GrC data shared the same systematic factors as our premotor L5-GrC data: transgenic mice, Ca2+ indicator kinetics, genetically defined class of L5 cells, and motor task. But in contrast to our premotor L5-GrC data, OFC L5-GrC correlations were substantially weaker (Figures S3L–O). Thus, no systematic factors or artifacts can account for high premotor L5-GrC correlations. Taken together, high correlations between premotor L5 cells and GrCs demonstrate shared dynamics.
GrCs Exhibit More Ca2+ Events and Greater Reliability than L5 Cells
High single-trial correlations between GrCs and premotor L5 cells demonstrated faithful recapitulation of cortical dynamics in the GrC layer. To identify more subtle differences between GrCs and L5 cells, we analyzed correlated L5-GrC pairs in greater detail. Even for highly correlated L5-GrC pairs, activity in the GrC and L5 cell still occasionally differed. We found that L5-GrC discrepancies frequently resulted from Ca2+ events in the GrC that were missing from the L5 cell (Figure 3E). Overall, for highly correlated L5-GrC pairs (defined arbitrarily as r>0.4), a significantly greater proportion of GrC events were present only in the GrC (“GrC-only” events), compared to the proportion of L5 events that were present only in the L5 cell (“L5-only” events, Figure 3F).
To determine the behavioral significance of GrC-only versus shared L5-GrC events, we compared the temporal distribution of the two event types relative to forelimb movement. Most often, GrC-only events occurred at similar times during the trial as shared L5-GrC events (Figure 3G). This indicated greater GrC reliability relative to similar L5 cells, potentially resulting from pontine integration of similarly-tuned L5 neurons. Less frequently, we observed GrCs for which GrC-only events were temporally distinct from shared L5-GrC events (Figure 3H), potentially reflecting GrC multiplexing of disparate input signals. Overall, GrCs often exhibited more activity with more reliable signaling than the L5 cells to which they were correlated (Figure 3I). Thus, while L5 cells and GrCs share similar dynamics, GrC encoding is of greater fidelity, suggesting that pontine integration may reduce noise. Simulations indicated that the shared L5-GrC dynamics in our data are challenging to explain if GrC output combines substantial contributions from multiple mossy fiber inputs, but follow naturally if the output of some GrCs is dominated by a single input, such as a task-related signal originating in cortex (Figure S4).
Pontine Contribution to L5-GrC Dynamics
To verify that cortico-cerebellar transmission contributes to L5-GrC correlations and GrC task representations, we expressed inhibitory opsins in the basal pontine nuclei (Figure 4A). In expert mice (n=10), we imaged GrCs while photoinhibiting pontine neurons on a random 20% of trials (Figures S5A–K). In a small subset of GrCs, turn direction-preferring responses were abolished by pontine photoinhibition (Figures 4B, 4C). Inhibition was equally common in cells of each response type (Figure S5L). In total, 10% of GrCs were inhibited and 10% were disinhibited during pontine inhibition (Figures 4D, 4E, S5M, and S5N), the latter likely due to reduced inhibition from Golgi cells (Billings et al., 2014).
Figure 4. Contributions of Pontine Input to GrC Representations and Correlations to L5.

(A) Schematic showing optical fibers implanted bilaterally above the basal pontine nuclei transduced with either of the AAVs indicated.
(B and C) Trial-averaged activity of example left- (B) or right- (C) turn-preferring GrCs under normal conditions or during optogenetic inhibition of the pontine nuclei (67/95 and 17/24 laser-off/laser-on trials in B and C respectively). Vertical dashed lines show average forward motion onset.
(D) Fraction of GrCs significantly inhibited (n=174) or disinhibited during pontine photoinhibition (n=163; out of 1,681 total imaged in 21 imaging sessions in 10 mice; significance determined via permutation test at p<0.01).
(E) Fluorescence decrease for all inhibited GrCs, averaged over an 800 ms window centered on the time at which fluorescence was maximally reduced on laser-on trials relative to laser-off trials.
(F) For all inhibited GrCs in mice with simultaneous L5 imaging, each cell’s highest pairwise correlation coefficient to an L5 cell is reduced during laser-on trials compared with laser-off trials (p<10−6, Wilcoxon signed-rank test, n=115 inhibited GrCs and 1,042 total L5 cells from 16 imaging sessions in 6 mice). Dashed line in this panel and G shows chance value determined from trial-shuffles in which the trial numbers for cerebellar and cortical activity are randomly mismatched.
(G) For inhibited GrCs, pontine photoinhibition decreases the fraction of GrC activity explained by linear regression using simultaneous L5 activity (p<10−6 Wilcoxon signed-rank test).
See Figure S5 for methods and related data.
In six mice, we performed simultaneous premotor L5 and GrC imaging in conjunction with optogenetic inhibition of the pons. Pontine inhibition lowered L5-GrC correlations (Figure 4F) and decreased the fraction of GrC activity explained by L5 using linear regression (Figure 4G). These data likely substantially underestimate the effect of pontine input to GrCs, due in part to incomplete viral coverage of the pontine nuclei (Figure S5O). As a result, L5 activity was largely unaffected (Figure S5P) and behavior was unchanged during the random 20% interleaved pontine inhibition trials (Figure S5Q). Thus, changes in GrC activity were most likely due to the direct effects of diminished pontine input to GrCs, rather than indirect consequences of altered cortical activity or behavior. (However, behavioral performance was degraded during an alternative paradigm employing continuous inhibition for two 40-trial blocks of movements; Figure S5R). While there may also be contributions from common input or cerebello-cortical feedback (Gao et al., 2016), these data indicate that pontine transmission contributes to GrC task encoding and to L5-GrC correlations.
Common L5 and GrC Task Representations Emerge Concurrently over Learning
What is the origin of shared cortico-cerebellar dynamics observed in expert mice? To address this question, we tracked the activity of individual L5 cells and GrCs over the 2–3 week course of task learning (Figures 5A and 5B). Our training procedure began with an initial period (3–7 days) without imaging during which mice learned the basic task structure by performing forward-only movements in a linear track for reward. Chronic imaging began on the first day in which mice were exposed to the movement sequence task. Early in learning, both L5 cells and GrCs often had activity time-locked to movement or reward without distinguishing left- from right-turn trials. Over time, these cells lost their responsiveness to one turn-direction selectively (Figures 5C and 5D). Equally common were cells that were time-locked to a particular phase of the task and with strong direction preference late in learning, but which were not time-locked at that phase early in learning (Figures 5E and 5F).
Figure 5. Common L5 and GrC Task Representations Emerge Concurrently during Learning.

(A and B) Example mean fluorescence images of the same L5 cells (A) and GrCs (B) acquired over learning. Arrowheads point to example cells that were tracked across days.
(C–F) Trial-averaged activity of example L5 cells (C and E) and GrCs (D and F) shown on days corresponding to early, mid, and late learning. Cells develop direction-preferring activity time-locked to movement (C and D) or reward (E and F) (mean±SEM; left/right turn trial numbers for C, D, E, F: Early: n=40/18, 24/68, 29/18, 29/18; Mid: 34/27, 57/33, 48/36, 17/45; Late: 109/74, 24/37, 72/71, 72/71).
(G) All cells were scored on each day for direction preference and task-locking using regression analysis as in Figure 2E. For the set of all L5 cells (left) and GrCs (right) that had direction preference on the final day of imaging, activity was primarily either modulated at the same time but without direction preference (dark gray) or was not modulated at that time (light gray) on earlier days (n=183/206 L5 cells and 172/202 GrCs from early/mid-learning, respectively). Direction-preferring activity was only infrequently maintained (white).
(H and I) Based on regression analysis (as in Figure 2E), more cells had direction-preference late in learning (H, p=6×10⁻⁶ and 5×10⁻⁶ for early vs. late for L5 and GrCs; Wilcoxon rank sum test; n=11 early, 19 mid, and 21 late imaging sessions from 7 mice), and regressions more accurately reproduced each cell’s activity (I; p< 10−6 Wilcoxon rank sum test for early vs late in L5 and GrCs; n=1,265/1,397, 2,113/2,324, 1,666/1,647 L5/GrC observations early, mid, and late, respectively).
(J and K) The entire ensemble of GrCs or L5 cells was scored for its fidelity of behavioral encoding. The accuracy of reproducing behavioral signals shown in Figure S6A via single-trial linear regression rose over learning (J, mean±SEM; late vs early, p=0.0009 and p=9×10⁻⁵ for L5 and GrC respectively; n=11 early, 19 mid, and 21 late learning imaging sessions from 7 mice). In addition, regression accuracy for GrC populations (x-axis) and L5 populations (y axis) in each imaging session (colored dots) covaried over learning (K, 51 imaging sessions from 7 mice).
(L and M) L5 and GrC ensembles both became lower-dimensional over learning, as the top 10 principal components (as computed in Figure 2I) explained greater fractions of single-trial variance (L, p=5×10⁻⁶ and 3×10⁻⁵ for GrCs and L5 cells, respectively), and fewer components were required to explain 50% of variance (M, p=4×10⁻⁵ and p=0.007 for GrCs and L5 cells respectively, Wilcoxon rank sum test, 11 early, 21 late sessions).
See Figure S6 for further analyses and related data.
To quantify these trends, we used two methods to assess the neural encoding of behavior. First, we examined behavioral encoding by individual cells, using linear regression of the single-trial fluorescence of each individual L5 cell or GrC onto the set of behavioral regressors from Figure 2E. We thereby identified all cells which, late in learning, had significant direction-preference during a particular phase of the task. We found that, earlier in learning, such cells were generally either not responsive at that time, or responsive but not direction-selective (Figure 5G). Overall, substantially more neurons exhibited direction-preference late in learning (Figure 5H). Moreover, these regressions more accurately reproduced each cell’s activity after learning (Figure 5I), indicating stronger relationships between neural activity and behavior.
Second, we assessed the behavioral information conveyed by the L5 and GrC neural ensembles. We defined “behavioral signals” that selectively indicated either movement or reward on either left or right turn trials (Figure S6A, left). We then used the concatenated single-trial population activity of either L5 or GrC ensembles to reproduce each of these behavioral signals in turn via separate linear regressions (Figure S6A, right), and tabulated the mean accuracy of these regressions (R2). This analysis demonstrated that both L5 and GrC ensembles encoded more behavioral information after learning (Figure 5J). Moreover, the fidelity of GrC and L5 ensemble behavioral encoding covaried across imaging sessions (Figure 5K). Thus, task encoding emerges concurrently in L5 cells and GrCs during learning.
In addition to increasing the prevalence of task-encoding neurons, learning also decreased the overall diversity of activity among different neurons in the L5 and GrC ensembles. For each imaging session, we performed PCA across cells on single-trial activity from all movements (as in Figure 2I). We tabulated both the variance explained by the top 10 PCs, as well as the number of PCs required to explain 50% of variance in ensemble L5 or GrC activity in each session. Over learning, both parameters indicated reduced dimensionality in both L5 cells and GrCs (Figures 5L and 5M). Trial-averaged response profiles similarly became lower dimensional (Figure S6B). Thus, L5 cells and GrCs together exhibit increased task encoding and reduced response diversity during learning.
Cortico-cerebellar Correlations Rise over Learning
Are the strong L5-GrC correlations a product of connectivity established during development, or produced during learning? To address this question, we first identified L5-GrC pairs that were highly correlated on the final day of imaging (arbitrarily defined as pairs with r>0.4). We found that despite robust last-day correlations, these pairs were less correlated earlier in learning (Figures 6A; S6C). To exclude the possibility that this resulted simply from random fluctuations in correlations caused by the passage of time, we similarly identified L5-GrC pairs that were highly correlated early in learning (r>0.4), which were less common. We found that such pairs tended to remain substantially correlated late in learning (as compared to the initial correlations of pairs with high last-day correlations; Figure 6B). In addition, when considering all cells, correlation magnitudes similarly rose with learning (Figure S6D, E). Increased correlations were due both to more similar trial-averaged activity patterns and to greater shared trial-to-trial variability (Figures S6F, G). Increased correlations were also not caused by increased Ca2+ event rates, which fell slightly over learning (Figure S6H). Moreover, analysis of temporal lags in the computation of cross-correlations between all L5 cells and GrCs demonstrated that neurons also became more temporally aligned (Figure S6I). Consistent with increasing pairwise correlations, population L5 activity more accurately reproduced single-trial activity of individual GrCs via linear regression after learning (Figure 6C). Taken together, these data demonstrate that learning promotes L5-GrC single-trial correlations.
Figure 6. Shared Cortico-cerebellar Dynamics Emerge Over Learning.

(A) Example L5-GrC pair strongly correlated late in learning was poorly correlated early in learning. Vertical lines denote onset of individual turn motions.
(B) L5-GrC pairs that were highly correlated on the last day were weakly correlated early in learning (solid trace; p<10−6 Wilcoxon signed-rank test, n=121 pairs with last-day correlations >0.4). Dashed trace shows the evolution of correlations for pairs with high correlations early in learning. The initial correlation for last-day-correlated pairs was weaker than the final correlation of first-day-correlated pairs (p=3 ×10⁻⁶ Wilcoxon rank sum test, n=61 pairs early learning correlations >0.4).
(C) The accuracy with which L5 population activity reproduced the fluorescence of each GrC via linear regression rose over learning (curves show mean±SEM across GrCs; p<10−6 comparing early and late learning, Wilcoxon rank sum test).
(D) The single-trial activity of all GrCs was simultaneously reproduced via linear reduced rank regression using L5 population activity. Regression accuracy rose over learning (black), while the average rank (dimensionality) of the L5-GrC regression fell (green; curves show mean±SEM across imaging sessions from 7 mice).
(E) For each GrC (represented by a dot), the change in its average correlation magnitude to all other GrCs (x-axis) strongly covaried with the change in its correlation to all L5 cells (n=398 GrCs tracked over learning).
(F) Matrix of correlation coefficients between each pair of neurons for 4 days between early and late learning in one mouse (n=55/53 L5 cells/GrCs). K-means clustering (k=2) identified groups of neurons that together exhibited similar changes in correlation to all other neurons over learning. Clustering was applied to the differences in correlation coefficients between Day 17 and Day 1. The thick solid black outlines in the matrix show the resulting clusters. The neurons are sorted in the same order on each day. Bottom, pie charts show substantial contribution of GrCs and L5 cells to both clusters.
(G) The correspondence between cluster membership and L5/GrC cell type was characterized via the normalized mutual information. Mutual information was generally close to zero, indicating that L5 cells and GrCs were recruited together into coherently evolving cell assemblies during learning. Boxes show median, 25/75th percentiles over 1,000 clustering instantiations.
See Figure S6 for further analyses and related data.
The rise in both inter-areal (L5-GrC) and intra-areal (GrC-GrC and L5-L5) correlations over learning suggested that the two ensembles had converged onto a shared low-dimensional space of activity patterns. To quantify this, we performed a reduced rank regression between L5 cells and GrCs, which attempts to find the lowest-dimensional projection of L5 ensemble activity needed to reproduce the most possible GrC ensemble activity. This analysis confirmed that, compared to early learning, L5 ensembles in expert mice explained more GrC activity while using a lower-dimensional projection of their ensemble activity (Figure 6D).
We next investigated whether increased coupling between lower-dimensional L5 and GrC activity involved the emergence of mutually correlated groups of L5 cells and GrCs. In support of this, we found that GrCs that developed stronger correlations with the rest of the GrC ensemble over learning were substantially more likely to also exhibit increased correlation with L5 cells (Figure 6E). To explicitly identify mutually correlated groups of GrCs and L5 cells that emerged over learning, we performed k-means clustering analysis on the changes in population pairwise correlation coefficients (Figure 6F, top; clustering performed on the difference in correlations between the first and final days of imaging). Cell groups identified to have undergone coherent changes in correlation during learning contained substantial numbers of both L5 cells and GrCs (Figure 6F, bottom). We used mutual information to quantify the amount of information about cell type (L5 or GrC) provided by the cluster membership and found little tendency for clusters to segregate by cell type (Figure 6G). Taken together, these data suggest that over learning, groups of initially dissimilar L5 cells and GrCs converge together onto shared activity patterns.
Evolution of L5-GrC Dynamics Parallels Behavioral Improvement
To assess how emergent cortico-cerebellar dynamics related to improved behavioral performance over the multi-week learning process, we first quantified behavioral learning. We found that pure turns as a fraction of all trials rose over learning (Figure 7A, left). Kinematically, the average time to execute a movement decreased (Figure 7A, middle), due to faster transitions between the forward and lateral motions (Figure 7A, right; Figure S7A, S7B). Thus, mice planned more continuous movement sequences after learning. We summarized behavioral performance by the pure turn fraction and compared its session-by-session changes to the simultaneously acquired neural activity. Over weeks of learning, pure turn fraction covaried with behavioral encoding in both L5 and GrC ensembles (Figures 7B and 7C, assessed by the fidelity of linear regression to behavioral signals as in Figure 5J). In addition, L5-GrC coupling (measured by the accuracy of linear regression of single-cell GrC activity onto the L5 population activity, as in Figure 6C) also covaried with behavioral performance gains across imaging sessions (Figure 7D). Thus, behavioral learning is a key factor in the emergence of shared L5-GrC dynamics.
Figure 7. Coherent L5-GrC Dynamics Reflect a Learned Circuit State.

(A) Behavioral learning. Pure turns as a fraction of trials increased (left, p=0.003, n=7 mice). Total movement duration decreased (middle, p<10−6), reflecting briefer transitions between the forward and lateral motions (right, p<10−6; n=460/2,062 Day-1/late learning trials; 19.3±1.1 days between day 1 and last day). Statistics compare all Day 1 to all late-learning days, using trials from all mice (2.8±0.5 expert days per mouse; Wilcoxon rank sum test).
(B, C) Behavioral encoding via linear regression in L5 (B) and GrC (C) ensembles covaried with behavioral performance over learning.
(D) The fraction of GrC variance explained by L5 ensembles via linear regression also covaried with behavioral performance.
(E) Within each imaging session, each successful trial was ranked by its kinematic similarity to the average pure turn trajectory of the same direction. From an example mouse, 10 trajectories in each direction are shown from three sets of trials: from a late-learning day, the subsets of trials most and least consistent with the average trajectory (left two columns), and from a mid-learning day, the subset of trials most consistent with the average trajectory (right column). Top row shows trajectories in x-y space, and middle and bottom rows show forward and lateral motion over time.
(F) For each late- and mid-learning imaging session, best-match L5-GrC correlations were computed using only trials from either the most consistent or least consistent subset (20 top- and bottom-ranked trials in each direction). L5-GrC correlations were not significantly different between most and least consistent trials on the late learning day (distributions shown for mouse in E; black versus grey, p=0.35, Kolmogorov-Smirnov test, n=149/152 GrCs, and 143/134 L5 cells, from the mid-/late-learning days, respectively). By contrast, even the most consistent trials on the mid-learning day exhibited substantially smaller L5-GrC correlations than did the least consistent late learning trials (p=0.0001).
(G) Schematic of evolution of L5 and GrC ensemble dynamics over learning. From an initially less coherent, higher-dimensional, less task-related set of activity patterns, L5 and GrC ensembles converge onto a more shared, low-dimensional, task-encoding set of activity patterns.
See Figure S7 for further analyses and related data.
Shared Cortico-cerebellar Dynamics Reflect A Learned Circuit State
The parallel emergence of shared L5-GrC dynamics and improved behavioral performance may reflect different potential relationships between neural activity and behavior. In one possible scenario, neural representations could be fixed with respect to motor output. In this case, apparent increases in neural correlations over learning simply reflect more cohesive motor output. For example, more coherent activation of different muscles might cause the activity of neurons that represent distinct variables to appear more correlated. Alternatively, learning could recruit L5 cells and GrCs into more coherent dynamics through synaptic changes. The first hypothesis predicts that cortico-cerebellar correlations should covary with trial-by-trial variations in motor performance within a single imaging session, rather than learning per se. By contrast, the circuit plasticity hypothesis predicts that L5-GrC correlations are determined by the state of learning in the circuit, which evolves slowly over days.
To distinguish between these hypotheses, we leveraged trial-to-trial variability in motor output during individual imaging sessions. We identified the trials most or least kinematically similar to the average pure turn trajectory in each imaging session (Figure 7E). We tested two predictions. First, in late learning, we found that L5-GrC correlations during least consistent trials were no different than during the most consistent trials (Figure 7F and S7C). Thus, trial-to-trial variations in motor output do not significantly alter cortico-cerebellar correlations. Second, we compared the least consistent trials late in learning to the most consistent trials in mid-learning. Despite greater motor stereotypy, the most consistent mid-learning trials exhibited substantially weaker L5-GrC correlations than did the least consistent late-learning trials (Figure 7F and S7C). Together, these data support the interpretation that L5-GrC correlations are produced by plastic circuit changes over the multi-week learning process: neural correlations are largely unchanged by trial-by-trial fluctuations in kinematic stereotypy within a single imaging session. These conclusions also held when we restricted our analysis to the set of neurons consistently tracked throughout learning (Figure S7D). Thus, our data suggest that the emergence of shared L5-GrC dynamics reflects plastic circuit changes that increase the prevalence of correlated task-encoding activity patterns across both populations.
DISCUSSION
By performing the first simultaneous recordings of neocortical layer 5 projection neurons and cerebellar granule cells in behaving mice over learning, we found that as animals learned, L5 and GrC ensembles converged onto increasingly shared, low-dimensional, and task-encoding activity patterns (Figure 7G). These data indicate that, although GrC anatomy permits diverse signal recombinations, a key outcome of learning in the cortico-cerebellar pathway is in fact increasingly similar dynamics in cortex and cerebellum. As a result, task-related L5 dynamics are faithfully recapitulated, rather than extensively transformed, in the GrC layer in expert mice.
Discrepancies with Dimensionality Expansion Theory and Potential Resolutions
At a basic level, GrC activity that is dominated by low dimensional, task-encoding L5 dynamics in expert mice differs from frameworks emphasizing GrC dimensionality expansion (Albus, 1971; Fujita, 1982; Marr, 1969). However, there are several caveats. First, dynamics and correlations will vary by the timescale of analysis (Cohen and Kohn, 2011; Kadmon and Sompolinsky, 2015), which in our data is set by the relatively slow GCaMP kinetics. While results may differ on faster timescales, our findings of increased correlations over learning are likely to remain similar. Second, we note that ~50% of GrCs and ~20% of L5 cells exhibited near-zero Ca2+ activity. While inactive cells cannot significantly increase the dimensionality of activity in our task, as they contribute little additional variance (STAR Methods), they do suggest a larger reservoir of representational capacity in the GrC network, which is an important aspect of classical theory.
Finally, while the classical theory of granule cell function (Albus, 1971; Marr, 1969) focused on dimensionality expansion, a modern reanalysis of this theory indicates that maximal dimensionality expansion is not always preferable, as such expansion alone can also amplify input noise (Babadi and Sompolinsky, 2014; Kadmon and Sompolinsky, 2016; Litwin-Kumar et al., 2017). Thus, noise reduction is a theoretically predicted requirement for the cortico-cerebellar pathway. Our work supports this prediction, as GrCs in expert mice were often more reliable than L5 neurons (Figure 3). From this perspective, GrCs may sacrifice dimensionality expansion to avoid amplifying cortical noise in our task. A direction for future study would be to determine how L5-GrC correlations and dimensionality depend on task complexity (Gao and Ganguli, 2015).
Mechanistic Implications
Our data show that individual L5 cells and GrCs share similar activity in expert mice. Our simulations suggested that these findings were most consistent with a scenario where, for a subset of GrCs, activity is dominated by the input from just one mossy fiber (Figure S4), likely as a result of learning. This is surprising in light of GrC anatomy (see Introduction). On the other hand, the existence of inactive GrCs in our data may imply that different GrCs operate in qualitatively different regimes: classical sparsely active coincidence detectors (Chadderton et al., 2004) versus densely active relays of cortical dynamics, with transmission modes potentially modulated through plasticity (Gao et al., 2012). This segmentation of granule cell activity may have important effects on computation in downstream Purkinje cells (Galliano et al., 2013), which is an interesting subject for future study.
An additional key feature of our learning data is that directional selectivity emerged over learning in previously non-selective L5 cells and GrCs, seemingly at random (Figure 5). This observation suggests that L5-pons transmission is itself plastic (Figure S4). Specifically, it is likely that GrCs inherit direction selectivity from direction-selective mossy fiber inputs, since each GrC receives a fixed set of only four mossy fiber inputs. Thus, pontine neurons likely also transmit direction-selective signals. If, over learning, direction selectivity emerges randomly among different L5 cells, pontine neurons would need to adaptively reweigh different L5 inputs as they evolve, in order to avoid mixing away L5 selectivity before transmission to GrCs. Thus, a plastic cortico-pontine pathway may aid in the selection and denoising of cortical representations, before expansion in the GrC layer (STAR Methods).
New Perspective on Cortico-cerebellar Communication: Shared Dynamics Emerge with Learning
Our premotor L5 cortical data are broadly consistent with studies demonstrating that cortical neurons develop more stereotyped task-locked responses during learning (Peters et al., 2014). Other frontal cortical regions—similarly to the frontal premotor region we studied—have been found to exhibit relatively low dimensional activity that mimics task complexity, in contrast to higher dimensional sensory areas (Brincat et al., 2018; Inagaki et al., 2018). Theoretical analysis suggests that, whereas machine learning algorithms often involve high-dimensional representations, low dimensionality—especially in simpler tasks—may be a fundamental outcome of learning in neocortical circuits, potentially increasing robustness to noise and aiding pattern completion (Denève et al., 2017).
Our simultaneous L5-GrC recordings expand these concepts by demonstrating that the cerebellum is strongly coupled into this learning process, as low-dimensional cortical dynamics that emerge with learning extend with striking fidelity into the cerebellar GrC input layer. This finding has important implications for the larger recurrent cortico-cerebellar network, in which cerebellar output returns to cortex via thalamus (Kelly and Strick, 2003). Recent work suggests that projections from the cerebellar nuclei to the neocortex are required for sustained cortical activity (Chabrol et al., 2018; Gao et al., 2018). Truly sparse GrC representation as classically predicted might prevent propagation of cortical dynamics through the cerebellar circuit. By contrast, if many GrCs faithfully transmit prominent cortical signals, they may more effectively shape downstream Purkinje cell and cerebellar nuclei firing patterns that ultimately feedback to cortex. Our findings that L5 and GrC ensemble dynamics co-evolve during learning support the notion that reciprocal interactions between cortex and cerebellum may underlie the learning process. Overall, our data suggest that it will be critical to study cortex and cerebellum as a joint dynamical system to fully understand the contributions of each to behavioral learning and performance.
STAR*Methods
CONTACT FOR REAGENT AND RESOURCE SHARING
Further information and requests for resources and reagents should be directed to and will be fulfilled by the Lead Contact, Liqun Luo (lluo@stanford.edu).
EXPERIMENTAL MODEL AND SUBJECT DETAILS
Mice
All procedures followed animal care and biosafety guidelines approved by Stanford University’s Administrative Panel on Laboratory Animal Care and Administrative Panel on Biosafety in accordance with NIH guidelines. To express the Ca2+ indicator GCaMP6f (Chen et al., 2013) in cerebellar GrCs and neocortical layer 5 pyramidal cells, we used the Cre- and tTA-dependent GCaMP6f transgenic mouse line Ai93 (TRE-lox-stop-lox-GCaMP6f) (Madisen et al., 2015). We crossed the Ai93 mouse to a Cre-dependent tTA mouse ztTA (CAG-lox-stop-lox-tTA). In parallel, we crossed Math1-Cre, to obtain expression in granule cells as described previously (Wagner et al., 2017), to Rbp4-Cre, which in the cortex is expressed mainly in layer 5 pyramidal neurons (Gerfen et al., 2013). Mice were aged 6–16 weeks at the start of experimental procedures and were in good health. Except in the cases indicated, in which animals contributed to multiple datasets, mice were not used in previous surgical or experimental procedures. Prior to their training on the tasks used to generate the datasets in this study, mice were naïve to the behavioral task; mice used to study learning were naïve to the movement planning task, while mice that were only studied in the expert state had previously undergone training as described in the “Behavior” section below. We used a total of 24 Ai93/ztTA/Math1-Cre/Rbp4-Cre quadruple transgenic mice (9 females and 15 males on mixed genetic backgrounds) for all experiments. In expert mice, behavioral performance was similar for male and female mice (pure turn fraction, p = 0.76, Wilcoxon rank sum test, n = 29 and 17 sessions from male and female mice). We also confirmed that pairwise correlations among granule cells, a central statistic of our findings, were similar in expert male and female mice (p = 0.24, r = 0.43±0.01 and 0.46±0.02 in 29 and 17 sessions from male and female mice). 10 contributed to premotor cortex / cerebellum dual site imaging data of Figures 1–3. Of these, 7 were imaged repeatedly over the course of task learning (Figures 5–7), and of those 7, in 4 we were able to track the same neurons repeatedly until mice had mastered the task. 6 premotor / cerebellum dual-site mice, along with 4 cerebellum-only imaging mice, contributed to the pons-inhibition data (Figure 4). Of these 10 total, 7 underwent inhibition via eNpHR3.0 and 3 via iC++. 6 mice contributed to orbitofrontal cortex (OFC) / cerebellum dual site imaging data (Figure S3). 2 mice contributed lateral Crus II GrC imaging data in Figure S3. In addition, 12 wild-type C57/bl6 mice were used for tracing studies in Figure S1, and 3 double-transgenic Gad2-Cre (Taniguchi et al., 2011) / Ai32 (CAG-lox-stop-lox-ChR2) (Madisen et al., 2012) on mixed genetic background were used for the optogenetic behavioral studies in Figure S3. Mice were singly housed during the period that experiments were performed. Mice were housed in plastic cages with disposable bedding on a 12 hour light/dark cycle with food available ad limitum, and water available ad libitum until experiments began, in which case they were placed on a water restricted regime as described below. Experiments were done during the dark phase.
METHOD DETAILS
Cortex-cerebellum connectivity tracing
Wild-type mice were injected with 500 nL CAV-Cre (Soudais et al., 2001) (genomic titers ~1012/mL) in one of several cerebellar folia (Vermis lobule VI: 750 μm lateral of midline, 500 μm anterior of the post-lambda suture; Vermis lobule VII: 750 μm lateral of midline, between the mediolateral vessels separating lobules VI and VII, visible through the thin posterior skull surface; Simplex: 2.1 mm lateral, −5.9 mm from bregma; Crus2: 3 mm lateral, between the mediolateral vessels separating the crus1 and paramedian lobules, visible through the thin posterior skull surface). Mice were also injected with 500 nL of AAV8-hSyn-FLEx-TVA-mCherry-2A-G (genomic titer 1012/mL) in the pontine nuclei bilaterally (−3.9 mm from bregma and 0.6 mm laterally). 2 weeks later, mice were injected in the pontine nuclei with G-deleted EnvA-pseudotyped Rabies-eGFP (genomic titers generally 109/mL). The procedure follows previously established protocols (Schwarz et al., 2015).
Histology
We anesthetized mice using tribromethanol (Avertin) and transcardially perfused them with phosphate-buffered saline (PBS) followed by 4% paraformaldehyde (PFA). We extracted the brains into 4% PFA for 24 h of post-fixation, followed by at least 24 h in 30% sucrose solution. We cut 40 or 60 μm tissue sections on a cryotome (Leica). Sections in Figure S1 were imaged using a slide scanner (Leica) and a 20× 0.8 NA objective.
For pontine rosette counting in cerebellar cortex (Figure S5O), we used a confocal microscope (Zeiss) with a 40× 1.4 NA objective to image 42 regions (area: 213 × 213 μm) from the dorsal surface of the cerebellum where we generally imaged in vivo, from 4 of the mice that were used for optogenetic inhibition experiments. We collected a z-stack through the entire labeled thickness of the tissue (mean z-stack thickness: 28±1 μm). We then visualized each z-stack as a volume in Imaris (Bitplane) and manually identified and counted mCherry-positive terminals in the volume.
Surgical procedures
Given the complexity of our multi-port optical preparation (Figure S2A) – consisting of a window over the cerebellum, prism in the motor cortex, bilateral fibers for pons inhibition, and two head-fixation headplates – we used computer-aided design (CAD) software (Creo Parametric, PTC) to plan our preparation. The model of the mouse skull was derived from micro-CT volumes (Mouse Imaging Centre, Toronto). In addition to ensuring the basic fit of all components on the mouse head, we used CAD planning to confirm that the microscope objectives used for the cortex and cerebellum did not collide with one another during imaging or with the implanted optical fibers.
We anesthetized mice using isoflurane (1.25–2.5% in 0.7–1.3 L/min of O2) during surgeries. We removed hair from a ~10 mm diameter patch of skin over the skull, cleaned the skin with Betadine, and removed the patch of skin. We then peeled back connective tissue and muscle and dried the skull.
For cerebellar implants, we drilled a 3 mm diameter cranial window centered anterioposteriorly over the post-lambda suture and 1.5 mm right of the midline (Figure S2B, left). This positioned the window over cerebellar lobules VIa, VIb and simplex. To seal the skull opening, we affixed a #0 3 mm diameter glass cover slip (Warner Instruments) to the bottom of a 3 mm outer diameter, 2.7 mm inner diameter stainless steel tube (McMaster) cut to 1 mm height (Figure S2B, top right). We stereotaxically inserted the glass/tube assembly into the opening in the skull at a polar angle of 45° from the vertical axis and an azimuthal angle 25° from the midline (Figure S2B, bottom right). We then fixed the window in place and sealed it using Metabond (Parkell). We next affixed a custom stainless steel head fixation plate to the skull using Metabond and dental cement (Coltene/Whaledent). The 1.8 mm-thick headplate had a central 5 mm diameter opening to accommodate the glass/tube assembly, and two lateral extensions to permit fixing the plate to stainless steel holding bars during imaging and behavior. Among the cohort of mice, we took particular care to install the headplate at a consistent rotation angle about the implant axis, as variations in this angle could result in gross discrepancies in the positioning of the front part of the head containing the cortical implant.
For optogenetic inhibition of the pons, we first injected either AAV8-hSyn-eNpHR3.0-mCherry (n=7 mice) or AAV8-hSyn-iC++-mCherry (n=3 mice) bilaterally into the basal pontine nuclei. We drilled two small holes (~0.5 mm) in the cranium 3.9 mm posterior to bregma and 0.6 mm left and right of the midline. We injected 500 nL of virus at a depth of 5.6 mm below lambda. We then implanted multimode fibers to illuminate the pons. Notably, the fiber implants (Doric Lenses, either 200 μm core/0.66 NA (3 mice) or 400 μm core/0.66 NA (7 mice)) had a short, 3.6 mm height ferrule (Figure S2C, left) which helped to avoid collisions with the imaging objectives. We stereotaxically inserted the fibers at a lateral tilt of 22°, entering the brain surface at 2.6 mm lateral of the midline, to a depth of 4.6 mm along the insertion axis (Figure S2C, right). We cemented the fiber cannulas in place using Metabond.
For premotor cortical prism implants, we drilled a 3 mm diameter cranial window centered at the coordinates of the rostral forelimb area, 1.5 mm anterior of bregma and 1.1 mm lateral of the midline (Figure S2D). We then used a scalpel blade (EMS #11 feather) to make a 1.2 mm-long parasagittal incision centered in the opening (Figure S2E). After cleaning any bleeding, we used a fine forceps to carefully peel back the dura medial of the incision to facilitate insertion of the prism into cortex (Figure S2F). We found that leaving the dura intact over the tissue lateral to the incision (which is the tissue that is imaged by the prism) was critical for subsequent imaging quality. We glued a 1 mm right angle prism with protected aluminum mirror coating on the hypotenuse (Shanghai Optics) to the bottom of a 3 mm cover slip / steel tube assembly (Figure S2G). Using the stereotax, we inserted the prism into the incision at a tilt of 10°, lowering until the surface of the brain was maximally flush with the glass. We cemented the implant in place using Metabond.
For Gad2-ChR2 optogenetic behavioral studies, we implanted the 3 mm window assemblies described above into the cerebellar area, as well as into the premotor area (but without a prism).
For orbitofrontal cortex implants (OFC), we drilled a ~2 mm diameter opening in the skull centered at 1.2 mm lateral of midline and 2.1 mm anterior to bregma. We removed the dura over the insertion area, then stereotaxically inserted a 1 mm diameter, 0.5 NA GRIN lens (GRINTech) glued to a 1 mm right angle prism mirror into the brain to a depth of 3.2 mm below bregma with the prism facing medially. We cemented the GRIN-prism probe in place using Metabond. As OFC columns are oriented vertically, our protocol kept the columns containing the imaged neurons intact. The OFC / cerebellum preparation (Figure S3L) provided greater clearance between objectives during simultaneous imaging than the premotor cortex / cerebellum preparation.
Two-photon microscopy
We performed all Ca2+ imaging using a custom two-photon microscope with two articulating objective arms (Lecoq et al., 2014). Each arm operated as an independent two-photon microscope (Figure S2H), with its own piezo-mounted (P-725.4CD, Physik Instrumente; or nPFocus100SL, nPoint Inc.) microscope objective and GaAsP photomultiplier tube (PMT; H10770PA-40, Hamamatsu). Each arm was also equipped with an “eyepiece” CMOS camera (DMK 23UV024, The Imaging Source) to visualize microscope positioning with bright-field illumination of the sample (with the main dichroic removed). We used a 40× 0.80 NA objective (LUMPlanFLN 40XW, Olympus) for all cerebellar imaging, covering a 250 × 250 μm field-of view (FOV); and a 20× 0.50 NA objective (UMPlanFLN 20XW, Olympus) for all cortical imaging. Premotor cortical imaging generally provided ~600 × 600 μm FOV, whereas OFC imaging through a 1 mm GRIN-prism probe (either #1050-002184, Inscopix; or custom-assembled) covered a 570 × 570 μm FOV.
A Ti:Sapphire laser (MaiTai, Spectra Physics) provided 920 nm excitation for two-photon imaging. For the cerebellum and premotor cortex, we used ~50–60 mW (each) after the objective. For imaging the OFC, we used 80–90 mW after the objective, as measured above the implanted GRIN-prism probe.
Each microscope arm had six mechanical degrees-of-freedom (DOF): three translational DOFs to position the objective tip in space, two rotational DOFs to adjust the orientation of the optical axis, and fine, piezo-controlled movement along the objective axis. In addition, the sample stage had three translational DOFs, and the behavioral apparatus could be finely rotated (in the xy plane) on top of the sample stage. In total, our imaging apparatus afforded 16 mechanical degrees-of-freedom to achieve simultaneous imaging of cortex and cerebellum (Figure S2I).
To align the two microscope objectives to the cerebellar and cortical implants, we utilized the laser back-reflection technique described previously (Wagner et al., 2017), but in the following three-step order (Figure S2J). In Step 1, we aligned the 40× objective to the cerebellar window primarily using the “vertical” rotation of the objective (i.e., rotation in the yz plane) and the translational DOFs and “horizontal” rotation (i.e., in the xy plane) of the sample holder. Next, in Step 2, we aligned the 20× objective to the cortical implant utilizing only the translational and rotational DOFs of that objective. Finally, in Step 3, for fine tuning and live adjustment of the imaging FOVs, we utilized only the translational and piezo DOFs of each objective.
We used ScanImage 5.2 software (Vidrio Technologies) to control each microscope. All movies were acquired at 512 × 512 pixel resolution at ~30 Hz frame rate. For all except iC++ experiments, we operated the two microscopes asynchronously. The precise temporal relationship between the two Ca2+ movies was established by sampling both microscopes’ frame clocks with a common digitizer (Logic 8 Pro, Saleae). For iC++ experiments, we explicitly synchronized the two microscopes at the frame level by providing the frame clock of one microscope to the external trigger input of the other. We assessed the level of synchronicity by recording both pairs of frame and line clocks. We observed a slight, variable delay (~0.1 ms; to be compared with a frame period of ~33.3 ms) in the timing of the externally triggered frame relative to the “master” frame clock. The delay was taken explicitly into account in the iC++ deinterlacing procedure.
Image preprocessing and extraction of Ca2+ signals
We applied a common image preprocessing pipeline to all two-photon movies. First, we corrected for any DC offset in the pixel values (which can originate, for example, from an arbitrary bias in the PMT preamplifier). For each frame, we computed the minimum pixel value over the entire image. We then averaged this value over all frames, and subtracted the result from all pixels in the movie. Next, we corrected brain motion using piecewise rigid motion correction (NoRMCorre) (Pnevmatikakis and Giovannucci, 2017) over 64 × 64 pixel patches of the image. We then corrected for slow drifts in movie brightness over the course of the session (e.g. caused by slow loss of immersion fluid). We estimated a frame’s “brightness” by its mean pixel value over the entire image. We then fitted an exponential curve (a * exp(−b * t) + c) to the brightness as a function of frame, and divided each frame by its fitted brightness. Finally, we z-scored each pixel using its mean value and standard deviation over all frames.
Two-photon movies acquired during simultaneous optogenetic perturbation underwent a modified version of the above pipeline. For iC++, we deinterlaced image frames during optogenetic perturbation periods (Figure S5J) prior to DC offset correction. For both iC++ and eNpHR3.0, we performed brightness drift correction by fitting only to the laser-off frames. We then computed the difference between average laser-on and laser-off images, to check for brightness increases during laser-on periods due to residual optogenetic light leakage. With eNpHR3.0, we typically observed a full-field brightness increase (~2%) on laser-on frames, whereas for iC++ we observed transient increases in brightness (~2%) following subfield transitions. We fitted these artifactual increases in brightness and compensated them on all laser-on frames.
To identify cells and extract their activity traces from the z-scored Ca2+ movies, we used the constrained non-negative matrix factorization (CNMF) cell-sorting algorithm (Pnevmatikakis et al., 2016), manually adding additional sources as necessary based on the neighboring-pixel correlation image. We utilized custom software written in MATLAB to visually check all candidate cells produced by CNMF and confirm that each had a morphology and Ca2+ activity trace consistent with an L5 cell or a GrC.
For downstream analyses, we did not use the deconvolved Ca2+ signals directly from CNMF, but recomputed the fluorescence traces by applying the manually confirmed spatial filters to the z-scored movie via least squares. We then removed high-frequency noise from these traces by low-pass filtering with a 2nd order Butterworth filter (−3 dB frequency at 4 Hz). We removed slow drifts from each trace by subtracting a 10th percentile-filtered (15 s sliding window) version of the signal.
Potentially inactive neurons
The CNMF algorithm only extracts neurons with detectable fluorescence activity. Other cells can be seen in background fluorescence that are not detected by CNMF. To obtain an estimate of the fraction of visibly GCaMP6f-expressing GrCs and L5 cells without detectable activity, and therefore not included in our analyses, we computed the mean projection image and manually counted the number of visible neurons (n=4 imaging sessions). We found that CNMF-extracted neurons were 45% of all visible GrCs, and 82% of total visible L5 cells. By applying ROIs to the manually-identified inactive neurons, we extracted fluorescence traces from these visible-but-not-CNMF-extracted cells. This analysis confirmed that “inactive” cells had few, if any, bona fide identifiable Ca2+ transients (Ca2+ event rate: 0.02±0.002 Hz, mean±SEM, n=459 manually identified GrCs; 0.04±0.004 Hz, n=82 L5 cells; compare to Figure S6H). The primary analyses that gave rise to our conclusions were derived from the structure of L5 and GrC activity: behavioral encoding (inactive cells neither contribute nor degrade population encoding); fractions of GrC activity explained by linear regression onto L5, or vice versa, and, similarly, best-match correlation coefficients (inactive cells are not recruited into regressors); dimensionality assessed by PCA (inactive cells do not contribute variance, and thus do not affect the dimensionality of activity). As a result, our primary conclusion—that the activity of L5 and GrC ensembles converges onto a shared, low-dimensional, task-encoding subspace of responses over learning—is unaffected by the inclusion or exclusion of silent cells. Interestingly, however, the greater number of inactive GrCs does suggest a substantially larger “reservoir” of spare representational capacity in the GrC network, potentially engaged by contexts other than our behavioral task.
Relating GrC Ca2+ transients to spiking
Prior work imaging cerebellar granule cells with patch electrode recordings from the same cells in vitro estimated that 1 GrC action potential is likely associated with ~15% Δf/f GCaMP6f transients (Giovannucci et al., 2017). Similarly, in vivo anesthetized V1 recordings in L2/3 found 1 action potential was associated with ~15% Δf/f (Chen et al., 2013). To calibrate our Ca2+ data against these references, we converted our fluorescence traces into Δf/f units and then computed two critical quantities. First, we computed the noise floor, as the spread of the distribution of fluorescence values excluding Ca2+ transients. Across cells, we found that the 99th percentile value for the noise distribution was 16±0.2% Δf/f for GrCs and 12±0.2% Δf/f for L5 cells (mean±SEM across 568 GrCs and 368 L5 cells). Hence, it is likely that only multi-spike events consistently rose above our noise floor. Second, we examined the amplitudes of Ca2+ transient events used in analyses in Figure 3. We found that the mean Ca2+ event height was 48±1% for GrCs and 38±1% for L5 in Δf/f units (mean across cells), suggesting that most detected Ca2+ events fall into the multi-spike regime.
Behavior
For all behavior, mice were water restricted to 1 mL of water per day. Mice were monitored daily for signs of distress, coat quality, eye closing, hunching, or lethargy to assure general health. During behavioral training and imaging, mice generally received all water during daily training sessions. During all experiments, we recorded licking at 200 Hz using a capacitive sensor coupled to the metal water port, which delivered ~6 μL 4% sucrose water reward near the animal’s mouth per successful trial. For all experiments, mice were head-fixed and their bodies were loosely constrained by a custom 3D printed transparent plastic tube.
The apparatus used for all forelimb tasks was as described previously (Wagner et al., 2017). In brief, 3D-printed plastic pieces were assembled into the configuration shown in Figure 1. The two primary linkages consisted of a passive “elbow joint” that rotated via ball bearings, and a “shoulder joint” actuated by a DC motor (Maxon DCX22) for which the rotation was measured by an optical encoder (Gurley Precision Instruments R120). A passive “wrist” joint connected the two linkages via a ball bearing at the handle. Control of the device was programmed in Labview (National Instruments) via a compact RIO chassis (cRIO 9024 with two 9505 motor driver modules and a 9403 digital I/O module) that communicated with a Windows PC. Software consisted of nested control loops: a 10 kHz FPGA controlled motor current and encoder reading; a 1 kHz real-time PC performed all other computations, including geometric transformations and force production calculations, and processes including data sampling, buffering and transfer to the Windows PC; and the Windows PC controlled high-level behavioral transitions including trial type specification, trial start and end, reward delivery, and data logging.
Training on the motor planning task proceeded in stages. Mice were first trained to push the handle forward in a virtual linear track by 7–8 mm to receive a sucrose water reward. Following movement, a 1 s delay preceded reward delivery, followed by another ~2 s delay before the robot automatically returned the handle to the mouse for the next trial, a process which took ~1.5 s. Mice trained in this condition for 3–7 days, until they reliably performed ~200 trials in a 20–30-minute session.
After mice became proficient on linear movements, we exposed them to the movement sequence task, designed to assess motor planning similar to a previous study in humans (Sheahan et al., 2016). Initially, mice moved in a loose right angle track with a 6 mm forward segment followed by a 6 mm lateral segment, directed either left or right. The loose track was implemented by a proportional-integral-derivative (PID) controller that responded to increasing deviation of the handle from the desired trajectory with an increasing opposing force. Specifically, during the first segment until forward motion reached 6 mm, the robot opposed only lateral motion. During the second segment, the robot only opposed forward/backward motion. Deviations less than 0.05 mm were ignored by the controller. The parameters of the control loop did not perfectly cancel sudden forces exerted by the mouse. Thus, mice had some ability to veer off-track (typically up to ~1 mm, Figure 1D, 7E). Left and right movements alternated in blocks of 40 successful trials. In this phase, if mice pushed the wrong way (i.e., left during a right trial or vice versa) and collided with the virtual walls of the track, they were permitted to recover by pushing in the correct direction. When mice were proficient at this task (minimum 3 days), we changed the task contingency such that if they pushed in the wrong lateral direction during the lateral segment of the trial beyond a threshold (either 0.5 mm or 3 mm), the robot locked in place, ending the trial without reward. The 3 mm threshold drove learning more effectively in mice poor at the task. Following the standard delay (2 s), the handle automatically returned to the mouse for the next trial. We found that this final contingency was critical for mice to pay close attention to their intended turn directions. Highly trained mice could reliably perform ~160–240 trials (i.e., 4–6 blocks of 40) in a 20–30-minute session. For chronic imaging, Day 1 refers to the first day mice were exposed to the loose right-angle track.
Cortical and cerebellar optogenetics studies
Gad2-Cre/Ai32 mice implanted with windows over both the premotor cortical and cerebellar regions that we imaged throughout the paper were trained on the task. During optogenetic manipulation sessions, two collimated optical fibers (~3–4 mm beam diameter) were positioned ~1 cm above each of the two windows to deliver 445 nm light (OBIS 445, Coherent). The laser was pulsed at 50 Hz with 10 ms pulse duration. Time-averaged optical powers were 1–5 mW for the cerebellar window and 9–25 mW for the cortical window, distributed over the ~3 mm of tissue exposed in the windows. These power levels were chosen based on tests during the forward-only movement task. The lower cerebellar power was necessary to avoid inducing right forelimb tremor which precluded forelimb movements required by our task. We trained the mice for 1–2 weeks on the movement sequence task without optogenetic perturbation. During perturbation experiments, following baseline performance (~1–5 minutes), one of the two fibers was activated for 1 minute. After the fiber was turned off, mice were given 1–5 minutes to recover their prior task performance (~10–20 successfully executed trials) before the next 1-minute laser-on period began. Mice received 1–2 laser-on periods for each brain region and for each movement direction (left or right) per experiment. Each of the 3 mice underwent 3 experiments.
Pontine optogenetics studies
We performed pontine inhibition experiments in conjunction with single-site cerebellar imaging in 4 mice and with dual-site premotor and cerebellar imaging in 6 mice. For pontine manipulation during cerebellar imaging without cortical imaging, we mounted the fibers from the laser (FG025LJA, Thorlabs) directly on-axis with the implanted fibers (Figure S5A and S5B) using standard ferrule mating sleeves (Doric Lenses). For pontine inhibition during dual-site imaging, it was necessary to re-route the optogenetic fibers to avoid the cortical objective. We designed a custom micro-optical assembly, consisting of a GRIN lens collimator and a right angle prism mirror, to fold the fiber axis by 90° above the implanted fibers (Figure S5C). While the GRIN-prism component (#1050-002186, Inscopix) was not originally designed for this application, optical simulation (Zemax) showed that it sufficed to mode-match the output light of the incoming fiber onto the face of the implanted fiber (Figure S5D). Using the fold adapter on both fiber implants allowed for optogenetic manipulation of the pons during dual-site imaging without collisions (Figure S5E).
To actuate eNpHR3.0 (Figure S5F), we utilized a 594 nm laser (OBIS 594, Coherent) filtered by a 592/8 bandpass filter (FF01-592/8-25, Semrock). During pons inhibition trials, we opened a shutter to allow for continuous-wave illumination of the pons. In the emission path of the two-photon microscopes, we inserted a 594 nm notch filter (NF03-594E-25) to suppress excess photons from leaking into the PMT. For eNpHR3.0, spectral separation was sufficient to allow for GCaMP6f imaging in the cerebellum and dorsal cortex despite concurrent 594 nm illumination in the pons (Figure S5H).
To actuate iC++ (Figure S5G), we utilized a 488 nm laser (LuxX 488-200, Omicron), filtered by a 482/18 bandpass filter (FF02-482/18-25), and equipped the two-photon microscopes with a 496 nm longpass filter (FF01-496/LP-25). In contrast to the eNpHR3.0 / 594 nm case, spectral separation did not allow two-photon imaging of GCaMP6f during concurrent iC++ actuation (Figure S5I). Hence, to allow for simultaneous iC++ actuation during two-photon imaging, we devised a temporal multiplexing protocol in addition to spectral separation.
Our temporal multiplexing scheme utilized a duty ratio of ~1:1 between iC++ actuation and GCaMP6f imaging, thereby reducing the effective imaging frame rate to 30/2=15 Hz. During optogenetic perturbation, we divided the imaging frame into an odd number (e.g. N=11) of subfields. On odd-numbered imaging frames, we imaged the odd subfields (Figure S5J, top left) and enabled the 488 nm laser during even subfields; and on even-numbered frames we imaged the even subfields (top middle) and enabled the 488 nm laser during odd subfields. Hence, every pair of optogenetics-interlaced frames could be combined to produce a full frame image (top right). We implemented the multiplexing scheme with a microcontroller (Arduino Mega 2560) that took as inputs an “opto enable” TTL signal along with the frame and line clocks from the microscope and computed a “laser enable” TTL signal that modulated the 488 nm laser (Figure S5J, bottom).
During optogenetic imaging experiments, we activated the laser on 20% of trials for the entire duration of the trial (i.e., from the return of the handle from the previous trial, until the return of the handle for the subsequent trial, overall ~4 s).
Chronic imaging studies
For the chronic studies in Figures 5–7, imaging began from the first day on the movement sequence task. We imaged each mouse multiple days over the first 7–9 days of training on the task, by which point they had achieved general competency. We called any sessions acquired during the first 3 days “early” learning, and afterwards “mid” learning. For all mid-learning sessions error turns were penalized by aborting the trial with no reward. After this initial imaging period, we continued training mice for another 7–14 days without imaging until they achieved asymptotic task performance. We then returned for final imaging sessions (“late” learning). We performed these experiments in 7 mice, but we were only able to track individual neurons from early to late learning in 4 of those 7. Thus, all analyses requiring consistent cell identity were restricted to the 4 mice in which we successfully tracked neuronal identity over learning.
Aligning cells across days
First, we performed image registration – either MATLAB’s built-in intensity-based affine registration (imregtform), control point-based projective geometric mapping (fitgeotrans), or rigid-only NoRMCorre registration – to rigidly align each day’s mean image to that of every other day. This step primarily accounted for lateral variations in the field-of-views on each day. We supplemented the rigid alignment with NoRMCorre’s non-rigid registration to correct for any nonlinear discrepancies in the mean images. We thus obtained spatial transformations between every pair of days, which allowed spatial filters from each day to be “imported” into the coordinate frame of every other day.
Next, we sought to maximize the number of matching cells across days. Generally, cells absent one day but detected on another day could be due to multiple reasons: (1) the cell was not present in the movie due to lateral or axial shifts in the imaging field; (2) the cell was present in the movie, but not active; or (3) the cell was both present and active but simply “missed” by the extraction algorithm. Because it was not always possible to distinguish between (1) and (2), we maximized the number of cross-day matches only by minimizing the number of cells falling into case (3) for each day.
To identify potential “missed” cells, we used previously computed spatial transformations to determine which cells were identified on one day but missing on another (“unmatched” cells). We then “imported” the unmatched spatial filters. For a particular day, this produced multiple sets of possibly missed cells, derived from each of the other days. We then extracted traces for all filters while eliminating duplicates, and manually examined each one to determine whether a cell was in fact present with at least one Ca2+ fluorescence transient. For ~50% of such missed cell candidates, transients were in fact present. By including “missed” cells in this way, the number of cells on each day typically increased by ~2×.
Finally, using the “missing cell”-corrected datasets, we performed cell map alignments between the last training day to all other days. Across datasets, 35±3% of cells present on the last day were present on all previously imaged days.
QUANTIFICATION AND STATISTICAL ANALYSIS
Behavior analysis
For trial-locked and trial-averaged analyses, we used either the onset of lateral motion or the time of reward delivery to align trials. We defined the turn onset as the time when lateral motion crossed a 0.5 mm threshold. In cases where mice made small, back-and-forth lateral movements, we used the final threshold crossing as the midpoint. We divided trials into two main categories. “Pure” left or right turning trials were those in which the animal’s lateral motion did not stray more than 0.5 mm in the wrong direction. “Error” trials were those in which mice attempted to move in the wrong direction.
For analyses of task encoding, to minimize behavioral differences between mice and between training days, we restricted analysis to pure left or right turns which were more kinematically similar. For all other analyses including correlations and dimensionality assessment we included all trials.
Analysis of neural task encoding
We performed two main analyses of cells’ task-encoding. The first was a single-cell analysis (Figure 2E,F 5G,H,K) in which we used linear regression to “reproduce” a cell’s single-trial fluorescence activity from a set of behavioral regressors. We defined the set of behavioral regressors as indicator signals active over one of the following time windows: the 300 ms before (“pre-turn”) or after (“post-turn”) turn onset, the 300 ms before (“pre-reward”) or after (“post-reward”) reward delivery. We further segregated these signals by left and right turn trials. For each GrC or L5 cell, we then linearly regressed its activity traces during all pure left and right turn trials onto these 8 behavioral indicators. Cells with a significant regression coefficient for either turn direction were considered “modulated” in that corresponding time window. If a cell additionally had a significantly greater coefficient for one direction than for the other then it was considered “direction-preferring” in that window. We also tabulated the variance in each cell’s activity explained by this regression (Figure 5I).
To determine significance for the single-cell behavioral regression analysis, we performed two permutation tests. The first permutation test determined significant modulation. We generated randomized data sets where the times of each trial’s turn onset (the alignment point) was chosen randomly from the full recording. We then aligned all fluorescence activity to these random “trials,” and performed linear regression using the true regressors. If the true weight given to a regressor was greater than that given in 95% of the shuffles, the cell was deemed to be “modulated” by that regressor. The second permutation test determined significant direction preference. We generated randomized data sets by randomly permuting the left/right trial labels of the true fluorescence activity. We then recomputed the same regressions using the randomized left/right fluorescence activity for each shuffle. If the true difference between the weight assigned to a left regressor and that assigned to the corresponding right regressor was larger than the corresponding difference between those regressors in 95% of the shuffles, the regressors were deemed to be significantly different. If, in addition, the preferred regressor had also been deemed to significantly modulate the cell by the previous permutation test, the cell was deemed to be significantly direction preferring in the corresponding time window (pre/post turn or reward).
The second analysis of task encoding employed ensemble activity. In this analysis, we used linear regression to reproduce behavioral signals from the single-trial activity of all cells. The behavioral signals were: a “movement” signal (−300 ms to + 300 ms relative to turn onset) and a “reward” signal (−200 ms to +400 ms relative to reward delivery) for each turn direction, as illustrated in the top row of Figure S6A. We then performed a separate linear regression for each of these “behavioral signals,” using the fluorescence activity of all cells on all trials. An example output of this regression is shown in (Figure S6A). We then tabulated the variance in behavioral signals explained by this regression (Figure 5J, K and Figure 7B, C; for each session, averaged across the regressions for each of the 4 behavioral signals).
Dimensionality analysis
Dimensionality analysis was performed using PCA across cells—i.e., to identify the main contributors to variability across cells (as opposed to variability across trials). We performed two types of analysis. The first analysis was dimensionality of single-trial activity (Figure 2I and 5H, I). In this case, we performed PCA across cells. In the data matrix, each column was the fluorescence of one cell concatenated across all trials (pure turns, errors, aborted trials). Thus, the data matrix was of size (T×N)-by-C, where T is the number of trials, N is the number of timepoints per trial (from −2 to 2 s relative to turn onset), and C is the number of neurons. We then plotted the fraction of total ensemble L5 or GrC signal variance as a function of the number of principal components included in the reconstruction of the original population activity.
The second analysis was dimensionality of trial-averaged activity (Figure S6B; “signal” dimensionality, analogous to “signal” correlations described below). In this case, we computed the trial-averaged activity of every cell on successful left and right turn trials separately and then concatenated the left- and right-trial averages and recorded the results in a data matrix in which each column was the trial-averaged activity of one cell. Thus, the resulting data matrix was of size 2N-by-C. We then performed PCA across cells.
Correlations and L5-GrC regressions
We characterized every GrC by its correlations both to all other GrCs, as well as its correlations to all L5 neurons. Thus, each GrC was associated with two distributions: a distribution of GrC correlations, and a distribution of L5 correlations (full distributions shown in Figure S3I). For each GrC, we summarized these distributions by the best-match correlation, i.e., the maximum of the distribution (Figure 3B). We then tabulated this statistic for all neurons, yielding the distribution of best-match GrC-GrC and L5-GrC correlations. The motivation for using the best-match correlation was two-fold: first, this allowed us to compare representations in similar L5-GrC pairs (e.g., Figure 3); second, the distributions were very heavy-tailed, and the maximum captured the changes in this tail. Nevertheless, as shown in Figure S3I, the full distributions conveyed qualitatively similar information. For each L5 neuron we similarly computed the correlations with all other L5 neurons, and we recorded the best-match correlation for every cell, yielding the distribution of L5-L5 best-match correlations.
To compute correlations in trial-averaged signals (often called “signal correlations”, Figure S6F) or in trial-to-trial variability (often called “noise correlations”, Figure S3K and S6G), we followed standard techniques (Cohen and Kohn, 2011). For correlations in trial-averaged responses, we computed the trial-averaged response of each cell (averaged for left and right turns separately) and then correlated the trial-averaged responses of different cells (with left and right responses concatenated). For correlations in trial-to-trial variability, we concatenated all the single-trial activity for each cell, subtracted from each single trial fluorescence trace the trial-averaged response (for left and right turn trials separately), and then computed the correlations between the mean-subtracted concatenated single-trial responses.
We used linear regression to determine the variance of each individual GrC’s single-trial activity that was explained by the L5 ensemble as an alternative to pairwise correlations (Figure 6C and 7D). We linearly regressed each GrC’s single-trial fluorescence traces concatenated across trials onto all the corresponding traces of all L5 cells. We recorded the R2 fraction of variance explained by this regression. We also performed regression using the trial-averaged activity (Figure 2L). In this case, we computed the trial-averaged activity of every cell on successful left and right turn trials separately and then concatenated the left- and right-trial averages and recorded the results in a data matrix in which each column was the trial-averaged activity of one cell. Thus, the resulting data matrix used for regression was of size 2N-by-C.
To regress the entire GrC ensemble single-trial activity onto the entire L5 ensemble activity and also determine the minimum dimensionality of L5 activity needed to best explain GrC activity, we performed Reduced Rank Regression on the concatenated single-trial activity of all GrCs and L5 cells and tabulated the variance explained and the rank of the regression (Figure 6D).
Due to the marginally different L5 vs GrC sampling rates (variable, but typically ~30.03 Hz in GrC and 29.97 Hz in cortex), we linearly interpolated the L5 signals to match the GrC sampling rate when directly matching time points. In addition, GrC ensembles were slightly larger on average than L5 ensembles (86±7 vs 73±7 cells). To ensure that our results were not impacted by this discrepancy, we performed a Monte Carlo subsampling analysis in which we repeatedly randomly sampled a subset of whichever of the two populations was larger (L5 or GrC), to be the same size as the smaller population, prior to recomputing best-match correlations (as in Figure 3C) or regressions (as in Figure 2H), and produced results nearly identical to those reported in the Figures (data not shown).
Ca2+ event-based analysis
For Ca2+ event-based analyses (Figure 3), we performed threshold-based peak detection (MATLAB’s findpeaks function) using a 1.5 SD threshold and requiring a minimum event separation of 500 ms (motivated by GCaMP6f Ca2+ kinetics). For event matching between one GrC and one L5 cell, we tabulated any events occurring within 300 ms of one another as “matched.” Matching was only performed on highly correlated cells (r>0.4). While we believe that these parameters are appropriate given the temporal characteristics of Ca2+ imaging data, we also confirmed that the principal conclusion drawn from these data—that there are more GrC-only events than L5-only events, for correlated pairs—did not depend on parameters. Namely, we repeated the analysis of Figure 3F using more fine-grained parameters: 250 ms event bins and 150 ms event-matching separation. Under these conditions GrC-only events continued to outnumber L5-only events (p<10−6 Wilcoxon sign rank test). More precise estimates than this are impeded by the Ca2+ indicator kinetics.
We computed the Kullback-Leibler (KL) divergence (Figure 3I) to compare the temporal distribution of shared L5-GrC events aligned to the task to that of GrC-only events. We computed time histograms for GrC-only and shared L5-GrC events (−2.5 s to 2.5 s with 0.5 s time bins) separately for left and right turn trials (and concatenated the histograms for the two directions). We collapsed all events that were outside this interval with respect to movement into the ends of the histogram. We then computed the KL divergence as .
Optogenetic GrC response analysis
To determine which GrCs were inhibited or disinhibited by optogenetic inhibition of pontine neurons (Figure 4, Figure S5), we employed a permutation test. For each GrC, we computed the trial-averaged response on left and right trials separately, and on laser-off and laser-on trials separately. We found the timepoint with the largest decrease in trial-averaged activity on laser-on trials compared to laser-off trials (between −2 s and 2 s), tmax. We then averaged the decrease in an 800 ms window centered on tmax (magnitudes shown in Figure 4E). We then computed the same quantity for trial-shuffled data, in which, for every shuffle, we randomly permuted the laser-off/laser-on trial labels (but only permuted among trials of the same turn direction). If the true maximum decrease was greater than that observed on 99% of the shuffles and if the maximum decrease was at least 0.5 z-scores of fluorescence, we tabulated the cell as significantly inhibited by optogenetic inhibition of pontine neurons. We similarly determined whether cells were significantly disinhibited.
Clustering changes in correlations
To identify clusters of L5 cells and GrCs for which correlations evolved coherently during learning, we first computed the correlation coefficients between all possible pairings among the set of L5 cells and GrCs tracked every day throughout learning (4 mice). To identify clustered changes, we computed the difference between the correlation coefficient matrix on the final day of imaging and on the first day of imaging. We performed k-means clustering on the correlation coefficient difference matrix (“kmeans” function in MATLAB, k=2, although conclusions were unchanged when using three or four clusters). To compute the normalized mutual information between cell type and cluster membership, we used the formula: where the mutual information and the entro , in which N is the total number of neurons, ∣wk∣ is the number of neurons in cluster k, and ∣cj∣ is the number of L5 cells or GrCs, following (Schütze et al., 2008). The normalized mutual information represents the reduction in uncertainty about cell type provided by knowledge of the cluster assignment, relative to the total uncertainty in cell type and cluster assignment measured by entropy, and thus varies from 0 to 1.
Statistics
We used MATLAB (Mathworks) for all statistical tests. We compared medians of two groups using the Wilcoxon rank-sum test. We probed the median difference between groups of paired samples using the Wilcoxon signed-rank test. We also compared the median of a distribution to zero using the Wilcoxon signed-rank test. These nonparametric tests do not assume the data follow a particular statistical distribution. Histogram error bars were computed from counting statistics as , where N=number per bin and Ntotal=total elements.
In some cases where standard statistical tests could not be applied, we used custom permutation tests described in the corresponding analysis sections.
For all statistical tests and all data presentations in each main and supplemental Figure, the n value used to evaluate significance or generate the data figure is indicated in each Figure legend or in each citation in the Results text, as appropriate.
Simulations (Figure S4)
Simulated GrCs. Similar to prior work, we implemented a simulated granule cell input circuit containing NGrC GrCs. Each GrC, σi, i = {1, … , NGC} had binary output (active/inactive) for simplicity. Binary neurons, as previously published (Billings et al., 2014; Gilmer and Person, 2017; Litwin-Kumar et al., 2017), are a reasonable simplification since GrCs have very low tonic firing rates with bursty responses to mossy fiber input (MF) (Chabrol et al., 2015; Chadderton et al., 2004). Simulated GrCs received exactly four MFs. Feedforward inhibition modeled gain control effects of Golgi cells (Billings et al., 2014) by dynamically setting GrC firing thresholds, as originally posited by Marr-Albus (Albus, 1971; Marr, 1969). The dynamic threshold allowed activation of only the top fGrC=10% of GrCs ranked by input strength at each time point (Babadi and Sompolinsky, 2014; Litwin-Kumar et al., 2017). GrCs activity levels were taken from the data (binarized: mean probability of a Ca2+ event in each GrC in each 500 ms time bin was 0.1).
We had no way to accurately determine the fraction of MFs arising from task-related L5 signals. To very roughly estimate, we considered that our tracing studies showed that premotor cortex contributes 15% of cortex-via-pons inputs to this region of the cerebellum (Figure S1). Although the pontine nuclei are the largest source of MFs (Sillitoe et al., 2012), without knowing the true fraction of MFs contributed by pons, we considered a scenario where pons contributed around half of all MF inputs. Thus if each GrC receives input from four nearby MFs at random, combinatorics implies that each GrC has probability pinput=0.27 to receive at least one MF of premotor origin, of which only a small probability (3%) comes from receiving two or more of these inputs which, for simplicity, we ignored in this simulation. An important feature of our imaging data is that 55% of GCaMP-labeled GrCs had few detectable fluorescence transients (see Methods section above). This suggests that most of these GrCs are very unlikely to receive task-related input, and thus suggests that cells from which we extract activity are substantially more likely to receive task-related input. To represent this unknown but likely substantially higher effective probability of receiving task related MF input, we varied pinput widely between 0.4, 0.5, and 0.6, which yielded qualitatively similar results. For simplicity were therefore display only pinput=0.5. (In additional simulations not shown, we explored the possibility that MFs cluster in individual GrCs, such that 50% of premotor-recipient neurons received more than one premotor-derived MF. We explored whether the standard MF integration model could recapitulate our data under these conditions, but due to the heterogeneity of selectivity within premotor L5 itself, this results in GrCs that mix away the selectivity in L5, thereby failing to match our data).
Each MF contributed to the postsynaptic membrane potential of recipient GrCs via synaptic weights drawn from a Gaussian distribution. Due to the dynamic threshold set by feedforward inhibition, and the use of binary GrCs, there is a free choice of scale, thus the magnitude of the moments of the distribution are arbitrary. Formally, the activity of each GrC can be written as
Where Θ is the Heaviside step function which is equal to one in its argument is positive and is zero otherwise. Each row wi of the connectivity matrix had exactly 4 non-zero entries, one of which with probability pinput arose from the pontine MF population. The dynamic threshold, representing feedforward inhibition from Golgi cells, was then set to ensure that .
Simulated MFs.
MF activity was also assumed to be binary, with the probability of activation for each MF in each time bin parametrized by fMF. The constraints provided by the observed GrC activity levels in our data (described above), and satisfying the assumption that GrCs generally require two or more active MFs to fire (Chadderton et al., 2004), were sufficient to determine fMF=0.15. Alternatively, when we considered a model where GrCs can fire with only 1 active MF (Figure S4D,E), we thus required that fMF=0.1.
We simulated two MF populations: “task-related MFs” originating from the pontine layer receiving input from the task-related L5 pool; and a pool of “all other MFs.”
Since for the “all other MFs” population we had no information about response properties or potential correlations to the “task-related MF” pool, we parametrized the correlation among all mossy fibers (x-axis in all panels similar to Figure S4B). We implemented this by generating the “all other MFs” activity as a random projection of the activity of the task-related MF pool combined with noise. At one extreme parameter value, each MF in the “all other MFs” pool reproduced one task-related MF exactly, while at the other extreme, the activity of the “all other MFs” pool was purely random. This maintained the same MF activity level at all correlation parameter values.
For the “task-related MFs,” we simulated a pontine layer. Each pontine cell received input from the L5 layer. Like the GrCs, each pontine cell’s output was binary and in the active state when the weighted sum of its inputs exceeded threshold:
Here NL5 is the number of pons-projecting L5 neurons. The threshold in this layer was chosen to produce a pontine activity level of fMF.
There were two possible mechanisms for the high selectivity (i.e., pre/post left/right movement/reward) of GrCs in our imaging data, which was in turn similar to what we observed in L5: (1) Selectivity was inherited from L5 cells, which would also require pontine cells to be selective. (2) GrCs generate selectivity de novo, which would require GrCs to integrate multiple MF inputs that carry similar weakly selective information. As random combinatorial inputs to GrCs makes (2) very difficult (Litwin-Kumar et al., 2017), we therefore assumed that pontine activity is selective. Therefore, to preserve selectivity in pontine output, we set the synaptic weights from L5 to pons via a simple Hebbian association rule. Specifically, each pontine neuron had a “desired” output activity pattern over the set of stimuli, denoted by , an Npons-dimensional binary vector indicating which pontine neurons are responsive to stimulus μ. The Hebbian association rule ensures selective responses similar to the desired activity patterns (Babadi and Sompolinsky, 2014) by setting the synaptic weights to
Where P is the number of stimuli, with μ = 1, … , P is the NL5-dimensional vector indicating which L5 neurons are responsive to stimulus μ. Since some L5-pons convergence exists (Brodal and Bjaalie, 1997), but the precise convergence ratio is unknown, we set NL5 to be 5 times larger than the pontine layer. Varying this ratio from 1.25, to 2.5, to 5 produced very similar results (data not shown).
Simulated L5 cells.
Input to the model was a set of canonical stimuli, numbering P=10. Each stimulus activated a set of L5 cells, with each L5 cell responding to each stimulus with probability fL5 = 0.1 (again based on event rates in the data). In addition, noise parametrized by η corrupted each L5 cell response, so that each L5 cell had probability fL5η to fire for a stimulus to which it was not responsive, and probability (1 – fL5)η to not fire to a stimulus to which it was responsive. This noise structure produced L5 activity levels that were constant across noise levels. The noise level η allowed control of L5-L5 correlations, and was thus chosen to match correlations to the data (when binarized into events with 500 ms bins, described in Methods section above).
Dominant MF model.
Under an alternative model, task-related MFs (e.g. from premotor L5 via pons) become substantially stronger than other MFs, such that they ‘dominate’ the GrC’s output. We simulated dominant MFs by setting their synaptic strength sufficiently high to activate the recipient GrC with high probability, i.e. synaptic weights above the average GrC activation threshold of 2MF in the random mossy fiber integration model.
Correlation quantification.
In all simulation data panels in Figure S4, correlations were quantified, for each neuron, by the spread of its distribution of correlation coefficients to other neurons (standard deviation). Thus to compare to the data, data correlations in this case were computed as SD of the distribution of correlation coefficients across cell pairs, rather than best-match correlations. This was necessary, because the number of neurons simulated (10,000 GrCs) was much greater than the number recorded in an imaging session, precluding a direct comparison of best-match correlations.
Simulated GrC selectivity.
To measure the selectivity of each of the GrC neurons to the different P stimuli (e.g., Figure S4C), we calculated a response vector for each GrC, measuring the fraction of trials on which it responded to the noisy MF input resulting from that stimulus. Each GrC i thus had a P-dimensional vector with values , μ = 1 ,.., P, each between zero and one. We then calculated the dispersion of these values using
Where the dimension ratio di = 0 implies the GrC responded equally to all patterns, and at the upper bound di = 1 – 1/P implies the neuron was selective to a single stimulus.
Supplementary Material
Figure S1. Most Neocortical Regions Project Disynaptically to Dorsal Cerebellar Cortex in Mice, Related to Figure 1.
(A) Illustration of viral tracing strategy for pontine axon (mossy fiber)-initiated monosynaptic retrograde tracing of cortical inputs to pontine nuclei. In this TRIO (Tracing the Relationship between Input and Output) scheme, pontine neurons that project to dorsal cerebellar cortex were transduced by Cre recombinase-expressing canine adenovirus 2 (CAV-Cre) from their axon terminals, and by AAV expressing Cre-dependent TVA-mCherry and rabies glycoprotein (G) at their cell bodies. This was then followed by injection of EnvA-pseudotyped, GFP-expressing, and glycoprotein deleted rabies virus (RVΔG) at the pontine nuclei. Starter cells are TVA-mCherry+ and GFP+, whereas their presynaptic partners are GFP+ only.
(B) Example image of pons showing TVA-mCherry+/GFP+ pontine starter cells in yellow, and their presynaptic partners in green. Scale bar: 1 mm.
(C) Example images of neocortex layer 5 cells at multiple anterior-posterior planes (60 μm sections, images acquired using a slide scanner), showing labeling in (from top left to bottom right): orbitofrontal cortex (C1), premotor cortex (C2), cingulate (C3), motor and somatosensory cortices (C2-C4), parietal and retrosplenial association cortices (C5), and visual and auditory cortices (C6). Cortical regions annotated with dashed white boxes. Solid yellow boxes indicate regions magnified in the lower left insets of each image to show L5 cell morphology. Scale bar: 1 mm. See legend in (D) for abbreviations.
(D) Quantification of the contribution of each cortical region to the total counted disynaptic neocortical inputs to cerebellar cortex. Each dot within a column represents the fraction of input contributed by that cortical region in one mouse, with CAV-Cre injection locations in the dorsal cerebellar cortex color-coded. Abbreviations: OFC, orbitofrontal cortex; Cg, cingulate; Rsp, retrosplenial; Par, parietal cortex; Aud, auditory; Vis, visual; Pir, piriform; Som, somatosensory.
(E) Scatter plot showing the fraction of cortical inputs from somatosensory and motor areas compared to the total number of cortical cells labeled. Each dot represents one mouse with CAV-Cre injection sites color-coded as in (D). Overall, ~50% of neocortical inputs to cerebellum were somatomotor in origin.
Figure S2. Illustration of Cortex and Cerebellum Imaging Strategy with Pontine Photoinhibition, Related to Figures 1–4.
(A) Top-down view of surgical preparation for premotor cortex and cerebellum imaging with bilateral pontine photoinhibition. We implanted a 3 mm-diameter window over the cerebellum, and a 1 mm right-angle prism in the premotor cortex. Two multimode fiber implants deliver light to the basal pons bilaterally. A 1.8 mm-thick stainless steel headplate over the cerebellum was our primary head-restraint device. An “auxiliary” headplate was necessary to stabilize axial movement (in z) of the cortex. The reference frame xyz is aligned to the mouse skull (x, mediolateral; y, anterioposterior; z, dorsoventral axes) and applies to all figure panels.
(B) Procedure for installing cerebellar implants. We drilled a 3 mm diameter hole in the skull, centered anterioposteriorly over the post-lambda suture and 1.5 mm right of the midline (left), to access lobules VIa, VIb and simplex. We sealed the skull opening with a glass-tube assembly, consisting of a #0 cover slip glued to a 1 mm tall stainless steel ring (top right). This implant approached the skull at a polar angle of 45° from the z axis, and an azimuthal angle of 25° in the xy plane (bottom right), and was cemented with Metabond. We installed the primary headplate over the cerebellum parallel to the cover slip (shown in A). We sought to make the headplate orientation about the implant axis consistent among mice, to minimize gross discrepancies in cortical implant position when animals were head-fixed.
(C) Geometry of pontine optical fiber implants. We used 200 or 400 μm diameter core multimode fiber implants with 3.6 mm tall, 1.25 mm diameter ferrules and 5.5 mm of exposed fiber (left). Short ferrules (compared to typical implants) prevented collisions with the cortical imaging objective. We inserted fibers 3.9 mm posterior to bregma, entering the brain 2.6 mm lateral to the midline with a lateral tilt of 22°, to a depth of 4.6 mm along the insertion axis (right).
(D–G) Procedure for installing the premotor (PM) prism implant. We drilled a 3 mm diameter hole in the skull, 1.5 mm anterior of bregma and 1.1 mm left of the midline (D). We used a scalpel to make a 1.2 mm-long parasagittal incision centered in the opening at a depth of 1.2 mm (E). We peeled back the dura medial to the incision with fine forceps (F) to facilitate insertion of the prism. Finally, we attached a 1 mm right angle prism mirror to the bottom of a 3 mm diameter glass-tube assembly (G, top left). The leading prism edge was inserted into the incision at an anteroposterior tilt (in the yz-plane) of 10° (G) and cemented with Metabond.
(H) Optomechanical schematic of a single microscope arm. Each arm of the dual-axis microscope was an independent two-photon microscope with its own piezo-mounted objective, removable main dichroic, emission filters, and photomultiplier tube (PMT). An “eyepiece” CMOS camera permitted convenient visualization of the sample under bright-field illumination (with the main dichroic removed). Unlike conventional two-photon microscopes built around a fixed (and typically bulky) mechanical frame, our microscope elements were integrated along a series of extended mechanical linkages. Translational and rotational stages along the excitation laser pathway permitted three translational degrees-of-freedom (DOF) to position the objective and two rotational DOFs to orient the objective axis. With the additional objective piezo DOF, each arm provided a total of 6 mechanical DOFs. BP: bandpass, LP: longpass, SP: shortpass.
(I) The dual-axis microscope setup provided 16 mechanical degrees-of-freedom for achieving simultaneous imaging of the cortex and cerebellum. As described in H, each microscope arm provided six mechanical DOFs. In addition, the sample stage provided three translational DOFs, and the behavioral apparatus could be finely rotated on top of the sample stage (i.e., in the xy-plane).
(J) Three-step procedure for aligning the two microscope objectives to the cerebellar and cortical implants. In Step 1 (left), we aligned the 40× objective to the cerebellum, using primarily the “vertical” objective rotation (in the yz-plane) and the translational DOFs and “horizontal” rotation (in the xy-plane) of the sample. In Step 2 (middle), we aligned the 20× objective to the cortical implant using only the translational and rotational DOFs of that objective. Finally, in Step 3 (right), we utilized only the translational and piezo DOFs of each objective to fine-tune the imaging field with two-photon imaging feedback.
Figure S3. Necessity of Premotor Cortex and Cerebellum for Behavior and Additional Studies of L5 and GrC Correlations in Expert Mice, Related to Figure 1 and Figure 3.
(A–G) Double transgenic mice expressing ChR2 in all inhibitory neurons (n=3 Gad2-Cre/CAG-lox-stop-lox-ChR2 mice) were implanted with two windows, one over the premotor cortical and the other over the cerebellar region that we imaged in the rest of the study. During task performance, mice received baseline laser-off periods interspersed with 1-minute periods during which either the cerebellar window or the premotor cortical window was illuminated (STAR Methods). Traces in A and B show cumulative number of rewarded trials (mean±SEM) the mouse executed beginning at 60 s before either cortical (A) or cerebellar (B) laser onset. Blue regions show time of laser activation in this and subsequent panels. Dashed diagonal lines show best-fit to rate of trial completion in the 60-s period preceding laser onset (n=29 cortical and 30 cerebellar laser-on periods). The number of successfully executed movements (C) fell dramatically during the 60-s laser-on period compared to the preceding 60-s laser-off periods (p<10−6 Wilcoxon rank-sum test, n=59 60-s pre-laser periods, 29 cortical and 30 cerebellar laser-on periods). The fraction of all movements that produced pure turns (D), also fell during laser-on periods (p<10−6 Wilcoxon rank-sum test, n=59 60-s pre-laser periods, 28 cortical and 30 cerebellar laser-on periods; one cortical laser-on period with zero movement attempts was excluded from this analysis). To confirm that mice recovered from the deficits of the laser-on periods, traces in E and F show the cumulative number of rewarded trials the mouse executed beginning at 60 s prior to the offset of either the cortical (E) or cerebellar (F) laser. Dashed diagonal lines show best-fit to the 60-s laser-on period preceding laser offset (n=29 cortical and 30 cerebellar laser-on periods). Mice took substantially longer to recover performance following cerebellar laser-on periods than following cortical laser-on periods (G, p< 10−6, Wilcoxon rank sum test, n=29 cortical and 28 cerebellar laser-on periods. Two cerebellar laser-on periods following which mice did not successfully execute 5 rewarded trials within 5 minutes were excluded from this analysis). Thus, both the imaged cerebellar and premotor cortical regions imaged were critically necessary for task performance, consistent with prior work demonstrating their importance for forelimb movement (Hoogland et al., 2015; Tennant et al., 2011)..
(H) Pairwise best-match GrC-GrC correlation coefficients as in Figure 3C, here broken down by lobule. In addition to the 2,417 GrCs from the cortex-cerebellum dual site imaging data, rightmost bar shows an additional 361 GrC observations in lateral Crus II acquired during cerebellum-only imaging sessions by using a more lateral window placement in 2 mice, to confirm the generality of our findings.
(I) Similar to Figure 3B. Here, for each extracted L5 cell or GrC, we computed the full distribution of r values to all other L5 cells or GrCs. We then averaged this distribution across all such cells. Most correlations are much lower than the best-match correlation, as most pairs of neurons will encode unrelated and uncorrelated quantities. Nevertheless, as in Figure 3B, L5-GrC correlation magnitudes were comparable to L5-L5 correlations and GrC-GrC correlations were higher. (We show the absolute value of r to collapse positive and negative correlations.)
(J) To quantify correlations expected due to similarities in trial-averaged task tuning of L5 cells and GrCs, we generated shuffled datasets in which GrC activity was paired with L5 cell activity from mismatched trials (of the same movement direction). Thus, the GrC signals on each left (or right) turn was randomly correlated to the L5 signals on a different left (or right) turn trial. For each imaging session we computed the fraction of GrCs whose best-match L5 correlation was >0.4 (black dots). The red box plots show the distribution of correlated cell fractions across all shuffles. In every session, true correlations substantially exceeded shuffled correlations.
(K) To determine correlations in trial-to-trial variability, we computed the average across trials of the time-varying response of each GrC (separately for left and right trials). We then subtracted the cell’s time-varying trial-averaged activity from the single-trial fluorescence. Correlations in trial-to-trial variability were thereby computed using the mean-subtracted data. Scatter shows that the total correlations used throughout the study (x-axis) were highly similar to the correlations in trial-to-trial variability (y-axis). The controls here and in (J) suggest substantial correlated trial-to-trial variability between cells (Cohen and Kohn, 2011).
(L–O) Low OFC L5-GrC correlations. In our tracing experiments (Figure S1), we found that orbitofrontal cortex (OFC) contained a similar density of disynaptic cerebellum-projecting neurons as motor cortices. Specifically, OFC makes up 2% of all cortical neurons (Herculano-Houzel et al., 2013), and contributed 4.3% of labeled L5 inputs in our tracing. In comparison, M1 and M2 make up 10% of all cortical neurons (Herculano-Houzel et al., 2013), and contributed 25% of labeled L5 inputs in our tracing. OFC therefore provides a useful comparison to our premotor cortex data. We devised a strategy to image OFC L5 and cerebellar GrCs. L, Sagittal view of the mouse brain illustrating schematic of simultaneous OFC L5 and GrC imaging. We used a prism-GRIN endoscope to optically access the OFC. M, Example Ca2+ fluorescence traces of GrCs and OFC L5 cells (n=20 cells of each type shown, from total of 80 GrCs and 73 OFC L5 neurons in this imaging session). Thin vertical lines denote the individual turn motion onsets. N, Best-match L5-GrC correlations were substantially weaker in OFC imaging sessions than in premotor sessions (p<10−6 Kolmogorov-Smirnov test, n=2,417 GrCs from GrC/Premotor sessions and 866 GrCs from GrC/OFC sessions). O, Similarly, substantially less single-trial activity of individual GrCs was recoverable via linear regression by L5 ensembles in OFC than by premotor cortex (p<10−6 Wilcoxon rank-sum test).
Figure S4. Simulations of Granule Cell Integration of Mossy Fiber Input, Related to Figures 2 and 3.
The GrC layer is thought to perform dimensionality expansion as a result of each GrC sparsely sampling the available mossy fiber (MF) inputs (4 MFs per GrC); by thresholding the input, GrCs may act as combinatorial coincidence detectors. Important parameters that influence the degree of dimensionality expansion, given the known anatomy, include (1) the GrC activation threshold (how much input is needed to drive GrC spiking), (2) the relative strength of each MF input to a GrC (whether some inputs or classes of inputs are more effective at driving spiking than others), and (3) the degree of clustering of similar types of MFs in individual GrCs (Ishikawa et al., 2015) (e.g., by selective wiring during development). Regarding (1), some data suggests that GrC activation thresholds are >1 active MF (Chadderton et al., 2004), which theory indicates is important to obtain dimensionality expansion in the GrC layer (Cayco-Gajic et al., 2017). Data relating to (2) indicates that some MFs may possess the ability to reliably drive spiking in recipient GrCs on their own (Rancz et al., 2007), but the prevalence of this phenomenon in L5-GrC transmission remains unclear. Finally, both prior tracing data (Brodal and Bjaalie, 1997; Kelly and Strick, 2003; Suzuki et al., 2012) and our own data (Figure S1) indicate that regionally, the cortico-cerebellar projection is characterized by extensive divergence and convergence; however, it remains largely unknown whether wiring at the level of single GrCs is random with respect to the neocortical region of origin. Given these important questions and the limited existing data comparing GrC ensemble dynamics to L5 output, we sought to investigate which regimes of GrC layer function are most consistent with our L5-GrC imaging data. Specifically, our data indicated that L5-GrC correlations were nearly as high as L5-L5 correlations, GrC-GrC correlations were even higher, and GrC selectivity for different stimuli was comparable to that of L5 ensembles (Figure 3B and 2F).
We therefore implemented simulations of the L5-pons-GrC circuit (Albus, 1971; Babadi and Sompolinsky, 2014; Cayco-Gajic et al., 2017; Litwin-Kumar et al., 2017; Marr, 1969) with varying MF integration strategies, using parameters taken from our data and the literature where available (see STAR Methods for details). In all models, task-related L5 cells projected to pontine cells via Hebbian synapses. GrCs received four MFs from both task-related pontine cells and a population of all other inputs (task-unrelated). We parametrized the probability of a GrC receiving a MF from the task-related MF pool by pinput (0.5 in all simulations displayed; results were qualitatively similar at 0.4 and 0.6). Following prior models (Babadi and Sompolinsky, 2014; Litwin-Kumar et al., 2017), GrC activation thresholds were set dynamically by a feedforward inhibition mechanism through the Golgi cell network that matched GrC activity levels to event rates in the data.
Broadly we considered two classes of model. In one, GrCs, on average, integrated their 4 inputs uniformly (A–E), in which case we considered differing activation thresholds. In the other case, we considered a situation where task-relevant MFs originating in premotor L5 were substantially stronger than other MFs and were sufficient to drive GrC activity (F–H). For all simulations, we propagated L5 activity with L5-L5 correlations matched to the data (Figure 3B, S3I) through the circuit and measured the resulting GrC-GrC and L5-GrC correlations. These results depended on the (unknown) level of correlation among all MFs, inputs to GrCs that arise from many disparate sources (Cayco-Gajic et al., 2017). We therefore systematically varied MF correlations in repeated simulations and recorded how the resulting GrC-GrC and L5-GrC correlations changed.
In each case, we investigated the level of MF correlations that were required to produce GrC-GrC and L5-GrC correlations as high as those observed in our data. In addition, we quantified simulated GrC selectivity for different stimuli (as the response variance across stimuli).
(A) Mossy fiber integration models. GrCs integrated their 4 MF inputs via random, fixed synaptic weights drawn from a Gaussian distribution, such that all MFs contributed equally to the GrC ensemble on average. For each simulated stimulus, a GrC activated if the sum of its inputs exceeded a threshold. In B and C, GrCs required on average two simultaneously active MFs in order to spike (higher threshold simulations are less consistent with the data). Alternatively, in D and E, we considered a scenario where GrCs simply relay all input via a GrC threshold of only 1 active MF.
(B) Relationship between correlations among all the simulated MF inputs. The curves show the correlations resulting from the simulations, either among GrCs (blue) or between L5 and GrCs (purple), as we varied the correlations among all MFs (x-axis). The axes in these plots are ratios, expressing the magnitude of correlations relative to the magnitude of the L5-L5 correlations. Hence, a value of 1 on the x-axis corresponds to simulations in which the correlations among all MFs were as high as the local correlations among L5 neurons. Similarly, a value of 1 on the y-axis for the blue curve corresponds to simulations in which GrC-GrC correlations were as high as L5-L5 correlations. The dashed horizontal lines show the GrC-GrC correlations (blue) or L5-GrC correlations (purple) seen in our data, also expressed as a ratio, i.e., relative to the L5-L5 correlations in our data. The intersection of the simulation results (solid curves) with the dashed lines in B (and D) represent the parameter values at which the simulation produced correlations comparable to our data. This suggests that, to recapitulate our data, random mossy fiber integration requires correlations among all MF inputs to be as high as or higher than the local correlations we observed among premotor L5 cells (i.e., x-axis values near or greater than 1). This is unlikely, given the diverse origins of MF inputs, both from throughout cortex (Figure S1) as well as from brainstem and spinal cord sources.
(C) To assess stimulus tuning in simulated GrCs, we computed a selectivity metric (which can be interpreted as the response variance of a neuron across different stimuli; thus, high variance means high selectivity). In the mossy fiber integration simulation, highly selective GrCs were very rare, contrary to our data. (In this panel and E and H below, MF correlations were fixed at 20% of L5-L5 correlations, a low correlation regime similar to where the dominant mossy fiber model below recapitulated the data in F). Finally, we also considered a scenario where, due to potential MF clustering, individual GrCs were likely to receive multiple premotor MFs. This does not substantially improve selectivity: because premotor L5 is itself heterogeneous, receiving two premotor MFs increases the likelihood of “mixing away” the selectivity originally present in L5 (data not shown).
(D and E) Same as B and C for non-sparsening GrCs. This allows L5-derived MFs to reliably activate GrCs, which increases L5 signals in GrC output. However, it also allows task-unrelated MFs to activate GrCs. As a result, this model still failed to reproduce our data at low MF correlation levels (D). Similarly, because both task-relevant and task-irrelevant MFs activate GrCs, highly stimulus-selective GrCs remain rare (E), contrary to our data. Thus, regardless of GrC threshold choice, we find that GrCs which transmit similar contributions from both relevant, L5-derived and also from irrelevant inputs yield both correlations and selectivity lower than in our data.
(F–H) Dominant mossy fiber model in which a single task-related MF dominantly drives recipient GrCs (F). As this model had the same ~2 MF GrC activation threshold as above, dominant MFs had synaptic weights set to be twice as high as a typical MF (drawn from a Gaussian distribution as above). Unlike integration models, the dominant MF model yielded high L5-GrC and GrC-GrC correlations (G) as well as high GrC selectivity (H), thereby better matching our data (in G, the purple star indicates that the simulated L5-GrC correlations were already higher than the data at the lowest possible MF-correlation parameter, limited by chance). Our simulations assumed that task-irrelevant MFs are substantially active. If however, task-irrelevant MFs contribute substantially less input than L5-derived inputs, the situation could functionally approximate a dominant mossy fiber model.
(I) Schematic of two regimes of granule cell transmission. When GrCs integrate similar contributions from each MF (Regime 1; left), the effect of two GrCs sharing one L5-derived task-encoding MF is substantially smaller than in the case where that common MF dominates the output of both neurons (Regime 2; right), which results in higher L5-GrC correlations, lower GrC dimensionality, and stronger task selectivity. Our data suggest that learning shifts more GrCs that receive a task-relevant MF input into Regime 2.
Figure S5. Testing Pontine Contributions to Cortico-cerebellar Dynamics, Related to Figure 4
(A and B) For optogenetic inhibition of basal pons during cerebellar-only imaging, we mounted laser output fibers directly on-axis with the implanted fibers, using standard ferrule mating sleeves (A), as there was ample mechanical clearance between the cerebellar imaging objective and the optogenetic fibers (B).
(C–E) Pontine photoinhibition during cortex and cerebellum imaging required re-routing the laser output fibers to avoid collisions with the cortical objective. We designed a custom micro-optical assembly, consisting of a 0.85 mm diameter GRIN lens fiber collimator and a right angle prism mirror (C), to fold the fiber axis by 90°. We verified the laser-folding optical design with ray-tracing simulations (D), which showed that output light from a 25 μm core, 0.10 NA laser delivery fiber was confined within the 200 (or 400) μm diameter core of the implanted fibers. Bilateral fold adapters permitted bilateral pontine photoinhibition during dual-site imaging without collisions (E).
(F and G) Spectral separation of the optogenetics laser and two-photon imaging path. To actuate eNpHR3.0, we utilized a 594 nm laser which we coupled into light delivery fibers (F, top). During eNpHR3.0 perturbation trials, we typically used 15 mW of continuous wave (CW) 594 nm illumination per side. In the emission path of the two-photon microscopes, we inserted 594 nm notch filters to suppress 594 nm light from reaching the PMT (f, bottom). To actuate iC++, we utilized a 488 nm laser (G, top). During iC++ perturbation trials, we typically used an average power of 5 mW per side (i.e., ~10 mW CW power at ~50% duty cycle). In the emission path of the two-photon microscopes, we inserted a 496 nm LP filter to suppress blue light. BP: bandpass, LP: longpass, SP: shortpass.
(H) Spectral separation is sufficient for two-photon Ca2+ imaging during 594 nm illumination of the pons. We compared the distribution of pixel values in 1,000 Ca2+ imaging frames with bilateral 594 nm illumination of the pons (orange) to the distribution of pixel values in 1,000 Ca2+ imaging frames with the 594 nm laser off (black). We scaled the pixel values by setting the mean of the laser-off distribution to 1. The two pixel distributions are similar, indicating the spectral separation scheme described in F is sufficient to enable Ca2+ imaging of the dorsal cortex and cerebellum during optogenetic perturbation of the pons via eNpHR3.0.
(I) Spectral separation alone does not allow two-photon Ca2+ imaging during 488 nm pontine illumination. We compared the optogenetic laser-on and laser-off distributions as in H, but using the setup for iC++ described in G. Illuminating the pons with 488 nm light results in ~100-fold increase in the recorded pixel values over two-photon GCaMP6f fluorescence levels.
(J) Temporal multiplexing scheme for 488 nm iC++ actuation during two-photon Ca2+ imaging. During optogenetic perturbation periods, we divided the imaging frame into an odd number (e.g. N=11) of subfields, each consisting of 512 / 11 ≈ 47 lines. On odd-numbered imaging frames we imaged the odd subfields and enabled the 488 nm laser during the even subfields (top left). The 488 nm laser on subfields were saturated by the blue laser, so GCaMP6f fluorescence acquired at these times was not recoverable. On even numbered frames, we imaged the even subfields and enabled the 488 nm laser during the odd subfields (top middle). Hence, every pair of frames during optogenetic trials were combined to produce the full image (top right) but at half the frame rate. With these parameters, typical 488 nm laser on time was ~2.7 ms and typical off time was ~3.1 ms (bottom; iC++ channel closure time is τfast ≈ 12.1 ms (Berndt et al., 2016)).
(K) Coronal section of the midbrain showing fiber implantation tracks (white outline) over the basal pontine nuclei expressing AAV8-hSyn-eNpHR3.0-mCherry (red).
(L) Fraction of GrCs that were identified as direction-preferring during movement or reward (via linear regression as described in Figure 2E) that were inhibited by pontine photoinhibition.
(M and N) Two example cells that were disinhibited on laser-on trials relative to laser-off trials (Trial numbers: 93/95 laser-off, 24/24 laser-on, for M/N respectively).
(O) Left, example confocal section showing opsin-mCherry-positive pontine terminals (arrows) in our imaging area in the cerebellar cortex. Right, quantification of the density of mCherry-positive rosettes. Estimates in rats (Billings et al., 2014) suggest a rosette density of ~6×10⁵ / mm3, which should be a lower bound for mice due to the larger structure sizes in rats. Thus, the 2±0.2×10⁴/mm3 mCherry-positive rosettes comprises <5% of total rosettes, likely accounting for the mild photoinhibition effect.
(P) Fraction of L5 cells significantly inhibited (1%) or disinhibited (4%) during pontine photoinhibition, likely due to disruption of information flow through the feedback pathway from the cerebellar nuclei to the cortex via thalamus.
(Q and R) Effects of pontine inhibition on behavior. When randomly interleaving pontine inhibition on 20% of trials (Q, i.e., the experiments shown in the rest of the manuscript except panel R), behavior was unaffected (p>0.05 Wilcoxon rank sum, for each metric). With a stronger manipulation (R), in which two blocks of laser-off trials (one each of left and right turns) were followed by two blocks of laser-on trials, behavior was significantly degraded, as movements took longer to execute (p=0.01 for lateral motion duration, 0.04 for total movement duration; n=213 laser-off and 184 laser-on trials from 3 mice). As a control, we confirmed that for the same mice on the preceding day, comparing the first 2 laser-off blocks to the subsequent 2 laser-off blocks demonstrated no significant difference in motion (data not shown, p=0.93 and 0.33 for total and lateral motion durations).
Figure S6. Evolution of L5 and GrC Correlations during Learning, Related to Figures 5 and 6.
(A) Left, separate behavioral signals were defined for left and right movement and reward. Whereas the single-cell behavioral regressors shown in Figure 2E are separated by pre/post, the behavioral signals defined here are collapsed across the pre/post epoch. Right, example using the L5 cell ensemble (left two columns) or GrC ensemble (right two columns) to decode movement or reward events by turn direction, by fitting a separate regression for each day onto each of the 4 behavioral signals (left; Day 1: n=24/68; Day 4: 57/33; Day 16 (last day): 24/37 left/right turn trials). Early in learning, although ensembles often produced task-locked activity, the signals poorly discriminated left and right turn trials. Late in learning, both L5 and GrC ensembles produced task-locked signals that were distinct for each turn direction.
(B) To assess dimensionality of trial-averaged response profiles, we performed PCA across cells, using the matrix of time-varying trial-averaged activity patterns. Averages were taken separately across left and right turn trials and then concatenated so that the resulting matrix was of size (2×N)-by-C, where N is the number of timepoints per trial and C is the number of cells. Variance explained by the top 10 principal components of trial-averaged population activity rises over learning (p=10−5 and 2.6×10⁻⁵ for GrCs and L5 cells respectively), indicating reduced diversity of trial-averaged response profiles.
(C) Another example of a L5-GrC pair, as in Figure 6A, showing increased correlation over learning.
(D) For an example mouse, distribution across GrCs of the best-match correlation coefficient to an L5 cell on an individual day early-, mid-, and late-learning (n=152, 168, and 152 GrCs on day 1, 7, 18 respectively).
(E) For all cells, best-match correlation coefficient to other cells at different phases of learning. Lines show average across cells over learning (all p< 10−6 comparing early and late learning, Wilcoxon rank sum test; n=1,668/1,997, 2,113/2,324, and 1,666/1,647 L5/GrC observations early, mid, and late in learning respectively).
(F and G) As in E, changes over learning of each GrC’s best-match correlation coefficient to an L5 cell, here broken down into correlations in trial-averaged response profiles (F, p< 10−6 Wilcoxon rank sum test comparing early and late), and correlations in trial-to-trial variability (G, p=6.7×10⁻⁶). To determine correlations in trial-to-trial variability, we subtracted each cell’s trial-averaged activity from its single-trial activity before computing correlations with activity of other cells.
(H) Event rates in L5 cells and GrCs fell over learning (n=1997, 2324, 2417 GrC observations and 1668, 2113, 2037 L5 cell observations early, mid, and late in learning. n=7 mice, p< 10−6 Wilcoxon rank sum test comparing early and late learning).
(I) For all L5-GrC cell pairs, we also computed the cross-correlation coefficient over a wide range of lead and lag offsets between the pair. In expert mice, more cell pairs exhibited peak cross-correlations at near zero lags (histograms computed over −5 to 5 s lags, but displayed from −2 to 2 s to clearly show difference near 0 lag).
Figure S7. Further Analysis of Correlated Changes in L5 and GrC Activity and Behavior, Related to Figure 7
(A) Durations of forward and lateral motions did not change during learning (p>0.05; n=460 trials from Day 1 sessions and 3,062 trials from Expert sessions). This indicates that the decrease in total movement duration after learning (Figure 7A, middle panel) was driven entirely by a decrease in the transition time between the end of the forward motion end and the onset of the correct lateral motion (Figure 7A, right).
(B) The transition time between the end of the forward motion and the onset of the lateral motion (as in Figure 7A, right) also decreased when considering only pure turn trials (p<10−6 Wilcoxon sign rank test, n=303 Day 1 sessions and 2,895 Expert pure turns).
(C and D) As in Figure 7F, but across all mice and neurons (C; p=0.3 least vs. most consistent from late learning; p<10−6 comparing most consistent mid-learning to least consistent late-learning sessions; n=2324 and 1647 GrC observations in mid- and late-learning sessions, respectively, from 7 mice), or restricted to the set of GrCs and L5 neurons that were tracked every day throughout learning (D, p=0.73 least vs most consistent late; p=0.006 most consistent mid-learning vs least consistent late-learning sessions; n=183 GrCs and 133 L5 cells tracked in 4 mice).
Movie S1 ∣ Example simultaneous two-photon Ca2+ imaging of cerebellar GrC and premotor cortex layer 5 cells during a forelimb motor sequence planning task, Related to Figure 1. The movie is 4x temporally down-sampled from the 30-Hz acquisition rate (8-frame rolling average played at 15 Hz).
KEY RESOURCES TABLE
| REAGENT or RESOURCE | SOURCE | IDENTIFIER |
|---|---|---|
| Virus strains | ||
| AAV8-hSyn-FLEx-TVA-mCherry-2A-G | UNC vector core | N/A |
| EnvA-Rabies-ΔG-GFP | Salk vector core | Stock name: G-deleted Rabies-eGFP |
| AAV8-hSyn-eNpHR3.0-mCherry | Stanford vector core | Stock# GVVC-AAV-147 |
| AAV8-hSyn-iC++-mCherry | Stanford vector core | Stock# GVVC-AAV-162 |
| CAV-Cre | Soudais 2001 | N/A |
| Chemicals | ||
| Isoflurane | Henry Schein Animal Health | CAS# 26675-46-7; CHEBI:6015 |
| C&B Metabond Quick Adhesive Cement System | Parkell | UN/ID# UN1247 |
| Avertin (2,2,2-Tribromoethanol) | Sigma | CAS# 75-80-9; SKU# T48402 |
| DAPI | Thermo Fisher Scientific | Cat# D1306 |
| Experimental Models: Organisms/Strains | ||
| Mouse: Ai93(TITL-GCaMP6f)-D | Jackson Labs | Stock# 024103 |
| Mouse: ztTA | Jackson Labs | Stock# 012266 |
| Mouse: Rbp4-KL100 | GENSAT | Founder# KL100 |
| Mouse: Math1-Cre | Jackson Labs | Stock# 011104 |
| Mouse: GAD2-IRES-Cre | Jackson Labs | Stock# 010802 |
| Mouse: Ai32 (LSL-ChR2-EYFP) | Jackson Labs | Stock# 012569 |
| Software and Algorithms | ||
| MATLAB | Mathworks | https://www.mathworks.com |
| IMARIS | Bitplane | https://www.bitplane.com |
| CNMF | Simons Foundation/Flatiron institute; Pnevmatikakis 2016 | https://github.com/flatironinstitute/CaImAn-MATLAB |
| NoRMCorre | Simons Foundation/Flatiron institute; Pnevmatikakis 2017 | https://github.com/flatironinstitute/NoRMCorre |
| ScanImage | Vidrio Technologies | http://scanimage.vidriotechnologies.com/ |
| LabVIEW | National Instruments | http://www.ni.com/en-us/shop/labview.html |
Highlights.
First simultaneous recordings from neocortex and cerebellum over weeks of learning
Cortical layer 5 and cerebellar granule cells show similar task encoding in experts
Learning increases correlations among initially dissimilar L5 and granule cells
L5 and granule cells converge to similar, low-dimensional, task-encoding activity
Acknowledgments
We thank J. Lecoq for microscope design, C. Ramakrishnan and K. Deisseroth for opsin plasmids, members of the Luo laboratory for reagents and helpful discussions, J.H. Lui for mice, S. Haziza for experimental assistance, and J. Raymond, S. Druckmann, K. Shenoy, and C.K. Kim for critical comments on the manuscript. M.J.W. was supported by the Epilepsy Training Grant. M.J.S. and L.L. are HHMI investigators. This work was supported by NIH and NSF grants.
Footnotes
Declaration of Interest The authors declare no competing financial interests.
Publisher's Disclaimer: This is a PDF file of an unedited manuscript that has been accepted for publication. As a service to our customers we are providing this early version of the manuscript. The manuscript will undergo copyediting, typesetting, and review of the resulting proof before it is published in its final citable form. Please note that during the production process errors may be discovered which could affect the content, and all legal disclaimers that apply to the journal pertain.
References
- Albus JS (1971). A theory of cerebellar function. Mathematical Biosciences 10, 25–61. [Google Scholar]
- Babadi B, and Sompolinsky H (2014). Sparseness and expansion in sensory representations. Neuron 83, 1213–1226. [DOI] [PubMed] [Google Scholar]
- Barton Robert A., and Venditti C (2014). Rapid Evolution of the Cerebellum in Humans and Other Great Apes. Curr Biol 24, 2440–2444. [DOI] [PubMed] [Google Scholar]
- Berndt A, Lee SY, Wietek J, Ramakrishnan C, Steinberg EE, Rashid AJ, Kim H, Park S, Santoro A, Frankland PW, et al. (2016). Structural foundations of optogenetics: Determinants of channelrhodopsin ion selectivity. Proc Natl Acad Sci 113, 822–829. [DOI] [PMC free article] [PubMed] [Google Scholar]
- Billings G, Piasini E, Lőrincz A, Nusser Z, and Silver RA (2014). Network Structure within the Cerebellar Input Layer Enables Lossless Sparse Encoding. Neuron 83, 960–974. [DOI] [PMC free article] [PubMed] [Google Scholar]
- Brincat SL, Siegel M, von Nicolai C, and Miller EK (2018). Gradual progression from sensory to task-related processing in cerebral cortex. Proc Natl Acad Sci 115, E7202–E7211. [DOI] [PMC free article] [PubMed] [Google Scholar]
- Brodal P, and Bjaalie JG (1997). Chapter 13 Salient anatomic features of the cortico-ponto-cerebellar pathway In Progress in Brain Research, De Zeeuw CI, Strata P, and Voogd J, eds. (Elsevier; ), pp. 227–249. [DOI] [PubMed] [Google Scholar]
- Cayco-Gajic NA, Clopath C, and Silver RA (2017). Sparse synaptic connectivity is required for decorrelation and pattern separation in feedforward networks. Nature Communications 8, 1116. [DOI] [PMC free article] [PubMed] [Google Scholar]
- Chabrol FP, Arenz A, Wiechert MT, Margrie TW, and DiGregorio DA (2015). Synaptic diversity enables temporal coding of coincident multisensory inputs in single neurons. Nat Neurosci 18, 718. [DOI] [PMC free article] [PubMed] [Google Scholar]
- Chabrol F.p., Blot A, and Mrsic-Flogel TD (2018). Cerebellar contribution to preparatory activity in motor neocortex. bioRxiv. [DOI] [PMC free article] [PubMed] [Google Scholar]
- Chadderton P, Margrie TW, and Häusser M (2004). Integration of quanta in cerebellar granule cells during sensory processing. Nature 428, 856. [DOI] [PubMed] [Google Scholar]
- Chen T-W, Wardill TJ, Sun Y, Pulver SR, Renninger SL, Baohan A, Schreiter ER, Kerr RA, Orger MB, Jayaraman V, et al. (2013). Ultrasensitive fluorescent proteins for imaging neuronal activity. Nature 499, 295. [DOI] [PMC free article] [PubMed] [Google Scholar]
- Cohen MR, and Kohn A (2011). Measuring and interpreting neuronal correlations. Nat Neurosci 14, 811–819. [DOI] [PMC free article] [PubMed] [Google Scholar]
- Denève S, Alemi A, and Bourdoukan R (2017). The Brain as an Efficient and Robust Adaptive Learner. Neuron 94, 969–977. [DOI] [PubMed] [Google Scholar]
- Fujita M (1982). Adaptive filter model of the cerebellum. Biol Cybern 45, 195–206. [DOI] [PubMed] [Google Scholar]
- Galliano E, Gao Z, Schonewille M, Todorov B, Simons E, Pop AS, D’Angelo E, Van Den Maagdenberg AM, Hoebeek FE, and De Zeeuw CI (2013). Silencing the majority of cerebellar granule cells uncovers their essential role in motor learning and consolidation. Cell reports 3, 1239–1251. [DOI] [PubMed] [Google Scholar]
- Gao P, and Ganguli S (2015). On simplicity and complexity in the brave new world of large-scale neuroscience. Current Opinion in Neurobiology 32, 148–155. [DOI] [PubMed] [Google Scholar]
- Gao Z, Davis C, Thomas AM, Economo MN, Abrego AM, Svoboda K, De Zeeuw CI, and Li N (2018). A cortico-cerebellar loop for motor planning. Nature. [DOI] [PMC free article] [PubMed] [Google Scholar]
- Gao Z, Proietti-Onori M, Lin Z, ten Brinke, Michiel M, Boele H-J, Potters J-W, Ruigrok, Tom JH, Hoebeek, Freek E, and De Zeeuw, Chris I. (2016). Excitatory Cerebellar Nucleocortical Circuit Provides Internal Amplification during Associative Conditioning. Neuron 89, 645–657. [DOI] [PMC free article] [PubMed] [Google Scholar]
- Gao Z, van Beugen BJ, and De Zeeuw CI (2012). Distributed synergistic plasticity and cerebellar learning. Nat Rev Neurosci 13, 619. [DOI] [PubMed] [Google Scholar]
- Gerfen CR, Paletzki R, and Heintz N (2013). GENSAT BAC cre-recombinase driver lines to study the functional organization of cerebral cortical and basal ganglia circuits. Neuron 80, 1368–1383. [DOI] [PMC free article] [PubMed] [Google Scholar]
- Gilmer JI, and Person AL (2017). Morphological constraints on cerebellar granule cell combinatorial diversity. J Neurosci. [DOI] [PMC free article] [PubMed] [Google Scholar]
- Giovannucci A, Badura A, Deverett B, Najafi F, Pereira TD, Gao Z, Ozden I, Kloth AD, Pnevmatikakis E, Paninski L, et al. (2017). Cerebellar granule cells acquire a widespread predictive feedback signal during motor learning. Nat Neurosci 20, 727–734. [DOI] [PMC free article] [PubMed] [Google Scholar]
- Herculano-Houzel S (2010). Coordinated Scaling of Cortical and Cerebellar Numbers of Neurons. Front Neuroanatom 4, 12. [DOI] [PMC free article] [PubMed] [Google Scholar]
- Herculano-Houzel S, Watson C, and Paxinos G (2013). Distribution of neurons in functional areas of the mouse cerebral cortex reveals quantitatively different cortical zones. Front Neuroanatom 7, 35. [DOI] [PMC free article] [PubMed] [Google Scholar]
- Hoogland TM, De Gruijl JR, Witter L, Canto CB, and De Zeeuw CI (2015). Role of synchronous activation of cerebellar Purkinje cell ensembles in multi-joint movement control. Curr Biol 25, 1157–1165. [DOI] [PMC free article] [PubMed] [Google Scholar]
- Huang CC, Sugino K, Shima Y, Guo C, Bai S, Mensh BD, Nelson SB, and Hantman AW (2013). Convergence of pontine and proprioceptive streams onto multimodal cerebellar granule cells. eLife 2, e00400. [DOI] [PMC free article] [PubMed] [Google Scholar]
- Inagaki HK, Inagaki M, Romani S, and Svoboda K (2018). Low-Dimensional and Monotonic Preparatory Activity in Mouse Anterior Lateral Motor Cortex. J Neurosci 38, 4163–4185. [DOI] [PMC free article] [PubMed] [Google Scholar]
- Ishikawa T, Shimuta M, and Häusser M (2015). Multimodal sensory integration in single cerebellar granule cells in vivo. eLife 4, e12916. [DOI] [PMC free article] [PubMed] [Google Scholar]
- Kadmon J, and Sompolinsky H (2015). Transition to chaos in random neuronal networks. Physical Review X 5, 041030. [Google Scholar]
- Kadmon J, and Sompolinsky H (2016). Optimal Architectures in a Solvable Model of Deep Networks. 4781–4789. [Google Scholar]
- Kelly RM, and Strick PL (2003). Cerebellar Loops with Motor Cortex and Prefrontal Cortex of a Nonhuman Primate. J Neurosci 23, 8432–8444. [DOI] [PMC free article] [PubMed] [Google Scholar]
- Knogler LD, Markov DA, Dragomir EI, Štih V, and Portugues R (2017). Sensorimotor Representations in Cerebellar Granule Cells in Larval Zebrafish Are Dense, Spatially Organized, and Non-temporally Patterned. Curr Biol 27, 1288–1302. [DOI] [PubMed] [Google Scholar]
- Lecoq J, Savall J, Vucinic D, Grewe BF, Kim H, Li JZ, Kitch LJ, and Schnitzer MJ (2014). Visualizing mammalian brain area interactions by dual-axis two-photon calcium imaging. Nat Neurosci 17, 1825–1829. [DOI] [PMC free article] [PubMed] [Google Scholar]
- Li N, Chen T-W, Guo ZV, Gerfen CR, and Svoboda K (2015). A motor cortex circuit for motor planning and movement. Nature 519, 51–56. [DOI] [PubMed] [Google Scholar]
- Litwin-Kumar A, Harris KD, Axel R, Sompolinsky H, and Abbott LF (2017). Optimal Degrees of Synaptic Connectivity. Neuron 93, 1153–1164.e1157. [DOI] [PMC free article] [PubMed] [Google Scholar]
- Madisen L, Garner AR, Shimaoka D, Chuong AS, Klapoetke NC, Li L, van der Bourg A, Niino Y, Egolf L, Monetti Cv et al. (2015). Transgenic mice for intersectional targeting of neural sensors and effectors with high specificity and performance. Neuron 85, 942–958. [DOI] [PMC free article] [PubMed] [Google Scholar]
- Madisen L, Mao T, Koch H, Zhuo JM, Berenyi A, Fujisawa S, Hsu YW, Garcia AJ 3rd, Gu X, Zanella S, et al. (2012). A toolbox of Cre-dependent optogenetic transgenic mice for light-induced activation and silencing. Nat Neurosci 15, 793–802. [DOI] [PMC free article] [PubMed] [Google Scholar]
- Marr D (1969). A theory of cerebellar cortex. J Neurophysiol 202, 437–470. [DOI] [PMC free article] [PubMed] [Google Scholar]
- Moberget T, and Ivry RB (2016). Cerebellar contributions to motor control and language comprehension: searching for common computational principles. Ann NY Acad Sci 1369, 154–171. [DOI] [PMC free article] [PubMed] [Google Scholar]
- Peters AJ, Chen SX, and Komiyama T (2014). Emergence of reproducible spatiotemporal activity during motor learning. Nature 510, 263. [DOI] [PubMed] [Google Scholar]
- Pnevmatikakis EA, and Giovannucci A (2017). NoRMCorre: An online algorithm for piecewise rigid motion correction of calcium imaging data. Journal of Neuroscience Methods 291, 83–94. [DOI] [PubMed] [Google Scholar]
- Pnevmatikakis Eftychios A., Soudry D, Gao Y, Machado TA, Merel J, Pfau D, Reardon T, Mu Y, Lacefield C, Yang W, et al. (2016). Simultaneous Denoising, Deconvolution, and Demixing of Calcium Imaging Data. Neuron 89, 285–299. [DOI] [PMC free article] [PubMed] [Google Scholar]
- Rancz EA, Ishikawa T, Duguid I, Chadderton P, Mahon S, and Hausser M (2007). High-fidelity transmission of sensory information by single cerebellar mossy fibre boutons. Nature 450, 1245–1248. [DOI] [PMC free article] [PubMed] [Google Scholar]
- Schütze H, Manning CD, and Raghavan P (2008). Introduction to information retrieval, Vol 39 (Cambridge University Press; ). [Google Scholar]
- Schwarz LA, Miyamichi K, Gao XJ, Beier KT, Weissbourd B, DeLoach KE, Ren J, Ibanes S, Malenka RC, Kremer EJ, et al. (2015). Viral-genetic tracing of the input-output organization of a central noradrenaline circuit. Nature 524, 88–92. [DOI] [PMC free article] [PubMed] [Google Scholar]
- Sheahan HR, Franklin DW, and Wolpert DM (2016). Motor Planning, Not Execution, Separates Motor Memories. Neuron 92, 773–779. [DOI] [PMC free article] [PubMed] [Google Scholar]
- Shenoy KV, Sahani M, and Churchland MM (2013). Cortical control of arm movements: a dynamical systems perspective. Annu Rev Neurosci 36, 337–359. [DOI] [PubMed] [Google Scholar]
- Sillitoe RV, Fu Y, and Watson G (2012). Chapter 11 - Cerebellum In The Mouse Nervous System, Watson G, Paxinos G, and Puelles L, eds. (San Diego: Academic Press; ), pp. 360–397. [Google Scholar]
- Soudais C, Laplace-Builhe C, Kissa K, and Kremer EJ (2001). Preferential transduction of neurons by canine adenovirus vectors and their efficient retrograde transport in vivo. The FASEB Journal 15, 2283–2285. [DOI] [PubMed] [Google Scholar]
- Suzuki L, Coulon P, Sabel-Goedknegt EH, and Ruigrok TJH (2012). Organization of Cerebral Projections to Identified Cerebellar Zones in the Posterior Cerebellum of the Rat. J Neurosci 32, 10854–10869. [DOI] [PMC free article] [PubMed] [Google Scholar]
- Taniguchi H, He M, Wu P, Kim S, Paik R, Sugino K, Kvitsiani D, Fu Y, Lu J, Lin Y, et al. (2011). A resource of Cre driver lines for genetic targeting of GABAergic neurons in cerebral cortex. Neuron 71, 995–1013. [DOI] [PMC free article] [PubMed] [Google Scholar]
- Tennant KA, Adkins DL, Donlan NA, Asay AL, Thomas N, Kleim JA, and Jones TA (2011). The Organization of the Forelimb Representation of the C57BL/6 Mouse Motor Cortex as Defined by Intracortical Microstimulation and Cytoarchitecture. Cerebral Cortex (New York, NY) 21, 865–876. [DOI] [PMC free article] [PubMed] [Google Scholar]
- Wagner MJ, Kim TH, Savall J, Schnitzer MJ, and Luo L (2017). Cerebellar granule cells encode the expectation of reward. Nature 544, 96–100. [DOI] [PMC free article] [PubMed] [Google Scholar]
Associated Data
This section collects any data citations, data availability statements, or supplementary materials included in this article.
Supplementary Materials
Figure S1. Most Neocortical Regions Project Disynaptically to Dorsal Cerebellar Cortex in Mice, Related to Figure 1.
(A) Illustration of viral tracing strategy for pontine axon (mossy fiber)-initiated monosynaptic retrograde tracing of cortical inputs to pontine nuclei. In this TRIO (Tracing the Relationship between Input and Output) scheme, pontine neurons that project to dorsal cerebellar cortex were transduced by Cre recombinase-expressing canine adenovirus 2 (CAV-Cre) from their axon terminals, and by AAV expressing Cre-dependent TVA-mCherry and rabies glycoprotein (G) at their cell bodies. This was then followed by injection of EnvA-pseudotyped, GFP-expressing, and glycoprotein deleted rabies virus (RVΔG) at the pontine nuclei. Starter cells are TVA-mCherry+ and GFP+, whereas their presynaptic partners are GFP+ only.
(B) Example image of pons showing TVA-mCherry+/GFP+ pontine starter cells in yellow, and their presynaptic partners in green. Scale bar: 1 mm.
(C) Example images of neocortex layer 5 cells at multiple anterior-posterior planes (60 μm sections, images acquired using a slide scanner), showing labeling in (from top left to bottom right): orbitofrontal cortex (C1), premotor cortex (C2), cingulate (C3), motor and somatosensory cortices (C2-C4), parietal and retrosplenial association cortices (C5), and visual and auditory cortices (C6). Cortical regions annotated with dashed white boxes. Solid yellow boxes indicate regions magnified in the lower left insets of each image to show L5 cell morphology. Scale bar: 1 mm. See legend in (D) for abbreviations.
(D) Quantification of the contribution of each cortical region to the total counted disynaptic neocortical inputs to cerebellar cortex. Each dot within a column represents the fraction of input contributed by that cortical region in one mouse, with CAV-Cre injection locations in the dorsal cerebellar cortex color-coded. Abbreviations: OFC, orbitofrontal cortex; Cg, cingulate; Rsp, retrosplenial; Par, parietal cortex; Aud, auditory; Vis, visual; Pir, piriform; Som, somatosensory.
(E) Scatter plot showing the fraction of cortical inputs from somatosensory and motor areas compared to the total number of cortical cells labeled. Each dot represents one mouse with CAV-Cre injection sites color-coded as in (D). Overall, ~50% of neocortical inputs to cerebellum were somatomotor in origin.
Figure S2. Illustration of Cortex and Cerebellum Imaging Strategy with Pontine Photoinhibition, Related to Figures 1–4.
(A) Top-down view of surgical preparation for premotor cortex and cerebellum imaging with bilateral pontine photoinhibition. We implanted a 3 mm-diameter window over the cerebellum, and a 1 mm right-angle prism in the premotor cortex. Two multimode fiber implants deliver light to the basal pons bilaterally. A 1.8 mm-thick stainless steel headplate over the cerebellum was our primary head-restraint device. An “auxiliary” headplate was necessary to stabilize axial movement (in z) of the cortex. The reference frame xyz is aligned to the mouse skull (x, mediolateral; y, anterioposterior; z, dorsoventral axes) and applies to all figure panels.
(B) Procedure for installing cerebellar implants. We drilled a 3 mm diameter hole in the skull, centered anterioposteriorly over the post-lambda suture and 1.5 mm right of the midline (left), to access lobules VIa, VIb and simplex. We sealed the skull opening with a glass-tube assembly, consisting of a #0 cover slip glued to a 1 mm tall stainless steel ring (top right). This implant approached the skull at a polar angle of 45° from the z axis, and an azimuthal angle of 25° in the xy plane (bottom right), and was cemented with Metabond. We installed the primary headplate over the cerebellum parallel to the cover slip (shown in A). We sought to make the headplate orientation about the implant axis consistent among mice, to minimize gross discrepancies in cortical implant position when animals were head-fixed.
(C) Geometry of pontine optical fiber implants. We used 200 or 400 μm diameter core multimode fiber implants with 3.6 mm tall, 1.25 mm diameter ferrules and 5.5 mm of exposed fiber (left). Short ferrules (compared to typical implants) prevented collisions with the cortical imaging objective. We inserted fibers 3.9 mm posterior to bregma, entering the brain 2.6 mm lateral to the midline with a lateral tilt of 22°, to a depth of 4.6 mm along the insertion axis (right).
(D–G) Procedure for installing the premotor (PM) prism implant. We drilled a 3 mm diameter hole in the skull, 1.5 mm anterior of bregma and 1.1 mm left of the midline (D). We used a scalpel to make a 1.2 mm-long parasagittal incision centered in the opening at a depth of 1.2 mm (E). We peeled back the dura medial to the incision with fine forceps (F) to facilitate insertion of the prism. Finally, we attached a 1 mm right angle prism mirror to the bottom of a 3 mm diameter glass-tube assembly (G, top left). The leading prism edge was inserted into the incision at an anteroposterior tilt (in the yz-plane) of 10° (G) and cemented with Metabond.
(H) Optomechanical schematic of a single microscope arm. Each arm of the dual-axis microscope was an independent two-photon microscope with its own piezo-mounted objective, removable main dichroic, emission filters, and photomultiplier tube (PMT). An “eyepiece” CMOS camera permitted convenient visualization of the sample under bright-field illumination (with the main dichroic removed). Unlike conventional two-photon microscopes built around a fixed (and typically bulky) mechanical frame, our microscope elements were integrated along a series of extended mechanical linkages. Translational and rotational stages along the excitation laser pathway permitted three translational degrees-of-freedom (DOF) to position the objective and two rotational DOFs to orient the objective axis. With the additional objective piezo DOF, each arm provided a total of 6 mechanical DOFs. BP: bandpass, LP: longpass, SP: shortpass.
(I) The dual-axis microscope setup provided 16 mechanical degrees-of-freedom for achieving simultaneous imaging of the cortex and cerebellum. As described in H, each microscope arm provided six mechanical DOFs. In addition, the sample stage provided three translational DOFs, and the behavioral apparatus could be finely rotated on top of the sample stage (i.e., in the xy-plane).
(J) Three-step procedure for aligning the two microscope objectives to the cerebellar and cortical implants. In Step 1 (left), we aligned the 40× objective to the cerebellum, using primarily the “vertical” objective rotation (in the yz-plane) and the translational DOFs and “horizontal” rotation (in the xy-plane) of the sample. In Step 2 (middle), we aligned the 20× objective to the cortical implant using only the translational and rotational DOFs of that objective. Finally, in Step 3 (right), we utilized only the translational and piezo DOFs of each objective to fine-tune the imaging field with two-photon imaging feedback.
Figure S3. Necessity of Premotor Cortex and Cerebellum for Behavior and Additional Studies of L5 and GrC Correlations in Expert Mice, Related to Figure 1 and Figure 3.
(A–G) Double transgenic mice expressing ChR2 in all inhibitory neurons (n=3 Gad2-Cre/CAG-lox-stop-lox-ChR2 mice) were implanted with two windows, one over the premotor cortical and the other over the cerebellar region that we imaged in the rest of the study. During task performance, mice received baseline laser-off periods interspersed with 1-minute periods during which either the cerebellar window or the premotor cortical window was illuminated (STAR Methods). Traces in A and B show cumulative number of rewarded trials (mean±SEM) the mouse executed beginning at 60 s before either cortical (A) or cerebellar (B) laser onset. Blue regions show time of laser activation in this and subsequent panels. Dashed diagonal lines show best-fit to rate of trial completion in the 60-s period preceding laser onset (n=29 cortical and 30 cerebellar laser-on periods). The number of successfully executed movements (C) fell dramatically during the 60-s laser-on period compared to the preceding 60-s laser-off periods (p<10−6 Wilcoxon rank-sum test, n=59 60-s pre-laser periods, 29 cortical and 30 cerebellar laser-on periods). The fraction of all movements that produced pure turns (D), also fell during laser-on periods (p<10−6 Wilcoxon rank-sum test, n=59 60-s pre-laser periods, 28 cortical and 30 cerebellar laser-on periods; one cortical laser-on period with zero movement attempts was excluded from this analysis). To confirm that mice recovered from the deficits of the laser-on periods, traces in E and F show the cumulative number of rewarded trials the mouse executed beginning at 60 s prior to the offset of either the cortical (E) or cerebellar (F) laser. Dashed diagonal lines show best-fit to the 60-s laser-on period preceding laser offset (n=29 cortical and 30 cerebellar laser-on periods). Mice took substantially longer to recover performance following cerebellar laser-on periods than following cortical laser-on periods (G, p< 10−6, Wilcoxon rank sum test, n=29 cortical and 28 cerebellar laser-on periods. Two cerebellar laser-on periods following which mice did not successfully execute 5 rewarded trials within 5 minutes were excluded from this analysis). Thus, both the imaged cerebellar and premotor cortical regions imaged were critically necessary for task performance, consistent with prior work demonstrating their importance for forelimb movement (Hoogland et al., 2015; Tennant et al., 2011)..
(H) Pairwise best-match GrC-GrC correlation coefficients as in Figure 3C, here broken down by lobule. In addition to the 2,417 GrCs from the cortex-cerebellum dual site imaging data, rightmost bar shows an additional 361 GrC observations in lateral Crus II acquired during cerebellum-only imaging sessions by using a more lateral window placement in 2 mice, to confirm the generality of our findings.
(I) Similar to Figure 3B. Here, for each extracted L5 cell or GrC, we computed the full distribution of r values to all other L5 cells or GrCs. We then averaged this distribution across all such cells. Most correlations are much lower than the best-match correlation, as most pairs of neurons will encode unrelated and uncorrelated quantities. Nevertheless, as in Figure 3B, L5-GrC correlation magnitudes were comparable to L5-L5 correlations and GrC-GrC correlations were higher. (We show the absolute value of r to collapse positive and negative correlations.)
(J) To quantify correlations expected due to similarities in trial-averaged task tuning of L5 cells and GrCs, we generated shuffled datasets in which GrC activity was paired with L5 cell activity from mismatched trials (of the same movement direction). Thus, the GrC signals on each left (or right) turn was randomly correlated to the L5 signals on a different left (or right) turn trial. For each imaging session we computed the fraction of GrCs whose best-match L5 correlation was >0.4 (black dots). The red box plots show the distribution of correlated cell fractions across all shuffles. In every session, true correlations substantially exceeded shuffled correlations.
(K) To determine correlations in trial-to-trial variability, we computed the average across trials of the time-varying response of each GrC (separately for left and right trials). We then subtracted the cell’s time-varying trial-averaged activity from the single-trial fluorescence. Correlations in trial-to-trial variability were thereby computed using the mean-subtracted data. Scatter shows that the total correlations used throughout the study (x-axis) were highly similar to the correlations in trial-to-trial variability (y-axis). The controls here and in (J) suggest substantial correlated trial-to-trial variability between cells (Cohen and Kohn, 2011).
(L–O) Low OFC L5-GrC correlations. In our tracing experiments (Figure S1), we found that orbitofrontal cortex (OFC) contained a similar density of disynaptic cerebellum-projecting neurons as motor cortices. Specifically, OFC makes up 2% of all cortical neurons (Herculano-Houzel et al., 2013), and contributed 4.3% of labeled L5 inputs in our tracing. In comparison, M1 and M2 make up 10% of all cortical neurons (Herculano-Houzel et al., 2013), and contributed 25% of labeled L5 inputs in our tracing. OFC therefore provides a useful comparison to our premotor cortex data. We devised a strategy to image OFC L5 and cerebellar GrCs. L, Sagittal view of the mouse brain illustrating schematic of simultaneous OFC L5 and GrC imaging. We used a prism-GRIN endoscope to optically access the OFC. M, Example Ca2+ fluorescence traces of GrCs and OFC L5 cells (n=20 cells of each type shown, from total of 80 GrCs and 73 OFC L5 neurons in this imaging session). Thin vertical lines denote the individual turn motion onsets. N, Best-match L5-GrC correlations were substantially weaker in OFC imaging sessions than in premotor sessions (p<10−6 Kolmogorov-Smirnov test, n=2,417 GrCs from GrC/Premotor sessions and 866 GrCs from GrC/OFC sessions). O, Similarly, substantially less single-trial activity of individual GrCs was recoverable via linear regression by L5 ensembles in OFC than by premotor cortex (p<10−6 Wilcoxon rank-sum test).
Figure S4. Simulations of Granule Cell Integration of Mossy Fiber Input, Related to Figures 2 and 3.
The GrC layer is thought to perform dimensionality expansion as a result of each GrC sparsely sampling the available mossy fiber (MF) inputs (4 MFs per GrC); by thresholding the input, GrCs may act as combinatorial coincidence detectors. Important parameters that influence the degree of dimensionality expansion, given the known anatomy, include (1) the GrC activation threshold (how much input is needed to drive GrC spiking), (2) the relative strength of each MF input to a GrC (whether some inputs or classes of inputs are more effective at driving spiking than others), and (3) the degree of clustering of similar types of MFs in individual GrCs (Ishikawa et al., 2015) (e.g., by selective wiring during development). Regarding (1), some data suggests that GrC activation thresholds are >1 active MF (Chadderton et al., 2004), which theory indicates is important to obtain dimensionality expansion in the GrC layer (Cayco-Gajic et al., 2017). Data relating to (2) indicates that some MFs may possess the ability to reliably drive spiking in recipient GrCs on their own (Rancz et al., 2007), but the prevalence of this phenomenon in L5-GrC transmission remains unclear. Finally, both prior tracing data (Brodal and Bjaalie, 1997; Kelly and Strick, 2003; Suzuki et al., 2012) and our own data (Figure S1) indicate that regionally, the cortico-cerebellar projection is characterized by extensive divergence and convergence; however, it remains largely unknown whether wiring at the level of single GrCs is random with respect to the neocortical region of origin. Given these important questions and the limited existing data comparing GrC ensemble dynamics to L5 output, we sought to investigate which regimes of GrC layer function are most consistent with our L5-GrC imaging data. Specifically, our data indicated that L5-GrC correlations were nearly as high as L5-L5 correlations, GrC-GrC correlations were even higher, and GrC selectivity for different stimuli was comparable to that of L5 ensembles (Figure 3B and 2F).
We therefore implemented simulations of the L5-pons-GrC circuit (Albus, 1971; Babadi and Sompolinsky, 2014; Cayco-Gajic et al., 2017; Litwin-Kumar et al., 2017; Marr, 1969) with varying MF integration strategies, using parameters taken from our data and the literature where available (see STAR Methods for details). In all models, task-related L5 cells projected to pontine cells via Hebbian synapses. GrCs received four MFs from both task-related pontine cells and a population of all other inputs (task-unrelated). We parametrized the probability of a GrC receiving a MF from the task-related MF pool by pinput (0.5 in all simulations displayed; results were qualitatively similar at 0.4 and 0.6). Following prior models (Babadi and Sompolinsky, 2014; Litwin-Kumar et al., 2017), GrC activation thresholds were set dynamically by a feedforward inhibition mechanism through the Golgi cell network that matched GrC activity levels to event rates in the data.
Broadly we considered two classes of model. In one, GrCs, on average, integrated their 4 inputs uniformly (A–E), in which case we considered differing activation thresholds. In the other case, we considered a situation where task-relevant MFs originating in premotor L5 were substantially stronger than other MFs and were sufficient to drive GrC activity (F–H). For all simulations, we propagated L5 activity with L5-L5 correlations matched to the data (Figure 3B, S3I) through the circuit and measured the resulting GrC-GrC and L5-GrC correlations. These results depended on the (unknown) level of correlation among all MFs, inputs to GrCs that arise from many disparate sources (Cayco-Gajic et al., 2017). We therefore systematically varied MF correlations in repeated simulations and recorded how the resulting GrC-GrC and L5-GrC correlations changed.
In each case, we investigated the level of MF correlations that were required to produce GrC-GrC and L5-GrC correlations as high as those observed in our data. In addition, we quantified simulated GrC selectivity for different stimuli (as the response variance across stimuli).
(A) Mossy fiber integration models. GrCs integrated their 4 MF inputs via random, fixed synaptic weights drawn from a Gaussian distribution, such that all MFs contributed equally to the GrC ensemble on average. For each simulated stimulus, a GrC activated if the sum of its inputs exceeded a threshold. In B and C, GrCs required on average two simultaneously active MFs in order to spike (higher threshold simulations are less consistent with the data). Alternatively, in D and E, we considered a scenario where GrCs simply relay all input via a GrC threshold of only 1 active MF.
(B) Relationship between correlations among all the simulated MF inputs. The curves show the correlations resulting from the simulations, either among GrCs (blue) or between L5 and GrCs (purple), as we varied the correlations among all MFs (x-axis). The axes in these plots are ratios, expressing the magnitude of correlations relative to the magnitude of the L5-L5 correlations. Hence, a value of 1 on the x-axis corresponds to simulations in which the correlations among all MFs were as high as the local correlations among L5 neurons. Similarly, a value of 1 on the y-axis for the blue curve corresponds to simulations in which GrC-GrC correlations were as high as L5-L5 correlations. The dashed horizontal lines show the GrC-GrC correlations (blue) or L5-GrC correlations (purple) seen in our data, also expressed as a ratio, i.e., relative to the L5-L5 correlations in our data. The intersection of the simulation results (solid curves) with the dashed lines in B (and D) represent the parameter values at which the simulation produced correlations comparable to our data. This suggests that, to recapitulate our data, random mossy fiber integration requires correlations among all MF inputs to be as high as or higher than the local correlations we observed among premotor L5 cells (i.e., x-axis values near or greater than 1). This is unlikely, given the diverse origins of MF inputs, both from throughout cortex (Figure S1) as well as from brainstem and spinal cord sources.
(C) To assess stimulus tuning in simulated GrCs, we computed a selectivity metric (which can be interpreted as the response variance of a neuron across different stimuli; thus, high variance means high selectivity). In the mossy fiber integration simulation, highly selective GrCs were very rare, contrary to our data. (In this panel and E and H below, MF correlations were fixed at 20% of L5-L5 correlations, a low correlation regime similar to where the dominant mossy fiber model below recapitulated the data in F). Finally, we also considered a scenario where, due to potential MF clustering, individual GrCs were likely to receive multiple premotor MFs. This does not substantially improve selectivity: because premotor L5 is itself heterogeneous, receiving two premotor MFs increases the likelihood of “mixing away” the selectivity originally present in L5 (data not shown).
(D and E) Same as B and C for non-sparsening GrCs. This allows L5-derived MFs to reliably activate GrCs, which increases L5 signals in GrC output. However, it also allows task-unrelated MFs to activate GrCs. As a result, this model still failed to reproduce our data at low MF correlation levels (D). Similarly, because both task-relevant and task-irrelevant MFs activate GrCs, highly stimulus-selective GrCs remain rare (E), contrary to our data. Thus, regardless of GrC threshold choice, we find that GrCs which transmit similar contributions from both relevant, L5-derived and also from irrelevant inputs yield both correlations and selectivity lower than in our data.
(F–H) Dominant mossy fiber model in which a single task-related MF dominantly drives recipient GrCs (F). As this model had the same ~2 MF GrC activation threshold as above, dominant MFs had synaptic weights set to be twice as high as a typical MF (drawn from a Gaussian distribution as above). Unlike integration models, the dominant MF model yielded high L5-GrC and GrC-GrC correlations (G) as well as high GrC selectivity (H), thereby better matching our data (in G, the purple star indicates that the simulated L5-GrC correlations were already higher than the data at the lowest possible MF-correlation parameter, limited by chance). Our simulations assumed that task-irrelevant MFs are substantially active. If however, task-irrelevant MFs contribute substantially less input than L5-derived inputs, the situation could functionally approximate a dominant mossy fiber model.
(I) Schematic of two regimes of granule cell transmission. When GrCs integrate similar contributions from each MF (Regime 1; left), the effect of two GrCs sharing one L5-derived task-encoding MF is substantially smaller than in the case where that common MF dominates the output of both neurons (Regime 2; right), which results in higher L5-GrC correlations, lower GrC dimensionality, and stronger task selectivity. Our data suggest that learning shifts more GrCs that receive a task-relevant MF input into Regime 2.
Figure S5. Testing Pontine Contributions to Cortico-cerebellar Dynamics, Related to Figure 4
(A and B) For optogenetic inhibition of basal pons during cerebellar-only imaging, we mounted laser output fibers directly on-axis with the implanted fibers, using standard ferrule mating sleeves (A), as there was ample mechanical clearance between the cerebellar imaging objective and the optogenetic fibers (B).
(C–E) Pontine photoinhibition during cortex and cerebellum imaging required re-routing the laser output fibers to avoid collisions with the cortical objective. We designed a custom micro-optical assembly, consisting of a 0.85 mm diameter GRIN lens fiber collimator and a right angle prism mirror (C), to fold the fiber axis by 90°. We verified the laser-folding optical design with ray-tracing simulations (D), which showed that output light from a 25 μm core, 0.10 NA laser delivery fiber was confined within the 200 (or 400) μm diameter core of the implanted fibers. Bilateral fold adapters permitted bilateral pontine photoinhibition during dual-site imaging without collisions (E).
(F and G) Spectral separation of the optogenetics laser and two-photon imaging path. To actuate eNpHR3.0, we utilized a 594 nm laser which we coupled into light delivery fibers (F, top). During eNpHR3.0 perturbation trials, we typically used 15 mW of continuous wave (CW) 594 nm illumination per side. In the emission path of the two-photon microscopes, we inserted 594 nm notch filters to suppress 594 nm light from reaching the PMT (f, bottom). To actuate iC++, we utilized a 488 nm laser (G, top). During iC++ perturbation trials, we typically used an average power of 5 mW per side (i.e., ~10 mW CW power at ~50% duty cycle). In the emission path of the two-photon microscopes, we inserted a 496 nm LP filter to suppress blue light. BP: bandpass, LP: longpass, SP: shortpass.
(H) Spectral separation is sufficient for two-photon Ca2+ imaging during 594 nm illumination of the pons. We compared the distribution of pixel values in 1,000 Ca2+ imaging frames with bilateral 594 nm illumination of the pons (orange) to the distribution of pixel values in 1,000 Ca2+ imaging frames with the 594 nm laser off (black). We scaled the pixel values by setting the mean of the laser-off distribution to 1. The two pixel distributions are similar, indicating the spectral separation scheme described in F is sufficient to enable Ca2+ imaging of the dorsal cortex and cerebellum during optogenetic perturbation of the pons via eNpHR3.0.
(I) Spectral separation alone does not allow two-photon Ca2+ imaging during 488 nm pontine illumination. We compared the optogenetic laser-on and laser-off distributions as in H, but using the setup for iC++ described in G. Illuminating the pons with 488 nm light results in ~100-fold increase in the recorded pixel values over two-photon GCaMP6f fluorescence levels.
(J) Temporal multiplexing scheme for 488 nm iC++ actuation during two-photon Ca2+ imaging. During optogenetic perturbation periods, we divided the imaging frame into an odd number (e.g. N=11) of subfields, each consisting of 512 / 11 ≈ 47 lines. On odd-numbered imaging frames we imaged the odd subfields and enabled the 488 nm laser during the even subfields (top left). The 488 nm laser on subfields were saturated by the blue laser, so GCaMP6f fluorescence acquired at these times was not recoverable. On even numbered frames, we imaged the even subfields and enabled the 488 nm laser during the odd subfields (top middle). Hence, every pair of frames during optogenetic trials were combined to produce the full image (top right) but at half the frame rate. With these parameters, typical 488 nm laser on time was ~2.7 ms and typical off time was ~3.1 ms (bottom; iC++ channel closure time is τfast ≈ 12.1 ms (Berndt et al., 2016)).
(K) Coronal section of the midbrain showing fiber implantation tracks (white outline) over the basal pontine nuclei expressing AAV8-hSyn-eNpHR3.0-mCherry (red).
(L) Fraction of GrCs that were identified as direction-preferring during movement or reward (via linear regression as described in Figure 2E) that were inhibited by pontine photoinhibition.
(M and N) Two example cells that were disinhibited on laser-on trials relative to laser-off trials (Trial numbers: 93/95 laser-off, 24/24 laser-on, for M/N respectively).
(O) Left, example confocal section showing opsin-mCherry-positive pontine terminals (arrows) in our imaging area in the cerebellar cortex. Right, quantification of the density of mCherry-positive rosettes. Estimates in rats (Billings et al., 2014) suggest a rosette density of ~6×10⁵ / mm3, which should be a lower bound for mice due to the larger structure sizes in rats. Thus, the 2±0.2×10⁴/mm3 mCherry-positive rosettes comprises <5% of total rosettes, likely accounting for the mild photoinhibition effect.
(P) Fraction of L5 cells significantly inhibited (1%) or disinhibited (4%) during pontine photoinhibition, likely due to disruption of information flow through the feedback pathway from the cerebellar nuclei to the cortex via thalamus.
(Q and R) Effects of pontine inhibition on behavior. When randomly interleaving pontine inhibition on 20% of trials (Q, i.e., the experiments shown in the rest of the manuscript except panel R), behavior was unaffected (p>0.05 Wilcoxon rank sum, for each metric). With a stronger manipulation (R), in which two blocks of laser-off trials (one each of left and right turns) were followed by two blocks of laser-on trials, behavior was significantly degraded, as movements took longer to execute (p=0.01 for lateral motion duration, 0.04 for total movement duration; n=213 laser-off and 184 laser-on trials from 3 mice). As a control, we confirmed that for the same mice on the preceding day, comparing the first 2 laser-off blocks to the subsequent 2 laser-off blocks demonstrated no significant difference in motion (data not shown, p=0.93 and 0.33 for total and lateral motion durations).
Figure S6. Evolution of L5 and GrC Correlations during Learning, Related to Figures 5 and 6.
(A) Left, separate behavioral signals were defined for left and right movement and reward. Whereas the single-cell behavioral regressors shown in Figure 2E are separated by pre/post, the behavioral signals defined here are collapsed across the pre/post epoch. Right, example using the L5 cell ensemble (left two columns) or GrC ensemble (right two columns) to decode movement or reward events by turn direction, by fitting a separate regression for each day onto each of the 4 behavioral signals (left; Day 1: n=24/68; Day 4: 57/33; Day 16 (last day): 24/37 left/right turn trials). Early in learning, although ensembles often produced task-locked activity, the signals poorly discriminated left and right turn trials. Late in learning, both L5 and GrC ensembles produced task-locked signals that were distinct for each turn direction.
(B) To assess dimensionality of trial-averaged response profiles, we performed PCA across cells, using the matrix of time-varying trial-averaged activity patterns. Averages were taken separately across left and right turn trials and then concatenated so that the resulting matrix was of size (2×N)-by-C, where N is the number of timepoints per trial and C is the number of cells. Variance explained by the top 10 principal components of trial-averaged population activity rises over learning (p=10−5 and 2.6×10⁻⁵ for GrCs and L5 cells respectively), indicating reduced diversity of trial-averaged response profiles.
(C) Another example of a L5-GrC pair, as in Figure 6A, showing increased correlation over learning.
(D) For an example mouse, distribution across GrCs of the best-match correlation coefficient to an L5 cell on an individual day early-, mid-, and late-learning (n=152, 168, and 152 GrCs on day 1, 7, 18 respectively).
(E) For all cells, best-match correlation coefficient to other cells at different phases of learning. Lines show average across cells over learning (all p< 10−6 comparing early and late learning, Wilcoxon rank sum test; n=1,668/1,997, 2,113/2,324, and 1,666/1,647 L5/GrC observations early, mid, and late in learning respectively).
(F and G) As in E, changes over learning of each GrC’s best-match correlation coefficient to an L5 cell, here broken down into correlations in trial-averaged response profiles (F, p< 10−6 Wilcoxon rank sum test comparing early and late), and correlations in trial-to-trial variability (G, p=6.7×10⁻⁶). To determine correlations in trial-to-trial variability, we subtracted each cell’s trial-averaged activity from its single-trial activity before computing correlations with activity of other cells.
(H) Event rates in L5 cells and GrCs fell over learning (n=1997, 2324, 2417 GrC observations and 1668, 2113, 2037 L5 cell observations early, mid, and late in learning. n=7 mice, p< 10−6 Wilcoxon rank sum test comparing early and late learning).
(I) For all L5-GrC cell pairs, we also computed the cross-correlation coefficient over a wide range of lead and lag offsets between the pair. In expert mice, more cell pairs exhibited peak cross-correlations at near zero lags (histograms computed over −5 to 5 s lags, but displayed from −2 to 2 s to clearly show difference near 0 lag).
Figure S7. Further Analysis of Correlated Changes in L5 and GrC Activity and Behavior, Related to Figure 7
(A) Durations of forward and lateral motions did not change during learning (p>0.05; n=460 trials from Day 1 sessions and 3,062 trials from Expert sessions). This indicates that the decrease in total movement duration after learning (Figure 7A, middle panel) was driven entirely by a decrease in the transition time between the end of the forward motion end and the onset of the correct lateral motion (Figure 7A, right).
(B) The transition time between the end of the forward motion and the onset of the lateral motion (as in Figure 7A, right) also decreased when considering only pure turn trials (p<10−6 Wilcoxon sign rank test, n=303 Day 1 sessions and 2,895 Expert pure turns).
(C and D) As in Figure 7F, but across all mice and neurons (C; p=0.3 least vs. most consistent from late learning; p<10−6 comparing most consistent mid-learning to least consistent late-learning sessions; n=2324 and 1647 GrC observations in mid- and late-learning sessions, respectively, from 7 mice), or restricted to the set of GrCs and L5 neurons that were tracked every day throughout learning (D, p=0.73 least vs most consistent late; p=0.006 most consistent mid-learning vs least consistent late-learning sessions; n=183 GrCs and 133 L5 cells tracked in 4 mice).
Movie S1 ∣ Example simultaneous two-photon Ca2+ imaging of cerebellar GrC and premotor cortex layer 5 cells during a forelimb motor sequence planning task, Related to Figure 1. The movie is 4x temporally down-sampled from the 30-Hz acquisition rate (8-frame rolling average played at 15 Hz).