

SUMMARY
Expansion of amino acid repeats occurs in >20 inherited human disorders, and many occur in intrinsically disordered regions (IDRs) of transcription factors (TFs). Such diseases are associated with protein aggregation, but the contribution of aggregates to pathology has been controversial. Here we report that alanine repeat expansions in the HOXD13 TF, which cause hereditary synpolydactyly in humans, alter its phase separation capacity, and its capacity to co-condense with transcriptional co-activators. HOXD13 repeat expansions perturb the composition of HOXD13-containing condensates in vitro and in vivo, and alter the transcriptional program in a cell-specific manner in a mouse model of synpolydactyly. Disease-associated repeat expansions in other TFs (HOXA13, RUNX2, TBP) were similarly found to alter their phase separation. These results suggest that unblending of transcriptional condensates may underlie human pathologies. We present a molecular classification of TF IDRs, which provides a framework to dissect TF function in diseases associated with transcriptional dysregulation.
Graphical Abstract
IN BRIEF STATEMENT
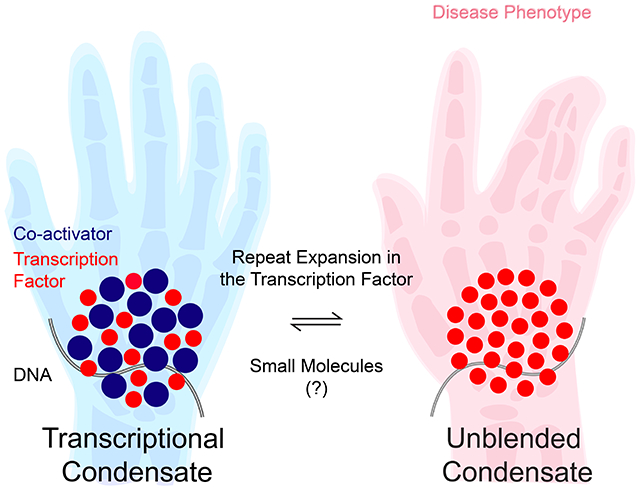
Disease-associated repeat expansions within transcription factors alter their capacity to co-condense with transcriptional co-activators
INTRODUCTION
More than 30 inherited human disorders are caused by an abnormal expansion of short, repetitive DNA sequence elements (Albrecht and Mundlos, 2005; Darling and Uversky, 2017; La Spada and Taylor, 2010; Orr and Zoghbi, 2007). The majority (>20) of such repeat expansions occur in protein coding genes and lead to expansions of homopolymeric alanine or glutamine repeats in cellular proteins. Glutamine repeat expansions are typically associated with devastating neurodegenerative diseases e.g. Huntington’s disease and spinocerebellar ataxia (La Spada and Taylor, 2010; Orr and Zoghbi, 2007), and alanine repeat expansions are typically associated with severe developmental disorders e.g. X-linked retardation, congenital ventral hypoventilation and synpolydactyly (Albrecht and Mundlos, 2005).
Virtually all investigations to date have focused on three features of proteins that contain disease-associated repeat expansions, as cause of their pathology: their proclivity to form solid aggregates, alteration in their subcellular localization, and alteration of their proteolytic processing (Darling and Uversky, 2017; Orr and Zoghbi, 2007; Ross and Poirier, 2004). For example, many studies have established a correlation between aggregate formation by the mutant HTT protein and degeneration of specific neurons in Huntington’s disease (Davies et al., 1997; Ross and Poirier, 2004; Zoghbi and Orr, 2000). However, several lines of evidence suggest that perturbed function of the soluble, appropriately localized fraction of the repeat-expanded protein may be responsible for its pathological effect, rather than aggregates (Ross, 2002; Saudou et al., 1998; Truant et al., 2008). Improved understanding of the function of the affected proteins and how the repeat expansions interfere with those functions would facilitate the development of therapeutics for this family of disease.
The majority (15/20) of disease-associated repeat expansions occur in nuclear proteins, most of which are sequence-specific transcription factors (TFs) (Darling and Uversky, 2017). For example, expansions of an alanine repeat in the homeobox transcription factor HOXD13 cause synpolydactyly, a hereditary limb malformation disorder (Muragaki et al., 1996), and expansions of a glutamine repeat in the highly conserved transcription factor TATA-box binding protein (TBP) causes spinocerebellar ataxia type 17, a progressive neurodegenerative disease (Nakamura et al., 2001). New insights into how transcription factors interact with components of the transcription machinery to control gene expression programs would thus likely afford significant advance in our understanding of how repeat expansions in transcriptional regulators lead to pathology.
Control of gene transcription in eukaryotes involves the recruitment of RNA Polymerase II (RNAPII) to genomic sites by sequence-specific transcription factors (TFs) assisted by diverse transcriptional co-activators (Levine et al., 2014). Separation of liquids into a dense and dilute phase underlies the formation of several subcellular membraneless organelles (Alberti et al., 2019; Banani et al., 2017; Shin and Brangwynne, 2017), and recent evidence suggests that the assembly of the transcription machinery at genomic sites occurs through liquid-liquid phase separation, leading to the formation of transcriptional condensates (Boehning et al., 2018; Chong et al., 2018; Hnisz et al., 2017; Li et al., 2019; Sabari et al., 2018). For example, several transcription factors (e.g. FET family TFs, OCT4, SP1), co-activators (e.g. Mediator, BRD4) and RNA Polymerase II contain intrinsically disordered regions (IDRs) that drive their phase separation, and these factors form discrete nuclear puncta in mammalian cells (Boehning et al., 2018; Cho et al., 2018; Chong et al., 2018; Kwon et al., 2013; Lu et al., 2018; Sabari et al., 2018). While TF- and co-activator-containing condensates are sensitive to short-chain aliphatic alcohols that dissolve various intracellular membraneless organelles (Boehning et al., 2018; Chong et al., 2018; Sabari et al., 2018), the functional importance of phase separation in transcriptional control has been unclear.
Here, we investigate the hypothesis that repeat expansions in intrinsically disordered regions (IDRs) of transcription factors (TFs) alter the phase separation capacity of those TFs, and their capacity to form transcriptional condensates with components of the transcription machinery. We found that the IDR of the HOXD13 TF drives phase separation and co-condensation with the Mediator co-activator. Synpolydactyly-associated alanine repeat expansions facilitate homotypic HOXD13 phase separation, and the mutant HOXD13 IDRs co-condense less readily with Mediator than the wild type HOXD13 IDR, a phenomenon we term “condensate unblending”. In a mouse synpolydactyly model, HOXD13 repeat expansion led to cell-type specific transcriptional changes of HOXD13 targets in disease-relevant cells. We propose that disease-associated mutations in TF IDRs alter the features that drive the TF’s condensation behavior, and present a molecular classification of TF IDRs as a framework to dissect the pathomechanism of diseases associated with transcription factor dysfunction.
RESULTS
The HOXD13 IDR drives phase separation
Disease-associated repeat expansions are significantly enriched in transcription factors (TFs) (p<10−4, Fisher’s test; Figure 1A). To investigate the hypothesis that disease-associated repeat expansions alter the phase separation capacity of the TFs in which they occur, we first focused on the homeobox TF HOXD13 as a proof of concept, because the genetics of HOXD13 in disease is well characterized (Albrecht et al., 2004; Kuss et al., 2009; Muragaki et al., 1996; Villavicencio-Lorini et al., 2010). During mammalian embryogenesis, Hoxd13 is expressed in the limb bud (Figure 1B) and controls skeletal morphogenesis (Villavicencio-Lorini et al., 2010). HOXD13 mutations cause hereditary limb malformations e.g. synpolydactyly, a syndrome characterized by extra digits and digit fusions (Muragaki et al., 1996). High-resolution confocal imaging of the HOXD13 protein in mouse limb bud cells revealed that HOXD13 forms discrete nuclear puncta (Figure 1B). HOXD13 puncta were detected using different HOXD13 antibodies (Figure S1A–B), and in several human cell lines that express HOXD13 (Figure S1B–C). Stochastic optical reconstruction microscopy (STORM) revealed that HOXD13 puncta in limb bud cells were ~100nm in size and occurred in less DNA dense parts of the nucleus (Figure 1C), similar to previously described co-activator and RNAPII puncta (Cho et al., 2018). These results are consistent with the notion that HOXD13 may be a component of transcriptional condensates.
Figure 1. The HOXD13 IDR drives phase separation.

(A) Disease-associated repeat expansions in humans. (a.a: amino acid)
(B) (left) Hoxd13 whole mount in situ hybridization in an E12.5 mouse embryo. (right) HOXD13 Immunofluorescence (IF) in E12.5 mouse limb bud cells.
(C) Stochastic optical reconstruction microscopy (STORM) images of E12.5 mouse limb bud cells. The zoomed-in area on the right is highlighted with a red box on the left.
(D) Graph plotting intrinsic disorder for human HOXD13. The IDR cloned for subsequent experiments is highlighted with a purple bar.
(E) Scheme of the optoDroplet assay. The optoIDR construct consists of the HOXD13 IDR fused to mCherry and the A. thaliana CRY2 PHR domain.
(F) Representative images of live HEK-293T cells expressing mCherry-CRY2 (top) and HOXD13 IDR-mCherry-CRY2 (bottom) fusion proteins. Cells were stimulated with 488nm laser every 20s for 3 minutes.
(G) Quantification of the fraction of the cytoplasmic area occupied by HOXD13 IDR-mCherry-CRY2 and mCherry-CRY2 droplets in HEK-293T cells over time. Data displayed as mean+/− SEM.
(H) Fluorescence intensity of HOXD13 IDR-mCherry-CRY2 droplets before, during and after photobleaching. Data displayed as mean+/−SD.
(I) Time lapse images of a droplet fusion event in HEK-293T cells expressing HOXD13 IDR-mCherry-CRY2 fusion protein.
(J) (left) Representative images of droplet formation by purified HOXD13-mCherry and mCherry at the indicated concentrations. (right) Phase diagram of HOXD13-mCherry in the presence of different concentrations of PEG-8000. The size of the circles is proportional to the size of droplets detected in the respective buffer conditions.
See also Figure S1.
Intrinsically disordered regions (IDRs) in proteins are known to drive phase separation (Banani et al., 2017; Shin and Brangwynne, 2017), and the HOXD13 N-terminus has sequence features predictive of an IDR (Figure 1D). Therefore, we used an optogenetic platform to investigate whether the HOXD13 IDR can drive phase separation in vivo. In brief, the optoDroplet assay involves expression of a fusion protein consisting of the IDR of interest, mCherry, and the photolyase domain of the Arabidopsis thaliana CRY2 protein. Excitation of CRY2 with blue light stimulates its self-association, which leads to an increase of local concentration of the fused IDR (Shin et al., 2017). IDRs that drive phase separation subsequently facilitate the formation of liquid-like droplets (Figure 1E), which tend not to form in the absence of the IDR (Sabari et al., 2018; Shin et al., 2017). The HOXD13 IDR fused to mCherry and CRY2 facilitated the formation of droplets upon blue-light stimulation in HEK293T cells (Figure 1F–G, S1D). As expected for phase-separated condensates, the extent of HOXD13 IDR droplet formation correlated with the expression level of the fusion protein (Figure S1E). Fluorescence recovery after photobleaching (FRAP) revealed rapid, liquid-like recovery rate of the HOXD13 IDR-mCherry-CRY2 droplets (Figure 1H, S1F), and the droplets were sometimes observed to undergo fusion (Figure 1I), which are characteristics of phase-separated condensates (Alberti et al., 2019). These results suggest that the HOXD13 IDR has the capacity to drive phase separation in vivo.
If the HOXD13 IDR can drive phase separation, the purified IDR should form liquid-like droplets in vitro. Purified recombinant HOXD13 IDR-mCherry fusion protein indeed formed droplets in the presence of 10% PEG-8000, while an mCherry control did not (Figure 1J). As expected for phase-separated condensates (Alberti et al., 2019), the HOXD13 IDR droplets had spherical shape, and their size scaled with the concentration of the protein (Figure 1J). These results indicate that the HOXD13 IDR can form condensates in vitro.
Synpolydactyly-associated repeat expansions enhance HOXD13 IDR phase separation
Expansions of an alanine repeat in the IDR of HOXD13 cause synpolydactyly, a congenital limb malformation (Figure 2A–B) (Kuss et al., 2009; Muragaki et al., 1996). Of note, HOXD13 mutants that contain short (e.g. +7A) synpolydactyly-associated expansions have not been described to form aggregates, suggesting that protein aggregation does not explain the pathology of short repeat expansions (Albrecht et al., 2004; Villavicencio-Lorini et al., 2010). Since the repeat expansions occur within the HOXD13 IDR, which promotes phase separation, we hypothesized that the repeat expansions may alter the phase separation capacity of the HOXD13 IDR. HOXD13 IDRs including the wild type alanine repeat and several synpolydactyly-associated expansions (+7A, +8A, +9A, +14A) were thus tested in the optoDroplet system. To ensure investigation of the phase separation capacity of the HOXD13 IDR in its nuclear context, an SV40 nuclear localization sequence (NLS) was included in all subsequent fusion constructs. Short expansions enhanced the rate of light-induced droplet formation in live cell nuclei (Figure 2C–D, S2A). In addition, spontaneously formed HOXD13 IDR condensates were observed in cells expressing the +8A, +9A and +14A alleles, and the ratio of the protein in the spontaneous condensates and the soluble (diffuse) fraction correlated with the length of the repeat expansion (Figure 2C). DNA staining confirmed that the spontaneous condensates formed by the +8A, +9A alleles were nuclear, whereas the condensates formed by the +14A allele were cytosolic (Figure S2B). These results suggest that alanine repeat expansions enhance the phase-separation capacity of the HOXD13 IDR.
Figure 2. Synpolydactyly-associated repeat expansions enhance HOXD13 IDR phase separation.

(A) Amino acid composition of human HOXD13. Ticks represent amino acids indicated on the y-axis at the positions indicated on the x-axis. The IDR cloned for subsequent experiments is highlighted with a purple bar.
(B) Alanines within the HOXD13 IDR sequence are indicated as red ticks. The central alanine repeat consists of 15As in the wild type protein.
(C) Representative images of live HEK-293T nuclei expressing wt and repeat-expanded HOXD13 IDR-mCherry-CRY2 fusion proteins. Cells were stimulated with 488nm laser every 20s for 3 minutes. Arrowheads highlight spontaneously forming IDR condensates present without 488nm laser stimulation.
(D) Quantification of the fraction of the nuclear area occupied by HOXD13 wt IDR-mCherry-CRY2 and HOXD13 +7A IDR-mCherry-CRY2 droplets in HEK-293T cells over time. Data displayed as mean+/−SEM.
(E) Fluorescence intensity of light-induced wt, +7A and +8A HOXD13 IDR droplets before, during and after photobleaching. Data displayed as mean+/−SD.
(F) Fluorescence intensity of +8A and +9A spontaneously formed HOXD13 IDR condensates before, during and after photobleaching. Data displayed as mean+/−SD.
(G) Representative images of droplet formation by purified HOXD13 IDR-mCherry fusion proteins in droplet formation buffer.
(H) Phase diagram of HOXD13 IDR-mCherry fusion proteins. Every dot represents a detected droplet. The inset depicts the projected average size of the droplets as mean+/− SD (middle circle: mean, inner and outer circle: SD). n.d.: not detected
See also Figure S2.
Phase separated condensates deep beyond the phase boundary can transition to a gel-like state characterized by arrested, yet reversible dynamics (Shin et al., 2017). Consistent with this notion, the light-induced droplets formed by repeat-expanded HOXD13 IDRs exhibited considerably slower FRAP rates than droplets formed by the wild type IDR (Figure 2E). Transient light stimulation revealed that formation of these droplets was reversible (Figure S2C). In addition, the spontaneous condensates formed by the +8A and +9A HOXD13 IDRs exhibited slow, but detectable FRAP rates (Figure 2F). Co-expression of an mCherry-tagged HOXD13 +8A IDR, which forms spontaneous condensates, with YFP-tagged HOXD13 wt and +7A IDRs confirmed that recruitment of IDR fusion proteins to IDR condensates is dependent on the IDR, and correlates with the length of the alanine repeat (Figure S2D–E). These results suggest that the alanine repeat expansion alters the material properties of HOXD13 IDR optoDroplets.
To further probe the effect of alanine repeat expansion on HOXD13 phase separation, we purified various recombinant HOXD13 IDR-mCherry fusion proteins, and investigated their phase separation capacity in droplet formation buffer in vitro. The +7A and +10A IDR mutants formed more, and more concentrated droplets compared to the wt IDR at similar concentrations (Figure 2G–H). Furthermore, the concentrations at which droplets appeared (i.e. the saturation concentration Csat) were lower for +7A and +10A IDRs compared to the wt IDR (Figure 2G–H). Taken together, these results suggest that the alanine repeat expansion enhances phase separation of the HOXD13 IDR, and are consistent with the previously described correlation between the length of the alanine repeat expansion and disease severity (Kuss et al., 2009; Muragaki et al., 1996).
Synpolydactyly-associated repeat expansions alter the composition of HOXD13-containing condensates
Recent studies indicate that TFs can form heterotypic condensates with the IDR of the MED1 subunit of the Mediator co-activator in vitro, and that co-condensation of TFs with the MED1 IDR requires the TFs’ IDR (Boija et al., 2018). We thus hypothesized that the alanine repeat expansion of the HOXD13 IDR alters its ability to co-condense with transcriptional co-activators. To test this model, we purified recombinant MED1 IDR-GFP fusion protein and mixed it with various purified HOXD13 IDR-mCherry fusion proteins. Of note, the condensation behavior of the MED1 IDR is similar to that of purified partial Mediator complex, and the MED1 IDR has thus been a useful surrogate for Mediator condensates in vitro (Boija et al., 2018; Guo et al., 2019; Sabari et al., 2018). We found that heterotypic MED1 IDR-HOXD13 IDR co-condensates had dramatically altered composition when HOXD13 IDRs containing synpolydactyly-associated repeat expansions (+7A, +10A) were used in the mixing experiments. The MED1 IDR droplets incorporated the wild type HOXD13 IDR at several concentrations, and the wild type HOXD13 IDR exclusively occurred in co-condensates with the MED1 IDR (Figure 3A). On the other hand, +7A and +10A HOXD13 IDRs were more enriched in MED1 IDR-containing droplets (p<10−15 Welch’s t-test), but the heterotypic droplets contained on average significantly less MED1 IDR than wild type HOXD13 IDR co-condensates (p<10−15 Welch’s t-test) (Figure 3A–D). These results suggest that the repeat-expanded HOXD13 IDR co-condenses with less MED1 IDR than the wild type HOXD13 IDR, a phenomenon we term “condensate unblending.”
Figure 3. Synpolydactyly-associated repeat expansions alter the composition of Hoxd13-containing condensates in vitro.

(A) Representative images of droplet formation by purified MED1-IDR-GFP and HOXD13 IDR-mCherry fusion proteins in droplet formation buffer.
(B) Quantification of GFP and mCherry fluorescence intensity in HOXD13 IDR-mCherry containing droplets in the indicated MED1 IDR-GFP mixing experiments. Each dot represents one droplet, and the size of the dot is proportional to the size of the droplet.
(C) Quantification of the ratio of GFP and mCherry fluorescence intensity in HOXD13 IDR-mCherry containing droplets in the indicated MED1 IDR-GFP mixing experiments. P value is from a Welch’s t-test.
(D) Quantification of mCherry fluorescence intensity in MED1 IDR-GFP containing droplets in the indicated MED1 IDR-GFP mixing experiments. P value is from a Welch’s t-test.
(E) Quantification of GFP and mCherry fluorescence intensity in HOXD13 IDR-mCherry containing droplets. Each dot represents one droplet. The size of the dot is proportional to the size of the droplet, and the color of the dot is scaled to the MED1 signal in the droplet. The insets show a simplified phase diagram of HOXD13 IDRs based on the data displayed in Figure 2H. x-axis is in log10 scale.
(F) Representative images of the mixtures in (E).
(G) Representative images of droplets formed by purified MED1-IDR-GFP and HOXD13 IDR-mCherry fusion proteins.
(H) Quantification of GFP and mCherry fluorescence intensity in HOXD13 IDR-mCherry containing droplets in the indicated MED1 IDR-GFP mixing experiments. Each dot represents one droplet, and the size of the dot is proportional to the size of the droplet. x-axis is in log10 scale.
(I-J) Quantification of the ratio of GFP and mCherry fluorescence in HOXD13 IDR-mCherry containing droplets in the indicated mixing experiments. In (I), the y-axis is in log10 scale.
(K) Condensate unblending model of the impact of HOXD13 alanine repeat expansions.
We next tested whether various HOXD13 IDRs unblend from the MED1 IDR even at concentrations at which they form comparable homotypic droplets alone. To this end, we preassembled MED1 IDR-GFP droplets for 30 minutes, and mixed the preassembled MED1 IDR-GFP droplets with various concentrations of HOXD13 IDR-mCherry fusion proteins. These included concentrations where the HOXD13 proteins alone formed droplets similar in number, size, and protein content (wt: 5μM, +7A: 1μM, +10A: 0.2μM; see Figure 2H, and Figure 3E insets). The wild type HOXD13 IDR at 1μM was incorporated in MED1 IDR droplets, and its enrichment was concentration-dependent (Figure 3E–F top two panels). On the other hand, small condensates that consisted of almost exclusively HOXD13 +7A IDR were apparent in mixtures containing 1μM HOXD13 +7A IDR, and the median MED1 IDR content of the condensates was substantially lower relative to the MED1 IDR content of the HOXD13 wt IDR-MED1 IDR co-condensates (Figure 3E–F, compare first and third panels). A similar effect was observed when 0.2μM HOXD13 +10A IDR was used in the mixing experiment (Figure 3E–F). These results suggest that condensate unblending occurs at various concentrations in vitro.
The unblending of repeat-expanded HOXD13 IDRs from MED1 IDR-containing co-condensates indicates that the alanine repeat expansion increases the preference for homotypic HOXD13 IDR-IDR interactions over heterotypic interactions with the MED1 IDR. If this model is true, disrupting weak hydrophobic interactions could revert the composition of repeat-expanded HOXD13 IDR-containing MED1 co-condensates to be more similar to the composition of HOXD13 wt IDR-MED1 IDR co-condensates (i.e. “reblend” them). To test this notion, we treated HOXD13 IDR-MED1 IDR co-condensates with ATP, a small hydrotropic molecule known to solubilize hydrophobic molecules at mM concentrations (Patel et al., 2017). ATP reblended HOXD13 +7A IDR-MED1 IDR co-condensates in a dose dependent manner (Figure 3G–I). The reblending effect appeared specific to ATP, as lipoic acid, lipoamide and mitoxantrone – compounds that were recently reported to dissolve condensates formed by stress granule proteins (Wheeler et al., 2019) – failed to reblend HOXD13 +7A IDR-MED1 IDR co-condensates (Figure 3J). Taken together these results suggest that HOXD13 repeat expansion leads to unblending of HOXD13 IDR-MED1 IDR co-condensates (Figure 3K).
Altered composition and properties of repeat-expanded HOXD13-condensates in vivo
Next we sought to investigate the effect of disease-associated repeat expansions on endogenous HOXD13-containing condensates in vivo. To this end, we isolated limb bud cells from homozygous spdh mouse embryos and wild type littermates. Spdh mice carry +7A repeat-expanded Hoxd13 alleles, and homozygous spdh mice exhibit synpolydactyly (Bruneau et al., 2001). We first tested whether transcriptional co-activators are associated with HOXD13-containing condensates in limb bud cells using antibody staining and STORM imaging. As no high quality Mediator antibodies were available to co-stain with HOXD13 in STORM, BRD4 was visualized instead of Mediator. BRD4 is a ubiquitous co-activator that co-purifies with Mediator (Jiang et al., 1998), co-condenses with Mediator (Sabari et al., 2018), and BRD4 chemical inhibition dissolves Mediator condensates in vivo (Cho et al., 2018). We found that BRD4 more frequently overlapped HOXD13 puncta in wild type limb bud cells than in spdh limb bud cells harboring HOXD13 +7A alleles [1.5-fold difference in Manders co-efficient, p-value<0.001, two-tailed t-test)] (Figure 4A–B). As a control, HP1α was co-visualized with HOXD13, and the two proteins showed negligible overlap (Figure 4B). These results suggest that HOXD13-condensates have altered composition in vivo.
Figure 4. Altered composition and properties of repeat-expanded HOXD13-condensates in vivo.

(A) (left) Experimental scheme (right) Stochastic optical reconstruction microscopy (STORM) images of wt and spdh E12.5 mouse limb bud cell nuclei. The zoomed-in area on the right is highlighted with a white box in the middle.
(B) Manders overlap coefficients of the STORM co-localizations. P value is from a Student’s t test.
(C) (left) Experimental scheme (right) Representative images of wild type and spdh mouse limb bud cells with or without treatment with 6% 1,6-hexanediol for 1min.
(D) Quantification of signal within HOXD13 puncta in mouse limb bud cells [displayed in (C)] with or without treatment with 6% 1,6-hexanediol for 1min.
(E) Fluorescence images of ectopically expressed MED1 IDR-YFP in U2OS cells co-transfected with the indicated HOXD13 IDR-LacI-CFP fusion constructs.
(F) Quantification of the relative MED1 IDR-YFP signal intensity in the HOXD13 IDR foci. P values are from a Welch’s t-test.
(G) Luciferase reporter assays of HOXD13 wt, +7A and +10A mutants co-expressed with a Raldh2-luciferase reporter construct. P value is from a Student’s t test.
See also Figure S3.
To investigate the biophysical properties of HOXD13-containing condensates in vivo, wt and spdh limb bud cells were treated with 1,6-hexanediol (1,6-HD), a short-chain aliphatic alcohol that dissolves various intracellular membraneless organelles (Boehning et al., 2018; Chong et al., 2018; Sabari et al., 2018). HOXD13 was subsequently visualized with immunofluorescence. Both wt and +7A HOXD13 localized within discrete nuclear puncta (Figure 4D), but the puncta detected in limb bud cells expressing +7A HOXD13 displayed considerably reduced sensitivity to 1,6-HD (Figure 4C–D, S3A–B). These results suggest that a short alanine repeat expansion (+7A) alters the biophysical properties of HOXD13-containing puncta in limb bud cells.
To test whether repeat-expansion impairs the ability of HOXD13 condensates to recruit Mediator in vivo, various HOXD13 IDRs were tethered to a LacO array in U2OS cells expressing an ectopic MED1 IDR-YFP fusion protein (Figure 4E) (Janicki et al., 2004). MED1 IDR-YFP was found mildly enriched at the LacO array occupied by the HOXD13 wt IDR tether, and its incorporation was significantly reduced in the +7A and +10A HOXD13 IDR tethers (P<10−2, Welch’s t test) (Figure 4E–F). Consistent with the notion that HOXD13 repeat expansion impairs Mediator recruitment to HOXD13 condensates, spontaneously forming HOXD13 +8A IDR condensates observed in HEK293T cells excluded the MED1 IDR (Figure S2D–E).
The Mediator co-activator plays key roles in recruiting RNA Polymerase II to TF-bound genes (Levine et al., 2014), so a reduction of MED1 content in mutant HOXD13-containing condensates would be expected to reduce the transcriptional activity of repeat-expanded HOXD13. Consistent with this idea, repeat-expanded HOXD13 alleles displayed reduced activity in luciferase reporter assays (Figure 4G).
To rule out that the repeat expansion affects DNA binding of HOXD13, we performed Chromatin Immunoprecipitation followed by sequencing (ChIP-Seq) on FLAG-tagged HOXD13 proteins expressed in a chicken transgenic cell system (Ibrahim et al., 2013). The genome-wide binding of +7A HOXD13 was virtually indistinguishable from the binding of wt HOXD13 (Figure S3C–E). As a control, a HOXD13 allele containing a Q317R mutation was included in the analyses. The Q317R mutation occurs in the DNA-binding domain in HOXD13, and substantially alters HOXD13 binding genome-wide (Figure S3C–E) (Ibrahim et al., 2013).
Taken together, these results suggest that repeat expansions alter the composition and biophysical properties of HOXD13-containing condensates in disease-relevant limb bud cells and transgenic cell systems, and reduce HOXD13-dependent transcriptional activity without affecting DNA binding.
HOXD13 repeat expansion alters the transcriptional program of several cell types in a cell-specific manner
The condensate unblending model predicts that repeat expansions alter the composition and properties of HOXD13-containing transcriptional condensates, which leads to deregulated gene expression programs. To comprehensively assess the impact of HOXD13 repeat expansion on gene expression in disease-relevant cells, we performed single cell RNA-Seq (scRNA-Seq) on limb buds from mouse embryos that carry either wild type or +7A repeat-expanded Hoxd13 alleles (spdh mice). In total, 9,655 single cell transcriptomes were captured, with on average >60,000 transcripts and ~3,500 genes detected per cell. The single cell transcriptomes of 4,464 wild type cells were clustered to generate a reference map of cell states in the limb bud (Figure 5A–C, S4A–C), and 4,147 spdh limb bud cells were assigned to the 11 wild type cell states (Figure 5A–C, S4A–C). These analyses revealed that +7A HOXD13 affected the abundance primarily of two cell types: interdigital mesenchymal cells were depleted, and proximal chondrocytes were enriched in the spdh limb bud (Figure 5C, S5A–C), consistent with previous observations (Kuss et al., 2009; Villavicencio-Lorini et al., 2010).
Figure 5. HOXD13 repeat expansion alters the transcriptional program of several cell types in a cell-specific manner.

(A) Scheme of the scRNA-Seq experiment strategy.
(B) Visualization of the wild-type scRNA-seq data using t-distributed Stochastic Neighbor Embedding (t-SNE).
(C) Changes in cell type composition in spdh limb buds. Displayed are the relative changes in the proportions of cells that belong to the designated clusters (i.e. cell states) between wt and spdh limb buds.
(D) Heatmap of differentially up- or downregulated genes in the spdh limb bud relative to wt within the 11 cell clusters. Arrowhead highlights the interdigital mesenchymal cells.
(E) Gene Ontology (GO) term enrichment analysis of differentially up- or downregulated genes in the spdh limb bud relative to wt within individual cell clusters.
(F) Profiles of Capture C, HOXD13 ChIP-Seq and scRNA-Seq data at the Msx1 locus. The mean expression value in spdh (red) and wt cells (blue) within each cluster are also displayed. Arrowhead highlights the expression level in interdigital mesenchymal cells, where the expression difference is the most profound.
(G) Number of HOXD13 peaks in topologically associating domains (TADs) that contain a gene dysregulated in Cluster 4. P value is from a Wilcoxon rank sum test.
(H) Mean Capture C signal around HOXD13 peaks within topologically associating domains (TADs) that contain a gene dysregulated in Cluster 4.
(I) ChIP-Seq binding profiles around the Msx2 locus.
(J) Quantification of the mean H3K27Ac signal at the nearest HOXD13 binding sites around the indicated genes within the same TAD. P value is from a Wilcoxon rank sum test.
Examination of dysregulated genes within individual cell states revealed cell type-specific changes in the transcriptional program of several cell types in the spdh limb. For example, genes associated with mesenchyme differentiation (e.g. Msx1, Msx2, Tgfb2) and digit morphogenesis (e.g. Hoxd12, Hoxd13) were downregulated in the spdh interdigital mesenchymal cells (Cluster 4; whose abundance was lower in the spdh limbs) (Figure 5D–E). On the other hand, the transcriptome profile of proximal chondrocytes (Cluster 6), did not substantially change (Figure 5D). HOXD13 ChIP-Seq in wt limbs confirmed that the topologically associating domains (TADs) containing genes dysregulated in the interdigital mesenchyme cells were significantly enriched for HOXD13 binding (p<10−5 Wilcoxon test) (Figure 5F–H, S5D–G). Capture C (chromosome conformation) data in wild type limb bud cells confirmed interactions between the HOXD13-bound elements and those genes (Figure 5F, 5H, S5D). We also performed ChIP-Rx for the transcription-associated H3K27Ac modification in wt and spdh limb buds, and found a significant reduction of H3K27Ac at the nearest HOXD13-bound sites around the genes downregulated in interdigital mesenchymal cells (p=0.03, Wilcoxon test) (Figure 5I–J). These results suggest that HOXD13 repeat expansion leads to reduced transcription of key differentiation HOXD13-target genes in interdigital mesenchymal cells associated with the synpolydactyly phenotype.
Disease-associated repeat expansions alter the phase separation capacity of other TFs
Amino acid repeat expansions in transcription factors (TFs) occur in various diseases (Figure 1A). We therefore investigated whether the phase separation capacity of other TFs may be altered by disease-associated repeat expansions.
HOXA13 is a homeobox TF involved in vertebrate limb-and urogenital tract development (Albrecht and Mundlos, 2005), and alanine repeat expansions in the HOXA13 IDR cause hand-foot genital syndrome (HFGS) (Figure 6A) (Goodman et al., 2000). The HOXA13 IDR facilitated phase separation in the optoDroplet system (Figure 6B–C, S6A–C), and HOXA13 IDR droplets exhibited liquid-like FRAP rate (Figure 6D). The HOXA13 IDR containing a short (+7A) HFGS-linked expansion tended to form aggregates with negligible FRAP rate (Figure 6B, 6D). However, a portion of the repeat-expanded HOXA13 IDR remained soluble within nuclei, and formed light-induced droplets at concentrations where the HOXA13 wt IDR did not (Figure S6D). Furthermore, the +7A expansion enhanced droplet formation of mCherry-tagged, purified HOXA13 IDR in vitro (Figure 6E–F), and lead to unblending of HOXA13 IDR from MED1-IDR co-condensates (Figure 6g–H). Last, the +7A expansion significantly reduced transcriptional activity of the HOXA13 IDR fused to a GAL4 DNA-binding domain (DBD) in a luciferase reporter system (p<10−3, two tailed t-test) (Figure 6I). These results suggest that the HOXA13 IDR can drive phase separation, and that a pathological alanine repeat expansion alters its phase separation capacity, co-condensation with the MED1 IDR, and transcriptional activity.
Figure 6. Disease-associated repeat expansions alter the phase separation capacity of other TF IDRs.

(A, J, S) Graphs plotting intrinsic disorder for HOXA13, RUNX2 and TBP. The IDRs cloned for subsequent experiments are highlighted with a purple bar.
(B, K, T) Representative images of HEK-293T nuclei expressing the indicated TF IDR-mCherry-CRY2 fusion proteins. Cells were stimulated with 488nm laser every 20s for 3 minutes.
(C, L, U) Quantification of the fraction of the nuclear area occupied by droplets of the indicated TF IDR-mCherry-CRY2 fusion proteins in HEK-293T nuclei over time. Data displayed as mean+/−SEM.
(D, M, V) Fluorescence intensity of droplets of the indicated TF IDR-mCherry-CRY2 fusion proteins before, during and after photobleaching. For the HOXA13 +7A IDR and the RUNX2 +10A IDR the spontaneously formed droplets were bleached, for all other fusion proteins the light-induced droplets were bleached. Data displayed as mean+/−SD.
(E, N) Representative images of droplet formation by purified TF IDR-mCherry fusion proteins in droplet formation buffer.
(F, O) Phase diagram of TF IDR-mCherry fusion proteins. Every dot represents a detected droplet. The inset depicts the projected average size of the droplets as mean+/− SD (middle circle: mean, inner and outer circle: SD). n.d.: not detected
(G, P) Representative images of droplet formation by purified MED1-IDR-GFP and TF IDR-mCherry fusion proteins in droplet formation buffer with 10% PEG-8000.
(H, Q) Quantification of GFP and mCherry fluorescence intensity in TF IDR-mCherry containing droplets in the indicated MED1 IDR-GFP mixing experiments. Each dot represents one droplet, and the size of the dot is proportional to the size of the droplet.
(I, R) (left): GAL4 activation assay schematic. The luciferase reporter plasmid, and the expression vector for the GAL4 DBD-TF IDR fusion proteins were transfected into HEK-293T cells. (right): Luciferase reporter activity of the indicated TF IDRs fused to GAL4-DBD. p <10−3 for both wt/mutant comparisons (Student’s t-test).
See also Figure S6.
RUNX2 is a RUNT family TF that controls bone morphogenesis, and expansions of a short alanine and glutamine repeat in the RUNX2 IDR are associated with cleidocranial dysplasia (CCD), a disorder of severe skeletal defects (Figure 6J) (Mastushita et al., 2015; Shibata et al., 2016). The RUNX2 IDR facilitated phase separation in the optoDroplet system (Figure 6K–L, S6E–G), and RUNX2 IDR droplets exhibited liquid-like FRAP rate (Figure 6M). The RUNX2 IDR containing a CCD-associated alanine expansion a (+10A) tended to form solid aggregates with negligible FRAP rate (Figure 6K, 6M). However, a portion of the repeat-expanded RUNX2 IDR remained soluble within nuclei, and formed light-induced droplets at concentrations where the RUNX2 wt IDR did not (Figure S6H). Furthermore, the +10A expansion enhanced droplet formation of mCherry-tagged, purified RUNX2 IDR in vitro (Figure 6N–O), and lead to unblending of RUNX2 IDR from MED1-IDR co-condensates (Figure 6P–Q). Last, the +10A expansion significantly reduced transcriptional activity of the RUNX2 IDR fused to a GAL4 DNA-binding domain (DBD) in a luciferase reporter system (p<10−3, two tailed t-test) (Figure 6R). These results suggest that the RUNX2 IDR can drive phase separation, and that a pathological alanine repeat expansion alters its phase separation capacity, co-condensation with the MED1 IDR, and transcriptional activity.
The TATA-box binding factor TBP is a highly conserved general transcription factor that plays a key role in transcription initiation. The TBP N-terminus contains a polymorphic polyglutamine (Q) repeat, whose typical size ranges between 25-42 glutamines, and repeats consisting of >46 glutamines are linked to spinocerebellar ataxia type 17 (SCA17), a progressive neurodegenerative disease (Figure 6S) (Nakamura et al., 2001). Fixed cell immunofluorescence revealed that TBP forms puncta in murine cells (Figure S6I). Purified recombinant TBP IDR-mCherry fusion protein formed spherical droplets whose size scaled with the concentration of the protein (Figure S6J–K). Furthermore, a TBP IDR with wild type glutamine repeat length (38Q) facilitated phase separation over the CRY2 control in the optoDroplet system (Figure 6T–U, S6L–N), and TBP IDR droplets exhibited liquid-like FRAP rate (Figure 6V). In contrast, an SCA17-associated polyglutamine repeat expansion (53Q) inhibited TBP IDR droplet formation (Figure 6T–U, S6M). These results suggest that the TBP IDR can drive phase separation, and its phase separation capacity is inhibited by pathological glutamine repeat expansion.
A catalog of human transcription factor IDRs
Transcription factors (TFs) typically consist of highly structured DNA binding domains (DBD) and intrinsically disordered activation domains (ADs/IDRs) (Lambert et al., 2018; Mitchell and Tjian, 1989; Staby et al., 2017). TF IDRs are low complexity protein sequences, several of which are known to drive phase separation (Boija et al., 2018; Chong et al., 2018). TF IDRs frequently contain homopolymeric repeats (proline, serine, alanine, glycine, glutamine, histidine), but only expansions of alanine and glutamine repeats have been linked to human pathologies to date. We thus reasoned that various molecular features of TF IDRs dictate their phase separation capacity. To gain insights into those features, we created a catalog of IDRs in ~1,500 human TFs. We first identified IDRs and DBDs in human TFs, and clustered them based on amino acid composition, hydrophobicity, aliphatic index, stability, isoelectric point and disorder. The clustering algorithm separated DBDs and IDRs with 96% efficiency (Figure S7A), and could even separate DBD families previously annotated based on structural homology (Figure S7B) (Lambert et al., 2018). The TF IDRs were broadly distributed in seven major clusters based on various features (Figure 7A, S7C–E), and as expected, were on average more disordered and less conserved than DBDs (Figure 7B–C). The IDRs in individual clusters belong to TFs from diverse DBD families, and TFs that have similar DBDs contain IDRs that belong to diverse IDR clusters. For example, 3/4 FOXP family members have a cluster 6 IDR, whereas FOXP3 has a cluster 1 IDR, and the DNA-binding specificity of these TFs is virtually identical (Figure 7A). A notable but expected exception was IDR cluster 5, which predominantly consisted of KRAB-Zinc Finger TFs (Figure 7A). Overall, TFs in diverse IDR clusters were enriched for various homopolymeric repeats, and were associated with a spectrum of biological processes, human phenotypes and disease-associated genetic variants (Figure 7A, 7D).
Figure 7. A catalog of human transcription factor IDRs.

(A) Classification of human TF IDRs. The inner circle depicts the clusters of TF IDRs. The outer circle includes the annotation of the DBDs of the TFs whose IDRs were classified in the inner circle.
(B) Boxplot of PONDR scores (disorder) of human TF DBDs and IDRs.
(C) Boxplot of phyloP scores (conservation) of human TF DBDs and IDRs
(D) Enrichment of TFs whose IDRs belong to the seven IDR clusters for the indicated sequence features, functional and phenotypic categories. Red box highlights significant enrichment (q<0.05).
(E) Representative images of HEK-293T cells expressing the indicated HOXD13 IDR-mCherry-CRY2 fusion proteins. Cells were stimulated with 488nm laser every 20s for 3 minutes.
(F) Quantification of the fraction of the nuclear area occupied by HOXD13 IDR-mCherry-CRY2 droplets in HEK-293T cells over time. Data displayed as mean+/−SEM.
(G) Plot of the nuclear area occupied by HOXD13 IDR-mCherry-CRY2 droplets versus the Alanine content and Asp/Glu content of the IDR constructs. Data displayed as mean+/−SEM.
(H) (left): GAL4 activation assay schematic. The luciferase reporter plasmid, and the expression vector for the GAL4 DBD-TF IDR fusion proteins were transfected into HEK-293T cells. (right): Luciferase reporter activity of the indicated TF IDRs fused to GAL4-DBD. P values are from a Welch’s t-test.
(I) Normalized luciferase activity of the indicated HOXA13 IDRs fused to GAL4 DBD. The blue line is a linear regression line, and the grey zones denote the 95% conference interval. P value is from a t-test.
See also Figure S7.
One key feature of cluster 1 IDRs was high alanine content (Figure S7E), and this cluster included 32 of the 33 poly-alanine -containing IDRs (p<10−16, Fisher’s exact test) (Figure 7A). We thus hypothesized that the hydrophobic alanine residues may drive the phase separation capacity of cluster 1 IDRs. To test this model, we engineered various repeat-deletion mutant (−7A, −15A) HOXD13 IDRs, an IDR in which the negatively charged residues were deleted (DEdel), and tested their phase separation capacity in the optoDroplet system (Figure 7E). Deletion of 7 and 15 alanines, which decreased hydrophobicity, inhibited droplet formation, while deletion of the negatively charged residues enhanced droplet formation by the HOXD13 IDR (Figure 7E–G, S7F–G). We then selected 10 Cluster 1 IDRs, and tested the contribution of the poly-alanines to transcriptional activity in the GAL4 DBD-luciferase system. 5/10 IDRs functioned as activators in this minimal system, and for 4/5 of the activators, deletion of the alanine repeat enhanced reporter activity (Figure 7H, S7H). Analysis of further alanine mutants revealed that the reporter activity of HOXA13 IDR negatively correlated with the number of alanines (Figure 7I). These results suggest that the alanine repeat drives homotypic phase separation of Cluster 1 IDRs, and that poly-alanine –driven TF phase separation can inhibit transactivation.
DISCUSSION
The results presented here support a model that disease-associated amino acid repeat expansions in TF IDRs alter the TFs’ phase separation capacity, and their ability to co-condense with transcriptional coactivators. For the HOXD13 TF, synpolydactyly-associated alanine repeat expansions enhanced the phase separation capacity of the HOXD13 IDR, and the mutant HOXD13 IDR was able to co-condense with dramatically less Mediator than the wild type IDR, a phenomenon we term “condensate unblending” (Figure 3K). In a mouse model of synpolydactyly, HOXD13 repeat expansion altered the co-activator content and biophysical properties of HOXD13-containing condensates, and led to cell type-specific transcriptional changes of HOXD13 target genes in disease-relevant cells. For HOXA13 and RUNX2, disease-associated alanine repeat expansions similarly enhanced homotypic phase separation and led to unblending from Mediator, while for TBP, a disease-associated glutamine repeat expansion reduced the phase separation capacity of its IDR. We propose that aberrant phase separation of TFs and unblending of transcriptional condensates may underlie human pathologies associated with mutations in the IDRs of transcriptional regulators.
Several lines of evidence indicate that altered phase separation underpins the effect of HOXD13 repeat expansions. The saturation concentration Csat (at which condensates are observed) is lower for purified mutant HOXD13 IDRs than the wt IDR (Figure 2G–H), and the mutations enhance condensate formation in the optoDroplet system (Figure 2C–D). The lower Csat of mutant HOXD13 IDRs is in turn associated with an increase in TF IDR content and reduced MED1 IDR content of heterotypic co-condensates in vitro (Figure 3A–F), and reduced co-activator-HOXD13 association in vivo (Figure 4A–B). This effect is consistent with recent reports that heterotypic interactions dominate phase separation of endogenous condensates, and that Csat of heterotypic condensates can be modulated by physico-chemical properties of their components (Choi et al., 2019; Riback et al., 2019). Furthermore, the condensate unblending model may help explain why the (+7A) repeat expanded Hoxd13 allele is genetically a dominant negative allele (Albrecht and Mundlos, 2005; Villavicencio-Lorini et al., 2010), why the phenotype of repeat expansions is distinct from the phenotype of HOXD13 deactivating mutations (Bruneau et al., 2001; Dolle et al., 1993), and why the length of the repeat expansion correlates with disease severity (Goodman et al., 1997).
Repeat expansion diseases include severe, incurable neurodegenerative and developmental diseases typically associated with the presence of large protein aggregates (Albrecht and Mundlos, 2005; Orr and Zoghbi, 2007; Zoghbi and Orr, 2000). The condensate model presented here may explain several observations of the pathology of repeat expansion diseases that are less readily explained by toxicity of aggregates. For example, for poly-alanine expansions that occur in TFs, aggregates or nuclear inclusions were only described in overexpression systems but not in primary tissue to date (Albrecht et al., 2004; Villavicencio-Lorini et al., 2010). Furthermore, the short +7A repeat expansion of HOXD13 recapitulates the human synpolydactyly phenotype in mice, yet without any evidence of protein aggregation in the limb bud (Albrecht et al., 2004; Villavicencio-Lorini et al., 2010). For polyglutamine expansion diseases, e.g. Huntington’s disease, previous studies have established a correlation between aggregate formation by the mutant huntingtin (HTT) protein and degeneration of specific neurons (Davies et al., 1997; Ross and Poirier, 2004). However, manipulation of the Ubiquitin-proteasome pathway was reported to decrease aggregate formation without decreasing toxicity of the repeat-expanded HTT protein in primary cell models, suggesting that the soluble fraction of the protein may be responsible for its cytotoxic effects (Saudou et al., 1998; Truant et al., 2008). Changes in the phase separation capacity, and miscibility of the repeat expanded proteins in heterotypic condensates are consistent with these diverse observations.
Disease-associated repeat expansions occur not just in transcription factors, but in other nuclear proteins e.g. ataxin genes, several of which have been linked to chromatin regulation and transcription (Darling and Uversky, 2017; La Spada and Taylor, 2010; Orr and Zoghbi, 2007). It is thus plausible that disease-associated changes may alter the phase separation capacity and miscibility of various nuclear proteins within heterotypic condensates, which in turn perturbs cellular gene expression programs. Mutations in the IDR of cellular proteins, and repeat expansions in RNA have indeed been recently linked to altered phase separation (Jain and Vale, 2017; Meyer et al., 2018; Molliex et al., 2015; Patel et al., 2015). Dysregulated phase separation may thus underlie a wide spectrum of diseases.
The results presented here also provide insights into the function of TF activation domains (ADs). TF ADs are typically intrinsically disordered sequences that interact with components of the transcription machinery, and recent studies suggest that various TF ADs (i.e. IDRs) have the capacity to phase separate and to co-condense with the Mediator co-activator in vitro, though the functional importance of these observations has been unclear (Boija et al., 2018; Chong et al., 2018). The results presented here provide evidence for the importance of biochemical characteristics that drive TF phase separation for normal TF function in vivo.
Eukaryotic genomes tend to encode hundreds of TFs, whose ADs have limited sequence-level similarity, but many ADs are nevertheless functionally interchangeable (Lambert et al., 2018; Mitchell and Tjian, 1989; Staby et al., 2017; Stampfel et al., 2015). A key outstanding question is whether the interchangeability of TF IDRs is determined by their phase separation capacity, and whether the phase separation capacity of interchangeable TF IDRs has a shared molecular basis. The phase separation of the IDR of the FUS RNA-binding protein, for example, is predominantly driven by cation-pi interactions between tyrosine and arginine residues (Wang et al., 2018), while the phase separation capacity of the OCT4 and GCN4 TFs’ IDRs is predominantly driven by negatively charged residues (Boija et al., 2018). Our draft catalog of human TF IDRs indicates that at least for a subset of TFs, their phase separation may be driven by alanine residues, and that different TF IDR clusters correlate with various biological functions and phenotypic effects. Future work into the molecular basis of TF phase separation, and how developmental signaling, post-translational modifications and genetic variants impact the miscibility of TFs in heterotypic condensates with components of the transcriptional machinery may thus open new condensate-directed therapeutic avenues for diseases associated with transcriptional dysregulation.
STAR METHODS
RESOURCE AVAILABILITY
Lead Contact
Further information and requests for resources and reagents should be directed to the Lead Contact, Denes Hnisz (hnisz@molgen.mpg.de).
Materials Availability
All unique reagents generated in this study are available from the Lead Contact with a completed Materials Transfer Agreement. Plasmids generated in the study were deposited at Addgene, and are available at www.addgene.org.
Data and Code Availability
All next generation sequencing data generated in the study were deposited at the Gene Expression Omnibus (GEO) under the accession number GSE128818.
Original data including all raw microscopy images were deposited at Mendeley Data (https://data.mendeley.com/) under doi: 10.17632/ztd6wzcv7h.1
Code supporting the study were deposited at Github (https://github.com/hniszlab/hoxd13). Code for droplet visualization is available at https://github.com/BasuShaon/ChemicalBiology.
EXPERIMENTAL MODEL AND SUBJECT DETAILS
Cell culture
HEK-293T, Kelly, SH-SY5Y, U2OS-2-6-3, and Cos7 cells were cultured in DMEM with GlutaMAX (ThermoFisher Scientific, 10566-016) supplemented with 10% FBS (Sigma Aldrich, F4135), and 100 U/mL penicillin-streptomycin (Gibco, 15140), at 37°C with 5% CO2 in a humidified incubator. Cells were negative for mycoplasma.
Animal model
All animal procedures were conducted in the animal facility of the MPIMG, and were approved by the local authorities (LAGeSo Berlin) under the license number #ZH-120. Mice were monitored daily for food and water intake, and animals were inspected by the Chair of the Animal Welfare and Research Committee and the head of the Animal Facility. For staged matings, females were controlled for vaginal plugs each morning and, if positive, counted as 0.5 days post coitum (dpc). For analysis of E12.5 embryos, females were sacrificed at 12.5 dpc and the embryos were analyzed. Animals of both sexes were used in the analyses.
METHOD DETAILS
Experimental design
All experiments except the scRNA-Seq and ChIP-Seq were replicated. The specific number of replicates for each experiment is noted below. No aspect of the study was done blinded. Sample size was not predetermined and no outliers were excluded.
Construct generation
OptoIDR constructs used in this study were derived from the pHR-mCherry-CRY2WT plasmid (Addgene, 101221) described in (Shin et al., 2017). To generate pHR-mCherry-CRY2-NLS, the SV40 NLS was ordered as a primer pair (Sigma), annealed, and ligated into the pHR-mCherry-CRY2 plasmid using NotI and SbfI restriction sites. To generate optoIDR constructs, sequences encoding the IDRs for HOXD13wt, HOXD13-7A, HOXD13-15A, HOXD13 DEdel, HOXA13wt, HOXA13+7A, TBP 38Q, TBP 53Q, RUNX2wt, RUNX2+10A were ordered as synthetic DNA from commercial vendors (Genewiz and IDT). IDR sequences were flanked by AscI and NdeI restriction sites for cloning, and SpeI and BsiWI sites in the case of RUNX2wt and RUNX2+10A. The IDR-encoding DNA fragments were then ligated into pHR-mCherry-CRY2WT or pHR-mCherry-CRY2-NLS using AscI and NdeI restrictions sites. In the case of RUNX2, a multiple cloning site (MCS) was introduced into pHR-mCherry-CRY2-NLS via AscI and NdeI to produce pHR-MCS-mCherry-CRY2-NLS and the RUNX2 constructs were subcloned via SpeI and BsiWI restriction sites. For insertion of the alanine expansions +7A, +8A, +9A and +14A single stranded oligonucleotides encoding the respective alanine expansions were inserted into the alanine stretch of pHR-HOXD13-IDR-mCherry-CRY2-NLS using NotI cleavage and Gibson assembly (NEB E2521). This pipeline was used to generate pHR-HOXD13(+7A)-IDR-mCherry-CRY2-NLS, pHR-HOXD13(+8A)-IDR-mCherry-CRY2-NLS, pHR-HOXD13(+9A)-IDR-CRY2-NLS and pHR-HOXD13(+14A)-IDR-CRY2-NLS. [In addition, the +10A expansion was inserted into the alanine stretch of pHR-HOXD13-IDR-mCherry-CRY2 to create pHR-HOXD13(+10A)-IDR-mCherry-CRY2 that was used to sublcone the HOXD13(+10A) fragment for protein expression and LacI-tethering experiments.]
SV40 NLS forward primer:
/5Phos/GG CCG GAA CTC CCA CCT GCA ACA TGC GTG ACG GAG GCG GTC CAA AAA AGA AGA GAA AGG TAT GAC TGA GGC CGC GAC TCT AGA GTC GAC CTG CA
SV40 NLS reverse primer:
/5Phos/GG TCG ACT CTA GAG TCG CGG CCT CAG TCA TAC CTT TCT CTT CTT TTT TGG ACC GCC TCC GTC ACG CAT GTT GCA GGT GGG AGT TCC
+7A oligonucleotide for Gibson assembly:
GCGGCTGCTGCTGCTGCTGCAGCCGCGGCGgcagctgcagctgcggccgctGCCGCTAGTGGATTTGCCTATCCTGGGACGAG
+8A oligonucleotide for Gibson assembly:
GCGGCTGCTGCTGCTGCTGCAGCCGCGGCGgcagctgcagctgcggccgcagctGCCGCTAGTGGATTTGCCTATCCTGGGACGAG
+9A oligonucleotide for Gibson assembly:
GCGGCTGCTGCTGCTGCTGCAGCCGCGGCGgcagctgcagctgcggccgcagcagctGCCGCTAGTGGATTTGCCTATCCTGGGACGAG
+10A oligonucleotide for Gibson assembly:
GCGGCTGCTGCTGCTGCTGCAGCCGCGGCGgcagcagctgcagctgcggccgcagcagctGCCGCTAGTGGATTTGCCTATCCTGGGACGAG
+14A oligonucleotide for Gibson assembly:
GCGGCTGCTGCTGCTGCTGCAGCCGCGGCGgcagcagctgcagcggctgctgcagctgcggccgcagcagctGCCGCTAGTGGATTTGCCTATCCTGGGACGAG
HOXD13 wt gene fragment:
cgagctctataaaagagctcacaacccctcactcggcgcgccagtcctccgacagactgagtcgcccgggggggatctggagctctcgagaattctcacgcgtcaagtggagcaaggcaggtggacagtggatccggagctaccATGTCCCGAGCCGGTAGCTGGGACATGGACGGCCTGCGAGCGGACGGAGGCGGAGCTGGAGGAGCTCCCGCATCAAGTAGTAGCTCAAGTGTGGCCGCTGCCGCGGCTAGCGGACAATGTAGGGGGTTTTTGTCAGCGCCTGTCTTTGCGGGCACACATTCCGGGAGGGCCGCTGCTGCGGCTGCTGCTGCTGCTGCAGCCGCGGCGGCCGCTAGTGGATTTGCCTATCCTGGGACGAGTGAGCGCACTGGTTCATCATCCTCATCTTCATCCAGTGCGGTAGTCGCCGCTCGGCCAGAAGCACCACCTGCAAAAGAGTGTCCGGCCCCGACGCCAGCTGCAGCAGCAGCGGCACCGCCTTCAGCTCCTGCGggtaccGGAGGCGGGATGGTTTCCAAAGGAGAGGAGGATAATATGGCTATAATTAAAGAGTTTATGCGGTTCAAGgtgcatatgGAGGGCTCCGTAAACGGTCATGAGTTC
HOXD13 −7A gene fragment:
ctcactcggcgcgccagtcctccgacagactgagtcgcccgggggggatctggagctctcgagaattctcacgcgtcaagtggagcaaggcaggtggacagtggatccggagctaccATGTCCCGAGCCGGTAGCTGGGACATGGACGGCCTGCGAGCGGACGGAGGCGGAGCTGGAGGAGCTCCCGCATCAAGTAGTAGCTCAAGTGTGGCCGCTGCCGCGGCTAGCGGACAATGTAGGGGGTTTTTGTCAGCGCCTGTCTTTGCGGGCACACATTCCGGGAGGGCCGCTGCTGCGGCTGCTGCTGCTAGTGGATTTGCCTATCCTGGGACGAGTGAGCGCACTGGTTCATCATCCTCATCTTCATCCAGTGCGGTAGTCGCCGCTCGGCCAGAAGCACCACCTGCAAAAGAGTGTCCGGCCCCGACGCCAGCTGCAGCAGCAGCGGCACCGCCTTCAGCTCCTGCGggtaccGGAGGCGGGATGGTTTCCAAAGGAGAGGAGGATAATATGGCTATAATTAAAGAGTTTATGCGGTTCAAGgtgcatatggagggatctg
HOXD13 −15A gene fragment:
cgagctctataaaagagctcacaacccctcactcggcgcgccagtcctccgacagactgagtcgcccgggggggatctggagctctcgagaattctcacgcgtcaagtggagcaaggcaggtggacagtggatccggagctaccATGTCCCGAGCCGGTAGCTGGGACATGGACGGCCTGCGAGCGGACGGAGGCGGAGCTGGAGGAGCTCCCGCATCAAGTAGTAGCTCAAGTGTGGCCGCTGCCGCGGCTAGCGGACAATGTAGGGGGTTTTTGTCAGCGCCTGTCTTTGCGGGCACACATTCCGGGAGGAGTGGATTTGCCTATCCTGGGACGAGTGAGCGCACTGGTTCATCATCCTCATCTTCATCCAGTGCGGTAGTCGCCGCTCGGCCAGAAGCACCACCTGCAAAAGAGTGTCCGGCCCCGACGCCAGCTGCAGCAGCAGCGGCACCGCCTTCAGCTCCTGCGggtaccGGAGGCGGGATGGTTTCCAAAGGAGAGGAGGATAATATGGCTATAATTAAAGAGTTTATGCGGTTCAAGgtgcatatgGAGGGCTCCGTAAACGGTCATGAGTTC
HOXD13 DEdel gene fragment:
cgagctctataaaagagctcacaacccctcactcggcgcgccagtcctccgacagactgagtcgcccgggggggatctggagctctcgagaattctcacgcgtcaagtggagcaaggcaggtggacagtggatccggagctaccATGTCCCGAGCCGGTAGCTGGATGGGCCTGCGAGCGGGAGGCGGAGCTGGAGGAGCTCCCGCATCAAGTAGTAGCTCAAGTGTGGCCGCTGCCGCGGCTAGCGGACAATGTAGGGGGTTTTTGTCAGCGCCTGTCTTTGCGGGCACACATTCCGGGAGGGCCGCTGCTGCGGCTGCTGCTGCTGCTGCAGCCGCGGCGGCCGCTAGTGGATTTGCCTATCCTGGGACGAGTCGCACTGGTTCATCATCCTCATCTTCATCCAGTGCGGTAGTCGCCGCTCGGCCAGCACCACCTGCAAAATGTCCGGCCCCGACGCCAGCTGCAGCAGCAGCGGCACCGCCTTCAGCTCCTGCGggtaccGGAGGCGGGATGGTTTCCAAAGGAGAGGAGGATAATATGGCTATAATTAAAGAGTTTATGCGGTTCAAGgtgcatatggagggctccgtaaacggtcatgagttc
HOXA13 wt gene fragment:
cgagctctataaaagagctcacaacccctcactcggcgcgccagtcctccgacagactgagtcgcccgggggggatctggagctctcgagaattctcacgcgtcaagtggagcaaggcaggtggacagtggatccggagctaccATGGAGTTGAACAAAAACATGGAGGGGGCGGCTGCGGCTGCAGCCGCGGCAGCGGCTGCAGCGGCTGCAGGAGCCGGTGGAGGAGGTTTTCCCCATCCGGCGGCGGCTGCCGCGGGGGGGAATTTCAGTGTTGCGGCAGCTGCAGCAGCTGCAGCTGCTGCCGCAGCTAACCAGTGCCGCAACCTGATGGCGCATCCAGCGCCTCTTGCGCCGGGGGCCGCATCAGCGTACAGTTCTGCTCCTGGGGAAGCACCCCCGTCCGCGGCTGCTGCCGCGGCAGCGGCAGCAGCAGCCGCGGCTGCGGCCGCGGCAGCTAGCTCCAGTGGAGGTCCCGGACCAGCGGGACCTGCTGGTGCGGAAGCCGCGAAGCAGTGTAGCCCGTGCAGCGCGGCAGCTCAGAGCTCATCCGGTCCCGCCGCCCTCCCATACGGATACTTTGGCTCAGGGTACTACCCGTGCGCGAGAATGGGCCCTCACCCCAACGCCATAAAGTCATGTGCCCAACCCGCGTCAGCCGCAGCGGCAGCAGCTTTTGCCGATAAGTACATGGACACTGCTGGCCCCGCGGCGGAGGAGTTCAGTAGCAGGGCGAAGGAGggtaccggaggcgggatggtttccaaaggagaggaggataatatggctataattaaagagtttatgcggttcaaggtgcatatggagggctccgtaaacggtcatgagttc
HOXA13 +7A gene fragment:
gctcacaacccctcactcggcgcgccagtcctccgacagactgagtcgcccgggggggatctggagctctcgagaattctcacgcgtcaagtggagcaaggcaggtggacagtggatccggagctaccATGGAGTTGAACAAAAACATGGAGGGGGCGGCTGCGGCTGCAGCCGCGGCAGCGGCTGCAGCGGCTGCAGGAGCCGGTGGAGGAGGTTTTCCCCATCCGGCGGCGGCTGCCGCGGGGGGGAATTTCAGTGTTGCGGCAGCTGCAGCAGCTGCAGCTGCTGCCGCAGCTAACCAGTGCCGCAACCTGATGGCGCATCCAGCGCCTCTTGCGCCGGGGGCCGCATCAGCGTACAGTTCTGCTCCTGGGGAAGCACCCCCGTCCGCGGCTGCTGCCGCGGCAGCGGCAGCAGCAGCCGCGGCTGCGgcagctgcagctgcggccgctGCCGCGGCAGCTAGCTCCAGTGGAGGTCCCGGACCAGCGGGACCTGCTGGTGCGGAAGCCGCGAAGCAGTGTAGCCCGTGCAGCGCGGCAGCTCAGAGCTCATCCGGTCCCGCCGCCCTCCCATACGGATACTTTGGCTCAGGGTACTACCCGTGCGCGAGAATGGGCCCTCACCCCAACGCCATAAAGTCATGTGCCCAACCCGCGTCAGCCGCAGCGGCAGCAGCTTTTGCCGATAAGTACATGGACACTGCTGGCCCCGCGGCGGAGGAGTTCAGTAGCAGGGCGAAGGAGggtaccggaggcgggatggtttccaaaggagaggaggataatatggctataattaaagagtttatgcggttcaaggtgcatatggagggatctgtgaacggtcacgagt
TBP 38Q gene fragment:
aaagagctcacaacccctcactcggcgcgccagtcctccgacagactgagtcgcccgggggggatctggagctctcgagaattctcacgcgtcaagtggagcaaggcaggtggacagtggatccggagctaccATGGATCAGAACAACAGCCTGCCACCTTACGCTCAGGGCTTGGCCTCCCCTCAGGGTGCCATGACTCCCGGAATCCCTATCTTTAGTCCAATGATGCCTTATGGCACTGGACTGACCCCACAGCCTATTCAGAACACCAATAGTCTGTCTATTTTGGAAGAGCAACAAAGGCAGCAGCAGCAACAACAACAGCAGCAGCAGCAGCAGCAGCAGCAACAGCAACAGCAGCAGCAGCAGCAGCAGCAGCAGCAGCAGCAGCAGCAGCAGCAGCAGCAGCAGCAACAGGCAGTGGCAGCTGCAGCCGTTCAGCAGTCAACGTCCCAGCAGGCAACACAGGGAACCTCAGGCCAGGCACCACAGCTCTTCCACTCACAGACTCTCACAACTGCACCCTTGCCGGGCACCACTCCACTGTATCCCTCCCCCATGACTCCCATGACCCCCATCACTCCTGCCACGCCAGCTTCGGAGAGTTCTGGGggtaccGGAGGCGGGATGGTTTCCAAAGGAGAGGAGGATAATATGGCTATAATTAAAGAGTTTATGCGGTTCAAGgtgcatatggagggatctgtgaac
TBP 53Q gene fragment:
acccctcactcggcgcgccagtcctccgacagactgagtcgcccgggggggatctggagctctcgagaattctcacgcgtcaagtggagcaaggcaggtggacagtggatccggagctaccATGGATCAGAACAACAGCCTGCCACCTTACGCTCAGGGCTTGGCCTCCCCTCAGGGTGCCATGACTCCCGGAATCCCTATCTTTAGTCCAATGATGCCTATGGCACTGGACTGACCCCACAGCCTATTCAGAACACCAATAGTCTGTCTATTTTGGAAGAGCAACAAAGGCAGCAGCAGCAACAACAACAGCAGCAGCAGCAGCAGCAGCAGCAACAGCAACAGCAGCAGCAGCAGCAGCAGCAGCAGCAGCAGCAGCAGCAGCAGCAGCAGCAGCAGCAACAGCAACAGCAACAGCAGCAGCAGCAACAGCAGCAGCAGCAGCAACAGGCAGTGGCAGCTGCAGCCGTTCAGCAGTCAACGTCCCAGCAGGCAACACAGGGAACCTCAGGCCAGGCACCACAGCTCTTCCACTCACAGACTCTCACAACTGCACCCTTGCCGGGCACCACTCCACTGTATCCCTCCCCCATGACTCCCATGACCCCCATCACTCCTGCCACGCCAGCTTCGGAGAGTTCTGGGggtaccGGAGGCGGGATGGTTTCCAAAGGAGAGGAGGATAATATGGCTATAATTAAAGAGTTTATGCGGTTCAAGgtgcatatggagggatctg
RUNX2 wt gene fragment:
gcaaggcaggACTAGTGCCACCATGGCATCAAACAGCCTCTTCAGCACAGTGACACCATGTCAGCAAAACTTCTTTTGGGATCCGAGCACCAGCCGGCGCTTCAGCCCCCCCTCCAGCAGCCTGCAGCCCGGCAAAATGAGCGACGTGAGCCCGGTGGTGGCTGCGCAACAGCAGCAGCAACAGCAGCAGCAGCAACAGCAGCAGCAGCAGCAGCAACAGCAGCAGCAGCAGCAGGAGGCGGCGGCGGCCGCTGCGGCGGCGGCGGCGGCTGCGGCGGCGGCAGCTGCAGTGCCCCGGTTACGGCCGCCCCACGACAACCGCACCATGGTGGAGACGTACGaagccaggc
RUNX2 +10A gene fragment:
gcaaggcaggACTAGTGCCACCATGGCATCAAACAGCCTCTTCAGCACAGTGACACCATGTCAGCAAAACTTCTTTTGGGATCCGAGCACCAGCCGGCGCTTCAGCCCCCCCTCCAGCAGCCTGCAGCCCGGCAAAATGAGCGACGTGAGCCCGGTGGTGGCTGCGCAACAGCAGCAGCAACAGCAGCAGCAGCAACAGCAGCAGCAGCAGCAGCAACAGCAGCAGCAGCAGCAGGAGGCGGCGGCAGCCGCGGCTGCCGCAGCGGCTGCAGCGGCGGCGGCTGCGGCGGCGGCGGCGGCTGCGGCGGCGGCAGCTGCAGTGCCCCGGTTGCGGCCGCCCCACGACAACCGCACCATGGTGGAGACGTACGaagccaggc
Multiple cloning site (MCS) gene fragment:
tcaagtcacgGGCGCGCCAGTCCTCCGACAGACTGAGTCGCCCGGGaagagaggccACTAGTcgcgaccacgCGCCGGCGggacgagacGCGATCGCggacggcaaCGTACGgggtctggctcgtcgggtccATGGTTTCCAAAGGAGAGGAGGATAATATGGCTATAATTAAAGAGTTTATGCGGTTCAAGGTGCATATGcggaggcagg
For the generation of IDR-YFP constructs, a YFP fragment was first PCR amplified from an mCitrine vector, and cloned into the pHR-mCherry-CRY2-NLS plasmid using BlpI and NdeI restrictions sites, to generate pHR-YFP-NLS. HOXD13(wt)-IDR and HOXD13(+7A)-IDRs were subcloned from optoIDR vectors into the pHR-YFP-NLS plasmid, to generate pHR-HOXD13-IDR-YFP-NLS and pHR-HOXD13(+7A)-IDR-YFP-NLS using AscI and NdeI restrictions sites. For the generation of pHR-MED1trunc-IDR-YFP-NLS, the MED1-IDR was PCR amplified from a MED1 IDR expression vector (Boija et al., 2018; Sabari et al., 2018), and subcloned into pHR-YFP-NLS using AscI and NdeI restriction sites. To generate pHR-MCS-MED1long-IDR-YFP-NLS, a multiple cloning site was introduced into pHR-YFP-NLS via AscI and NdeI sites to generate pHR-MCS-YFP-NLS. The MED1-IDR was then PCR amplified from a MED1 IDR expression vector (Boija et al., 2018; Sabari et al., 2018), and ligated into pHR-MCS-YFP-NLS using the AsiSI and BsiWI restriction sites. pHR-MED1trunc-IDR-YFP-NLS was used for exclusion microscopy with OptoIDR constructs (Figure S2D–E), and pHR-MCS-MED1long-IDR-YFP-NLS was used for LacI tethering experiments (Figure 4E–F).
mEYFP forward primer:
tgaggttcaaggtgcatatgGTGAGCAAGGGCGAGGAGC
mEYFP reverse primer:
aggtgggagttgcggccgctcatacctttctcttcttttttggaccgcctccCTTGTACAGCTCGTCCATGC
MED1trunc-IDR forward primer:
cacaacccctcactcggcgcgccagtcctccgacagactgagtcgcccgggggggatctgGAGCATCACAGTGGTAGTCAGGG
MED1trunc-IDR reverse primer:
gcgaggaggataacaATTAATtcctccgctacctccAAGATCATCATCTTCCTCCCCAATC
Multiple cloning site (MCS) for YFP gene fragment:
tcaagtcacgGGCGCGCCAGTCCTCCGACAGACTGAGTCGCCCGGGaagagaggccACTAGTcgcgaccacgCGCCGGCGggacgagacGCGATCGCggacggcaaCGTACGggttctggctcgtcggttccCATATGtcacgtcagt
MCS-MED1long-IDR forward primer:
gaggccGCGATCGCgagctaccatgGAGCATCACAGTGGTAGTCAGGG
MCS-MED1long-IDR reverse primer:
gcgaggaggataacacgtacgctccgctacctccAAGATCATCATCTTCCTCCCCAATC
For the generation plasmids for the expression of recombinant proteins, pET-45b(+) was ordered from Novagen (Sigma Cat No. 71327). Gene fragments encoding IDRs tagged with mCherry were PCR amplified from pHR-IDR-mCherry-CRY2 vectors (described above) using Q5 polymerase (NEB M0494S), and ligated into pET-45b(+) using AgeI and HindIII restriction sites. This pipeline was used to generate pET-45b-HOXD13-IDR-mCherry, pET-45b-HOXD13(+7A)-IDR-mCherry, pET-45b-HOXD13(+10A)-IDR-mCherry, pET-45b-HOXA13(WT)-IDR-mCherry, pET-45b-RUNX2(WT)-IDR-mCherry, pET-45b-RUNX2(+10A)-IDR-mCherry, pET-45b-HOXA13(+7A)-IDR-mCherry, and pET-45b-TBP38Q-IDR-mCherry. For PCR amplification of RUNX2, a modified forward primer was used to anneal downstream of the MCS in the pHR-RUNX2-IDR-mCherry-CRY2 vectors (see below). To create pET-45b-mCherry, the IDR region of pET-45b-HOXD13-IDR-mCherry was excised using KpnI and the backbone (containing mCherry) was religated.
IDR-mCherry forward primer:
taccggtgacagtggatccggagctac
RUNX2 IDR-mCherry forward primer:
taccggtGGaagagaggccACTAGTGC
IDR-mCherry reverse primer:
cgcaagcttcttgtacaattcatccatgc
In the GAL4-DBD luciferase system, GAL4 DBD-IDR fusion constructs were expressed from a backbone of GAL4-DBD expression vector [GI-GAL4-DBD (Addgene 42500)], from which GI-GAL4 sequence was removed with EcoRI and XbaI digestion. GAL4-DBD was PCR amplified from pCAG-GAL4-DBD-GBP2 vector (Addgene 49439) while introducing a short multiple cloning site C-terminal to GAL4-DBD allowing IDR cloning. Synthetic DNA fragments for wt and alanine repeat-deletion IDRs of GSX2, HOXD11, TBX1, EOMES, BHLHE41, and MNX1 sequences were flanked by AsiSI and BsiWI sequences for cloning, and purchased from Genewiz. For HEY2 and OLIG2, wt IDR sequences were PCR amplified from human iPSC gDNA and alanine repeat-deletion sequences were ordered from Genewiz. For HOXA13 and HOXD13, IDR sequences were PCR amplified from previously described vectors, except HOXA13 −44A and −58A deletion sequences were ordered from Genewiz. The HOXA13 −15A construct lacks alanines 88-103. In case of RUNX2, sequences were cloned from optoIDR constructs with SpeI and BsiWI restriction enzymes and inserted into the GAL4-DBD vector with a longer multiple cloning site with NheI and BsiWI restriction sites.
GAL4-DBD fw primer:
GATCGAATTCATGAAGCTACTGTCTTCTATCGAACAAGCA
GAL4-DBD (short MCS) rev primer:
GATCTCTAGACGTACGACCGGTGCTAGCGATCGCCGATACAGTCAACTGTCTTTGACCTTTGTT
GAL4-DBD (long MCS) rev primer:
GATCTCTAGACTTAAGCGTACGACCGGTGCGGCCGCTAGCGATCGCCGATACAGTCAACTGTCTTTGACCTTTGTT
OLIG2 fw primer:
GATCGCGATCGCTTTCCACCCGTCGGCCTGCG
OLIG2 rev primer:
GATCCGTACGTCACTTGGCGTCGGAGGTGAGG
HEY2 fw primer:
GATCGCGATCGCTCATCTCAGCACTTGCGCCACCC
HEY2 rev primer:
GATCCGTACGTTAAAAAGCTCCAACTTCTGTCCCCCAG
GSX2 wt sequence:
GCGATCGCTTCGCGCTCCTTCTATGTCGACTCGCTCATCATAAAGGATACATCCCGCCCGGCCCCGTCTCTCCCCGAACCTCACCCTGGTCCCGATTTTTTTATACCCTTGGGAATGCCTCCGCCCTTGGTCATGTCCGTGTCTGGTCCCGGGTGCCCGAGTAGGAAGAGTGGTGCCTTTTGTGTTTGCCCGTTGTGTGTCACATCCCATCTGCATAGTTCTAGAGGCAGTGTAGGTGCGGGTTCAGGCGGTGCAGGTGCAGGTGTAACTGGAGCAGGGGGATCAGGCGTGGCGGGGGCAGCCGGGGCTCTGCCGTTGCTCAAGGGTCAGTTCAGTAGCGCTCCGGGTGATGCCCAATTTTGTCCGAGAGTAAATCACGCGCACCATCATCACCATCCCCCGCAACACCACCACCACCATCATCAACCACAACAGCCTGGATCAGCGGCCGCCGCAGCGGCAGCTGCGGCCGCAGCGGCTGCTGCTGCCGCGCTTGGACATCCACAACATCACGCTCCGGTATGCACCGCTACCTGACGTACG
GSX2 Ala-del sequence:
GCGATCGCTTCGCGCTCCTTCTATGTCGACTCGCTCATCATCAAGGACACCTCACGGCCTGCGCCCTCGCTGCCTGAACCTCACCCCGGACCAGACTTCTTTATACCACTCGGGATGCCACCACCTCTCGTTATGTCTGTGTCAGGCCCCGGCTGCCCGTCCCGCAAGAGCGGCGCGTTCTGCGTGTGCCCTCTCTGCGTCACTTCGCATCTGCACTCCTCTAGGGGGAGTGTTGGTGCTGGATCTGGTGGAGCTGGTGCCGGTGTTACTGGAGCTGGGGGTTCAGGGGTAGCGGGAGCAGCGGGTGCTCTTCCTCTCCTTAAAGGTCAGTTCTCTTCGGCTCCTGGGGACGCGCAGTTTTGCCCGCGGGTGAACCATGCGCATCATCATCACCATCCTCCGCAGCACCACCATCACCATCATCAGCCACAACAACCAGGTTCATTGGGACATCCACAACACCACGCACCCGTATGTACAGCTACCTGACGTACG
HOXD11 wt sequence:
GCGATCGCTCTGGAACGCGCTAAGTGGCCCTACAGAGGAGGCGGAGGTGGGGGATCAGCTGGCGGAGGGAGCTCAGGAGGCGGACCAGGTGGCGGTGGTGGTGGCGCGGGTGGGTACGCACCCTATTACGAAGAGGCAGCTATGCAGCGGGAGTTGCTTCCACCAGCTGGGCGCCGACCCGATGTTCTGTTTAAGGCTCCAGAACCCGTATGCGCTGCGCCGGGACCCCCGCACGGTCCCGCCGGGGCGGCTAGTAACTTCTACTCTGCAGTGGGCCGCAACGGTATTTTGCCGCAAGGTTTTGATCAGTTTTACGAAGCAGCGCCCGGACCTCCATTTGCGGGCCCGCAACCGCCACCACCTCCTGCTCCTCCACAACCAGAAGGTGCCGCTGACAAGGGTGACCCTAGGACAGGTGCTGGTGGCGGCGGTGGCTCACCTTGTACGAAGGCAACGCCCGGTTCTGAGCCCAAAGGTGCAGCGGAAGGTAGCGGCGGAGACGGTGAAGGGCCACCTGGTGAGGCGGGAGCCGAGAAGAGTTCTTCAGCGGTAGCTCCACAACGGTCTCGCAAGAAGCGGTGCCCATATACCAAGTACTGACGTACG
HOXD11 Ala-del sequence:
GCGATCGCTCTGGAACGCGCTAAGTGGCCCTACAGAGGAGGCGGAGGTGGGGGATCAGCTGGCGGAGGGAGCTCAGGAGGCGGACCAGGTGGCGGTGGTGGTGGCGCGGGTGGGTACGCACCCTATTACGAAGAGGCAGCTATGCAGCGGGAGTTGCTTCCACCAGCTGGGCGCCGACCCGATGTTCTGTTTAAGGCTCCAGAACCCGTATGCGCTGCGCCGGGACCCCCGCACGGTCCCGCCGGGGCGGCTAGTAACTTCTACTCTGCAGTGGGCCGCAACGGTATTTTGCCGCAAGGTTTTGATCAGTTTTACGAAGCAGCGCCCGGACCTCCATTTGCGGGCCCGCAACCGCCACCACCTCCTGCTCCTCCACAACCAGAAGGTGCCGCTGACAAGGGTGACCCTAGGACAGGTGCTGGTGGCGGCGGTGGCTCACCTTGTACGAAGGCAACGCCCGGTTCTGAGCCCAAAGGTGCAGCGGAAGGTAGCGGCGGAGACGGTGAAGGGCCACCTGGTGAGGCGGGAGCCGAGAAGAGTTCTTCAGCGGTAGCTCCACAACGGTCTCGCAAGAAGCGGTGCCCATATACCAAGTACTGACGTACG
TBX1 wt sequence:
GCGATCGCTGACCCGGAAGACTGGCCTCGAAACCACCGGCCAGGAGCACTCCCGCTGATGTCCGCTTTCGCGCGGTCTAGGAATCCCGTAGCTTCCCCTACGCAACCTTCCGGCACCGAGAAAGATGCAGCAGAGGCACGCCGGGAGTTCCAGCGGGACGCAGGAGGGCCCGCTGTTCTCGGAGATCCGGCTCATCCGCCACAACTTCTTGCTAGGGTATTGTCTCCTAGTTTGCCTGGGGCAGGAGGTGCTGGCGGCCTGGTGCCTCTCCCAGGAGCCCCAGGTGGGAGACCATCCCCCCCAAATCCAGAGCTGCGATTGGAAGCGCCCGGGGCTTCTGAACCTTTGCACCACCATCCATACAAATACCCAGCTGCTGCATATGATCACTACCTTGGGGCAAAAAGTAGACCGGCACCGTACCCCCTGCCCGGACTGCGGGGGCACGGATACCATCCTCACGCGCACCCACATCATCATCACCATCCCGTTAGTCCGGCAGCGGCCGCTGCAGCTGCTGCGGCTGCCGCAGCCGCTGCTGCAAACATGTACAGCAGCGCTGGAGCAGCTCCTCCCGGTAGTTATGATTACTGCCCCAGATGACGTACG
TBX1 Ala-del sequence:
GCGATCGCTGACCCTGAAGACTGGCCGAGGAACCATAGGCCAGGCGCACTCCCCCTTATGAGTGCCTTCGCTCGATCCAGAAATCCGGTCGCAAGTCCAACACAACCATCTGGAACCGAGAAAGATGCAGCTGAAGCACGACGGGAGTTCCAGCGAGATGCCGGGGGACCTGCAGTACTGGGTGATCCCGCACATCCTCCCCAACTTTTGGCGAGAGTATTGAGTCCCTCCCTTCCTGGTGCTGGAGGAGCTGGCGGTCTCGTACCACTTCCAGGAGCGCCGGGTGGTCGGCCATCCCCGCCTAACCCAGAACTCCGACTTGAGGCTCCAGGCGCTTCCGAACCGCTGCATCATCATCCGTACAAGTACCCTTACGATCATTACCTGGGCGCTAAGAGCAGACCGGCTCCGTACCCTCTGCCGGGCCTCAGAGGACATGGGTATCACCCTCACGCGCACCCGCACCACCATCACCATCCTGTGTCACCGAACATGTATTCCAGCGCGGGGGCCGCTCCTCCTGGTAGCTACGATTACTGTCCTAGATGACGTACG
EOMES wt sequence:
GCGATCGCTAACCTGCCTGGCGCGCACTTCTACCCGCTGGAGAGCGCTCGCGGAGGTAGTGGGGGCTCTGCGGGCCACCTTCCCTCCGCTGCGCCATCACCGCAAAAACTTGACCTCGATAAGGCTAGTAAAAAATTTTCAGGCTCTCTGTCATGTGAAGCGGTCAGCGGGGAACCGGCGGCAGCCTCCGCTGGTGCACCAGCCGCGATGTTGTCAGATACGGATGCTGGCGACGCTTTTGCGAGTGCTGCTGCTGTAGCAAAACCTGGCCCTCCTGATGGGAGAAAAGGCTCTCCATGCGGAGAGGAGGAACTTCCAAGTGCCGCAGCTGCAGCAGCTGCAGCGGCAGCAGCAGCGGCTGCCACGGCACGGTATTCTATGGATTCACTTTCCTCTGAAAGATACTACCTCCAGTCTCCTGGCCCACAAGGGTCTGAGCTCGCCGCCCCTTGTTCATTGTTCCCCTACCAGGCAGCCGCAGGCGCTCCACACGGCCCGGTTTATCCTGCTCCCAATGGTGCAAGATACCCATATGGGAGTATGTTGCCACCTGGAGGCTTCCCGGCGGCCGTCTGTCCACCAGGGCGGGCTCAGTTTGGACCTGGAGCAGGTGCTGGTAGTGGGGCTGGTGGTTCCTCAGGAGGGGGTGGCGGTCCTGGTACTTACCAATACAGCCAAGGAGCCCCGCTCTATGGGCCGTACCCTGGAGCCGCAGCGGCGGGATCTTGCTGACGTACG
EOMES Ala-del sequence:
GCGATCGCTAACCTGCCCGGTGCACATTTTTATCCTCTTGAATCTGCACGGGGGGGCAGCGGTGGCTCTGCTGGCCACTTGCCGTCTGCGGCTCCTAGTCCCCAAAAGCTCGATCTTGACAAAGCTAGTAAGAAGTTTTCAGGAAGTCTCAGTTGCGAAGCTGTTTCCGGGGAGCCTTCAGCTGGTGCCCCGGCCGCTATGTTGAGTGACACCGATGCAGGTGACGCTTTCGCTAGCGTGGCAAAGCCGGGCCCCCCCGATGGGCGGAAGGGGAGCCCTTGCGGTGAGGAGGAACTTCCGTCTACGGCTCGGTACAGTATGGATTCCCTGAGCAGCGAGAGATACTACCTTCAGAGTCCGGGTCCGCAGGGGAGTGAGTTGGCAGCCCCCTGTTCCTTGTTCCCATATCAAGGAGCGCCCCATGGTCCTGTGTACCCTGCCCCCAACGGAGCCCGGTACCCCTACGGGTCAATGCTTCCGCCTGGCGGATTTCCTGCCGCGGTATGTCCTCCTGGTAGAGCCCAATTCGGCCCTGGCGCTGGGGCGGGTAGTGGGGCCGGCGGATCTTCAGGTGGCGGAGGGGGTCCAGGAACCTATCAATATTCCCAAGGGGCGCCACTGTACGGTCCCTACCCTGGGGCTGCCGCAGCTGGTAGTTGCTGACGTACG
BHLHE41 wt sequence:
GCGATCGCTTGCGTGCCCGTCATCCAGCGGACTCAGCCCTCCGCAGAGCTGGCCGCTGAAAATGATACTGATACCGACTCCGGCTACGGAGGTGAAGCTGAGGCAAGGCCGGACCGGGAGAAAGGAAAAGGCGCGGGTGCTTCCCGCGTCACAATAAAACAGGAGCCCCCAGGAGAAGACTCACCTGCACCTAAGAGGATGAAGCTGGATTCCAGGGGAGGAGGTTCTGGAGGCGGACCCGGAGGCGGCCTGCTGGGCCCAGACCCTTTGCTCAGGCCTGATGCGGCGCTGTTGTCCAGTCTTGTCGCATTTGGAGGCGGGGGAGGAGCACCATTCCCACAGCCACCGTTCTGTCTCCCTTTTTGTTTTCTGTCACCTAGTTATGTTCAACCTTTTCTTGATAAGAGCGGACTCGAAAAGTATCTGTATCCACCGTTCCCACTTCTGTATCCTGGAATCCCCGCGCCCTTTCCATGCCTGAGCAGTGTATTGTCTCCGCCCCCCGAGAAAGCTGGCACCCTGTTGCCGCATGAGGTGGCTCCGCTGGGAGCACCTCACCCACAACATCCGCACGGTAGGACTCACTTGCCTTTCGCTGGCCCCCGGGAACCTGGGAACCCCGAGTCTAGCGCTCAAGAGGATCCCAGCCAACCCGGCAAGGAGGCTCCCTGACGTACG
BHLHE41 Ala-del sequence:
GCGATCGCTTGCGTGCCCGTCATCCAGCGGACTCAGCCCTCCGCAGAGCTGGCCGCTGAAAATGATACTGATACCGACTCCGGCTACGGAGGTGAAGCTGAGGCAAGGCCGGACCGGGAGAAAGGAAAAGGCGCGGGTGCTTCCCGCGTCACAATAAAACAGGAGCCCCCAGGAGAAGACTCACCTGCACCTAAGAGGATGAAGCTGGATTCCAGGGGAGGAGGTTCTGGAGGCGGACCCGGAGGCGGCCTGCTGGGCCCAGACCCTTTGCTCAGGCCTGATGCGGCGCTGTTGTCCAGTCTTGTCGCATTTGGAGGCGGGGGAGGAGCACCATTCCCACAGCCACCGTTCTGTCTCCCTTTTTGTTTTCTGTCACCTAGTTATGTTCAACCTTTTCTTGATAAGAGCGGACTCGAAAAGTATCTGTATCCACCGTTCCCACTTCTGTATCCTGGAATCCCCGCGCCCTTTCCATGCCTGAGCAGTGTATTGTCTCCGCCCCCCGAGAAAGCTGGCACCCTGTTGCCGCATGAGGTGGCTCCGCTGGGAGCACCTCACCCACAACATCCGCACGGTAGGACTCACTTGCCTTTCGCTGGCCCCCGGGAACCTGGGAACCCCGAGTCTAGCGCTCAAGAGGATCCCAGCCAACCCGGCAAGGAGGCTCCCTGACGTACG
HOXA13 −58A (Ala-del) sequence:
GCGATCGCTGAGTTGAACAAAAACATGGAGGGGGGAGCCGGTGGAGGAGGTTTTCCCCATCCGGGGGGGAATTTCAGTGTTAACCAGTGCCGCAACCTGATGGCGCATCCAGCGCCTCTTGCGCCGGGGGCCGCATCAGCGTACAGTTCTGCTCCTGGGGAAGCACCCCCGTCCAGCAGTTCTGGCGGACCAGGGCCCGCAGGCCCTGCTGGTGCTGAGGCGGCGAAACAGTGCAGCCCTGTTCTCAGAGCTCATCCGGTCCCGCCGCCCTCCCATACGGATACTTTGGCTCAGGGTACTACCCGTGCGCGAGAATGGGCCCTCACCCCAACGCCATAAAGTCATGTGCCCAACCCGCGTCATTTGCCGATAAGTACATGGACACTGCTGGCCCCGCGGCGGAGGAGTTCAGTAGCAGGGCGAAGGAGTGACGTACG
HOXA13 −44A sequence:
GCGATCGCTGAGTTGAACAAAAACATGGAGGGGGGGGCTGGAGGAGGTGGCTTCCCGCATCCTGCTGCTGCGGCAGCTGGGGGGAATTTTTCAGTCAATCAGTGCAGAAACCTGATGGCGCACCCTGCCCCACTTGCACCGGGAGCTGCATCAGCGTACAGCTCAGCGCCGGGAGAAGCTCCACCGAGCTCATCTAGTGGTGGACCCGGACCAGCGGGTCCCGCTGGGGCCGAGGCTGCGAAACAATGTTCCCCCTGTTCTGCAGCCGCACAGTCCTCTTCAGGCCCTGCGGCATTGCCATATGGATACTTTGGGTCAGGCTATTATCCCTGCGCCCGCATGGGTCCTCATCCAAATGCGATCAAGAGCTGCGCGCAGCCTGCTAGTGCCGCGGCAGCGGCAGCCTTTGCTGATAAATACATGGATACCGCGGGCCCCGCAGCAGAAGAATTTAGCAGCCGAGCTAAGGAGTGACGTACG
MNX1 wt sequence:
GCGATCGCTGCGGTTGATCCTCCTAGAGCTGCGAGTGCTCAGAGTGCCCCCTTGGCCTTGGTTACGAGTCTGGCAGCTGCTGCTAGCGGCACGGGTGGGGGAGGCGGCGGTGGGGGAGCTAGTGGGGGGACATCAGGCTCATGCTCTCCAGCTTCCTCCGAGCCGCCTGCCGCTCCCGCCGATAGGCTCCGAGCAGAGAGTCCATCACCGCCTCGGCTGTTGGCAGCCCACTGTGCTTTGCTTCCCAAACCAGGGTTTTTGGGCGCTGGTGGCGGAGGGGGAGGAACGGGAGGTGGTCACGGCGGCCCTCATCACCATGCTCATCCGGGTGCCGCTGCGGCTGCTGCGGCAGCAGCTGCGGCGGCAGCCGCAGGTGGTCTTGCACTCGGTCTTCACCCGGGCGGAGCACAAGGTGGCGCGGGACTTCCTGCACAAGCAGCTCTGTATGGGCACCCAGTCTATGGGTATAGTGCGGCGGCTGCGGCAGCCGCCCTTGCAGGGCAACACCCAGCCTTGTCTTATTCTTATCCTCAGGTACAGGGGGCGCATCCAGCACACCCGGCGGACCCGATAAAGTGACGTACG
MNX1 Ala-del sequence:
GCGATCGCTGCGGTGGACCCCCCACGAGCCGCCTCAGCGCAATCTGCGCCATTGGCTCTGGTCACTTCATTGTCAGGAACAGGAGGTGGGGGTGGAGGAGGAGGTGCGTCAGGCGGAACGAGCGGGAGCTGTTCACCGGCCTCATCCGAACCTCCGGCGGCACCCGCCGACAGACTTCGGGCTGAAAGCCCGTCCCCCCCACGGCTCCTGGCTGCGCATTGTGCTCTGTTGCCTAAACCGGGATTTCTGGGTGCAGGTGGTGGGGGAGGGGGTACAGGCGGAGGTCACGGCGGCCCACACCATCATGCTCACCCTGGAGGCGGGTTGGCGCTCGGCCTCCATCCCGGGGGTGCCCAAGGTGGGGCTGGATTGCCAGCACAAGCGGCTCTGTATGGACATCCGGTATATGGCTATTCTCTTGCTGGACAGCACCCTGCTCTGTCCTATAGTTACCCTCAGGTACAGGGGGCCCATCCAGCGCATCCCGCAGACCCTATCAAGTGACGTACG
HEY2 Ala-del sequence:
GCGATCGCTCATCTCAGCACTTGCGCCACCCAGCGGGAGATGACATCCTCCATGGCCCACCACCATCATCCGCTCCACCCGCATCACTGGTTCCACCACCTGCCCGCAGCCCTGCTCCAGCCCAACGGCCTCCATGCCTCAGAGTCAACCCCTTGTCGCCTCTCCACAACTTCAGAAGTGCCTCCTGCCCACGGCTCTGCTCTCCTCACGGCCACGTTTGCCCATGCGGATTCAGCCCTCCGATGCCATCCACGGGCAGCGTCGCCCCCTGCGTGCCACCTCTCTCCACCTCTCTCTTGTCCCTCTCTGCCACCGTCCACACCCACAGCTTCCCTCTGTCCTTCGCGGGGGCATTCCCCATGCTTCCCCCAAACGTGACAGCCATCAGCCCGCCCTTGTCAGTATCAGCCACGTCCAGTCCTCAGCAGACCAGCAGTGGAACAAACAATAAACCTTACCGACCCTGGGGGACAGAAGTTGGAGCTTTTTAACGTACG
OLIG2 Ala-del sequence:
GCGATCGCTTTCCATCCCTCTGCTTGCGGAGGTCTGGCGCACAGCGCACCTTTGCCCGCTGCCACGGCACATCCACATGCGGCACATCATCCGGCCGTGCACCATCCTATACTCCCGCCCGTATCTAGCGCATCATTGCCGGGGAGTGGCCTCCCTAGTGTAGGTTCCATCAGACCACCACATGGACTTCTTAAATCCCCGTCCCCCCTTGGTGGTGGTGGGGGTGGATCTGGAGCGTCCGGAGGCTTTCAACATTGGGGCGGAATGCCATGCCCGTGTTCCATGTGCCAAGTCCCCCCTCCACATCACCACGTCTCTGCAATGGGTGCTGGGTCACTCCCTAGGCTCACTAGCGACGCCAAGTAGCGTACG
For LacO-LacI tethering experiments (Figure 4E–F), a vector containing CFP-LacI followed by a multiple cloning site (MCS) was prepared from CFP-LacI-MED1-IDR (Zamudio et al., 2019) by removing MED1-IDR with BamHI + EcoRI digestion. Next, a multiple cloning site (MCS) was introduced with annealed, BamHI + EcoRI digested oligonucleotides (below), and AsiSI/BsiWI sites were used to subclone HOXD13 IDR sequences from previously described vectors.
MCS fw primer:
GATCGGATCCGCGATCGCTAGCACCGGTCGTACGtctagagggcccGAATTCGATC
MCS rev primer:
GATCGAATTCGGGCCCTCTAGACGTACGACCGGTGCTAGCGATCGCGGATCCGATC
All constructs were sequence verified. The plasmids used in this study are listed in Table S1.
Isolation of limb bud cells
Limb buds from E12.5 wild type and spdh homozygous embryos were micro-dissected individually and digested with Trypsin-EDTA 0.05% (Gibco) for 15 minutes at 37°C and gently dissociated by pipetting after 5, 10, and 15 minutes. Cells were mixed in cell culture media (DMEM, 10%FBS, 2mM L-Glutamine, 50U/ml Penicillin/Streptomycin) and a single-cell suspension was obtained using a 40μm cell strainer (Falcon). About 150,000 limb bud cells from each embryo were seeded in 1000μl medium onto fibronectin-coated glass coverslips in 12 well plates. After 30-60 minutes, additional cell culture medium was added, and cells were grown for 24 hours. After 24 hours, the cells were rinsed twice with PBS and fixed 15 minutes at room temperature with 4% PFA/PBS.
Mouse genotyping
For genotyping, DNA was extracted from embryos and animals for strain maintenance using QuickExtract (Lucigen, QE09050), and PCR amplified using SPDH_F (ACTTGGGACATGGATGGGCT) and SPHD_R (CGCTCAGAGGTCCCTGGGTA) primers. PCR mix contained 1μl sample and 4% DMSO in 25μl reaction volume [95°C 3min, (95°C 20sec, 51°C 20sec 72°C 30sec)x35, 72°C 7min].
Whole mount in situ hybridization (WISH)
WISH was performed as previously described (Kuss et al., 2009; Villavicencio-Lorini et al., 2010). In brief, WISH was performed using a digoxygenin-labeled antisense riboprobe for Hoxd13 transcribed from cloned gene-specific probes with PCR DIG Probe Synthesis Kit (Roche). Embryos were fixed overnight in 4% paraformaldehyde (PFA) in PBS, washed with 0.1% Tween in PBS, and dehydrated stepwise in 25%, 50% and 75% methanol/PBST and stored at −20°C in 100% methanol. For WISH, embryos were rehydrated on ice in reverse methanol/PBST steps, washed in PBS-Tween, bleached in 6% H2O2 in PBST for 1 h and washed in PBS-Tween. Embryos were then proteinase K -treated (10 μg/ml in PBS-Tween) for 3 min and the reaction was quenched with glycine in PBS-Tween. Embryos were washed in PBS-Tween and finally re-fixed for 20 min with 4% PFA in PBS, 0.2% glutaraldehyde and 0.1% Tween. After further washing steps with PBS-Tween, embryos were incubated at 68°C in L1 buffer [50% deionized formamide, 5X SSC, 1% SDS, 0.1% Tween-20 in diethyl pyrocarbonate (DEPC); pH 4.5] for 10 min.
For pre-hybridization, embryos were incubated for 2h at 68°C in hybridization buffer 1 (L1 with 0.1% tRNA and 0.05% heparin). For subsequent probe hybridization embryos were incubated overnight at 68°C in hybridization buffer 2 (hybridization buffer 1 with 0.1% tRNA, 0.05% heparin and 1:500 digoxygenin (DIG) probe). Unbound probe was removed through repeated washing steps; 3× 30 min at 68 °C with L1, L2 (50% deionized formamide, 2×SSC pH 4.5, 0.1% Tween 20 in DEPC, pH 4.5) and L3 (2× SSC pH 4.5, 0.1% Tween-20 in DEPC, pH 4.5).
For signal detection, embryos were treated for 1 h with RNase solution (0.1 M NaCl, 0.01 M Tris pH 7.5, 0.2% Tween 20, 100 μg/ml RNase A in H2O), followed by washing in TBST 1 (140mM NaCl, 2.7mM KCl, 25mM Tris-HCl, 1% Tween 20; pH 7.5), and blocking (2h at room temperature in blocking solution [TBST 1 with 2% calf-serum and 0.2% bovine serum albumin (BSA)]. Overnight incubation with Anti-Dig antibody conjugated to alkaline phosphatase (1:5,000) at 4°C (Roche, catalogue no. 11093274910) was followed by 8x30 min washing steps at room temperature with TBST 2 (TBST with 0.1% Tween 20, and 0.05% levamisole/tetramisole), and samples were left overnight at 4°C. Finally, embryos were stained after equilibration in alkaline phosphate buffer (0.02 M NaCl, 0.05 M MgCl2, 0.1% Tween 20, 0.1 M Tris-HCl, and 0.05% levamisole/tetramisole in H2O) 3X20 min, followed by staining with BM Purple AP Substrate (Roche). The Stained embryos were imaged using a Zeiss Discovery V12 microscope and Leica DFC420 digital camera.
Cell treatments
Transfection:
For transient transfection and live cell imaging (Figure 1F–1G, 2C–F, 4E–F, 6B–D, 6K–M, 6T–V, 7E–G, S1F, S2A–E, S6B–D, S6F–H, S6M–N, S7F–G) HEK-293T cells or U2OS-2-6-3 cells were seeded onto chambered coverslips (Ibidi, 80826-90), and transiently transfected 20-24 h later using lipoD293 (Signagen, SL100668) or FuGENE HD (Promega) according to the manufacturer’s protocols. Each transfection series was repeated at least twice.
For 1,6-hexanediol (1,6-HD) treatment, isolated limb bud cells attached to fibronectin coated glass coverslips were treated with 6% or 0% 1,6-hexanediol (Sigma, 240117) in 1 ml cell culture media for 1 minute at 37°C. After treatment, cells were washed with PBS, fixed in 4% paraformaldehyde (PFA) (Sigma-Aldrich, P6148) for 10 minutes, and stored at 4°C until processing for immunofluorescence and microscopy. Limb bud cells isolated from two replicates (i.e. two pups per genotype) were used for 1,6-HD treatment.
Western blot
Cells were washed once with ice-cold PBS, and lysed in RIPA buffer (Thermo, 88900) supplemented with protease inhibitors (Thermo, 87786). Protein concentration was determined using bicinchoninic acid assay (Thermo, 23225), according to the manufacturer’s protocol. Equal protein amounts were brought to same volumes with lysis buffer, reducing agent and LDS loading buffer. Lysates were then heated to 95°C for 10 minutes, and separated on 4-12% Trisacetate gels (Invitrogen, NP0322BOX). Protein was transferred onto a nitrocellulose membrane in an iBlot 2 apparatus. After transfer, the membrane was blocked with Licor blocking buffer (Licor, 927-500000) for 1 hour at room temperature with shaking. The membranes were incubated with 1:750 anti-HOXD13 (abcam ab229234) and 1:3000 anti-HSP90 (BD Biosciences, 610419) antibody diluted in 5% non-fat milk in TBST overnight at 4°C with shaking. The next day, membranes were washed three times with TBST for 5 minutes at room temperature, incubated with fluorescent anti-mouse (IRDye 800CW Donkey anti-Mouse, Li-Cor P/N 925-32212) and anti-rabbit (IRDye 680LT Donkey anti-Rabbit, Li-Cor P/N 925-68023) secondary antibodies at 1:10000 dilution according to the manufacturer’s protocol, and washed three times in TBS-T for 5 minutes in the dark. Membranes were imaged on a LICOR Odyssey CLx imager.
Immunofluorescence and confocal microscopy
Isolated limb bud cells, Kelly cells, and SH-SY5Y cells attached to coated glass coverslips were fixed in 4% paraformaldehyde (PFA) (Sigma-Aldrich, P6148) in PBS for 10 min and stored at 4°C in PBS or processed immediately. After two washes in PBS, cells were permeabilized in 0.1% Triton X-100 (Thermo Scientific, 85111) in PBS for 10 min at room temperature (RT). Following three washes with PBS, cells were blocked with the blocking solution (10% fetal bovine serum (FBS), 0.1% Triton X-100 in PBS) for 30 min. Cells were then incubated with the primary antibody [anti-HOXD13 Invitrogen PA5-66661 1:250 dilution (Figure 4C) oranti-HOXD13 abcam ab19866 1:150 dilution (Figure 1B)] in blocking solution at 4°C overnight. After three 10 min washes in PBS, cells were incubated with the secondary antibody (donkey anti-Rabbit IgG Alexa Fluor 568 Invitrogen A10042 1:1000 dilution) in blocking solution for 1h at room temperature in the dark. Cells were washed three times in PBS and nuclei were counterstained with 0.24mg/mL 4’,6-diamidino-2-phenylindole (DAPI) in PBS for 3 min at RT in the dark. Following five washes in PBS, coverslips were mounted onto slides with Vectashield (Vector, H-1000) and sealed using transparent nail polish. Images were acquired on a confocal laser-scanning microscope (Zeiss LSM880, 63x oil objective, NA 1.4, 1 Airy Unit). Raw images (.czi files) were processed in FIJI (Schindelin et al., 2012). Expression of HOXD13 protein in nuclei of limb bud cells, Kelly cells, and SH-SY5Y cells lines was examined with three HOXD13 antibodies, as displayed in Figure 1B, S1A–C.
Stochastic optical reconstruction microscopy (STORM)
Isolated wild type and homozygous spdh E12.5 limb bud cells attached to fibronectin-coated glass coverslips were fixed in 4% paraformaldehyde (PFA) (Sigma-Aldrich, P6148) for 20 min at room temperature. After 2 x washes in PBS, fixed samples were treated with permeabilization solution (PBS supplemented with 0.1% Triton X-100) for 10 minutes at room temperature. Samples were then treated with blocking solution (permeabilization solution supplemented with 10% fetal bovine serum) for 30 min. After blocking, samples were incubated with primary anti-HOXD13 antibody (Thermo, PA5-66661, 1:250 in blocking solution), BRD4 antibody (Clone A-7, Santa Cruz, sc-518021, 1:250 in blocking solution), or HP1μ antibody (clone15.19s2, Millipore/Merck, 1:250 in blocking solution) overnight at 4°C, and then washed 3x in PBS. Stained and washed samples were then incubated with secondary antibody (goat anti-Rabbit IgG Alexa Fluor 647 Invitrogen A32733 / goat anti-Rabbit IgG Cy3 Invitrogen A21235, 1:1000 in blocking buffer for HOXD13 primary and goat anti-Mouse IgG Alexa Fluor 647 Invitrogen A10520, 1:1000 in blocking buffer for BRD4 / HP1α primary) for 45 minutes, after which samples were washed 3 x in PBS. For imaging, samples were placed in a one-well magnetic chamber, covered in switching buffer consisting of 0.15 M 2-mercaptoethanol/0.2 M Tris, pH 8.0 with 4 % (w/v) glucose, 0.25 mg/ml glucose-oxidase, 20 μg/ml catalase. For nuclei visualization (Figure 1C), switching buffer was supplemented with 5 nM Sytox Orange (Thermo, S11368). The BRD4 antibody was validated in-house using dBET6-induced degradation of endogenous BRD proteins. Images were acquired as described (Fabricius et al., 2018) with a Vutara 352 super resolution microscope (Bruker) equipped with a Hamamatsu ORCA Flash4.0 sCMOS for super resolution imaging and a 60x oil immersion TIRF objective with numerical aperture 1.49 (Olympus). Data were acquired with TIRF/HILO-illumination at a laser-power density of 62.5 kW/cm2 using an 532 and 639 nm laser. Images for co-IF STORM analyses were acquired from three biological replicates (three limb bud samples per genotype, harvested from three independent mouse matings).
Live cell imaging
Live cell imaging experiments were performed on an LSM880 confocal microscope (Zeiss) equipped with an incubation chamber and a heated stage at 37°C. Images were acquired with either a Plan-Apochromat 40x0.95 Korr M27 or a 63x1.40 oil DIC objective.
OptoDroplet assay (Figure 1F–G, 2C–D, 6B–C, 6K–L, 6T–U, 7E–F, S6D, S6H): The optoIDR assay was adapted from (Shin et al., 2017). Approximately 20,000 cells were seeded per well in chambered coverslips (Ibidi, 80826-90) one day before transfection. The following day, cells were transfected with 200ng of plasmid encoding respective optoIDR constructs. Cell culture medium was refreshed 48 hours post-transfection, and cells were imaged on a Zeiss LSM 880 confocal microscope. Droplet formation was induced using scans with the 488 nm laser every 20 seconds for the duration of imaging (Figure 1F–G, 2C–D, 6B–C, 6K–L, 6T–U, 7E–F, S6D, S6H). For image acquisition, mCherry fluorescence was stimulated using 561nm laser scans every 20 seconds. The constructs used for the optoDroplet experiments described in Figure 1F–1I, S1D–F did not include the SV40 NLS sequence, and the fusion protein displayed cytosolic localization. All other data was generated using constructs that included the SV40 NLS, and the fusion proteins displayed nuclear localization (verified e.g. in Figure S2B).
For FRAP experiments of light induced droplets (Figure 1H, 2E, 6D, 6M, 6V, S1F) droplet formation was induced with continuous 488 nm light for 90 seconds. Droplets were then bleached with 561 nm light, and fluorescence recovery was imaged every 4 seconds in the presence of simultaneous 488 nm light stimulation. Bleaching was performed on a region enclosing a single droplet using 2 iterations of 100% laser power. For RUNX2 and RUNX2+10A (Figure 6M), bleaching was on a region enclosing a single droplet using a single iteration of 100% laser power. For FRAP experiments of spontaneous HOXD13 IDR condensates (Figure 2F), condensates were bleached with 561 nm light and recovery was imaged every 12 seconds. Nuclei in live cells were visualized with the addition of Hoechst 33342 for 5min at 37°C in the imaging medium (Figure S2B).
To test the reversibility of optoIDR droplet formation (Figure S2C) cells were stimulated with continuous 488 nm laser scanning for 30 seconds. mCherry fluorescence was detected in the absence of 488 nm stimulation for 15 minutes at the time intervals displayed in Figure S2C.
For exclusion microscopy (Figure S2D–E), approximately 20,000 cells were seeded per well on chambered coverslips one day before co-transfection with optoIDR and IDR-YFP constructs. For all co-transfections, the total amount of transfected DNA was kept at a constant 300 ng/well. 48 hours post-transfection, culture media was refreshed, and cells were imaged on a Zeiss LSM 880 confocal microscope. For dual color image acquisition, mCherry fluorescence was stimulated at 561 nm, and YFP fluorescence was stimulated at 513 nm. Images for exclusion microscopy were acquired across two experimental replicates.
All experiments using optoIDR constructs were repeated at least two times.
LacO-LacI assays (Figure 4E–F): Tethering experiments were adapted from (Chong et al., 2018; Zamudio et al., 2019). Briefly, 20,000 U2OS cells were seeded on chambered coverslips one day before co-transfecting the cells with 100 ng of CFP-LacI-HOXD13-IDR plasmid and 100 ng of MED1-IDR-YFP-NLS plasmid with FuGENE HD reagent (Promega). Imaging was performed on live cells 48-80h after transfections. For the HOXD13 WT, +7A, and +10A tether series, images were acquired across three experimental replicates, and for the control (MED1 tether with MED1-YFP) images were acquired across two experimental replicates.
Protein purification and in vitro droplet formation assays
For protein expression, plasmids were transformed into BL21(DE3) (NEB M0491S) cells, and grown in home-made automatic-induction medium (AIM), as described in (Studier, 2005). In brief, 10 mL of overnight culture in minimal media (MDG) was used to seed 100 mL of AIM (ZYM-5052) supplemented with ampicillin and trace metals. This culture was incubated at 37°C with vigorous shaking for 2 hours, after which the temperature was brought down to 16°C. Cells were harvested when the cultures became dark magenta or bright green (24-48 hours later), after which pellets were frozen at −80°C for at least 16 hours. For protein purification, pellets were resuspended in 30 ml of Buffer A (50 mM Tris pH 7.5, 300 mM NaCl) supplemented with 8M Urea (Sigma, U5378) and cOmplete protease inhibitors (Sigma, 11697498001). This denatured suspension was sonicated and clarified by centrifugation at 20,000 g for 20 minutes at 4°C. Supernatants containing fusion proteins were loaded onto a His GraviTrap column (GE HealthCare, 11003399) pre-equilibrated in Buffer A supplemented with 8 M Urea. The loaded column was washed with 30 Column Volume (CV) of 6% Buffer B (50 mM Tris pH 7.5, 300 mM NaCl, 500 mM Imidazole) in Buffer A supplemented with 8 M Urea, and another 20 C.V. of 6% Buffer B to remove denaturant. Proteins were eluted in 3 C.V. of 50% Buffer B, immediately diluted 1:2 in storage buffer (50 mM Tris pH 7.5, 125 mM NaCl, 1 mM DTT, 10% Glycerol), and then concentrated using 30 MWCO centrifugal filters (Merck, UFC803008) by spinning at 7500 g for 30 minutes at 4°C. The resulting fraction was then diluted 1:100 in storage buffer, reconcentrated, and then stored at −20°C. All fusion proteins were purified in this same manner.
For in vitro droplet formation experiments (Figure 1J, 2G–H, 3A–J, 6E–H, 6N–Q, S6K), recombinant mCherry or mEGFP fusion proteins were measured for concentration, and then diluted or mixed to desired concentrations in storage buffer. For microscopy, these solutions were further diluted 1:2 in either 20% or 10% PEG-8000 in de-ionized water (w/v). 10 μl of this suspension was pipetted onto chambered coverslips (Ibidi, 80826-90), and immediately imaged using a LSM880 confocal microscope equipped with a 63x1.40 oil DIC objective and AiryScan detector. All images were acquired from within the solution interface, and performed before droplets settled onto the bottom of the coverslip, as described in (Sabari et al., 2018; Boija et al., 2018). For droplet assays using preformed GFP-MED1 IDR condensates (Figure 3E–F), GFP-MED1 IDR droplets were allowed to form for 30 minutes at room temperature in the presence of 10% PEG-8000 in protein Lo-bind tubes (Eppendorf, 30108094), before proceeding with co-condensation assays. For compound treatments of co-condensates (Figure 3G–J), small molecules [ATP (Jena Bioscience, NU-1010), Mitoxantrone dihydrochloride (Sigma M6545), (±)-α-Lipoic acid (Sigma 62320), and Lipoamide, (Medchemexpress HY-B1142)] were directly diluted into droplet mixtures from appropriate stocks with or without vehicle (DMSO, Sigma D2650) to the desired final concentrations, and immediately imaged using confocal microscopy. Droplet formation experiments (Figure 1J, 2G–H, 3I–J, 6E–H, 6N–Q, S6K) were repeated at least two times. Experiments for Figure 3A–C were repeated seven times.
Luciferase reporter assays
The murine proximal enhancer of Aldh1a2 (Kuss et al., 2009) was cloned into the pGL2-enhancer luciferase reporter vector and co-transfected into Cos7 cells with pcDNA3.1 (wild type or mutant Hoxd13) expression plasmids and pRL-CMV (Promega). For transfection, 8*104 Cos7 cells were cultured per well in 24-well plates and transfection of 455ng DNA per well (250ng pGL2-Aldh1a2, 200ng pcDNA3.1-Hoxd13, 5ng pRL-CMV) was carried out using FuGENE HD (Promega) according per the manufacturer’s instructions. 24 hours post transfection, reporter activity in 2.5μl of cell lysate was measured using the Dual-Glo Luciferase Assay System (Promega) according to the manufacturer’s instructions (Figure 4G).
Measurements were performed similarly in GAL4-DBD luciferase assays (Figure 6I, 6R, 7H–I, S7H), except GAL4UAS-Luciferase reporter [Addgene 64125, described in (Nihongaki et al., 2015)] was co-transfected with GAL4-IDR fusion constructs into HEK-293T cells, and with pRL-CMV, and 10 μl of cell lysate was used in measurements. All experiments were performed in triplicates and repeated 2-5 times. The number of measurements was 15 for HOXA13, TBX1, GSX2 and HEY2 series, 12 for EOMES, HOXD13 and BHLHE41-Adel, 9 for MNX1-Adel, OLIG2-Adel and HOXD11-Adel, and 6 for RUNX2, MNX1wt, OLIG2wt, BHLHE41wt and HOXD11wt.
H3K27Ac ChIP-seq with S2 spike-in control (ChIP-Rx)
Isolated E12.5 limb bud cells (hand plate) from 2 wild type, 2 homozygous spdh, and 2 heterozygous spdh mice (approximately 3.5 million cells each) across 2 separate het x het mouse crosses were fixed in 10 minutes in 1% formaldehyde on ice and quenched with 2.5M glycine. Each pool of 3.5 million cells (wt, homozygous spdh, and heterozygous spdh) was spiked in with 1 million fixed fly S2 cells (Orlando et al., 2014), after which cell suspensions were lysed in lysis buffer (50 mM HEPES, 140 mM NaCl, 1 mM EDTA, 10% Glycerin, 0.5% NP-40, 0.25 Triton X-100, pH 7.5 supplemented with protease inhibitors and Na-Butyrate). After assessing for optimal shearing conditions (47 cycles of 30 seconds of sonication at high settings using Diagenode Bioruptor) and total chromatin amount, 10-15 μg of sheared chromatin was incubated with 4 μl of H3K27AC antibody (Diagenode C15410174) in a total of 1.2 ml of buffer (10 mM Tris-HCl, 100 mM NaCl, 1 mM EDTA, 0.5 mM EGTA, 0.1% Na-DOC, 0.5% N-Laroylsarcosine, pH 8.0 supplemented with protease inhibitors and Na-Butyrate) overnight with gentle rotation at 4°C. After incubation, 30 μl of Protein G beads were added to the chromatin and antibody suspensions, and allowed to incubate overnight with gentle rotation at 4°C. Samples were then washed 7 times with 1 ml of RIPA buffer (to 50 mM HEPES-KOH, 1 mM EDTA, 1% NP-40, 0.7% Na-DOC, 500 mM Li-Cl, pH 7.55 supplemented with protease inhibitors and Na-Butyrate). Beads were then washed with TE buffer (supplemented with protease inhibitors and Na-Butyrate) and then centrifuged down to remove TE buffer. Chromatin was then eluted using 210 μl of elution buffer (50 mM Tris-HCl, 10 mM EDTA, 1% SDS, pH 8.0) and heated to 65°C with vigorous shaking. Eluates were then treated with 5 μl of Proteinase K overnight at 65°C. The next day, 4 μl of RNAse A was added to the samples, vortexed, spun down and incubated at 37°C for 30 minutes. Chromatin was then extracted using phenol-chloroform, and precipitated using 70% ice cold EtOH, with centrifugation at max speed for 10 minutes. Supernatant was removed, and the resulting pellet was dissolved in 30-50 μl of deionized water. Total yield was assessed by Qubit, and then sent for sequencing. Respective ChIP samples and input controls for wild type, homozygous spdh, and heterozygous spdh were paired-end sequenced using Illumina high-throughput sequencing, to a depth of around 25 million reads.
Flag-Hoxd13 ChIP-Seq from chicken micromass (chMM) cells
ChIP-Seq for wild type and mutant (+7A) Hoxd13 in chicken micromass cells (Figure S3C–E) were performed as described (Jerkovic et al., 2017) using 3xFlag tagged versions of murine Hoxd13. To create FLAG-tagged fusion protein for ChIP-Seq, coding sequence of mHoxd13+7Ala was cloned with ClaI and Spel sites into modified RCASPB(A) vector, as described for mHoxd13wt (Ibrahim et al., 2013). RCASBP(A)-3xFLAGHoxd13 (wt or mutant) virus was mixed with mesenchymal cells from HH22-24 embryonic limb buds at the time of seeding [10 μl drops a 2x10^7 cells in chMM medium (DMEM:HAM’s-F12 with 10% FBS, 10% CS, 1% L-glutamine and 1% Penicillin-Streptomycin)]. Hoxd13 expressing chMM cultures were harvested after 6 days of culture by adding digestion solution (0.1% collagenase (Sigma, #C9891) and 0.1% Trypsin in 1x PBS). Cells were resuspended in 10 ml cold chMM medium and fixed for 10 min on ice with 1% formaldehyde. Extraction of nuclear lysate was performed as described for the H3K27Ac ChIP above. Chromatin was sonicated with a Diagenode Bioruptor (45 cycles—30-sec pulse, 30-sec pause, HI power). For ChIP, 25–35 μg of chromatin was incubated with 6–8 μg of mouse anti-FLAG (Sigma M2, F1804) antibody overnight. The next day 30 μL of Protein G beads were added to the suspension and incubated overnight at 4°C. Washes and DNA extraction was performed as described above. Eluted DNA was used for library generation using NEBNext ChIP-seq Library Prep Master Mix for Illumina (New England Biolabs), fragments between 300–450bp were selected and sequenced single-end 50bp on a Illumina HiSeq 1500 using Illumina TruSeq v3 chemistry.
Single-cell RNA-seq data generation
E12.5 littermate embryos (wt and homozygous spdh) were obtained from staged matings of heterozygous spdh mice (Bruneau et al., 2001). Individual littermate embryos were separated and kept at 4°C in PBS during genotyping. DNA-was extracted from embryonic forebrain tissue of each embryo using QuickExtract (Epicentre, QE09050) and used for immediate PCR genotyping. Distal limb buds (hand plate) from 1 wild type and 1 homozygous spdh embryo were then dissected and trypsinized for a total of 30 minutes in 500 μl pre-warmed 3T-trypsin and gently dissociated by pipetting after 10, 15 and 25 minutes. Trypsinization was stopped by addition of cell culture medium (DMEM, 10% FBS, 2 mM L-Glutamine, 50 U/ml Penicillin/Streptomycin). Cell dissociation was verified microscopically and cell viability was assessed with Trypan-blue staining.
The cell suspension was passed throw a Flowmi strainer (40μm, Scienceware H13680-0040), centrifuged at 1,200 rpm at 4°C and washed with 1 ml PBS containing 0.4% FBS for a total of 3 washes. For single-cell RNA sequencing with a target cell recovery of about 5,000 cells, 8,000 cells were used as input for the generation of a droplet emulsion using the Chromium Controller. Single-cell libraries were generated following the manual instructions of 10x Genomics (Chromium™ Single Cell 3’ v2), with the exception of fewer PCR cycles in cDNA amplification (11 cycles) and sample index PCR (10 cycles) than recommended in order to increase complexity of libraries. Libraries were sequenced with a minimum of 300 million paired end reads and parameters as described in the manual. Further details are listed in Figure S4A.
Repeat expansions in HOXD13, HOXA13, RUNX2 and TBP
The repeat expansion information displayed in Figure 2B, 6A, 6J, 6S were curated from multiple studies, some of which were summarized in previous reviews (Albrecht and Mundlos, 2005; Darling and Uversky, 2017). The first +7A, +8 and +10 polyA repeat expansions associated with synpolydactyly were described in (Muragaki et al., 1996). Additional expansions, including pedigrees with +9A and +14A mutations were described in (Goodman et al., 1997). HOXA13 contains three short alanine repeats (14, 12 and 18 alanines, respectively), and hand-foot-genital syndrome (HFGS) –associated mutations in all three repeats have been described (Goodman et al., 2000; Innis et al., 2004). TBP polyQ repeat expansions were described in several early reports (Maltecca et al., 2003; Nakamura et al., 2001). The RUNX2 alanine expansions were described in (Mundlos et al., 1997).
Protein disorder analysis of HOXD13, HOXA13, RUNX2, TBP and FOXP1-4
Intrinsically disordered regions (IDRs) in HOXD13, HOXA13, RUNX2, TBP and FOXP1-4 (Figure 1D, 6A, 6J, 6S, 7A) were predicted using the publicly available Predictor of Naturally Disordered Regions (PONDR) algorithm (VSL2) (Peng et al., 2006) as previously described (Boija et al., 2018; Sabari et al., 2018). In brief, the algorithm utilizes neural network predictors, trained on non-redundant sets of ordered and disordered sequences, to predict disordered regions within queried sequences. An amino acid in a protein was considered disordered if the VSL2 algorithm score was >0.5 (http://www.pondr.com/) (Peng et al., 2006).
IDR classification: data retrieval and preprocessing
Protein sequences for all human RefSeq gene models were downloaded from UCSC (Karolchik et al., 2004) on November 9th 2018. For each protein, the PONDR (disorder) scores (VSL2) were obtained from PONDR (www.pondr.com) (Peng et al., 2006). An intrinsically disordered region (IDR) was defined as a sequence of at least 50 consecutive amino acids with a PONDR (VSL2) score above 0.5. Two IDRs in the same protein were fused if less than 40 consecutive amino acids with a score below 0.5 separated them. For the classification of TF IDRs (Figure 7A, S7A) the longest IDR from all protein isoforms of the same gene was used. The list of transcription factors and their DNA binding domain (DBD) sequences used in Figure 7A, S7A–B were retrieved from a previous study (Lambert et al., 2018) (http://humantfs.ccbr.utoronto.ca/). In particular, the DBD sequences of TFs with a homeobox, bHLH, bZIP and forkhead domain were used in Figure S7B. The amino acid composition, GRAVY (hydrophobicity) score, instability score, aliphatic index and isoelectric point (pH(I)) of each DBD and IDR was extracted using the ProtParam webservice (Artimo et al., 2012). PhyloP conservation scores based on the 100way multiple species alignment with hg19 as the reference species were obtained from UCSC. The list of DBD and IDR sequences are listed in Table S7.
IDR/DBD clustering and annotation
The amino acid composition, aliphatic index, isoelectric point (pI), PONDR, GRAVY and instability scores for each IDR of all TFs was used as input. Principal component analysis (PCA) was performed to identify the most variable features, and the first ten PCs (that explain 80% of the variability of the input data) were subsequently used (Figure S7C). The transformed data were then subject to K-means clustering. We determined the Bayesian information criterion (BIC) for various values of “k” and identified k=7 as an optimal cluster number as the infliction point on the BIC plot (Figure S7D) (Schwarz, 1978). In particular, we performed k-means clustering 1,000 times with different cluster starting points by setting different seed values in R and calculated BIC scores for each run. The infliction point respectively the optimal k of each repetition was identified as the one with the maximum distance to a fit distribution. The majority of the 1,000 repetitions had the infliction point at k=7. For each TF, the DBD annotation of a previous study was used (Lambert et al., 2018). The presence of a homopolymeric repeat was defined using a minimum repeat length of ten amino acids in the IDR (Figure 7A).
In Figure S7E, the features that distinguish each cluster from the other six clusters are shown. For this analysis the mean value of each feature was calculated for each cluster. The statistical significance between the distribution of the values for a feature in a cluster and the distribution of the values for a feature in the other six clusters was determined using Kolmogorov–Smirnov test. Bonferroni corrected p-values were log10 transformed. Red color indicates enrichment of a feature in the corresponding cluster (i.e. the mean value of the feature in the cluster is higher than the mean value of the feature in the other six clusters). Blue color indicates depletion of a feature in the corresponding cluster (i.e. the mean value of the feature in the cluster is lower than the mean value of the feature in the other six clusters). The depth of the color is scaled to the Bonferroni corrected p-values.
Figure 7A, S7A–B used the R packages circlize (Gu et al., 2014) and dendextend (Galili, 2015) to visualize the identified IDR clusters, DBD clusters and IDR and DBD clusters. The inner circle in Figure 7A represents the identified 7 IDR clusters. The middle circle highlights the TF IDRs with a homopolymeric alanine or glutamine repeat in the IDR, and the outer circle highlights the transcription factor family a TF IDR belongs to. The FOXP1/2/3 DNA binding motifs in the outsets were obtained from the Jaspar database (Mathelier et al., 2014).
In Figure S7A we used the classification tool on the 1,446 IDR sequences and 365 DBD sequences from the homeodomain, bHLH, bZIP and forkhead TFs for which the DBD amino acid sequences were available in (Lambert et al., 2018). The efficiency of the classification tool in discriminating DBDs and IDRs is calculated as the percentage of IDRs and DBDs being present in clusters 1 and 2 of this circular representation (Figure S7A). Cluster 1 and 2 contain 95% of all DBDs while 96% of IDRs are in the other clusters.
For the DBD classification in Figure S7B we used a k of 4 for the k-means clustering since DBDs that belong to 4 TF families (homeodomain, bHLH, bZIP and forkhead) were used as input. The inner circle represents the 4 clusters identified by our classifier, and the outer circle shows the TF family annotation. The transcription factor families have been recovered with 85% average efficiency. For each of the four DBD clusters, we determined the most abundant TF family in a cluster and the percentage of all of the family members being recovered in this particular cluster. Cluster 1 consists of 88% homeobox TFs, cluster 2 consists of 76% bHLH TFs, cluster 3 consist of 82% bZIP TFs and cluster 4 consists of 97% forkhead TFs.
The enrichment analyses of TFs whose IDRs comprise the 7 IDR clusters for categories displayed in Figure 7D was done as follows. The enrichment of Gene Ontology (GO) terms for biological processes was carried out by using the GOrilla webservice (Eden et al., 2009) with two unranked lists. The TFs found in a cluster were used as the target gene set and all TFs were used as the background set. A p-value of 10−3 was kept as threshold. We curated then the most specific GO terms for the target set which correspond to the leafs of the resulting GO term tree. Only GO terms that had at least 20 genes and not more than 1,000 genes in the background gene set were kept. In Figure 7D, only GO terms that had at least 15 genes overlap with at least one of the seven IDR clusters, and an FDR of maximum 5% were displayed. Phenotype ontology terms were retrieved from www.human-phenotype-ontology.org (Kohler et al., 2014) (ALL_SOURCES_ALL_FREQUENCIES_genes_to_phenotype.txt). Fisher’s exact test in R was carried out for each of the TFs in the seven clusters by setting the parameter alternative=‘greater’ and a p-value cutoff of 0.05. The significant phenotype terms were then filtered in the same way as the GO terms. The GWAS associations were obtained from https://www.ebi.ac.uk/gwas/ (Buniello et al., 2019) (gwas_catalog_v1.0-associations_e96_r2019-06-20.tsv) and we used the exact same processing as for the phenotype ontology terms. The complete set of terms and enrichment scores are listed in Table S7. The TF annotation of activators and/or repressors (Figure 7D) was obtained by using the R bioconductor package, and the GO.db was queried for terms ‘activator’ or ‘repressor’ and intersected with the term ‘transcript’. This resulted in 430 activators and 231 repressors.
QUANTIFICATION AND STATISTICAL ANALYSIS
Confocal/Fluorescence image analysis
HOXD13 puncta detected in fixed cell immunofluorescence (Figure 4C–D) were analyzed in Zen Blue 3.0. Nuclear regions were first detected by Otsu thresholding on the DAPI counterstain signal. HOXD13 puncta within nuclear regions were detected using a fixed minimal pixel intensity threshold, segmented on morphology, and then filtered based on fluorescence intensity and circularity. After adjusting parameters on 4-5 images, the established pipeline was used to analyze all images from cell-types and treatment conditions (7 images for untreated wild type limb bud, 7 images for 6% 1-6 hexanediol (1-6 HD) treated wild type limb bud, 18 images for untreated spdh limb bud, 12 images 6% 1-6 HD treated spdh limb bud). Values for nuclear area, HOXD13 puncta area, HOXD13 puncta mean fluorescence intensity, and HOXD13 puncta count were measured for 120 wild type cells, 143 1-6 HD treated wild type cells, 63 spdh cells, and 62 1-6 HD treated spdh cells. The numbers of cells are displayed as “n” in Figure 4D, S3A–B. For data visualization, phase-shift ratios, puncta count, and mean fluorescent intensities of HOXD13 puncta in each sample were plotted as indicated in figure legends (Figure 4D, S3A–B). Detailed description of the phase-shift ratio calculation is found in the OptoDroplet assay analysis section below.
STORM image analysis
STORM images were localized, visualized, and analyzed using Vutara SRX software, version 6.04.14 (Bruker). For HOXD13 cluster analysis (Figure 1C), images were collected with a 50 ms acquisition time and 5,000 images were used to reconstruct the super-resolution composite with minimal background thresholding. The HOXD13 density map was generated by point splatting localized particles with radial precision. The histogram in Figure 1C shows the frequency in size distribution of HOXD13 clusters within the projected cell nucleus of an E12.5 mouse limb bud cell. To estimate HOXD13 condensate size, HOXD13 localizations were clustered using density-based spatial clustering of applications with noise (DBSCAN). DBSCAN parameters (specific distance of 100 nanometers) were set using the spatial distribution tool embedded in the Vutara SRX analysis interface and the radius of gyration for clustered HOXD13 localizations (15-50 particle clusters) was measured. The Nearest Neighbors (NeNa) localization precision (Endesfelder et al., 2014) was 9 nm for HOXD13 localizations. NeNa reports the average localization precision of a single molecule localization microscopy (SMLM) experiment. In brief, the routine is dependent on the distance distribution (NNadfr) of nearest neighbors in adjacent frames, and is closely related to the pairwise displacement distribution of Gaussian-distributed localizations of a single, frequently localized molecule (Endesfelder et al., 2014).
For Co-IF STORM analysis (Figure 4A–B), 4,000 images (2,000 for each probe channel) were collected with a 50 ms acquisition time for each cell (25 cells from wt samples, 22 cells from spdh samples, and 5 cells in negative control sample). HOXD13, BRD4 and HP1α particles were localized with fixed minimal background thresholds on both channels to create super-resolution composites. Single cells were then manually thresholded from field of views using the selection tool embedded in the Vutara SRX visualization interface. Cells were then filtered for similar localization densities using a maximum localization density threshold, and assessed for probe overlap using the Manders overlap coefficient (MOC). The numbers of cells is indicated as “n” in Figure 4B (n=13 for HOXD13/BRD4 co-localization in wt cells, n=22 for HOXD13/BRD4 co-localization in spdh cells, and n=5 for HOXD13/HP1α co-localization in wt cells). Since the MOC calculates pixel-based overlap between 2 channel images acquired from diffraction-limited microscopy systems (Manders et al., 1993; Lagache et al., 2018), STORM composites were first converted into pixel-based images to mimic a diffraction-limited system, and then these images were used to calculate the MOC. Each cell was analyzed for probe overlap using the same conversion parameters (particle size = 150 nanometers, max radius = 500 nanometers) using the colocalization tool embedded in the Vutara SRX analysis interface. Density maps in Figure 4A were generated by point splatting localizations with size constants to better reflect the conversion parameters used for overlap analysis. For visualization of probe overlap (right most column in Figure 4A), merged density maps were processed in FIJI to isolate the pixel intersection between the two probe channels.
OptoDroplet assay analysis
Image analysis for optoDroplet assays (Figure 1F–G, 2C–D, 6B–C, 6K–L, 6T–U, 7E–F) was performed in Zen Blue 3.0 (Zeiss), Arivis Vision4D or FIJI. For optoDroplet analysis in Zen Blue 3.0, single cells were cropped out of image field recordings of cells receiving green light stimulation. Nuclear and cytosolic mCherry signals within cell recordings were then detected by Otsu thresholding and size filtering to define primary regions of interest (ROIs). OptoDroplets were detected within the primary ROIs using a second fixed pixel intensity threshold. All detected optoDroplets were automatically segmented using the watershed algorithm. For optoDroplet analysis in Arivis Vision4D, images were first converted to an appropriate file format in the Arivis SIS converter. Nuclear mCherry signals were automatically thresholded and size-filtered to define primary ROIs. OptoDroplets were detected as secondary ROIs that exceeded the threshold limit of the primary ROI. All parameters for both software approaches were determined empirically by adjusting the analysis pipeline on 4-5 raw image field recordings for each experimental set. The pipeline was then used to analyze at least 50 – 200 cells per genotype (indicated as “n” in each figure panel) with identical parameters. In Figure 1G, 2D, 6C, 6L, 6U, 7F the phase-shifted fraction was calculated as the total area of detected optoDroplets within a primary ROI, divided by the area of the corresponding primary ROI. This fraction was then averaged over all detected cells (indicated as “n” in each figure panel) for each genotype, and plotted over time.
To control for differences in optoIDR expression levels, minimum and maximum thresholds on mean mCherry fluorescence at time point 0” were used. Mean fluorescence intensities of ROIs (cells or nuclei) at time point 0” used for phase-shift fraction calculations are displayed in Figure S1D, S2A, S6B, S6F, S6M, S7F.
For phase-shifted fraction comparison in the HOXD13 deletion series in Figure 7E–F, 30 cells in the mCherry signal intensity range of 75 to 100 at the initial time point (i.e. pre-light induction) were selected at random for each genotype using Arivis Vision4D processing. The phase-shifted score was averaged over the 30 cells per genotype, and plotted overtime. In Figure 7G, I DR amino acid composition is plotted against the mean phase-shift score at 180” of green light stimulation for each genotype (Figure 7G).
For FRAP analysis of OptoIDR constructs, mean pixel intensity of regions of interests were measured using FIJI, and normalized to pre-bleaching intensity. Captured intensity traces were averaged over multiple replicates for each genotype (indicated as “n” in figure panels), and values were plotted against time.
For exclusion microscopy analysis (Figure S2D–E) primary regions of interest corresponding to spontaneously formed HOXD13(+8A)-mCherry-CRY2-NLS condensates were detected based on a fixed intensity threshold. Mean intensities of these primary regions were measured on both mCherry and YFP channels, and a 4-pixel wide ring with a 1-pixel gap from the primary region was used as a reference (background) region. The mean intensity value of this reference region was used to normalize the mean intensity of the enclosed primary region. To quantify exclusion of IDR-YFP constructs, normalized signals of primary regions, in both channels, were plotted against the corresponding genotype. Each “n” in Figure S2E indicates a unique spontaneous +8A optoIDR condensate.
LacO-LacI tethering assay analysis
For LacO-LacI image analysis (Figure 4E–F) primary regions of interest corresponding to IDR-LacI-CFP tethers were detected based on a fixed intensity threshold on the cyan channel. Mean intensities of these primary regions were measured on both YFP and cyan channels, and a 3-pixel wide ring with a 1-pixel gap from the primary region was used as a reference (background) region. The mean intensity value of this reference region was used to normalize the mean intensity of the enclosed primary region. To quantify partitioning of MED1 IDR-YFP constructs, normalized YFP signals at the primary regions were plotted for each co-transfection (Figure 4F). For quantification, only tethers within cells of similar expression levels of YFP were used, by gating on mean intensities of reference regions as seen in the right panel in Figure 4F. Additionally, only tethers exhibiting at least 5 fold CFP signal over background were used for enrichment analysis. Each “n” in Figure 4F indicates a unique LacI-CFP tether that abides by these gating conditions (n = 35 for HOXD13 WT + MED1, n = 42 for HOXD13 +7A + MED1, n = 42 for HOXD13 +10A + MED1, n = 16 for MED1 + MED1). For data visualization (Figure 4F), values were plotted as indicated using R-studio.
In vitro condensate assay analysis
Data for in-vitro condensation experiments were acquired from 4-8 image fields for each condition. For data analyses (Figure 1J, 3A–D, 3H–J, 6G–H, 6P–Q, S6J–K) droplet regions were first detected using a fixed minimal intensity threshold on either the mEGFP or mCherry channel using Zen Blue 3.0. For preassembled MED1 IDR-GFP scaffold experiments (Figure 3E–F) and TF IDR mutant phase diagrams (Figure 2G–H, 6E–F, 6N–O), droplet regions were first detected by three sigma thresholding on the mCherry channel in Zen Blue. To ensure robust detection of droplets, detected regions were then gated with minimum and maximum filers on size and pixel deviation. Mean fluorescence intensity, area, and diameter of droplet regions were measured on both channels, and plotted as described in Figure 1J, 2H, 3B–E, 3H–J, 6F, 6H, 6O, 6Q, S6K using R-Studio. The flushed insets in Figure 3E were generated using the Directlabels package. Detailed breakdown of visualization approaches and the utilized code can be found at https://github.com/BasuShaon/ChemicalBiology.
Statistical analysis
Statistical analyses were carried out in in Graphpad Prism 7 and R Studio (Figure 1G–H, 1J, 2D–F, 2G, 3B–D, 3E, 3H–J, 4B, 4D, 4F, 6C–D, 6F, 6H, 6L–M, 6O, 6Q, 6U–V, 6F–G, S1D–E, S2A, S2D–E, S3A–B, S6B–C, S6F–G, S6K, S6M–N, S6F). Cluster analysis and overlap analysis of STORM localizations (Figure 1C, 4B) was carried out using Vutara SRX v 6.04.14 analysis software. In Figure 1G, 2D, 4D, 6C, 6L, 6U, 7F–G, values are displayed as mean +/− SEM, and this information is included in the corresponding figure legends. In Figure 1H, 2E–F, 4B, 4G, 6D, 6M, 6V, data are displayed as mean +/− SD, and this information is included in the corresponding figure legends. In Figure 2H, 3D, 4F, 6F, 6I, 6O, 6R, 7H, S3A–B, S7H, the centerline corresponds to the median, and the upper and lower bounding box indicates the interquartile range of the displayed data. Dashed vertical lines in Figure 1C, 3E indicate the mean or median value on the x-axis, as described in figure legends. In Figure S1E, S6C, S6G, and S6N, the “r” represents the Pearson’s correlation coefficient between phase-shift score and cellular expression levels of optoIDR constructs. Pairwise statistical testing in Figure 3C, 3D, 4B, 4D, 4F, 7I, S1D, S2A, S2E, S3A–B, S6B, S6F, S6M, S7F was done using Students t-test, K-S test, or Welch’s Two sample t-test, as described in the respective figure legends. The sample size “n” in Figure 1G–H, 2D–F, 4B, 4D, 4F, 6C–D, 6L–M, 6U–V, S1D, S2A, S2E, S6B, S6F, S6M, S6F, S7G can be found in the figure panels. In Figure S7G, Pearson’s correlation coefficients and associated p-values were calculated with the cor.test function in R. The −15A and −7A HOXD13-IDR constructs had less than 4 out of 30 data points being non-zero. No methods were used to determine if the data met the assumptions of the statistical approach.
Single-cell RNA-seq data pre-processing
The single-cell RNA-seq datasets were processed with 10x Genomics’ Cell Ranger pipeline version 3.0.0 and mapped to the mouse genome version mm10. The mapped reads from the Cell Ranger output in identified clusters 1 to 11 for the wild type and SPDH samples were remapped to mouse genome mm9 in separate batches (one per cluster and condition) with the STAR aligner version 2.5.3a (Dobin et al., 2013) and subsequently transformed to bigwig files for UCSC genome browser visualization (Figure 5F, S5D) by using bamCoverage from deeptools version 3.1.2 (Ramirez et al., 2016) with normalization method BPM.
Single-cell RNA-seq analysis: filtering and normalization
The Cell Ranger expression profiles for wild type and spdh cells were loaded into R version 3.5.1 (R Core Team, 2018) and were further processed by the R Seurat package version 2.3.4 (Butler et al., 2018). In particular, only cells that had between 200 and 7,000 genes detected as expressed, and less than 5% of mitochondrial reads were kept for further analysis. All remaining cells were then log-normalized and scaled up to 10,000 total reads using Seurat’s default settings.
Cluster identification
To identify cell populations in the wild type scRNA-Seq data the following Seurat functions were used: FindvariableGenes, RunPCA, RunTSNE and FindClusters (Butler et al., 2018). First, the genes with the highest variation across all WT cells were determined. Second, those genes were standard normalized across all cells. Third, a PCA was run on those genes to identify the top ten directions with the highest variances across all wild type cells and those were subject to t-SNE to get a better visual separation of the cells from the PCA input. Last, clusters were identified by first building a shared nearest neighbor graph and then running the Louvain algorithm on it (Blondel et al., 2008). The number of clusters was determined by the optimum of the modularity function from the Louvain algorithm.
Assignment of cell types to clusters
The marker genes in the 11 clusters of the wild type reference map were identified by running the FindAllMarkers functions of the Seurat package (Butler et al., 2018), and the marker genes are listed in Table S2. The clusters were then assigned to cell types using a combination of approaches including GO term enrichment analysis, inspection of localized gene expression data from whole mount in situ hybridization [e.g. using the Gene eXpression Database (GXD)], and literature data on marker genes of cell types in the developing limb, as described below.
Cluster 1. Proliferating cells (S phase) of the distal proliferating mesenchyme
The marker genes in this cluster are enriched for GO terms associated with DNA replication (e.g. Pcna) (Figure S4B). The marker genes in the cluster also include previously described distal limb mesenchyme markers Msx1 (Davidson et al., 1991; Lallemand et al., 2009), Prrx2 (Lu et al., 1999a; Lu et al., 1999b), and Twist 1 (O’Rourke et al., 2002) (Figure S4B).
Cluster 2. Proliferating cells (Cytokinesis) of the distal proliferating mesenchyme
The marker genes in this cluster are enriched for GO terms associated with nuclear division and cytokinesis. The marker genes in the cluster also include previously described distal limb mesenchyme markers Msx1 (Davidson et al., 1991; Lallemand et al., 2009), Msx2 (Davidson et al., 1991; Lallemand et al., 2009), Prrx2 (Lu et al., 1999a; Lu et al., 1999b), and Twist1 (O’Rourke et al., 2002) (Figure S4B).
Cluster 3. Perichondrium (Proliferating)
The marker genes in this cluster are enriched for GO terms associated with cell cycle. The marker genes include perichondrium marker genes Col1a1 (Villavicencio-Lorini et al., 2010), Crabp1 (Villavicencio-Lorini et al., 2010) and Hoxa11 (Boulet and Capecchi, 2004; Swinehart et al., 2013) (Figure S4B).
Cluster 4. Interdigital mesenchyme
The marker genes in this cluster include Aldh1a2 (Raldh), a gene exclusively expressed in interdigital mesenchymal cells (Kuss et al., 2009). The marker genes in the cluster also include previously described distal limb mesenchyme markers Msx1 (Davidson et al., 1991; Lallemand et al., 2009) and Msx2 (Davidson et al., 1991; Lallemand et al., 2009) (Figure S4B).
Cluster 5. Perichondrium
The marker genes in the cluster include perichondrium marker genes Col1a1 (Villavicencio-Lorini et al., 2010), Crabp1 (Villavicencio-Lorini et al., 2010) and Hoxa11 (Boulet and Capecchi, 2004; Swinehart et al., 2013) (Figure S4B).
Cluster 6. Proximal chondrocytes (carpal progenitors)
The marker genes in this cluster are enriched for GO terms associated with chondrocyte differentiation and skeletal system morphogenesis. The marker genes include Sox6 (Akiyama et al., 2002), Sox9 (Bi et al., 1999), Foxc1 (Yoshida et al., 2015), and Col2a1 (Zhao et al., 1997) (Figure S4B).
Cluster 7. Distal chondrocytes (phalanx progenitors)
The marker genes in this cluster are enriched for GO terms associated with chondrocyte differentiation and cartilage condensation. The marker genes include Sox9 (Bi et al., 1999), Sox5 (Akiyama et al., 2002), Col2a1 (Zhao et al., 1997), Col9a1 (Zhang et al., 2003), and Pax9 (Neubuser et al., 1995) (Figure S4B).
Cluster 8. Proliferating cells
The marker genes in this cluster are enriched for GO terms associated with cell division, and housekeeping cellular functions, and lack classic cell type markers that would enable clear identification of their origin. The cells likely represent proliferating undifferentiated cells.
Cluster 9. Myoblasts
The marker genes in this cluster are enriched for GO terms associated with skeletal muscle cell differentiation. The marker genes in the cluster include Myod1 (Davis et al., 1987) and Myog (Hasty et al., 1993) (Figure S4B)
Cluster 10. Hematopoietic cells
The marker genes in this cluster are enriched for GO terms associated with immune system function. The marker genes in the cluster include cell surface antigens Fcgr1 and CD48 (Figure S4B).
Cluster 11. Erythrocytes
The marker genes in this cluster are enriched for GO terms associated with erythrocyte maturation. The marker genes in the cluster include several hemoglobin genes (Hba-x, Hba-a1, Hbb-bs, Hbb-bh1) (Figure S4B).
Quantification of cell state proportions
Spdh cells were assigned to the identified 11 clusters of the wild type reference cell state map using the nearest neighbor method. Spdh cells were assigned to the wild type cluster that had the most similar mean expression profile. For each cluster and condition we normalized the cell counts by dividing by the total number of wild type or spdh cells used. Last, we determined the log2 ratio of these normalized cell state percentages in the spdh and wild type samples per cluster (Figure 5C, S4A). The expression values in Table S2 are the normalized values output by the “AverageExpression” function of Seurat. Expression values shown in Figure S4A are log1p-transformed values.
Differential expression analysis
Differential expression analysis was performed within clusters between wild type and assigned spdh cells by using the FindMarkers function of the Seurat package. The differentially expressed genes within the clusters are listed in Table S3. To display differentially expressed genes in Figure 5D, a q value cutoff of 0.05 was used.
Combined wild type and spdh scRNA-seq data analysis
To determine whether the abundance of specific cell types was altered in the spdh limb with an alternative clustering approach, the following analysis was performed (Figure S5A–C). Wild type and spdh cells were processed together, and only cells that had at least a single Hoxd13 read were considered for further processing. Preprocessing steps were then performed as described above, and PCA, t-SNE and cluster identification were run on the combined pool (wild type and spdh) of Hoxd13-expressing cells together. The clusters identified thus comprised of both wild type and spdh cells. Marker genes were identified by the FindAllMarkers function from the Seurat package. Last, the overlap of marker genes of the clusters from this approach with the marker genes from the clusters of the wild type cells only (above) was determined (Figure S5A–C).
Gene ontology (GO) term enrichment analysis
Gene Ontology (GO) term enrichment was performed on differentially expressed genes per individual cluster using the enrichGO function of the clusterProfiler R package (version 3.10.1) (Yu et al., 2012). The cut-off value for significance was set at q<0.05. As a control, cluster gene assignment was resampled both with and without replacement and the GO term enrichment repeated. Redundant terms were removed from the graphical display of the results, and terms displayed in Figure 5E were further filtered for q-value. The complete list of GO terms is listed in Table S5.
ChIP-Seq data (previously published)
The HOXD13 ChIP-Seq data was downloaded from GEO (accession number GSE81358), and was described in a previous study (Sheth et al., 2016). Previously published murine FLAG-HOXD13 and FLAG-HOXD13 Q317R ChIP-Seq data in chicken micromass were obtained from GEO (accession number GSE44799).
ChIP-Seq data processing
The HOXD13 ChIP-Seq data was aligned to the mm9 genome assembly using bowtie version 1.0.0 (Langmead et al., 2009) with parameters ‘-n 2 -e 70 -m 1 -k 1 --best -l 200’. If paired-end data was available we used only mate 1 from these as MACS version 1.4.2 (Zhang et al., 2008) uses only the first mate of a paired end mapping file. Peak calling in the HOXD13 ChIP-Seq data was done with MACS version 1.4.2 and parameters ‘-w -S --space=50 --keep-dup=auto – pvalue=1e-10’. The HOXD13 MACS peak co-ordinates are listed in Table S4A.
The murine FLAG-Hoxd13 transfected into chicken micromass ChIP-Seq datasets were aligned to the chicken genome (assembly gg3) using bowtie with parameters ‘-n 2 -e 70 -m 1 -k 1 --best -l 200’. If a library was sequenced on more than one lane then the mapping files of the same samples were merged with bamtools merge. Peak calling was done with MACS version 1.4.2 and parameters ‘-w -S --space=50 --keep-dup=auto --pvalue=1e-5’.
The paired-end sequencing reads of the murine H3K27Ac ChIP-Seq data with D. melanogaster spike-ins were first adapter- and quality trimmed by using cutadapt version 1.18 with options -q 20 -m 25 -a AGATCGGAAGAGC -A AGATCGGAAGAGC -O 5. Trimmed reads were aligned to the mouse genome mm9 or fly (D. melanogaster) genome dm6 with bwa version 0.7.17-r1188 using the ‘mem’ command and default options. A sorted bam file and corresponding index was created with samtools version 1.9. Duplicate reads have been identified and filtered by using MarkDuplicates from the gatk suite version 4.1.4.0. Deduplicated reads were kept if their MAPQ value was at least 15 by using samtools with option -q 15. Peaks for the mapped mouse reads/fly reads were called using the callpeak program from macs2 version 2.1.2, using Input ChIP as control and options ‘-narrow’. Technical replicates were merged using the merge program from bamtools version 2.5.1 and global normalization using reads per million mapped reads per base pair (rpm/bp) was performed.
Genome wide rpm/bp normalized coverage profiles were created by binning the mouse genome into 3mb regions and subsequently using bamToGFF_turbo.py from https://github.com/BradnerLab/pipeline.git (downloaded Oct. 2018) with options -s both -e 200 - m 60000 resulting in 50bp sized bins. H3K27Ac rpm/bp values for each bin were finally normalized by the spike-in factor obtained from the D. melanogaster spike-in ChIP-Seq reads (Orlando et al., 2014).
H3K27Ac ChIP-Seq analysis
In Figure 5J, the fold change in spike-in normalized H3K27Ac ChIP-Seq signal between spdh and wt samples was calculated as follows. First, the nearest HOXD13 peak within the same TAD around to the TSS of genes that were either downregulated or upregulated in cluster 4 was identified. The mean ChIP-Seq read density in the wt and spdh samples were calculated in a +/− 1kb window around the HOXD13 peak. As control set, the nearest HOXD13 peaks to genes within the same TADs were included. Only regions that had a mean K27Ac signal of at least 0.01 rpm/bp in both samples were kept.
In Figure S3D the union of ChIP-Seq peaks in the respective samples was identified, and the signal in log10(rpm/bp) in each sample at each region is plotted against the value of the same region in the other sample. Spearman’s rho was used as a correlation measure. The number of peaks in each panel is found on the y-axis in Figure S3E.
The heatmaps in Figure S3E were created by taking the union of the HOXD13 peaks in the wt and mutant datasets, and extending each region by 1kb. Each region was divided into 50 bins and rpm/bp values were calculated for each bin with the bamToGFF_turbo.py. The same procedure was performed for 3kb flanking regions to the left and right of each peak region.
Capture C data
Capture C profiles for hindlimb and midbrain tissues from mouse embryos at the developmental stage E11.5 were obtained from GEO (accession number GSE84795). In particular the following files were used:
GSM2251426_CC-HL-E115-Wt-Mm_Merged-Smoothed-5kb-Norm.tar.gz
GSM2251422_CC-MB-E105-Wt-Mm_Merged-Smoothed-5kb-Norm.tar.gz
Topologically Associating Domains (TADs)
Topologically associating domains (TADs) in mouse E12.5 limb bud cells were described in a previous study (Kraft et al., 2019). The genomic co-ordinates of TADs are listed in Table S4B.
Enrichment of HOXD13 ChIP-Seq peaks around Cluster 4 dysregulated genes
The number of HOXD13 ChIP-Seq peaks within TADs that contain a Cluster 4 dysregulated gene was calculated as follows. First, TADs that contain the transcription start site (TSS) of at least one gene dysregulated in Cluster 4 (Figure 5G, Table S3) were identified, and the number of HOXD13 peaks within those 82 TADs were calculated (Figure 5G). Refseq annotation catalog 89 (24th Sep. 2018) was used to define TSSs. As a control, 82 TADs of all TADs that contain at least one gene that is not a Cluster 4 dysregulated gene, were randomly selected, and the average number of HOXD13 peaks within those TADs was calculated. This process was iterated 1,000 times, and the mean number of peaks of the 1,000 iterations is plotted in Figure 5G.
The analysis described in Figure S5E was performed as follows. First, TADs that contain at least one gene dysregulated in Cluster 4 in spdh versus wild type cells (Table S3) were identified. Plotted is the percentage of these TADs that contain at least one HOXD13 ChIP-Seq peak (80/82 TADs, red bar). As a control, all other TADs that contain at least one gene, that is not a cluster 4 dysregulated gene, were identified, and the percentage of these TADs that contain at least one HOXD13 ChIP-Seq peak is plotted (2,760/3,567 TADs blue bar). To assess the statistical significance of the difference (Figure S5F), we randomly selected 82 TADs from the control TAD set 1,000 times, and plotted the distribution of the percentage of those TADs that contain at least one HOXD13 ChIP-Seq peak. The vertical red line represents the percentage of TADs with a Cluster 4 dysregulated gene that contains at least one HOXD13 peak (Figure S5E, red bar). The empirical p-value obtained from this procedure was 0. Further information on the genes and HOXD13 peaks is listed in Table S6.
In Figure S5G, the distance between the transcription start site (TSS) of Cluster 4 dysregulated genes and the nearest HOXD13 peak is plotted in the left. For this analysis, Cluster 4 dysregulated genes that are contained within a TAD that also contains a HOXD13 peak were used. As a control (right) the following analysis was performed: first the TADs that contain at least one HOXD13 peak and at least one gene that is not a Cluster 4 dysregulated genes were identified. 84 of these TADs were randomly selected 1,000 times, and the distances between the TSS of the genes to the nearest HOXD13 peak are plotted. The vertical lines represent the median values. The x-axis is in log2 scale.
Enrichment of Capture C signal at HOXD13 peaks
The mean contact frequency between Cluster 4 dysregulated genes and HOXD13 ChIP-Seq peaks (Figure 5H) was calculated as follows. First, the genes dysregulated in Cluster 4 were identified. 25 of these genes were used as Capture C viewpoints in the Capture C data described above, and these genes were kept for further analysis. The HOXD13 peaks within the TADs that contain these 25 genes were identified, and only the HOXD13 peaks that were separated by at least 50kb from the viewpoint gene were kept for further analysis (to reduce the elevated background signal close to the viewpoints). The summit positions of the HOXD13 peaks were then identified, and the mean Capture C signal around the summit position were plotted in 5kb bins around the summit (Figure 5H left). As a control, the same genomic co-ordinates of the peaks and bins were used to calculate the mean Capture C signal in embryonic midbrain tissue (Figure 5H right). The signal on the plot within the two samples is normalized against the highest mean bin signal in the respective sample.
Mean expression value of individual genes
For genes depicted in Figure 5F, S5D the coverage signal from the bigWig files of the 11 Clusters was exported. For each gene (Msx1, Msx2, Hoxd12, Hoxd13 and Sall1), the mean coverage of the 3’UTR plus last coding exon was calculated as bins per million mapped reads. The mean coverage values in the wild type cells are highlighted in blue, and the mean coverage values in the spdh cells are highlighted in red. Values are rounded to the nearest integer (Figure 5F, S5D).
Supplementary Material
Figure S1. HOXD13 forms condensates. Related to Figure 1.
(A) HOXD13 Immunofluorescence (IF) using the indicated antibody in E12.5 mouse limb bud cells.
(B) HOXD13 Immunofluorescence using the indicated antibody in human neuroblastoma cell lines Kelly and SH-SY5Y.
(C) Western blot analysis of HOXD13 protein levels in mouse limb bud, Kelly and SH-SY5Y cells. HSP90 was used as a loading control.
(D) Expression level of the mCherry-CRY2 and HOXD13 IDR-mCherry-CRY2 fusion proteins in cells used in the optoDroplet experiments displayed in Figure 1F–G. The expression level was quantified as the mean fluorescence intensity of mCherry in the cells expressing the fusion proteins at time point 0 (i.e. before the 488nm laser stimulation). r denotes a Pearson’s correlation coefficient.
(E) The expression level of the HOXD13 IDR-mCherry-CRY2 fusion protein correlates with droplet formation in HEK-293T cells. Plotted is the fraction of the cytoplasmic area occupied by HOXD13 IDR-mCherry-CRY2 droplets after 3 minutes of 488nm laser excitation at every 20s versus the mean expression of the fusion protein at time point 0 (i.e. before the 488nm laser stimulation). r denotes a Pearson’s correlation coefficient.
(F) Time lapse images of live HEK-293T cells expressing HOXD13 IDR-mCherry-CRY2 fusion protein before, during and after photobleaching. The bleached droplet is highlighted with a red box, and a zoom-in version of the box is displayed below at higher temporal resolution.
Fig. S2. Synpolydactyly-associated repeat expansions enhance HOXD13 IDR phase separation in HEK293T cells. Related to Figure 2, 4.
(A) Expression level of the HOXD13 wt IDR mCherry-CRY2 and HOXD13 +7A IDR mCherry-CRY2 fusion proteins in cells used in the optoDroplet experiments displayed in Figure 2C–D. The expression level was quantified as the mean fluorescence intensity of mCherry in the cells expressing the fusion proteins at time point 0 (i.e. before the 488nm laser stimulation).
(B) Images of nuclei of live HEK-239T cells expressing HOXD13 IDR-mCherry-CRY2 fusion proteins. The +8A and +9A IDRs form spontaneous nuclear bodies, whereas the spontaneously formed +14 IDR bodies appear cytosolic.
(C) The formation of light induced +7A and +8A HOXD13 IDR droplets is reversible. Displayed are images of live HEK-239T nuclei expressing HOXD13 +7A IDR mCherry-CRY2 and HOXD13 +8A IDR mCherry-CRY2 fusion proteins, before, at and after a 30s pulse of 488nm laser stimulation.
(D) Spontaneously formed HOXD13 +8A IDR bodies incorporate the HOXD13 +7A IDR more readily than the HOXD13 wt IDR, and exclude MED1 IDR and YFP alone. Displayed are representative images of live HEK-293T nuclei expressing the indicated fusion proteins.
(E) Quantification of fluorescence intensity of HOXD13 +7A IDR-YFP, HOXD13 wt IDR-YFP, MED1 IDR-YFP and YFP within spontaneously formed HOXD13 +8A IDR bodies.
Fig. S3. +7A repeat expansion has negligible effect on HOXD13 DNA binding. Related to Figure 4.
(A) Number of HOXD13 puncta in in mouse limb bud cells (displayed in Figure 4C–D) with or without treatment with 6% 1,6-hexanediol for 1min.
(B) Mean fluorescence signal intensity in HOXD13 puncta in in mouse limb bud cells (displayed in Figure 4C–D). P value is from a Student’s t test.
(C) ChIP-Seq binding profile of wild type (wt) and +7A repeat-expanded HOXD13 at the Hoxa cluster locus in Chicken ChMM cells.
(D) Read density of wt and mutant HOXD13 binding at the union of the binding peaks detected in the wt and mutant HOXD13 ChIPs.
(E) Heatmap representation of the read density of wt and mutant HOXD13 binding at the union of the binding peaks detected in the wt and mutant HOXD13 ChIPs. The binding peak +/− 3kb is displayed, centered on the binding peak. The regions are ranked according to signal in the wt sample (top: high, bottom: low signal).
Figure S4. Summary statistics of the scRNA-Seq data, and cluster characterization. Related to Figure 5.
(A) Summary statistics of the scRNA-Seq data for the 11 clusters of the reference cell state map.
(B) Expression features of marker genes in the clusters of the wt reference cell state map. The 11 clusters were assigned to cell states based on marker genes described in the Methods section. Displayed are the expression levels of a subset of marker genes in the individual clusters as a dot plot. The size of the dot is proportional to the total level of expression of the gene in the individual clusters, and the color of the dot is scaled to the proportion of cells within the individual clusters in which the expression of the gene is detected.
(C) (top left) Visualization of the wild-type scRNA-seq data using t-distributed Stochastic Neighbor Embedding (t-SNE). (rest) Gene expression changes in spdh cells versus wild type cells within the individual clusters. Plotted are the average expression values of all genes detected in each cluster in spdh cells (y-axis) versus wt cells (x-axis). The respective marker genes in each cluster are highlighted in blue.
Figure S5. Characterization of cell state and gene expression changes in the spdh limb bud. Related to Figure 5.
(A) Scheme of the workflow of an alternative analytical strategy to identify changes in the proportion of cell types in spdh limb buds. scRNA-Seq profiles of both wt and spdh cells were pooled, Hoxd13-expressing cells were selected, and the combined Hoxd13-expressing cells were clustered as described in the Methods.
(B) Visualization of the combined scRNA-seq data using t-distributed Stochastic Neighbor Embedding (t-SNE). Clusters identified in the combined data are highlighted in the left plot. Wild type cells only (middle) and spdh cells only (right) are highlighted in the t-SNE plot. The arrowhead highlights Cluster 9, which predominantly consists of wt cells, and is largely absent in the spdh limb bud.
(C) The marker genes of Cluster 9 in the combined map have a substantial overlap with the marker genes in the interdigital mesenchyme cells (Cluster 4) identified in the wild type reference cell state map. Displayed is a radar plot, where each arm in the radar represents the overlap between the marker genes of Cluster 9 in the combined map, with the marker genes in the clusters identified in the wild type reference cell state map.
(D) Profiles of Capture C, HOXD13 ChIP-Seq and scRNA-Seq data at the Msx2, Msx1, Hoxd13-Hoxd12 and Sall1 loci. The topologically associating domain (TAD) at the locus is denoted by a black bar above the Capture C profile. The mean expression value in spdh (red) and wt cells (blue) within each cluster are also displayed.
(E) Bar chart displaying the percentage of TADs that contain at least one gene dysregulated in Cluster 4 which also contain a HOXD13 binding peak (80/82 TADs), and the percentage of TADs that contain at least one gene that also contain a HOXD13 binding peak (2,755/3,562 TADs).
(F) The observed number of TADs that contain at least one gene dysregulated in Cluster 4 and a HOXD13 binding peak is significantly greater than the number of randomly permutated TADs containing a HOXD13 binding peak. 82 TADs were randomly selected 1000 times out of the 3,562 TADs, and the y-axis shows the number of permutations in which the % of TADs denoted on the x-axis contained at least one HOXD13 ChIP-Seq binding peak. The empirical P value is 0.
(G) (left) Distribution of the distance between the transcription start site (TSS) of the 84 genes dysregulated in Cluster 4 and the nearest HOXD13 ChIP-Seq peak. The median distance is highlighted by a red line. (right) Distribution of the distance between the transcription start site (TSS) of the 84 randomly selected genes and the nearest HOXD13 ChIP-Seq peak. The distance calculation was iterated 1000 times. The median distance is highlighted by a blue line.
Figure S6. The HOXA13 IDR, the RUNX2 IDR and the TBP IDR form condensates. Related to Figure 6.
(A, E, L) Amino acid composition of human HOXA13, RUNX2 and TBP. Ticks represent amino acids indicated on the y-axis at the positions indicated on the x-axis. The cloned IDR is highlighted with a purple bar.
(B, F, M) Expression level of the indicated fusion proteins in cells used in the optoDroplet experiments displayed in Figure 6B, 6K, 6T. The expression level was quantified as the mean fluorescence intensity of mCherry in the cells expressing the fusion proteins at time point 0 (i.e. before the 488nm laser stimulation).
(C, G, N) The expression level of the TF IDR-mCherry-CRY2 fusion proteins correlates with droplet formation in HEK-293T cells. Plotted is the fraction of the nuclear area occupied by TF IDR-mCherry-CRY2 droplets after 3 minutes of 488nm laser excitation at every 20 seconds versus the mean expression of the fusion protein at time point 0 (i.e. before the 488nm laser stimulation). r denotes a Pearson’s correlation coefficient.
(D, H) Representative images of HEK-293T nuclei expressing the indicated TF IDR-mCherry-CRY2 fusion proteins. Cells were stimulated with 488nm laser every 20s for 3 minutes. Note the emergence of light-induced droplets in the HOXA13 +7A IDR-mCherry-CRY2 –expressing cells, and the RUNX2 +10A IDR-mCherry-CRY2 –expressing cells.
(I) TBP Immunofluorescence (IF) in E12.5 mouse limb bud cells.
(J) Representative images of droplet formation by purified TBP-mCherry and mCherry at the indicated concentrations in droplet formation buffer.
(K) Phase diagram of TBP-mCherry in the presence of different concentrations of PEG-8000. The size of the circles is proportional to the size of droplets detected in the respective buffer conditions.
Figure S7. Molecular characterization of human TF IDRs. Related to Figure 7.
(A) The classification tool efficiently separates human TF DBDs from IDRs. The circle depicts the annotation of the respective input protein sequence as a DBD or an IDR.
(B) The classification tool efficiently separates human TF DBDs families. The inner circle depicts the output of the classification (4 Clusters), and the outer circle depicts the annotation of DBDs of the respective input protein sequence.
(C) Screeplot showing the contribution of each principal component (PC) to the variance. The cumulative variance is depicted with a red curve.
(D) Bayesian information criterion (BIC) plot for various values of “k” tested in the IDR clustering analyses. The optimal cluster number (k=7) was selected as the value at the inflection point of the BIC curve.
(E) Contribution of features (parameters) to the clustering of the individual TF IDR clusters. Features are highlighted in red/blue when statistically significant enrichment/depletion (Kolmogorov–Smirnov test) of a feature in a cluster compared to all other clusters was detected. The color code is proportional to +/− log10(P value).
(F) Expression level of the HOXD13 IDR-mCherry-CRY2 fusion proteins in cells used in the optoDroplet experiments displayed in Figures 7E–F. The expression level was quantified as the mean fluorescence intensity of mCherry in the cells expressing the fusion proteins at time point 0 (i.e. before the 488nm laser stimulation).
(G) Dependence of droplet formation on expression level. The expression levels of the HOXD13 wt IDR-mCherry-CRY2, and HOXD13 DEdel IDR-mCherry-CRY2 fusion proteins correlate with droplet formation in HEK-293T cells. Plotted is the fraction of the nuclear area occupied by the HOXD13 IDR-mCherry-CRY2 droplets after 3 minutes of 488nm laser excitation at every 20s versus the mean expression of the fusion protein at time point 0 (i.e. before the 488nm laser stimulation). r denotes a Pearson’s correlation coefficient.
(H) Luciferase reporter activity of the indicated TF IDRs fused to GAL4-DBD.
Table S1. Plasmids used in the study. Related to STAR Methods
The table contains information on the plasmids used in this study.
Table S2. Marker genes in the 11 cell clusters. Related to STAR Methods
List of marker genes identified in the 11 clusters of the wild type reference cell state map of mouse E12.5 limb.
Table S3. Differentially expressed genes in spdh vs. wild type cells in the 11 cell clusters. Related to STAR Methods
List of genes differentially expressed between wild type and spdh cells in the 11 clusters.
Table S4. Genomic coordinates of HOXD13 ChIP-Seq data and TADs. Related to STAR Methods
A. Genomic coordinates of ChIP-Seq binding peaks
The table contains the genomic co-ordinates of HOXD13 ChIP-Seq binding peaks in wild type mouse limb. Coordinates belong to the mm9 mouse genome assembly.
B. Genomic coordinates of Topologically Associating Domains (TADs)
Bed file containing the genomic coordinates of Topologically Associating Domains (TADs) in wild type mouse limb. Coordinates belong to the mm9 mouse genome assembly.
Table S5. List of GO terms associated with genes dysregulated in spdh vs wild type cell clusters. Related to STAR Methods
List of all Gene Ontology terms associated with the sets of genes differentially expressed between wild type and spdh cells in the 11 cell clusters.
Table S6. Cluster 4 dysregulated genes that were used as viewpoints in the Capture C data, and information on HOXD13 peaks around those genes within the TAD. Related to STAR Methods
List of genes differentially expressed between wild type and spdh cells in cluster 4 (interdigital mesenchymal cells), the co-ordinates of TADs and HOXD13 peaks within the same TAD.
Table S7. Catalog of TF IDRs, DBDs. Related to STAR Methods
List of IDRs and DBDs in human TFs, and enrichment of TFs whose IDRs belong to the IDR clusters for gene ontology, functional and phenotypic characteristics.
HIGHLIGHTS.
Repeat expansions in transcription factors (TFs) alter their phase separation capacity
Repeat expansions in TFs perturb the composition of TF-containing condensates
Hoxd13 repeat expansions alter the transcriptional program in a synpolydactyly model
Features of intrinsically disordered regions in TFs are linked to condensation behavior
ACKNOWLEDGEMENTS
We thank members of the Meissner laboratory, Dario Lupianez, Phillip Sharp and Martin Vingron for discussions. We are grateful to Charles Haggerty for S2 cells, Abishek Sampath Kumar for help scRNA-Seq libraries, Sigmar Stricker for help with scRNA-Seq cluster-to-cell type -assignment, Asita Stiege for help with the luciferase assays, Helene Kretzmer for discussions on scRNA-Seq, Alicia Zamudio and Jurian Schuijers for help with LacI-tethering experiments, to Rene Buschow, Thorsten Mielke and the MPIMG Imaging Facility for help with microscopy and image analysis, to Celine Hillgardt, Christin Franke, and the MPIMG transgenic facility for help with mouse work, and to the MPIMG Sequencing Core for help with sequencing. This work was funded by the Max Planck Society, and partially supported by grants from the NIH (1P50HG006193 to A.M.) and the Deutsche Forschungsgemeinschaft (DFG), including DFG Project Number 278001972 - TRR 186 to H.E., DFG Grant KR3985/7 to S.M., and SPP2202 Priority Program Grants from the DFG: MU880/16-1 (S.M.), IB 139/1-1 (D.M.I.) and HN 4/1-1 (D.H.). H.N is supported by a fellowship of the Emil Aaltonen Foundation. All data is available in the supplementary materials and the sequencing data was deposited at GEO under the accession number GSE128818.
Footnotes
Publisher's Disclaimer: This is a PDF file of an unedited manuscript that has been accepted for publication. As a service to our customers we are providing this early version of the manuscript. The manuscript will undergo copyediting, typesetting, and review of the resulting proof before it is published in its final form. Please note that during the production process errors may be discovered which could affect the content, and all legal disclaimers that apply to the journal pertain.
Unblending of transcriptional condensates in human repeat expansion disease CELL-D-19-02205R2
SUPPLEMENTAL INFORMATION
Supplemental Information includes STAR methods, 7 Figures and 7 Tables.
DECLARATION OF INTERESTS
The Max Planck Society is in the process of filing a patent application based on this paper.
References
- Akiyama H, Chaboissier MC, Martin JF, Schedl A, and de Crombrugghe B (2002). The transcription factor Sox9 has essential roles in successive steps of the chondrocyte differentiation pathway and is required for expression of Sox5 and Sox6. Genes & development 16, 2813–2828. [DOI] [PMC free article] [PubMed] [Google Scholar]
- Alberti S, Gladfelter A, and Mittag T (2019). Considerations and Challenges in Studying Liquid-Liquid Phase Separation and Biomolecular Condensates. Cell 176, 419–434. [DOI] [PMC free article] [PubMed] [Google Scholar]
- Albrecht A, and Mundlos S (2005). The other trinucleotide repeat: polyalanine expansion disorders. Curr Opin Genet Dev 15, 285–293. [DOI] [PubMed] [Google Scholar]
- Albrecht AN, Kornak U, Boddrich A, Suring K, Robinson PN, Stiege AC, Lurz R, Stricker S, Wanker EE, and Mundlos S (2004). A molecular pathogenesis for transcription factor associated polyalanine tract expansions. Human molecular genetics 13, 2351–2359. [DOI] [PubMed] [Google Scholar]
- Artimo P, Jonnalagedda M, Arnold K, Baratin D, Csardi G, de Castro E, Duvaud S, Flegel V, Fortier A, Gasteiger E, et al. (2012). ExPASy: SIB bioinformatics resource portal. Nucleic acids research 40, W597–603. [DOI] [PMC free article] [PubMed] [Google Scholar]
- Banani SF, Lee HO, Hyman AA, and Rosen MK (2017). Biomolecular condensates: organizers of cellular biochemistry. Nature reviews Molecular cell biology. [DOI] [PMC free article] [PubMed] [Google Scholar]
- Barnett DW, Garrison EK, Quinlan AR, Stromberg MP and Marth GT (2011). BamTools: a C++ API and toolkit for analyzing and managing BAM files. Bioinformatics 27, 1691–1692 [DOI] [PMC free article] [PubMed] [Google Scholar]
- Bi W, Deng JM, Zhang Z, Behringer RR, and de Crombrugghe B (1999). Sox9 is required for cartilage formation. Nature genetics 22, 85–89. [DOI] [PubMed] [Google Scholar]
- Blondel VD, Guillaume JL, Lambiotte R, and Lefebvre E (2008). Fast unfolding of communities in large networks. Journal of Statistical Mechanics. [Google Scholar]
- Boehning M, Dugast-Darzacq C, Rankovic M, Hansen AS, Yu T, Marie-Nelly H, McSwiggen DT, Kokic G, Dailey GM, Cramer P, et al. (2018). RNA polymerase II clustering through carboxy-terminal domain phase separation. Nature structural & molecular biology 25, 833–840. [DOI] [PubMed] [Google Scholar]
- Boija A, Klein IA, Sabari BR, Dall’Agnese A, Coffey EL, Zamudio AV, Li CH, Shrinivas K, Manteiga JC, Hannett NM, et al. (2018). Transcription Factors Activate Genes through the Phase-Separation Capacity of Their Activation Domains. Cell 175, 1842–1855 e1816. [DOI] [PMC free article] [PubMed] [Google Scholar]
- Boulet AM, and Capecchi MR (2004). Multiple roles of Hoxa11 and Hoxd11 in the formation of the mammalian forelimb zeugopod. Development 131,299–309. [DOI] [PubMed] [Google Scholar]
- Bruneau S, Johnson KR, Yamamoto M, Kuroiwa A, and Duboule D (2001). The mouse Hoxd13(spdh) mutation, a polyalanine expansion similar to human type II synpolydactyly (SPD), disrupts the function but not the expression of other Hoxd genes. Developmental biology 237, 345–353. [DOI] [PubMed] [Google Scholar]
- Buniello A, MacArthur JAL, Cerezo M, Harris LW, Hayhurst J, Malangone C, McMahon A, Morales J, Mountjoy E, Sollis E, et al. (2019). The NHGRI-EBI GWAS Catalog of published genome-wide association studies, targeted arrays and summary statistics 2019. Nucleic acids research 47, D1005–D1012. [DOI] [PMC free article] [PubMed] [Google Scholar]
- Butler A, Hoffman P, Smibert P, Papalexi E, and Satija R (2018). Integrating single-cell transcriptomic data across different conditions, technologies, and species. Nature biotechnology 36, 411–420. [DOI] [PMC free article] [PubMed] [Google Scholar]
- Cho WK, Spille JH, Hecht M, Lee C, Li C, Grube V, and Cisse II (2018). Mediator and RNA polymerase II clusters associate in transcription-dependent condensates. Science. [DOI] [PMC free article] [PubMed] [Google Scholar]
- Choi JM, Dar F, and Pappu RV (2019). LASSI: A lattice model for simulating phase transitions of multivalent proteins. PLoS computational biology 15, e1007028. [DOI] [PMC free article] [PubMed] [Google Scholar]
- Chong S, Dugast-Darzacq C, Liu Z, Dong P, Dailey GM, Cattoglio C, Heckert A, Banala S, Lavis L, Darzacq X, et al. (2018). Imaging dynamic and selective low-complexity domain interactions that control gene transcription. Science 361. [DOI] [PMC free article] [PubMed] [Google Scholar]
- Darling AL, and Uversky VN (2017). Intrinsic Disorder in Proteins with Pathogenic Repeat Expansions. Molecules 22. [DOI] [PMC free article] [PubMed] [Google Scholar]
- Davidson DR, Crawley A, Hill RE, and Tickle C (1991). Position-dependent expression of two related homeobox genes in developing vertebrate limbs. Nature 352, 429–431. [DOI] [PubMed] [Google Scholar]
- Davies SW, Turmaine M, Cozens BA, DiFiglia M, Sharp AH, Ross CA, Scherzinger E, Wanker EE, Mangiarini L, and Bates GP (1997). Formation of neuronal intranuclear inclusions underlies the neurological dysfunction in mice transgenic for the HD mutation. Cell 90, 537–548. [DOI] [PubMed] [Google Scholar]
- Davis RL, Weintraub H, and Lassar AB (1987). Expression of a single transfected cDNA converts fibroblasts to myoblasts. Cell 51,987–1000. [DOI] [PubMed] [Google Scholar]
- Dobin A, Davis CA, Schlesinger F, Drenkow J, Zaleski C, Jha S, Batut P, Chaisson M, and Gingeras TR (2013). STAR: ultrafast universal RNA-seq aligner. Bioinformatics 29, 15–21. [DOI] [PMC free article] [PubMed] [Google Scholar]
- Dolle P, Dierich A, LeMeur M, Schimmang T, Schuhbaur B, Chambon P, and Duboule D (1993). Disruption of the Hoxd-13 gene induces localized heterochrony leading to mice with neotenic limbs. Cell 75, 431–441. [DOI] [PubMed] [Google Scholar]
- Eden E, Navon R, Steinfeld I, Lipson D, and Yakhini Z (2009). GOrilla: a tool for discovery and visualization of enriched GO terms in ranked gene lists. BMC Bioinformatics 10, 48. [DOI] [PMC free article] [PubMed] [Google Scholar]
- Endesfelder U, Malkusch S, Fricke F, and Heilemann M (2014). A simple method to estimate the average localization precision of a single-molecule localization microscopy experiment. Histochem Cell Biol 141,629–638. [DOI] [PubMed] [Google Scholar]
- Fabricius V, Lefebre J, Geertsema H, Marino SF, and Ewers H (2018). Rapid and efficient C-terminal labeling of nanobodies for DNA-PAINT. Journal of Physics D: Applied Physics. [Google Scholar]
- Galili T (2015). dendextend: an R package for visualizing, adjusting and comparing trees of hierarchical clustering. Bioinformatics 31, 3718–3720. [DOI] [PMC free article] [PubMed] [Google Scholar]
- Goodman FR, Bacchelli C, Brady AF, Brueton LA, Fryns JP, Mortlock DP, Innis JW, Holmes LB, Donnenfeld AE, Feingold M, et al. (2000). Novel HOXA13 mutations and the phenotypic spectrum of hand-foot-genital syndrome. American journal of human genetics 67, 197–202. [DOI] [PMC free article] [PubMed] [Google Scholar]
- Goodman FR, Mundlos S, Muragaki Y, Donnai D, Giovannucci-Uzielli ML, Lapi E, Majewski F, McGaughran J, McKeown C, Reardon W, et al. (1997). Synpolydactyly phenotypes correlate with size of expansions in HOXD13 polyalanine tract. Proceedings of the National Academy of Sciences of the United States of America 94, 7458–7463. [DOI] [PMC free article] [PubMed] [Google Scholar]
- Gu Z, Gu L, Eils R, Schlesner M, and Brors B (2014). circlize Implements and enhances circular visualization in R. Bioinformatics 30, 2811–2812. [DOI] [PubMed] [Google Scholar]
- Guo YE, Manteiga JC, Henninger JE, Sabari BR, Dall’Agnese A, Hannett NM, Spille JH, Afeyan LK, Zamudio AV, Shrinivas K, et al. (2019). Pol II phosphorylation regulates a switch between transcriptional and splicing condensates. Nature 572, 543–548. [DOI] [PMC free article] [PubMed] [Google Scholar]
- Hasty P, Bradley A, Morris JH, Edmondson DG, Venuti JM, Olson EN, and Klein WH (1993). Muscle deficiency and neonatal death in mice with a targeted mutation in the myogenin gene. Nature 364, 501–506. [DOI] [PubMed] [Google Scholar]
- Hnisz D, Shrinivas K, Young RA, Chakraborty AK, and Sharp PA (2017). A Phase Separation Model for Transcriptional Control. Cell 169, 13–23. [DOI] [PMC free article] [PubMed] [Google Scholar]
- Ibrahim DM, Hansen P, Rodelsperger C, Stiege AC, Doelken SC, Horn D, Jager M, Janetzki C, Krawitz P, Leschik G, et al. (2013). Distinct global shifts in genomic binding profiles of limb malformation-associated HOXD13 mutations. Genome research 23, 2091–2102. [DOI] [PMC free article] [PubMed] [Google Scholar]
- Innis JW, Mortlock D, Chen Z, Ludwig M, Williams ME, Williams TM, Doyle CD, Shao Z, Glynn M, Mikulic D, et al. (2004). Polyalanine expansion in HOXA13: three new affected families and the molecular consequences in a mouse model. Human molecular genetics 13, 2841–2851. [DOI] [PubMed] [Google Scholar]
- Jain A, and Vale RD (2017). RNA phase transitions in repeat expansion disorders. Nature 546, 243–247. [DOI] [PMC free article] [PubMed] [Google Scholar]
- Janicki SM, Tsukamoto T, Salghetti SE, Tansey WP, Sachidanandam R, Prasanth KV, Ried T, Shav-Tal Y, Bertrand E, Singer RH, et al. (2004). From silencing to gene expression: real-time analysis in single cells. Cell 116, 683–698. [DOI] [PMC free article] [PubMed] [Google Scholar]
- Jerkovic I, Ibrahim DM, Andrey G, Haas S, Hansen P, Janetzki C, Gonzalez Navarrete I, Robinson PN, Hecht J, and Mundlos S (2017). Genome-Wide Binding of Posterior HOXA/D Transcription Factors Reveals Subgrouping and Association with CTCF. PLoS genetics 13, e1006567. [DOI] [PMC free article] [PubMed] [Google Scholar]
- Jiang YW, Veschambre P, Erdjument-Bromage H, Tempst P, Conaway JW, Conaway RC, and Kornberg RD (1998). Mammalian mediator of transcriptional regulation and its possible role as an end-point of signal transduction pathways. Proceedings of the National Academy of Sciences of the United States of America 95, 8538–8543. [DOI] [PMC free article] [PubMed] [Google Scholar]
- Karolchik D, Hinrichs AS, Furey TS, Roskin KM, Sugnet CW, Haussler D, and Kent WJ (2004). The UCSC Table Browser data retrieval tool. Nucleic acids research 32, D493–496. [DOI] [PMC free article] [PubMed] [Google Scholar]
- Kohler S, Doelken SC, Mungall CJ, Bauer S, Firth HV, Bailleul-Forestier I, Black GC, Brown L, Brudno M, Campbell J, et al. (2014). The Human Phenotype Ontology project: linking molecular biology and disease through phenotype data. Nucleic acids research 42, D966–974. [DOI] [PMC free article] [PubMed] [Google Scholar]
- Kraft K, Magg A, Heinrich V, Riemenschneider C, Schopflin R, Markowski J, Ibrahim DM, Acuna-Hidalgo R, Despang A, Andrey G, et al. (2019). Serial genomic inversions induce tissue-specific architectural stripes, gene misexpression and congenital malformations. Nature cell biology 21, 305–310. [DOI] [PubMed] [Google Scholar]
- Kuss P, Villavicencio-Lorini P, Witte F, Klose J, Albrecht AN, Seemann P, Hecht J, and Mundlos S (2009). Mutant Hoxd13 induces extra digits in a mouse model of synpolydactyly directly and by decreasing retinoic acid synthesis. The Journal of clinical investigation 119, 146–156. [DOI] [PMC free article] [PubMed] [Google Scholar]
- Kwon I, Kato M, Xiang S, Wu L, Theodoropoulos P, Mirzaei H, Han T, Xie S, Corden JL, and McKnight SL (2013). Phosphorylation-regulated binding of RNA polymerase II to fibrous polymers of low-complexity domains. Cell 155, 1049–1060. [DOI] [PMC free article] [PubMed] [Google Scholar]
- La Spada AR, and Taylor JP (2010). Repeat expansion disease: progress and puzzles in disease pathogenesis. Nature reviews Genetics 11,247–258. [DOI] [PMC free article] [PubMed] [Google Scholar]
- Lagache T, Grassart A, Dallongeville S, Faklaris O, Sauvonnet N, Dufour A, Danglot L, and Olivo-Marin JC (2018). Mapping molecular assemblies with fluorescence microscopy and object-based spatial statistics. Nature communications 9, 698. [DOI] [PMC free article] [PubMed] [Google Scholar]
- Lallemand Y, Bensoussan V, Cloment CS, and Robert B (2009). Msx genes are important apoptosis effectors downstream of the Shh/Gli3 pathway in the limb. Developmental biology 331, 189–198. [DOI] [PubMed] [Google Scholar]
- Lambert SA, Jolma A, Campitelli LF, Das PK, Yin Y, Albu M, Chen X, Taipale J, Hughes TR, and Weirauch MT (2018). The Human Transcription Factors. Cell 175, 598–599. [DOI] [PubMed] [Google Scholar]
- Langmead B, Trapnell C, Pop M, and Salzberg SL (2009). Ultrafast and memory-efficient alignment of short DNA sequences to the human genome. Genome biology 10, R25. [DOI] [PMC free article] [PubMed] [Google Scholar]
- Levine M, Cattoglio C, and Tjian R (2014). Looping back to leap forward: transcription enters a new era. Cell 157, 13–25. [DOI] [PMC free article] [PubMed] [Google Scholar]
- Li H and Durbin R (2009). Fast and accurate short read alignment with Burrows-Wheeler Transform. Bioinformatics 14, 1754–60 [DOI] [PMC free article] [PubMed] [Google Scholar]
- Li J, Dong A, Saydaminova K, Chang H, Wang G, Ochiai H, Yamamoto T, and Pertsinidis A (2019). Single-Molecule Nanoscopy Elucidates RNA Polymerase II Transcription at Single Genes in Live Cells. Cell 178, 491–506 e428. [DOI] [PMC free article] [PubMed] [Google Scholar]
- Li H, Handsaker B, Wysoker A, Fennell T, Ruan J, Homer N, Marth G, Abecasis G, Durbin R and 1000 Genome Project Data Processing Subgroup (2009) The Sequence alignment/map (SAM) format and SAMtools. Bioinformatics, 25, 2078–9 [DOI] [PMC free article] [PubMed] [Google Scholar]
- Lu H, Yu D, Hansen AS, Ganguly S, Liu R, Heckert A, Darzacq X, and Zhou Q (2018). Phase-separation mechanism for C-terminal hyperphosphorylation of RNA polymerase II. Nature 558, 318–323. [DOI] [PMC free article] [PubMed] [Google Scholar]
- Lu MF, Cheng HT, Kern MJ, Potter SS, Tran B, Diekwisch TG, and Martin JF (1999a). prx-1 functions cooperatively with another paired-related homeobox gene, prx-2, to maintain cell fates within the craniofacial mesenchyme. Development 126, 495–504. [DOI] [PubMed] [Google Scholar]
- Lu MF, Cheng HT, Lacy AR, Kern MJ, Argao EA, Potter SS, Olson EN, and Martin JF (1999b). Paired-related homeobox genes cooperate in handplate and hindlimb zeugopod morphogenesis. Developmental biology 205, 145–157. [DOI] [PubMed] [Google Scholar]
- Maltecca F, Filla A, Castaldo I, Coppola G, Fragassi NA, Carella M, Bruni A, Cocozza S, Casari G, Servadio A, et al. (2003). Intergenerational instability and marked anticipation in SCA-17. Neurology 61, 1441–1443. [DOI] [PubMed] [Google Scholar]
- Manders EMM, Verbeek FJ, and Aten JA (1993). Measurement of co-localization of objects in dual-colour confocal images. Journal of Microscopy 169, 375–382. [DOI] [PubMed] [Google Scholar]
- Mastushita M, Kitoh H, Subasioglu A, Kurt Colak F, Dundar M, Mishima K, Nishida Y, and Ishiguro N (2015). A Glutamine Repeat Variant of the RUNX2 Gene Causes Cleidocranial Dysplasia. Mol Syndromol 6, 50–53. [DOI] [PMC free article] [PubMed] [Google Scholar]
- Mathelier A, Zhao X, Zhang AW, Parcy F, Worsley-Hunt R, Arenillas DJ, Buchman S, Chen CY, Chou A, Ienasescu H, et al. (2014). JASPAR 2014: an extensively expanded and updated open-access database of transcription factor binding profiles. Nucleic acids research 42, D142–147. [DOI] [PMC free article] [PubMed] [Google Scholar]
- Meyer K, Kirchner M, Uyar B, Cheng JY, Russo G, Hernandez-Miranda LR, Szymborska A, Zauber H, Rudolph IM, Willnow TE, et al. (2018). Mutations in Disordered Regions Can Cause Disease by Creating Dileucine Motifs. Cell 175, 239–253 e217. [DOI] [PubMed] [Google Scholar]
- Mitchell PJ, and Tjian R (1989). Transcriptional regulation in mammalian cells by sequence-specific DNA binding proteins. Science 245, 371–378. [DOI] [PubMed] [Google Scholar]
- Molliex A, Temirov J, Lee J, Coughlin M, Kanagaraj AP, Kim HJ, Mittag T, and Taylor JP (2015). Phase separation by low complexity domains promotes stress granule assembly and drives pathological fibrillization. Cell 163, 123–133. [DOI] [PMC free article] [PubMed] [Google Scholar]
- Mundlos S, Otto F, Mundlos C, Mulliken JB, Aylsworth AS, Albright S, Lindhout D, Cole WG, Henn W, Knoll JH, et al. (1997). Mutations involving the transcription factor CBFA1 cause cleidocranial dysplasia. Cell 89, 773–779. [DOI] [PubMed] [Google Scholar]
- Muragaki Y, Mundlos S, Upton J, and Olsen BR (1996). Altered growth and branching patterns in synpolydactyly caused by mutations in HOXD13. Science 272, 548–551. [DOI] [PubMed] [Google Scholar]
- Nakamura K, Jeong SY, Uchihara T, Anno M, Nagashima K, Nagashima T, Ikeda S, Tsuji S, and Kanazawa I (2001). SCA17, a novel autosomal dominant cerebellar ataxia caused by an expanded polyglutamine in TATA-binding protein. Human molecular genetics 10, 1441–1448. [DOI] [PubMed] [Google Scholar]
- Neubuser A, Koseki H, and Balling R (1995). Characterization and developmental expression of Pax9, a paired-box-containing gene related to Pax1. Developmental biology 170, 701–716. [DOI] [PubMed] [Google Scholar]
- Nihongaki Y, Yamamoto S, Kawano F, Suzuki H, and Sato M (2015). CRISPR-Cas9-based photoactivatable transcription system. Chem Biol 22, 169–174. [DOI] [PubMed] [Google Scholar]
- O’Rourke MP, Soo K, Behringer RR, Hui CC, and Tam PP (2002). Twist plays an essential role in FGF and SHH signal transduction during mouse limb development. Developmental biology 248, 143–156. [DOI] [PubMed] [Google Scholar]
- Orlando DA, Chen MW, Brown VE, Solanki S, Choi YJ, Olson ER, Fritz CC, Bradner JE, and Guenther MG (2014). Quantitative ChIP-Seq normalization reveals global modulation of the epigenome. Cell reports 9, 1163–1170. [DOI] [PubMed] [Google Scholar]
- Orr HT, and Zoghbi HY (2007). Trinucleotide repeat disorders. Annu Rev Neurosci 30, 575–621. [DOI] [PubMed] [Google Scholar]
- Patel A, Lee HO, Jawerth L, Maharana S, Jahnel M, Hein MY, Stoynov S, Mahamid J, Saha S, Franzmann TM, et al. (2015). A Liquid-to-Solid Phase Transition of the ALS Protein FUS Accelerated by Disease Mutation. Cell 162, 1066–1077. [DOI] [PubMed] [Google Scholar]
- Patel A, Malinovska L, Saha S, Wang J, Alberti S, Krishnan Y, and Hyman AA (2017). ATP as a biological hydrotrope. Science 356, 753–756. [DOI] [PubMed] [Google Scholar]
- Peng K, Radivojac P, Vucetic S, Dunker AK, and Obradovic Z (2006). Length-dependent prediction of protein intrinsic disorder. BMC Bioinformatics 7, 208. [DOI] [PMC free article] [PubMed] [Google Scholar]
- Ramirez F, Ryan DP, Gruning B, Bhardwaj V, Kilpert F, Richter AS, Heyne S, Dundar F, and Manke T (2016). deepTools2: a next generation web server for deep-sequencing data analysis. Nucleic acids research 44, W160–165. [DOI] [PMC free article] [PubMed] [Google Scholar]
- Riback JA, Zhu L, Ferrolino MC, Tolbert M, Mitrea DM, Sanders DW, Wei MT, Kriwacki RW, and Brangwynne CP (2019). Composition dependent phase separation underlies directional flux through the nucleolus. BioRxiv, 10.1101/809210. [DOI] [PMC free article] [PubMed] [Google Scholar]
- Ross CA (2002). Polyglutamine pathogenesis: emergence of unifying mechanisms for Huntington’s disease and related disorders. Neuron 35, 819–822. [DOI] [PubMed] [Google Scholar]
- Ross CA, and Poirier MA (2004). Protein aggregation and neurodegenerative disease. Nat Med 10 Suppl, S10–17. [DOI] [PubMed] [Google Scholar]
- R Core Team. (2018). A language and environment for statistical computing. R Foundation for Statistical Computing; http://www.R-project.org/. [Google Scholar]
- Sabari BR, Dall’Agnese A, Boija A, Klein IA, Coffey EL, Shrinivas K, Abraham BJ, Hannett NM, Zamudio AV, Manteiga JC, et al. (2018). Coactivator condensation at super-enhancers links phase separation and gene control. Science. [DOI] [PMC free article] [PubMed] [Google Scholar]
- Saudou F, Finkbeiner S, Devys D, and Greenberg ME (1998). Huntingtin acts in the nucleus to induce apoptosis but death does not correlate with the formation of intranuclear inclusions. Cell 95, 55–66. [DOI] [PubMed] [Google Scholar]
- Schindelin J, Arganda-Carreras I, Frise E, Kaynig V, Longair M, Pietzsch T, Preibisch S, Rueden C, Saalfeld S, Schmid B, et al. (2012). Fiji: an open-source platform for biological-image analysis. Nature methods 9, 676–682. [DOI] [PMC free article] [PubMed] [Google Scholar]
- Schwarz GE (1978). Estimating the dimension of a model. Annals of Statistics. [Google Scholar]
- Sheth R, Barozzi I, Langlais D, Osterwalder M, Nemec S, Carlson HL, Stadler HS, Visel A, Drouin J, and Kmita M (2016). Distal Limb Patterning Requires Modulation of cis-Regulatory Activities by HOX13. Cell reports 17, 2913–2926. [DOI] [PMC free article] [PubMed] [Google Scholar]
- Shibata A, Machida J, Yamaguchi S, Kimura M, Tatematsu T, Miyachi H, Matsushita M, Kitoh H, Ishiguro N, Nakayama A, et al. (2016). Characterisation of novel RUNX2 mutation with alanine tract expansion from Japanese cleidocranial dysplasia patient. Mutagenesis 31,61–67. [DOI] [PubMed] [Google Scholar]
- Shin Y, Berry J, Pannucci N, Haataja MP, Toettcher JE, and Brangwynne CP (2017). Spatiotemporal Control of Intracellular Phase Transitions Using Light-Activated optoDroplets. Cell 168, 159–171 e114. [DOI] [PMC free article] [PubMed] [Google Scholar]
- Shin Y, and Brangwynne CP (2017). Liquid phase condensation in cell physiology and disease. Science 357. [DOI] [PubMed] [Google Scholar]
- Staby L, O’Shea C, Willemoes M, Theisen F, Kragelund BB, and Skriver K (2017). Eukaryotic transcription factors: paradigms of protein intrinsic disorder. Biochem J 474, 2509–2532. [DOI] [PubMed] [Google Scholar]
- Stampfel G, Kazmar T, Frank O, Wienerroither S, Reiter F, and Stark A (2015). Transcriptional regulators form diverse groups with context-dependent regulatory functions. Nature 528, 147–151. [DOI] [PubMed] [Google Scholar]
- Studier FW (2005). Protein production by auto-induction in high density shaking cultures. Protein Expr Purif 41,207–234. [DOI] [PubMed] [Google Scholar]
- Swinehart IT, Schlientz AJ, Quintanilla CA, Mortlock DP, and Wellik DM (2013). Hox11 genes are required for regional patterning and integration of muscle, tendon and bone. Development 140, 4574–4582. [DOI] [PMC free article] [PubMed] [Google Scholar]
- Truant R, Atwal RS, Desmond C, Munsie L, and Tran T (2008). Huntington’s disease: revisiting the aggregation hypothesis in polyglutamine neurodegenerative diseases. FEBS J 275, 4252–4262. [DOI] [PubMed] [Google Scholar]
- Villavicencio-Lorini P, Kuss P, Friedrich J, Haupt J, Farooq M, Turkmen S, Duboule D, Hecht J, and Mundlos S (2010). Homeobox genes d11-d13 and a13 control mouse autopod cortical bone and joint formation. The Journal of clinical investigation 120, 1994–2004. [DOI] [PMC free article] [PubMed] [Google Scholar]
- Wang J, Choi JM, Holehouse AS, Lee HO, Zhang X, Jahnel M, Maharana S, Lemaitre R, Pozniakovsky A, Drechsel D, et al. (2018). A Molecular Grammar Governing the Driving Forces for Phase Separation of Prion-like RNA Binding Proteins. Cell 174, 688–699 e616. [DOI] [PMC free article] [PubMed] [Google Scholar]
- Wheeler JR, Lee HO, Poser I, Pal A, Doeleman T, Kishigami S, Kour S, Anderson EN, Marrone L, Murthy AC, et al. (2019). Small molecules for modulating protein driven liquid-liquid phase separation in treating neurodegenerative disease. BioRxiv, 10.1101/721001. [DOI] [Google Scholar]
- Yoshida M, Hata K, Takashima R, Ono K, Nakamura E, Takahata Y, Murakami T, Iseki S, Takano-Yamamoto T, Nishimura R, et al. (2015). The transcription factor Foxc1 is necessary for Ihh-Gli2-regulated endochondral ossification. Nature communications 6, 6653. [DOI] [PubMed] [Google Scholar]
- Yu G, Wang LG, Han Y, and He QY (2012). clusterProfiler: an R package for comparing biological themes among gene clusters. OMICS 16, 284–287. [DOI] [PMC free article] [PubMed] [Google Scholar]
- Zamudio AV, Dall’Agnese A, Henninger JE, Manteiga JC, Afeyan LK, Hannett NM, Coffey L, Li CH, Oksuz O, Sabari BR, et al. (2019). Mediator Condensates Localize Signaling Factors to Key Cell Identity Genes. Molecular cell. [DOI] [PMC free article] [PubMed] [Google Scholar]
- Zhang P, Jimenez SA, and Stokes DG (2003). Regulation of human COL9A1 gene expression. Activation of the proximal promoter region by SOX9. J Biol Chem 278, 117–123. [DOI] [PubMed] [Google Scholar]
- Zhang Y, Liu T, Meyer CA, Eeckhoute J, Johnson DS, Bernstein BE, Nusbaum C, Myers RM, Brown M, Li W, et al. (2008). Model-based analysis of ChIP-Seq (MACS). Genome biology 9, R137. [DOI] [PMC free article] [PubMed] [Google Scholar]
- Zhao Q, Eberspaecher H, Lefebvre V, and De Crombrugghe B (1997). Parallel expression of Sox9 and Col2a1 in cells undergoing chondrogenesis. Dev Dyn 209, 377–386. [DOI] [PubMed] [Google Scholar]
- Zoghbi HY, and Orr HT (2000). Glutamine repeats and neurodegeneration. Annu Rev Neurosci 23, 217–247. [DOI] [PubMed] [Google Scholar]
Associated Data
This section collects any data citations, data availability statements, or supplementary materials included in this article.
Supplementary Materials
Figure S1. HOXD13 forms condensates. Related to Figure 1.
(A) HOXD13 Immunofluorescence (IF) using the indicated antibody in E12.5 mouse limb bud cells.
(B) HOXD13 Immunofluorescence using the indicated antibody in human neuroblastoma cell lines Kelly and SH-SY5Y.
(C) Western blot analysis of HOXD13 protein levels in mouse limb bud, Kelly and SH-SY5Y cells. HSP90 was used as a loading control.
(D) Expression level of the mCherry-CRY2 and HOXD13 IDR-mCherry-CRY2 fusion proteins in cells used in the optoDroplet experiments displayed in Figure 1F–G. The expression level was quantified as the mean fluorescence intensity of mCherry in the cells expressing the fusion proteins at time point 0 (i.e. before the 488nm laser stimulation). r denotes a Pearson’s correlation coefficient.
(E) The expression level of the HOXD13 IDR-mCherry-CRY2 fusion protein correlates with droplet formation in HEK-293T cells. Plotted is the fraction of the cytoplasmic area occupied by HOXD13 IDR-mCherry-CRY2 droplets after 3 minutes of 488nm laser excitation at every 20s versus the mean expression of the fusion protein at time point 0 (i.e. before the 488nm laser stimulation). r denotes a Pearson’s correlation coefficient.
(F) Time lapse images of live HEK-293T cells expressing HOXD13 IDR-mCherry-CRY2 fusion protein before, during and after photobleaching. The bleached droplet is highlighted with a red box, and a zoom-in version of the box is displayed below at higher temporal resolution.
Fig. S2. Synpolydactyly-associated repeat expansions enhance HOXD13 IDR phase separation in HEK293T cells. Related to Figure 2, 4.
(A) Expression level of the HOXD13 wt IDR mCherry-CRY2 and HOXD13 +7A IDR mCherry-CRY2 fusion proteins in cells used in the optoDroplet experiments displayed in Figure 2C–D. The expression level was quantified as the mean fluorescence intensity of mCherry in the cells expressing the fusion proteins at time point 0 (i.e. before the 488nm laser stimulation).
(B) Images of nuclei of live HEK-239T cells expressing HOXD13 IDR-mCherry-CRY2 fusion proteins. The +8A and +9A IDRs form spontaneous nuclear bodies, whereas the spontaneously formed +14 IDR bodies appear cytosolic.
(C) The formation of light induced +7A and +8A HOXD13 IDR droplets is reversible. Displayed are images of live HEK-239T nuclei expressing HOXD13 +7A IDR mCherry-CRY2 and HOXD13 +8A IDR mCherry-CRY2 fusion proteins, before, at and after a 30s pulse of 488nm laser stimulation.
(D) Spontaneously formed HOXD13 +8A IDR bodies incorporate the HOXD13 +7A IDR more readily than the HOXD13 wt IDR, and exclude MED1 IDR and YFP alone. Displayed are representative images of live HEK-293T nuclei expressing the indicated fusion proteins.
(E) Quantification of fluorescence intensity of HOXD13 +7A IDR-YFP, HOXD13 wt IDR-YFP, MED1 IDR-YFP and YFP within spontaneously formed HOXD13 +8A IDR bodies.
Fig. S3. +7A repeat expansion has negligible effect on HOXD13 DNA binding. Related to Figure 4.
(A) Number of HOXD13 puncta in in mouse limb bud cells (displayed in Figure 4C–D) with or without treatment with 6% 1,6-hexanediol for 1min.
(B) Mean fluorescence signal intensity in HOXD13 puncta in in mouse limb bud cells (displayed in Figure 4C–D). P value is from a Student’s t test.
(C) ChIP-Seq binding profile of wild type (wt) and +7A repeat-expanded HOXD13 at the Hoxa cluster locus in Chicken ChMM cells.
(D) Read density of wt and mutant HOXD13 binding at the union of the binding peaks detected in the wt and mutant HOXD13 ChIPs.
(E) Heatmap representation of the read density of wt and mutant HOXD13 binding at the union of the binding peaks detected in the wt and mutant HOXD13 ChIPs. The binding peak +/− 3kb is displayed, centered on the binding peak. The regions are ranked according to signal in the wt sample (top: high, bottom: low signal).
Figure S4. Summary statistics of the scRNA-Seq data, and cluster characterization. Related to Figure 5.
(A) Summary statistics of the scRNA-Seq data for the 11 clusters of the reference cell state map.
(B) Expression features of marker genes in the clusters of the wt reference cell state map. The 11 clusters were assigned to cell states based on marker genes described in the Methods section. Displayed are the expression levels of a subset of marker genes in the individual clusters as a dot plot. The size of the dot is proportional to the total level of expression of the gene in the individual clusters, and the color of the dot is scaled to the proportion of cells within the individual clusters in which the expression of the gene is detected.
(C) (top left) Visualization of the wild-type scRNA-seq data using t-distributed Stochastic Neighbor Embedding (t-SNE). (rest) Gene expression changes in spdh cells versus wild type cells within the individual clusters. Plotted are the average expression values of all genes detected in each cluster in spdh cells (y-axis) versus wt cells (x-axis). The respective marker genes in each cluster are highlighted in blue.
Figure S5. Characterization of cell state and gene expression changes in the spdh limb bud. Related to Figure 5.
(A) Scheme of the workflow of an alternative analytical strategy to identify changes in the proportion of cell types in spdh limb buds. scRNA-Seq profiles of both wt and spdh cells were pooled, Hoxd13-expressing cells were selected, and the combined Hoxd13-expressing cells were clustered as described in the Methods.
(B) Visualization of the combined scRNA-seq data using t-distributed Stochastic Neighbor Embedding (t-SNE). Clusters identified in the combined data are highlighted in the left plot. Wild type cells only (middle) and spdh cells only (right) are highlighted in the t-SNE plot. The arrowhead highlights Cluster 9, which predominantly consists of wt cells, and is largely absent in the spdh limb bud.
(C) The marker genes of Cluster 9 in the combined map have a substantial overlap with the marker genes in the interdigital mesenchyme cells (Cluster 4) identified in the wild type reference cell state map. Displayed is a radar plot, where each arm in the radar represents the overlap between the marker genes of Cluster 9 in the combined map, with the marker genes in the clusters identified in the wild type reference cell state map.
(D) Profiles of Capture C, HOXD13 ChIP-Seq and scRNA-Seq data at the Msx2, Msx1, Hoxd13-Hoxd12 and Sall1 loci. The topologically associating domain (TAD) at the locus is denoted by a black bar above the Capture C profile. The mean expression value in spdh (red) and wt cells (blue) within each cluster are also displayed.
(E) Bar chart displaying the percentage of TADs that contain at least one gene dysregulated in Cluster 4 which also contain a HOXD13 binding peak (80/82 TADs), and the percentage of TADs that contain at least one gene that also contain a HOXD13 binding peak (2,755/3,562 TADs).
(F) The observed number of TADs that contain at least one gene dysregulated in Cluster 4 and a HOXD13 binding peak is significantly greater than the number of randomly permutated TADs containing a HOXD13 binding peak. 82 TADs were randomly selected 1000 times out of the 3,562 TADs, and the y-axis shows the number of permutations in which the % of TADs denoted on the x-axis contained at least one HOXD13 ChIP-Seq binding peak. The empirical P value is 0.
(G) (left) Distribution of the distance between the transcription start site (TSS) of the 84 genes dysregulated in Cluster 4 and the nearest HOXD13 ChIP-Seq peak. The median distance is highlighted by a red line. (right) Distribution of the distance between the transcription start site (TSS) of the 84 randomly selected genes and the nearest HOXD13 ChIP-Seq peak. The distance calculation was iterated 1000 times. The median distance is highlighted by a blue line.
Figure S6. The HOXA13 IDR, the RUNX2 IDR and the TBP IDR form condensates. Related to Figure 6.
(A, E, L) Amino acid composition of human HOXA13, RUNX2 and TBP. Ticks represent amino acids indicated on the y-axis at the positions indicated on the x-axis. The cloned IDR is highlighted with a purple bar.
(B, F, M) Expression level of the indicated fusion proteins in cells used in the optoDroplet experiments displayed in Figure 6B, 6K, 6T. The expression level was quantified as the mean fluorescence intensity of mCherry in the cells expressing the fusion proteins at time point 0 (i.e. before the 488nm laser stimulation).
(C, G, N) The expression level of the TF IDR-mCherry-CRY2 fusion proteins correlates with droplet formation in HEK-293T cells. Plotted is the fraction of the nuclear area occupied by TF IDR-mCherry-CRY2 droplets after 3 minutes of 488nm laser excitation at every 20 seconds versus the mean expression of the fusion protein at time point 0 (i.e. before the 488nm laser stimulation). r denotes a Pearson’s correlation coefficient.
(D, H) Representative images of HEK-293T nuclei expressing the indicated TF IDR-mCherry-CRY2 fusion proteins. Cells were stimulated with 488nm laser every 20s for 3 minutes. Note the emergence of light-induced droplets in the HOXA13 +7A IDR-mCherry-CRY2 –expressing cells, and the RUNX2 +10A IDR-mCherry-CRY2 –expressing cells.
(I) TBP Immunofluorescence (IF) in E12.5 mouse limb bud cells.
(J) Representative images of droplet formation by purified TBP-mCherry and mCherry at the indicated concentrations in droplet formation buffer.
(K) Phase diagram of TBP-mCherry in the presence of different concentrations of PEG-8000. The size of the circles is proportional to the size of droplets detected in the respective buffer conditions.
Figure S7. Molecular characterization of human TF IDRs. Related to Figure 7.
(A) The classification tool efficiently separates human TF DBDs from IDRs. The circle depicts the annotation of the respective input protein sequence as a DBD or an IDR.
(B) The classification tool efficiently separates human TF DBDs families. The inner circle depicts the output of the classification (4 Clusters), and the outer circle depicts the annotation of DBDs of the respective input protein sequence.
(C) Screeplot showing the contribution of each principal component (PC) to the variance. The cumulative variance is depicted with a red curve.
(D) Bayesian information criterion (BIC) plot for various values of “k” tested in the IDR clustering analyses. The optimal cluster number (k=7) was selected as the value at the inflection point of the BIC curve.
(E) Contribution of features (parameters) to the clustering of the individual TF IDR clusters. Features are highlighted in red/blue when statistically significant enrichment/depletion (Kolmogorov–Smirnov test) of a feature in a cluster compared to all other clusters was detected. The color code is proportional to +/− log10(P value).
(F) Expression level of the HOXD13 IDR-mCherry-CRY2 fusion proteins in cells used in the optoDroplet experiments displayed in Figures 7E–F. The expression level was quantified as the mean fluorescence intensity of mCherry in the cells expressing the fusion proteins at time point 0 (i.e. before the 488nm laser stimulation).
(G) Dependence of droplet formation on expression level. The expression levels of the HOXD13 wt IDR-mCherry-CRY2, and HOXD13 DEdel IDR-mCherry-CRY2 fusion proteins correlate with droplet formation in HEK-293T cells. Plotted is the fraction of the nuclear area occupied by the HOXD13 IDR-mCherry-CRY2 droplets after 3 minutes of 488nm laser excitation at every 20s versus the mean expression of the fusion protein at time point 0 (i.e. before the 488nm laser stimulation). r denotes a Pearson’s correlation coefficient.
(H) Luciferase reporter activity of the indicated TF IDRs fused to GAL4-DBD.
Table S1. Plasmids used in the study. Related to STAR Methods
The table contains information on the plasmids used in this study.
Table S2. Marker genes in the 11 cell clusters. Related to STAR Methods
List of marker genes identified in the 11 clusters of the wild type reference cell state map of mouse E12.5 limb.
Table S3. Differentially expressed genes in spdh vs. wild type cells in the 11 cell clusters. Related to STAR Methods
List of genes differentially expressed between wild type and spdh cells in the 11 clusters.
Table S4. Genomic coordinates of HOXD13 ChIP-Seq data and TADs. Related to STAR Methods
A. Genomic coordinates of ChIP-Seq binding peaks
The table contains the genomic co-ordinates of HOXD13 ChIP-Seq binding peaks in wild type mouse limb. Coordinates belong to the mm9 mouse genome assembly.
B. Genomic coordinates of Topologically Associating Domains (TADs)
Bed file containing the genomic coordinates of Topologically Associating Domains (TADs) in wild type mouse limb. Coordinates belong to the mm9 mouse genome assembly.
Table S5. List of GO terms associated with genes dysregulated in spdh vs wild type cell clusters. Related to STAR Methods
List of all Gene Ontology terms associated with the sets of genes differentially expressed between wild type and spdh cells in the 11 cell clusters.
Table S6. Cluster 4 dysregulated genes that were used as viewpoints in the Capture C data, and information on HOXD13 peaks around those genes within the TAD. Related to STAR Methods
List of genes differentially expressed between wild type and spdh cells in cluster 4 (interdigital mesenchymal cells), the co-ordinates of TADs and HOXD13 peaks within the same TAD.
Table S7. Catalog of TF IDRs, DBDs. Related to STAR Methods
List of IDRs and DBDs in human TFs, and enrichment of TFs whose IDRs belong to the IDR clusters for gene ontology, functional and phenotypic characteristics.
Data Availability Statement
All next generation sequencing data generated in the study were deposited at the Gene Expression Omnibus (GEO) under the accession number GSE128818.
Original data including all raw microscopy images were deposited at Mendeley Data (https://data.mendeley.com/) under doi: 10.17632/ztd6wzcv7h.1
Code supporting the study were deposited at Github (https://github.com/hniszlab/hoxd13). Code for droplet visualization is available at https://github.com/BasuShaon/ChemicalBiology.