Abstract
Topic:
Determining the natural history of unifocal versus multifocal geographic atrophy (GA) secondary to non-exudative age-related macular degeneration.
Clinical Relevance:
The association between GA focality (i.e., unifocal versus multifocal lesions) and enlargement rate is inconsistent in the literature, with some studies reporting a comparable growth rate between unifocal and multifocal GA, whereas others suggesting the growth rate varies widely between the 2 groups.
Methods:
We searched 5 literature databases up to May 3rd, 2019 for studies that classified treatment-naïve GA patients based on lesion focality. We performed random effects meta-analysis to determine the growth rates of GA. To account for different entry times among cohorts, we introduced a horizontal translation factor to the dataset of each cohort. Heterogeneity and study quality were assessed using I2 statistic and Quality In Prognosis Studies tool, respectively. Publication bias was evaluated by funnel plots and the Egger test.
Results:
We included 12 studies with 3489 eyes from 3001 patients. After the introduction of translation factors, the effective radius of unifocal and multifocal GA enlarged linearly over approximately 7 years. The effective radius growth rate of multifocal GA (0.199 ± 0.012 mm/year) was 46.3% higher than the growth rate of unifocal GA (0.136 ± 0.008 mm/years) (P < 0.001). Interestingly, unifocal and multifocal GA lesions with the same total baseline area grew at vastly different rates, with an estimated ratio of the growth rate as 1.46 (between and ). This difference disappeared after we accounted for different baseline total perimeter between unifocal and multifocal groups. The measured GA growth rate was consistent across studies using color fundus photography, fundus autofluorescence, or optical coherence tomography (P = 0.35–0.99).
Conclusions:
The effective radius of GA enlarges linearly and steadily over time in both unifocal and multifocal GA. The lesion focality is a significant prognostic factor for the GA effective radius growth rate. We propose that the growth rate of GA area is directly proportional to the total lesion perimeter (a measure of the number of retinal pigment epithelium cells exposed at the lesion border). Additional studies are needed to understand the cellular mechanisms underlying this relationship.
Précis
The progression rate of multifocal geographic atrophy (0.199±0.012 mm/year) is 46.3% higher than the growth rate of unifocal geographic atrophy (0.136±0.008 mm/year). The GA growth rate was consistent across different imaging modalities.
Geographic atrophy (GA) is an advanced stage of nonexudative age-related macular degeneration (AMD) that is characterized by progressive degeneration of photoreceptors, retinal pigment epithelium (RPE), Bruch membrane, and choriocapillaris, occurring in the setting of extensive and characteristic extracellular deposits.1, 2 GA affects roughly 1 million patients in the United States and 6 million people worldwide.3–5 Although no pharmaceutical regulatory agency in Europe, the United States, or Japan has approved any therapies for reversing or slowing the progression of GA,6, 7 many clinical trials are ongoing to investigate new treatment options (www.clinicaltrials.gov).8
Many studies have classified GA into 2 groups based on lesion focality: unifocal (defined as a single atrophic lesion in the eye) or multifocal (defined as 2 or more atrophic lesions in the eye).9–19 Currently, there is conflicting evidence in the literature regarding whether multifocal GA is a more severe form of the disease than unifocal GA. Many studies found that the area of unifocal GA was more than 20% larger than the total area of multifocal GA at the time of study enrollment,9, 11, 14, 16, 19 while several other studies reported the opposite findings.10, 18 Moreover, although the growth rate of multifocal GA area was significantly higher than the growth rate of unifocal GA in several studies,10, 12–15, 17, 18 2 other studies suggest that the growth rates of unifocal and multifocal GA area were comparable.9, 19 For example, Yehoshua et al reported that the area growth rate of multifocal GA was 1.25 mm2/year, comparable to the growth rate of unifocal GA (1.05 mm2/year; P = 0.34). Allingham et al reported that the area growth rates of unifocal and multifocal GA were both 1.68 mm2/year (P = 0.89). Additionally, the reported mean growth rate of GA area varies widely from 0.30 to 1.88 mm2/year in unifocal GA and from 0.90 to 2.47 mm2/year in multifocal GA,12, 15 indicating an unclear clinical significance of lesion focality in predicting the growth rate of GA.
Several other aspects of the natural history of unifocal and multifocal GA also remain unclear. First, since the duration of follow-up in many previous studies is relatively short (1–2 years),9, 11, 12, 15, 17–19 it is unknown if the progression rate of unifocal and multifocal GA is steady or varying dramatically over longer periods of time. Second, it is yet to be determined if unifocal and multifocal GA share the same pattern of progression. For example, Monés and Biarnés report that the square root growth rate of unifocal GA is independent of the baseline lesion size (P = 0.50), but the square root growth rate of multifocal GA is negatively associated with the baseline lesion size (P = 0.002).16 This result may imply 2 different GA expansion patterns or even different underlying progression mechanisms between the 2 groups.10 Third, it is still unclear why multifocal GA may progress faster than unifocal GA. One hypothesis is that multifocal GA is at a later and more advanced stage of the disease compared with unifocal GA.20 Alternatively, morphological differences may solely explain the apparent difference between the growth rate of unifocal and multifocal GA.10, 20, 21
In the present study, we performed a systematic review and meta-analysis to address the inconsistency in clinical data and investigate the remaining questions, We tested the hypothesis that unifocal and multifocal GA have the same progression pattern with distinct growth rates. In addition to using the progression rate of GA area as the outcome measure, we chose the effective radius growth rate of GA as another outcome measure because it has been found to be constant over time in our previous meta-analysis of 25 studies including 2942 eyes22 with other studies showing similar results.17, 19, 23 We also investigated the impact of different imaging modalities, including color fundus photography (CFP), fundus autofluorescence (FAF), and optical coherence tomography (OCT), on the measured GA growth rate within the unifocal and multifocal groups.
Methods
This meta-analysis is reported in accordance with the Meta-analysis of Observational Studies in Epidemiology checklist (Table 1, available at http://www.ophthalmology-retina.org).24 The study adhered to the tenets of the Declaration of Helsinki. Because this is a systematic review article with meta-analysis of published studies and did not involve human subjects, no informed consent from patients was needed.
Sources and Search Methods
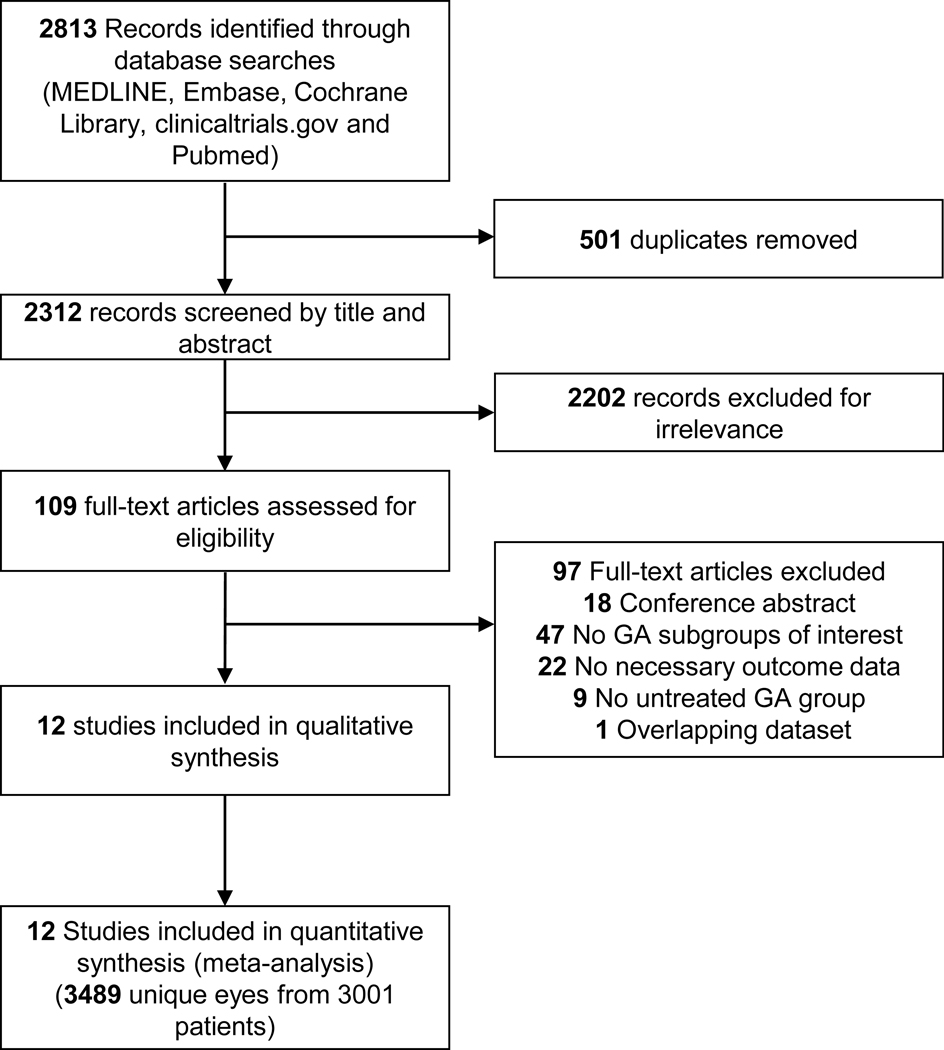
A senior medical librarian (H.K.G.N.) performed a comprehensive search of multiple databases for relevant studies: MEDLINE, EMBASE, Cochrane Library (Wiley), clinicaltrials.gov, and NLM PubMed from the start dates of the databases. All searches were updated up to May 3rd, 2019. We did not restrict the study type, language, or published date. The search strategy is detailed in Appendix 1 (available at http://www.ophthalmology-retina.org). A flowchart per Preferred Reporting Items for Systematic Reviews and Meta-Analyses (PRISMA) is in Figure 1 (available at http://www.ophthalmology-retina.org).
Figure 1.
Preferred reporting items for systematic reviews and meta-analyses (PRISMA) flowchart of identification and screening of studies. GA = geographic atrophy.
Selection Criteria
The inclusion criteria for our meta-analysis are: (1) included patients diagnosed of GA secondary to nonexudative AMD in at least 1 eye without any ocular treatment intended to slow or halt atrophy progression, (2) classified the affected eyes with GA into groups based on unifocal or multifocal lesions, and (3) reported GA lesion sizes on at least 2 occasions at least 6 months apart in each group. In the present study, we defined a unifocal GA as a single GA lesion in 1 eye regardless of the shape of the lesion, and a multifocal GA as more than 1 GA lesions in 1 eye. For publications with an overlapping patient population, we selected the articles with the largest and most recent dataset. For interventional studies that investigated the GA progression in both control and treatment (i.e., ocular treatment designed to slow or halt atrophy progression) groups, we only included that patient population in the control/sham group.12, 17 We did not exclude patients taking oral vitamins and minerals supplements from the analysis because previous reports have shown that the supplements did not affect the GA progression rate,13, 25 and patients with advanced AMD in 1 eye are sometimes advised to take supplements to protect the fellow eye.26
Data Collection
At least 2 out of 4 reviewers independently screened each publication record found in the literature search, and we resolved disagreements through discussions. For each included study, 2 reviewers (L.L.S. and M.S.) independently extracted the data regarding 1) study quality; 2) demographic characteristics of the study population; 3) the mean and standard error (SE) of the total GA size (in area and effective radius) and growth rates (in area and effective radius growth rate per year). For studies that used both CFP and FAF imaging modalities to measure the GA size, we used the data from FAF due to relatively higher image contrast.18, 27 For studies that did not report baseline GA lesion size, we contacted the corresponding authors in the studies to obtain the data. For studies that reported GA sizes in multiple subgroups that all met our definition of unifocal (i.e., a single atrophic lesion in the eye) or multifocal (i.e., 2 or more lesions in the eye) group, we calculated the weighted mean and SE of the data (by the number of eyes) as the GA size in the corresponding group. Based on this definition, we classified a confluent multilocular lesion as unifocal GA. For example, we calculated the GA size data in the unifocal group in Klein et al as the weighted data in “Classic Single” and “Merged” subgroups reported in the study.14 The SE is used throughout the manuscript unless otherwise specified. While the data regarding the GA sizes at follow-ups are presented explicitly in some papers, extrapolation was necessary for other studies. For example, for studies that did not report the GA effective radius or effective radius growth rate, the following estimations were made. The mean GA effective radius of the study was calculated by The mean GA effective radius growth rate was calculated by where n is mean follow-up time (years), A is mean baseline area and G is reported mean annual GA area growth rate. The SE of the GA effective radius growth rate was calculated by where n is mean follow-up time (years); A and A1 is the mean and SE of baseline GA area, respectively; and G and G1 is mean and SE of reported annual GA area growth rate, respectively. This equation was derived from error propagations of the function: Other necessary extrapolation methods are detailed in Table 3 (available at http://www.ophthalmology-retina.org). Disparities between the reviewers were resolved through discussion and subsequent consensus.
Study Quality and Risk of Bias Assessment
Two reviewers (L.L.S. and M.S.) assessed the risk of bias and quality of each study using the Quality In Prognosis Studies (QUIPS) tool developed by Hayden et al.28 The QUIPS tool was suggested by the Cochrane Collaboration and allowed us to assess the risk of bias of prognosis studies in 6 bias domains: study participation, study attrition, prognostic factor measurement, outcome measurement, study confounding, and analysis and reporting (Table 2, available at http://www.ophthalmology-retina.org). The 2 reviewers resolved inconsistencies through discussion until agreements were reached.
We analyzed the publication bias of included studies using funnel plots, which plotted the SE versus mean GA effective radius growth rate in each group and plotted the SE versus the mean difference in GA effective radius growth rate between unifocal and multifocal groups. After visual inspection of the funnel plots, we conducted a funnel plot-based test (the Egger test) to assess the publication bias quantitatively.29
Data Synthesis and Statistical Analysis
We calculated the pooled mean and SE of the baseline GA size of unifocal and multifocal groups based on the mean and SE of baseline GA size in included studies weighted by the number of eyes. The primary outcome measure in our study was the GA effective radius growth rate expressed in mm/year. This was used because our prior meta-analysis demonstrated that the effective radius of a GA lesion increased linearly over time (GA lesion sizes ranged from 2.5 to 20.3 mm2).22 In addition, a few previous studies showed that using the square-root transformed GA area (equivalent to effective radius) reduced the dependence of GA growth rate on baseline lesion size.17, 19, 23 In the present paper, we also reported the conventional outcome measure, GA area growth rate expressed in mm2/year.
To determine and compare the GA growth rate between unifocal and multifocal GA groups, we performed random-effects meta-analysis using RevMan 5.3 software (The Cochrane Collaboration, Copenhagen, Denmark) and metafor package30 in R 3.5.1 (R Foundation for Statistical Computing, Vienna, Austria). Heterogeneity in meta-analysis refers to the inconsistency of the outcomes between studies, and we assessed the heterogeneity among different studies by calculating the I2 statistic in each random-effects meta-analysis.31 A low I2 would suggest minimal variation (i.e., high consistency) in the outcomes among different studies. We used the thresholds of I2 provided in the Cochrane handbook31 to aid interpretation of the I2 score: 0% to 40% (unimportant), 30% to 60% (moderate), 50% to 90% (substantial), and 75% to 100% (considerable). To investigate potential sources of heterogeneity in the effect sizes, we performed sensitivity analysis, subgroup analysis, and meta-regression analysis using the metafor package30 from R. We conducted the sensitivity analysis by removing 1 study at a time to assess whether a single study influenced the outcomes of the meta-analysis. We performed the subgroup analysis to investigate the impact of imaging modality (FAF, CFP, or OCT) and study types (retrospective observational, prospective observational, or prospective interventional) on the GA effective radius growth rates. We estimated the growth rates among the subgroups using random-effects meta-analysis and compared the growth rates of different subgroups using analog to the one-way analysis of variance.32 We performed univariate meta-regression using imaging modality and study types as the variables. We did not include additional variables in the analyses or perform multiple meta-regression analysis due to the concerns of overfitting and false-positives when the number of included studies in a meta-analysis was relatively small.31, 33
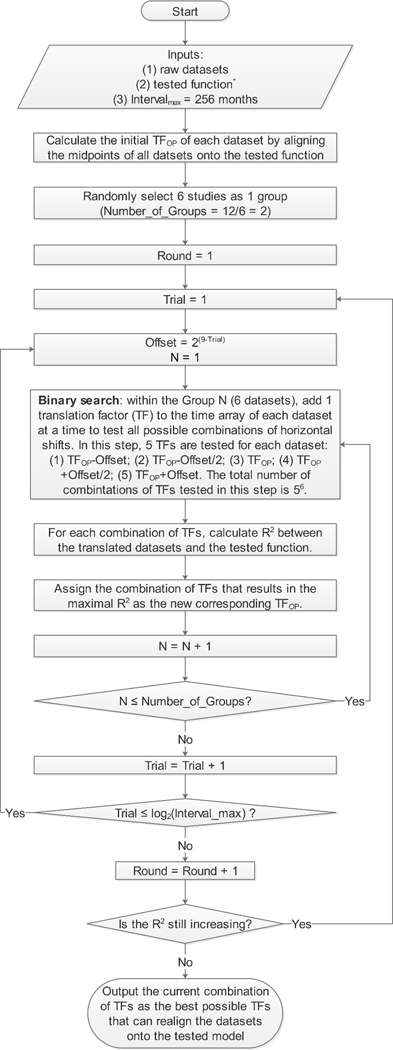
To investigate the hypothesis that the effective radius of GA lesions enlarges linearly as a function of time (i.e., radius linear model) in both unifocal and multifocal GA groups, we plotted the mean GA effective radius as a function of time after enrollment for each focality group in each study. However, our previous study showed that the mean baseline GA sizes usually varied widely among different studies,22 suggesting different cohorts might have entered the studies at different time points of the natural disease course. To correct for the differences in the patients’ entry times into the clinical studies, 22, 34–42 we used an “entry time realignment” method by adding a horizontal translation factor (in years) to each raw dataset to horizontally shift the datasets back to the natural disease onset. The translation factors represented the inferred duration of GA at baseline, and the introduction of translation factors essentially converted the horizontal axis from “time after enrollment” to “inferred duration of GA”, where [“inferred duration of GA” = “time after enrollment” + “translation factor”]. The general concept of datasets realignment had also been proposed and successfully implemented by a few other groups in vastly divergent fields.43–46 Since the true duration of disease for each dataset was unknown, we estimated the translation factors using 2 different approaches. In the first approach, we realigned the baseline visits of all datasets onto a straight line by simply assuming the baseline GA size was directly proportional to the duration of disease. In this realignment method, we calculated the translation factor for each dataset as baseline effective radius divided by the mean effective radius growth rate of the corresponding dataset (determined from the random-effects meta-analysis of unifocal and multifocal GA). In the second approach, we employed a novel optimal realignment algorithm that we developed previously22, 34–42 to automatically find the best possible combination of translation factors that could realign the datasets onto a linear regression with the highest r2. If the optimal realignment still does not follow a linear regression and has U-shaped or inverse U-shaped residual plot, the linear model would not be a good fit.22, 47 To find the optimal translation factors of datasets, we developed a custom MATLAB (The MathWorks, Inc, Natick, MA) based program and described the optimal realignment algorithm in a program flowchart (Figure 2, available at http://www.ophthalmology-retina.org). The program aimed to adjust 1 translation factor by 1 month at a time within a 40-year interval and repeated this process iteratively until the r2 was maximized for a cumulative trendline. In the present study, the trendline was predefined as a linear regression going through the origin with a slope of the effective radius growth rate estimated from the random-effects meta-analysis. Since this process was too computationally intensive (48010 possible combinations for 10 datasets), we employed a binary search method to narrow down the interval by half at a time until it was down to 1 month and then repeated the entire binary search until r2 no longer increased (Figure 2, available at http://www.ophthalmology-retina.org). After the optimal realignment of datasets, we examined the appropriateness of the linear regression model by analyzing the residual plots of the translated data in unifocal and multifocal groups. Data in each residual plot were generated by subtracting the predicted values in the cumulative trend lines from the observed data. A randomly dispersed residual plot would support the appropriateness of the linear regression in the group, while a U-shaped or inverse U-shaped residual plot would suggest a nonlinear model to be a better fit.47 Of note, the goal of the “entry time realignment” method was only to examine the long-term progression pattern of GA by determining the best possible realignment of datasets onto a hypothesized model. Since the calculated r2 may be higher than the true r2, we did not use this method to estimate the variations of GA growth rates. Instead, we estimated the variations using the random-effects meta-analysis.
Figure 2.
Flowchart of optimal realignment algorithm that searches for the best possible combination of horizontal translation factors that can realign datasets onto the tested model. The tested function for unifocal GA group is EffectiveRadius=0.136mm/yr×Time; and the tested function for multifocal GA groups is EffectiveRadius=0.199mm/yr×Time. The 2 slopes were predetermined from the random-effects meta-analyses in Figure 6, available at http://www.ophthalmology-retina.org. Of note, the program could be adapted to other research questions by changing the inputs and the tested function does not need to haveany predefined parameters (e.g., the slope).
Results
Overall Characteristics of Included Studies
The final search retrieved a total of 2312 records published before May 3rd, 2019 after de-duplication. After the review of the titles and abstracts, 2202 records were excluded for irrelevance to the topic. We then reviewed the full text of the remaining 109 articles and included 12 independent studies including 3489 unique eyes from 3001 patients meeting our inclusion criteria (see the PRISMA flowchart in Figure 1, available at http://www.ophthalmology-retina.org).9–19 We detailed the baseline characteristics of the included studies in Table 3 (available at http://www.ophthalmology-retina.org) and listed the excluded articles as well as the reasons for exclusions in Table 4 (available at http://www.ophthalmology-retina.org). Among the included 3489 eyes in the present study, 1824 eyes (52.3%) belonged to the unifocal GA group and 1665 eyes (47.7%) belonged to the multifocal GA group. At baseline, the weighted mean area of multifocal GA (6.29 ± 0.11 mm2) was 35.6% larger than the weighted mean area of unifocal GA (4.64 ± 0.10 mm2).
Study Quality and Risk of Bias
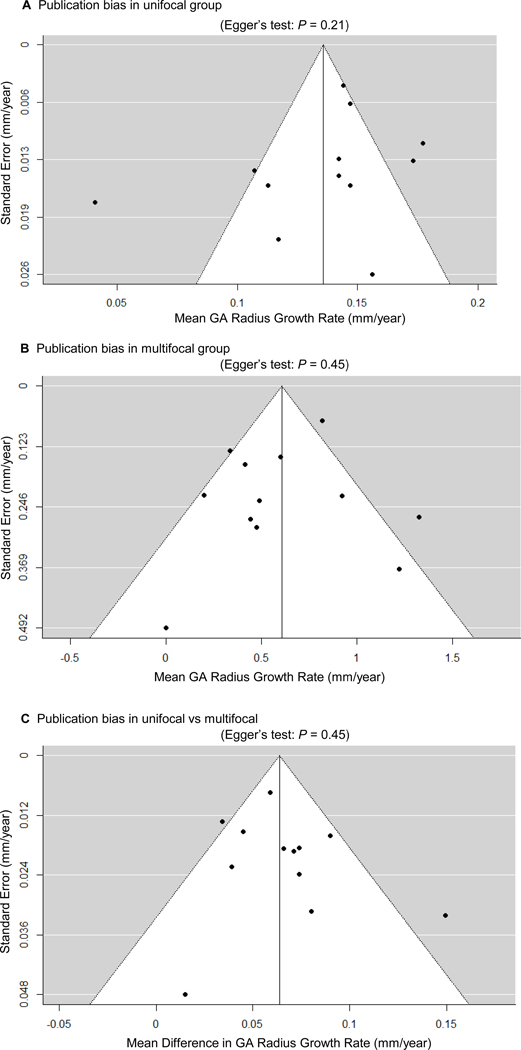
Table 5 (available at http://www.ophthalmology-retina.org) shows the results of the assessment for the risk of bias using the QUIPS tool.28 The included studies generally had good quality and low risk of bias. Of the 12 included studies, 7 studies were judged to have low risk of bias in all 6 bias domains, 2 studies were rated as having 1 domain with moderate risk of bias and 5 domains with low risk of bias, and 3 studies were assessed as having 2 domains with moderate risk of bias and 4 domain with low risk of bias. We did not find any evidence of publication bias in the GA effective radius growth rates in unifocal and multifocal groups or any evidence of publication bias in the mean difference between the 2 groups, as demonstrated by the symmetrical funnel plots and the Egger test (P = 0.21–0.45, shown in Figure 3, available at http://www.ophthalmology-retina.org).
Figure 3.
Publication biases as assessed by funnel plots and Egger’s test. Each circle represents a standard error at a given outcome measure in an included study. The vertical line represents the estimate of mean value of the outcome measure, and thediagonal lines are pseudo 95% confidence intervals. We did not find any evidence of significant publication bias in the reportedgrowth rate of GA in unifocal or multifocal group, or the reported difference in GA growth rate between unifocal and multifocal groups, as demonstrated by the symmetrical funnel plots and Egger’s test (P= 0.21, 0.45, and 0.45, respectively). GA = geographic atrophy.
The Growth Rates of Unifocal and Multifocal GA
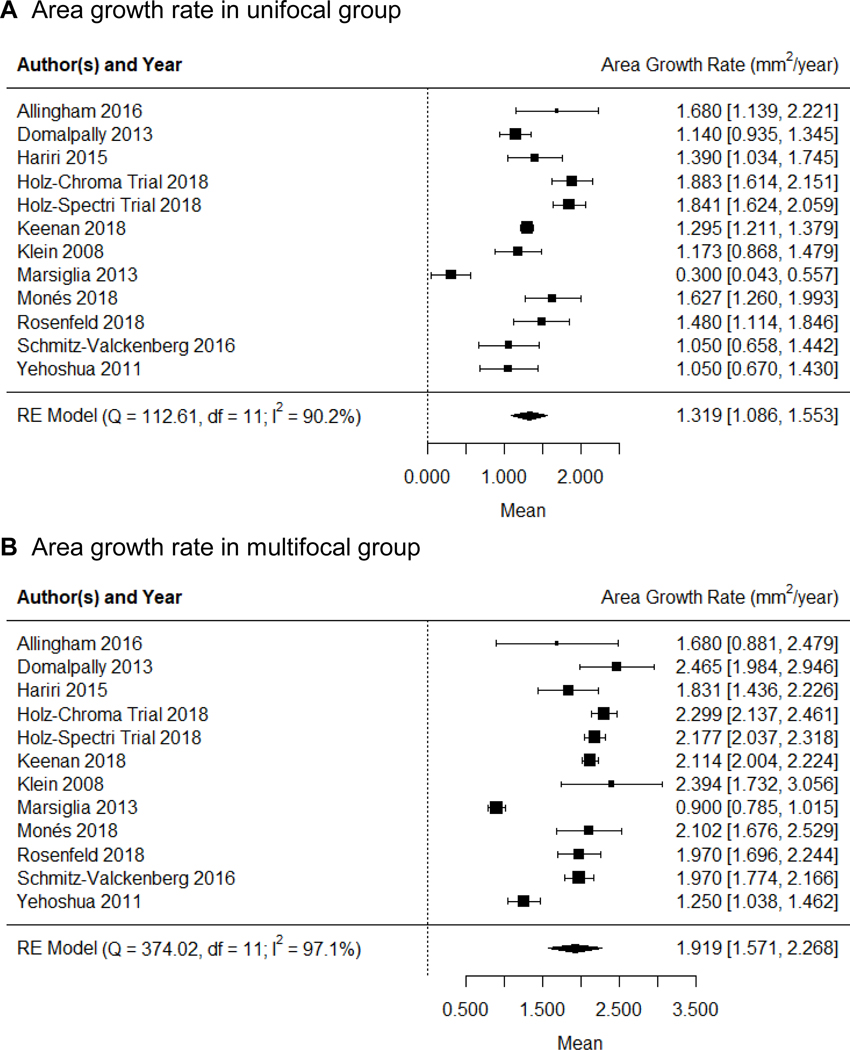
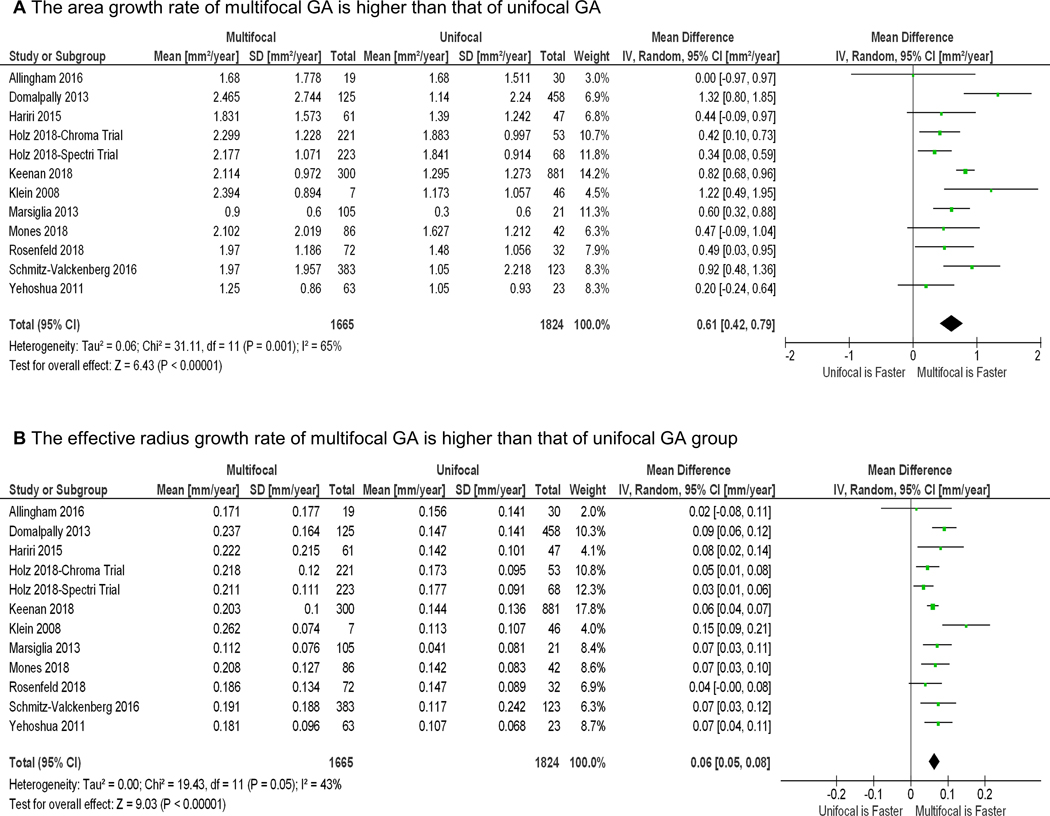
The forest plots showing the area growth rates (in mm2/year) in the unifocal and multifocal GA groups are in Figure 4, available at http://www.ophthalmology-retina.org. Figure 5A shows the comparison between the GA area growth rate between the 2 groups. We found that the GA area growth rate in the multifocal group (1.919 ± 0.178 mm2/year; Figure 4B) was 45.5% higher than the growth rate in the unifocal group (1.319 ± 0.119 mm2/year, Figure 4A) with P < 0.001 (Figure 5A). However, in our previous study as well as others,19, 22, 23 the GA area growth rate was found to be positively correlated with baseline lesion size.19, 22, 23 Since the baseline area of multifocal GA was larger than the baseline area of unifocal GA (Table 3, available at http://www.ophthalmology-retina.org), it was unclear if the observed difference in the GA area growth between unifocal and multifocal groups was simply due to the difference in the baseline lesion size.
Figure 4.
Random-effects meta-analysis assessing the growth rates of GA area in unifocal and multifocal groups. Each diamond represents the overall effect estimate for a group (width of the diamond represents the 95% CI). For each individual study, the square marker size is proportional to the weight used in meta-analyses, and the line represents the 95% CI. A, the GA area growth rate in unifocal group is 1.319 mm2/year (95% CI = 1.086 −1.553). B, the GA area growth rate in multifocal group is 1.919 mm2/year (95% CI = 1.571 −2.268]). CI = confidence interval; df = degree of freedom; RE = random-effects.
Figure 5.
Random-effects meta-analysis comparing unifocal and multifocal groups in the growth rates of geographic atrophy (GA) area and effective radius. The diamond represents the overall effect estimate for a comparison (width of the diamond represents the 95% CIs). For each individual study, the square marker size is proportional to the weight used in the meta-analysis, and the line represents the 95% CI. A, The GA area growth rate in the multifocal group is 0.606 mm2/year higher than the area growth rate in the unifocal group (P < 0.001). B, Similarly, the GA radius growth rate in the multifocal group is 0.064 mm/year higher than the radius growth rate in the unifocal group (P < 0.001). CI = confidence interval; df = degree of freedom; RE = random-effects.
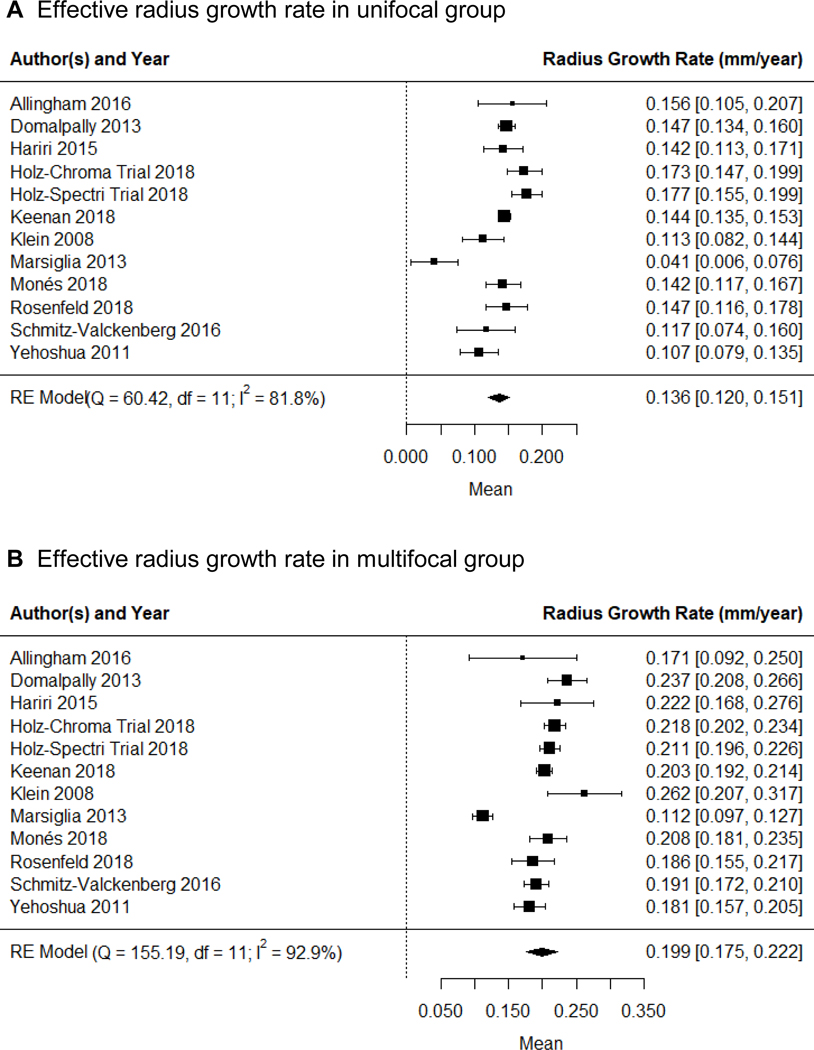
To better account for different baseline lesion sizes, we determined the growth rate in GA effective radius (i.e., square root of (total GA area/π))19, 22, 23 in both unifocal and multifocal groups using the random-effects meta-analysis (Figure 6, available at http://www.ophthalmology-retina.org). Similar to the above results, the GA effective radius growth rate in the multifocal group (0.199 ± 0.012 mm/year; Figure 6B) was 46.3% higher than the growth rate in the unifocal group (0.136 ± 0.008 mm/year; Figure 6A) with P < 0.001 (Figure 5B).
Figure 6.
Random-effects meta-analysis assessing the GA effective radius growth rates in unifocal and multifocal groups. Each diamond represents the overall effect estimate for a comparison (width of the diamond represents the 95% CIs). For each individual study, the square marker size is proportional to the weight used in meta-analyses, and the line represents the 95% CI. A, the GA radius growth rate in unifocal group is 0.136 mm/year (95% CI = 0.120 −0.151 mm/year). B, the GA radius growth rate in multifocal group is 0.199 mm2/year (95% CI = 0.175 −0.222 mm/year). CI, confidence interval; df, degree of freedom; RE = random-effects.
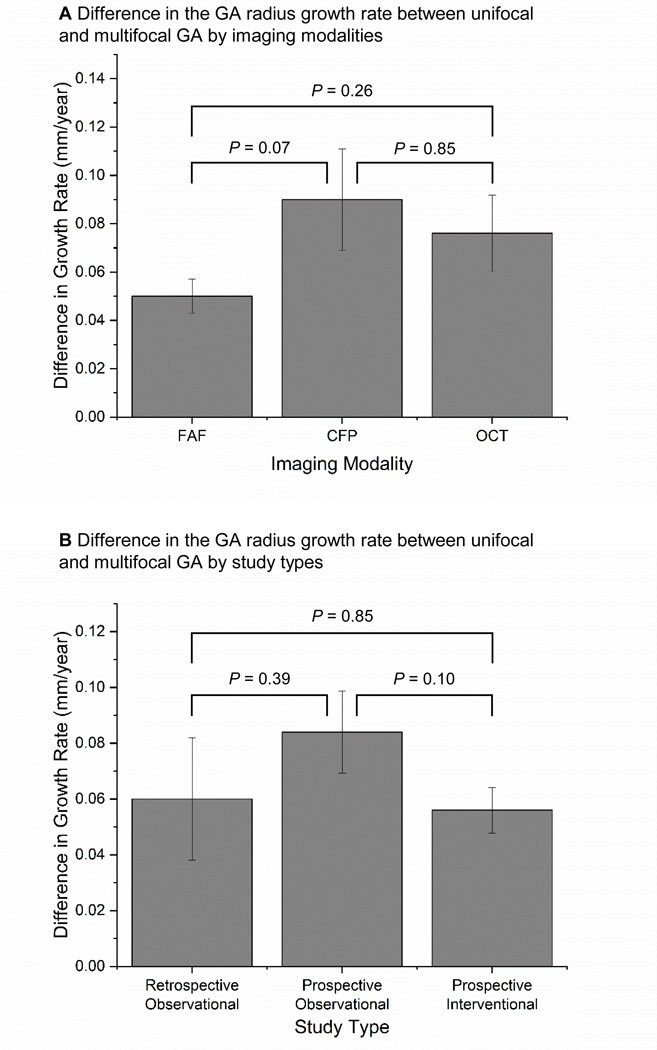
Among the included studies, we found moderate heterogeneity (I2 = 43%) in the reported difference of the GA effective radius growth rate between the unifocal and multifocal groups (Figure 5B). Based on the sensitivity tests, we found that removing a single study (Klein et al14) reduced the I2 from 43% (moderate) to 15% (unimportant), suggesting a significant portion of the heterogeneity was from this study. The sensitivity tests also showed that removing a single study did not significantly affect the magnitude of the growth rate (mean difference ranged from 0.059 to 0.067 mm/year; P < 0.001 in all iterations). In addition, the subgroup analysis (Figure 7, available at http://www.ophthalmology-retina.org) and meta-regressions (Table 6A, available at http://www.ophthalmology-retina.org) demonstrated that the choice of imaging modality and type of study design were not significant confounding factors or sources of heterogeneity in the estimated difference in the effective radius growth rate between the 2 GA groups.
Figure 7.
Estimated mean difference in the radius growth rates between unifocal and multifocal GA groups was consistent across different imaging modalities (A) and different study types (B). FAF = fundus autofluorescence; CFP = color fundus photography; OCT = optical coherence tomography.
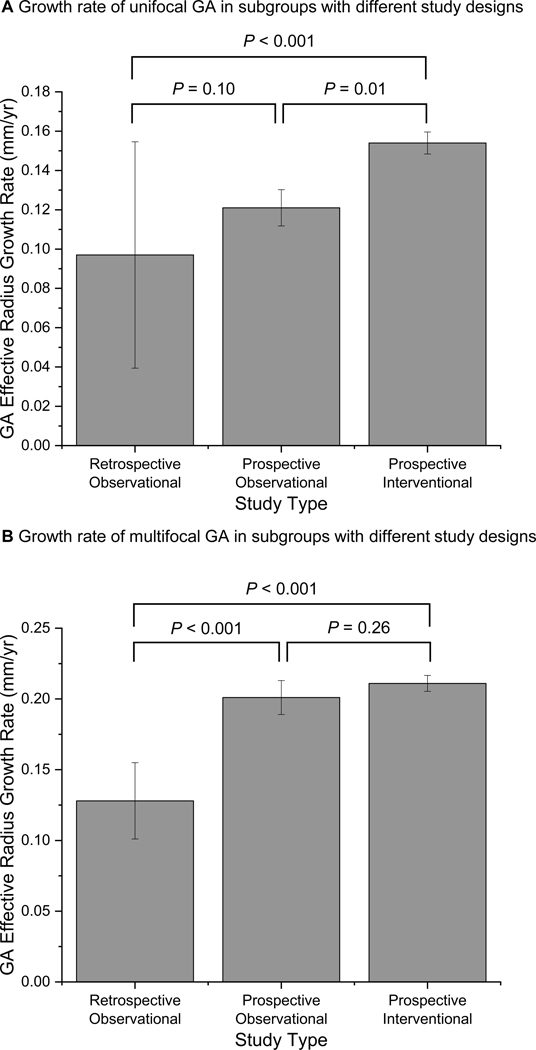
Figure 6 (available at http://www.ophthalmology-retina.org) shows considerable heterogeneity in the GA effective radius growth rate among the included studies in both unifocal (I2 = 81.8%) and multifocal (I2 = 92.9%) groups. Sensitivity tests revealed that no single study could explain most of the heterogeneity in unifocal (I2 = 62.3–83.4%) and multifocal (I2 = 52.0–93.6%) groups. Also, after removing 1 study at a time, the GA effective radius growth rate was relatively unchanged in each group and ranged from 0.132 to 0.144 mm/year in the unifocal group, and 0.195 to 0.206 mm/year in the multifocal group. We found that the effective radius growth rate varied significantly across subgroups with different study types in both unifocal and multifocal groups (Figure 9, available at http://www.ophthalmology-retina.org). Based on univariate meta-regressions, different study types (retrospective observational, prospective observational, or prospective interventional) explained 62.2% of heterogeneity in unifocal group (P = 0.003) and 90.9% of heterogeneity in multifocal group (P < 0.001) (Table 6 B and C, available at http://www.ophthalmology-retina.org).
Figure 9.
A, The effective radius growth rates of unifocal geographic atrophy (GA) lesions varied significantly across subgroups of different study types: retrospective observational studies (0.097 ±0.058 mm/year; I2= 92.6%), prospective observational studies (0.121 ±0.009 mm/year; I2= 24.6%) and prospective interventional studies (0.154 ±0.006 mm/year; I2= 55.9%). B, Similarly, the effective radius growth rates of multifocal GA varied significantly across the subgroups: retrospective observational studies (0.128 ±0.027 mm/year; I2= 51.3%), prospective observational studies (0.201 ±0.012 mm/year; I2= 63.2%) and prospective interventional studies (0.211 ±0.006 mm/year; I2= 40.3%). Error bars represent standard errors.
Impact of Imaging Modality on the GA Effective Radius Growth Rate
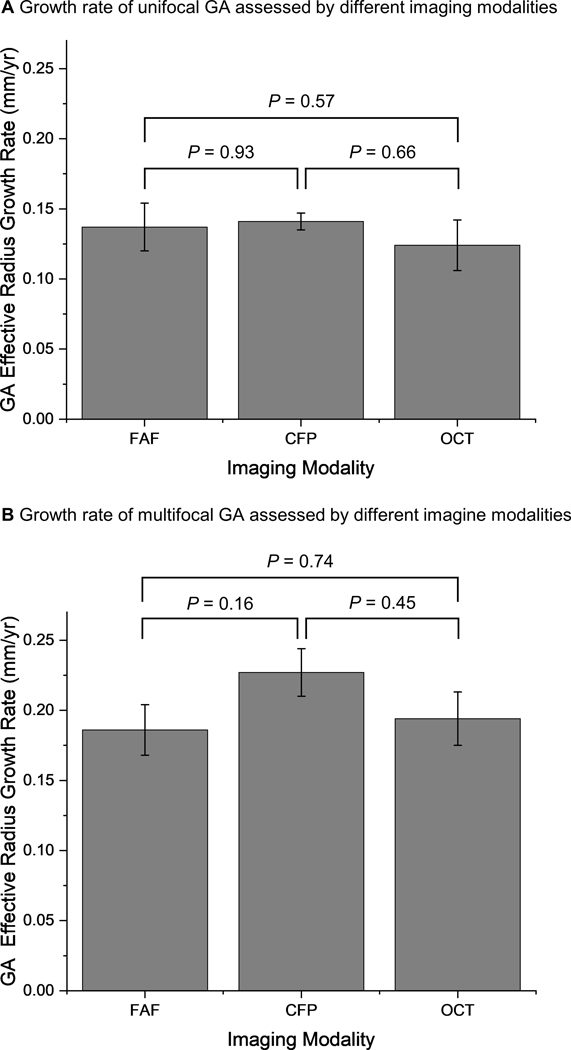
The effective radius growth of unifocal GA was similar among studies using FAF (0.137 ± 0.017 mm/year), CFP (0.141 ± 0.006 mm/year) and OCT (0.124 ± 0.018 mm/year), with P values ranging from 0.57–0.93 (Figure 8A). Similarly, the effective radius growth rates of multifocal GA measured by FAF (0.186 ± 0.018 mm/year), CFP (0.227 ± 0.017 mm/year) and OCT (0.194 ± 0.019 mm/year) were comparable (P = 0.16–0.74; Figure 8B). The results suggested that all 3 imaging modalities could be used to monitor the progression of both unifocal and multifocal GA consistently.
Figure 8.
A, The effective radius growth rates of unifocal geographic atrophy (GA) lesions measured by FAF (0.137 ± 0.017 mm/year; I2 = 87.9), CFP (0.141 ± 0.006 mm/year; I2 = 51.4%) and OCT (0.124 ± 0.018 mm/year; I2 = 66.1%) were close to 1 another. B, Similarly, the effective radius growth rates of multifocal GA lesions measured by FAF (0.186 ± 0.018 mm/year; I2 = 95.3%), CFP (0.227 ± 0.017 mm/year; I2 = 76.0%) and OCT (0.194 ± 0.019 mm/year; I2 = 46.1%) are comparable. We did not find any statistical significance of the growth rates measured by different imaging modalities. Error bars represent standard errors. CFP = color fundus photography; FAF = fundus autofluorescence; OCT = optical coherence tomography.
Long-Term Progression Pattern of Unifocal and Multifocal GA
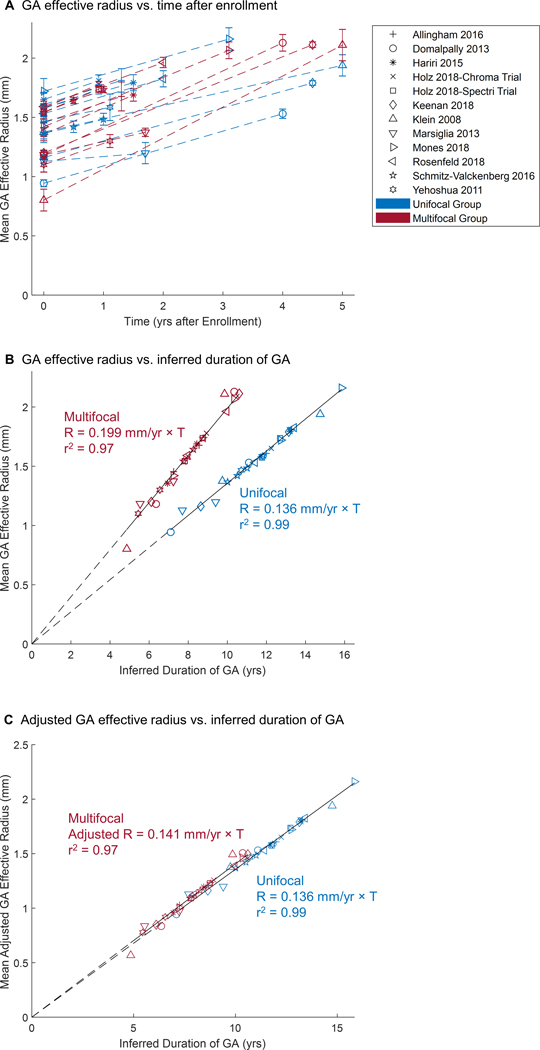
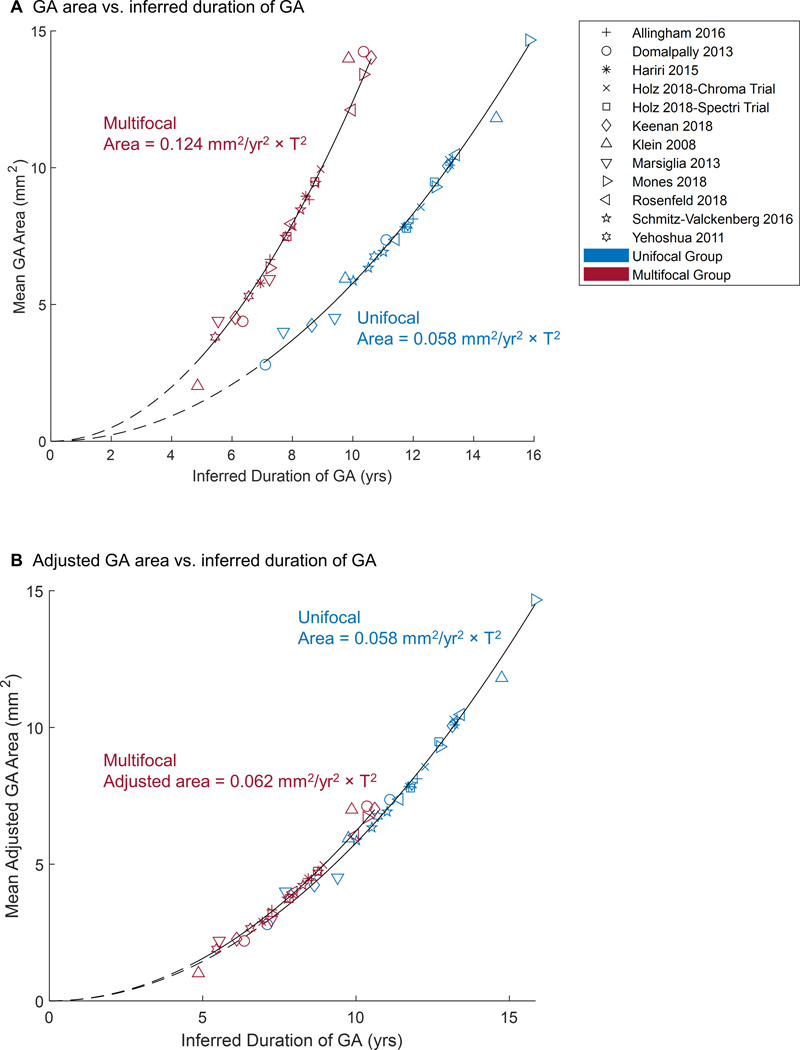
To test the hypothesis that the effective radius of both unifocal and multifocal GA enlarges at a constant rate over the long-term, we plotted the GA effective radius of both groups as a function of time after enrollment into the original studies (Figure 10A). Here, 1 dataset represented the mean GA effective radius at different visits of a cohort in 1 study. However, the initial mean baseline GA effective radius varied from 0.80 to 1.72 mm (i.e., 2.02–9.30 mm2 in lesion area) among different studies, suggesting that the patient populations in different studies were at different time points of the GA disease course when they were enrolled into the studies. Due to the variation of patients’ baseline entry times and the limited number and duration of follow-ups in individual studies, it was challenging to use the raw data to directly examine how unifocal and multifocal GA lesions enlarged over a long period of time. Using an optimal realignment algorithm, we developed previously,22, 34–39, 41, 42 we introduced a horizontal translation factor (Table 3, available at http://www.ophthalmology-retina.org) to each dataset (representing the mean data of a cohort) to account for the different mean baseline entry times of patients into different studies. This process essentially transformed the horizontal axis from time (years after enrollment) to time (inferred duration of GA; compare Figure 10A with Figure 10B). After the transformation, the cumulative datasets of each group fit into a straight line with a very high r2 (0.99 and 0.97 for unifocal and multifocal, respectively) over about 7 years (Figure 10B), suggesting that the GA effective radius increased linearly and steadily over the elapsed time in both unifocal and multifocal groups but with a distinct growth rate (0.136 vs. 0.199 mm/year). Interestingly, the difference in the growth rate between unifocal and multifocal GA disappeared after we divided the effective radius of multifocal GA by a factor of (Figure 10C), which is the ratio of the total perimeter between a multifocal GA (2 lesions) and a unifocal GA with the same total lesion area.
Figure 10.
Geographic atrophy (GA) effective radius as a function of time in unifocal and multifocal groups. The shape of the markers represents the corresponding study, while the color represents the unifocal or multifocal group. The points in (A) represent reported raw data in prior publications (error bar = standard errors). Note that the initial GA radius ranged from 0.802 to 1.721 mm (2.02 to 9.30 mm2 in area) among all studies, suggesting that patients were entered at different time points of disease. The data in (B) were generated by adding a horizontal translation factor (expressed in years in Table 3, available at http://www.ophthalmology-retina.org) to each data subset to correct for different entry times of patients into each clinical trial. The translation factors were determined using a custom optimal realignment algorithm. The cumulative datasets in both unifocal and multifocal group fit along a straight line with a very high r2, suggesting that the GA effective radius enlarges linearly over a course of 7 years in both groups. Note, the radius growth rate of multifocal GA (0.199 ± 0.012 mm/year, r2 = 0.97) was 46.3% faster than the radius growth rate of unifocal GA (0.136 ± 0.008 mm/year, r2 = 0.99) (P < 0.001). C, Interestingly, the difference in the effective radius growth rate between unifocal and multifocal groups disappears after dividing the effective radius of multifocal GA by a factor of .
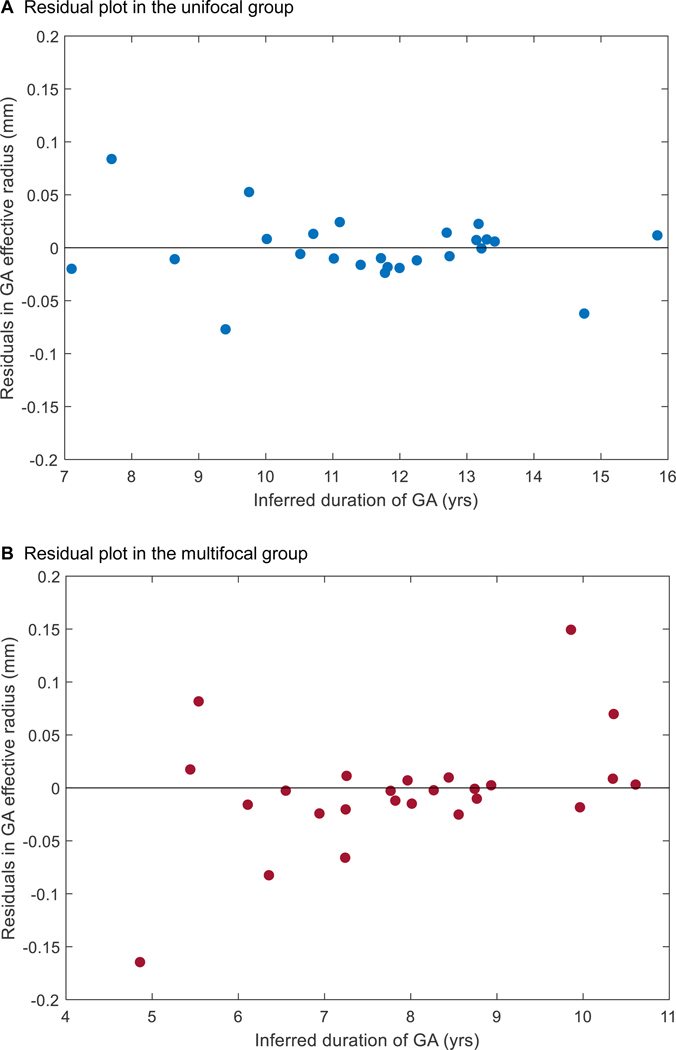
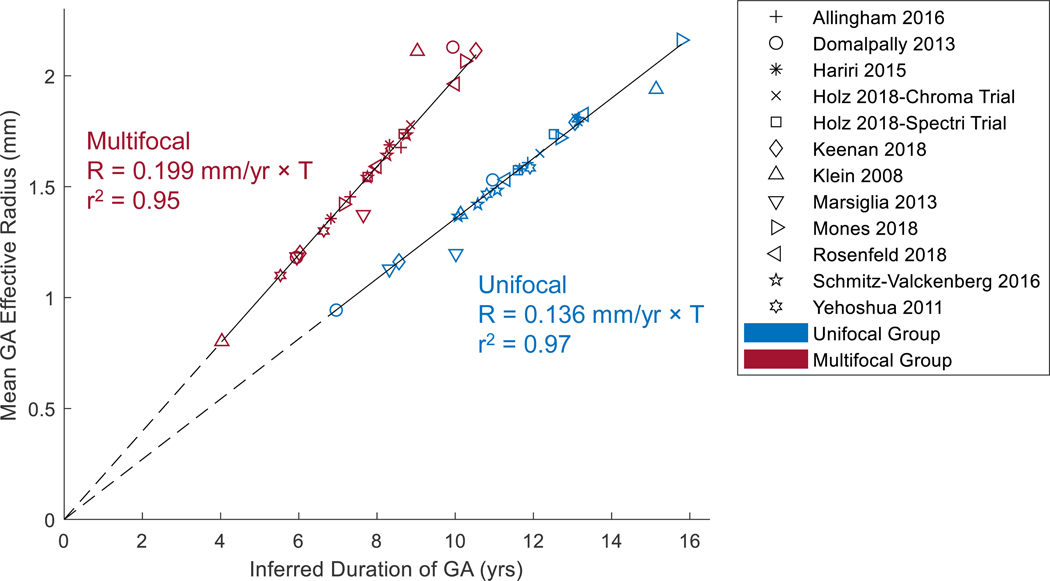
The residuals of the 2 linear regressions in Figure 10B appeared to be randomly dispersed (Figure 11, available at http://www.ophthalmology-retina.org), further supporting the linear progression model of GA effective radius as a function of time for both unifocal and multifocal groups.47 Also, in an alternative approach to correct for different entry times, we simply realigned the baseline visits of the datasets onto a straight line with a predefined slope (0.136 and 0.199 mm/year for unifocal and multifocal GA, respectively). After the realignment, the datasets of each group also followed well along a straight line with a similarly high r2 (0.97 and 0.95 for unifocal and multifocal, respectively) over time (Figure 12, available at http://www.ophthalmology-retina.org).
Figure 11.
Residual plots for the linear regressions of unifocal and multifocal groups in Figure 10B.The plots were generated by subtracting the estimated values in the linear model from the observed values in Figure 10B.The distance from each point to the center horizontal line at y = 0 represents the difference between the estimated and observed values. The points in the unifocal group residual plot (A) and multifocal group residual plot (B) appeared randomly dispersed (without obvious U-shaped pattern) along the center horizontal line, suggesting both linear regressions in Figure 10B were appropriate. GA = geographic atrophy.
Figure 12.
Realignment of baseline visits of raw datasets. The data were generated by adding a horizontal translation factor (expressed in years) to each dataset in Figure 10A to correct for different entry times of patients into each clinical trial. The translation factor for each dataset in the unifocal group was determined as baseline effective radius divided by 0.136 mm/year; and the translation factor for each dataset in the multifocal group was calculated as baseline effective radius divided by 0.199 mm/year. After the realignmentof baseline visits, the cumulative datasets in both unifocal and multifocal group followed well along a straight line with a similarly high r2as Figure 10B, suggesting that the GA effective radius was directly proportional to the duration of GA in both unifocal and multifocal groups.
After converting the y-axis of Figure 10B from the GA effective radius to area, we found that the area of both unifocal and multifocal GA enlarges quadratically over time but with distinct growth rates at the same inferred duration of GA (Figure 13A). If unifocal and multifocal GA have the same total lesion area at baseline, the area growth rate of multifocal GA is 1.46-folds higher than the growth rate of unifocal GA. Interestingly, the difference between the natural history of unifocal and multifocal GA disappears after dividing the total area of multifocal GA by a factor of 2 (Figure 13B).
Figure 13.
A, Geographic atrophy (GA) area as a function of time in unifocal and multifocal groups. The data were generated by converting the y-axis of Figure 10B from effective radius to area. At the same duration of GA, the area growth rate of multifocal GA is 2.14-folds higher than the growth rate of unifocal GA. At the same lesion size, the area growth rate of multifocal GA is 1.46-folds (between and ) higher than the growth rate of unifocal GA. B, The difference between the natural history of unifocal and multifocal GA disappears after dividing the area of multifocal GA by a factor of 2.
Discussion
To determine the long-term natural history of unifocal and multifocal GA, we performed a meta-analysis including data from 3489 unique eyes (3001 patients) in 12 previously published studies. Raw untranslated data from prior publications demonstrated that there was a wide range of initial lesion sizes at the time of enrollment into these studies (Figure 10A). A priori, there are 2 possible explanations for this wide range of initial lesion sizes. First, it is possible that each study represents a unique population of patients with different disease phenotypes and aggressiveness. However, a second compelling and more unifying explanation is that these patient cohorts all represent the same disease population. If this is the case, the apparent variation in the mean baseline lesion size between studies may be due to different patient cohorts being enrolled at different time points in the natural history of disease. The mean GA growth rate of different cohorts from the same patient population should be relatively comparable if the patients were randomly selected. Thus, cohorts with smaller mean initial lesion sizes were likely enrolled earlier in their natural history compared to cohorts with larger mean baseline lesion sizes. If this hypothesis is true, we can reconstruct the long-term natural history of unifocal and multifocal GA after correcting for the different mean baseline durations of GA of the patient cohorts. Figure 10B and Figure 12 (available at http://www.ophthalmology-retina.org) show the success of the “entry time realignment” approach. After the introduction of translation factors, cumulative data fit along a straight line with high correlation coefficients over at least 7 years in both unifocal and multifocal groups (r2 = 0.99 and 0.97 in Figure 10B and r2 = 0.97 and 0.95 in Figure 12). This data suggests that within each focality group, the patient populations from different studies represent the same disease cohort, and the effective radius of GA enlarges linearly and at a steady rate over a near decade-long period of time.
It is important to understand why a multifocal GA progresses faster than a unifocal GA. One hypothesis is that multifocal GA represents a more advanced stage of GA compared to unifocal GA.20 This could be the case if eyes with multifocal GA may have more extensive subretinal drusenoid deposits,48, 49 worse local environments (e.g., micronutrient deficiency or hypoxia),50 and/or different proportions of RPE cells with distinct fates including migratory or apoptotic51, 52 compared to eyes with unifocal GA. Intuitively, the hypothesis is consistent with the observation that unifocal GA can transform into multifocal GA over time as new lesions occur in the macula, but it is not consistent with the observation that the opposite transformation can occur when multifocal GA enlarges and coalesces into unifocal GA (as demonstrated by Sunness et al53). Additionally, Yehoshua et al reported that the mean baseline area of multifocal GA was only 3.80 mm2, 44% smaller than the mean area of unifocal GA (6.75 mm2), indicating that multifocal GA lesions can sometimes occur at an earlier stage than unifocal GA.19 Here we also demonstrated that the area growth rate of multifocal GA is higher than the growth rate of unifocal GA even at the same inferred duration of GA or at the same baseline GA area (Figure 13A), further suggesting against the hypothesis that multifocal GA is a later stage than unifocal GA.
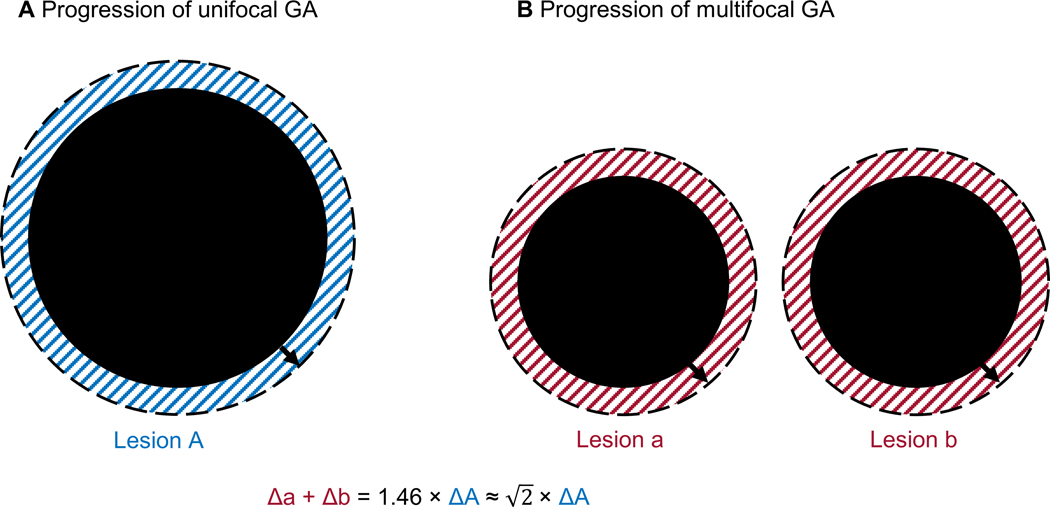
A second and more unifying hypothesis as to why multifocal GA progresses faster than unifocal GA is that the progression rate of GA area is directly proportional to the total perimeter of the lesion. If the hypothesis is correct, the ratio of the area enlargement rate between unifocal and multifocal GA (in mm2/year) is simply the ratio of baseline total perimeter (in mm). If a unifocal GA (1 lesion) and a multifocal GA (e.g., 2 lesions) have the same total lesion area at baseline (Figure 14), the ratio of the GA area growth rate between these groups will be ratio of the total perimeter (for rounds lesions). Interestingly, our study found the ratio of the GA area growth rate between multifocal and unifocal GA with the same baseline total size is 1.46, which is slightly greater than . Since the number of contributing individual lesions in eyes with multifocal GA is usually between 2 and 3 (based on clinical observations and a report by Bellmann et al54), our data is consistent with the second hypothesis. The hypothesis is also supported by a finding that the GA area growth rate is higher in an irregularly-shaped lesion with a similar baseline area but a larger perimeter compared to a circular lesion.10 This observation, along with our findings, suggests that clinicians should consider the total perimeter (not just area) of GA lesions when assessing the severity and prognosis of affected eyes with GA.
Figure 14.
Simplified progression of a unifocal GA (A) and a multifocal GA with 2 lesions (B). At baseline, the 2 GA have the same total lesion area so the ratio of the total perimeter between the 2 GA is . Over a short period of time, the enlargement of GA area (shaded region) equals the baseline perimeter multiplies the enlargement of GA radius (ΔArea = Perimeter × ΔRadius). If the axial growth rate of unifocal and multifocal GA is the same, the ratio of the GA area growth rate between the multifocal and unifocal GA will simply be the ratio of the total perimeter, which is . Interestingly, our study found the ratio of the GA area growth rate between multifocal and unifocal GA with the same baseline total size is 1.46 (close to ).
Our findings may also assist in the design of clinical trials for GA. To date, the expansion of GA lesions is the most common primary endpoint in treatment trials for GA secondary to nonexudative AMD.8, 55, 56 Although many previous treatment trials showed no efficacy,8, 12, 17 a few recent early phase trials reported promising results of treatments in slowing down GA expansion (e.g., NCT02503332 and NCT02686658) and many other trials are still ongoing (e.g., NCT04014777, NCT01782989, NCT03972709, and NCT03815825).8 One pitfall of using GA expansion as the primary endpoint is the interindividual variation of the GA growth rate, which may bias the study results and lead to erroneous conclusions. To improve the understanding of GA expansion, we have performed a series of meta-analyses on the natural history of GA.24,37, 38, 41 Through this initiative, we have investigated the long-term progression pattern of GA,24 and assessed the current evidence regarding the clinical significance of several prognostic factors (fellow eye status38, FAF patterns surround GA37, and topographic locations41). In the present study, we found the lesion focality is a significant prognostic factor of the GA growth rate and should be accounted for in trials. However, since the number of lesions can range widely from 1 to 23 among eyes with GA,54 it is unclear how to account for the different number of lesions in trials. The present study supports the hypothesis that the growth rate of GA area is directly proportional to the total perimeter, regardless of lesion focality. To further investigate the unifying rule of GA expansion, we are currently analyzing individual fundus images to investigate the axial growth rate of individual lesions of multifocal GA in comparison with the growth rate of unifocal GA. If they are indeed comparable, future clinical trials may simply employ the total lesion perimeter or the square root of the number of lesions as a correction factor to reduce the impact of number of lesions on the GA growth rate. The use of such correction factor may improve the sensitivity detecting an effect in a treatment trial.
It is also important to consider the implications of the observation that lesion growth is related to the perimeter of an atrophic lesion. Simply put, the perimeter of an atrophic lesion is a measure of the number of RPE cells exposed at the border of the atrophic lesions. These findings imply that the expansion of atrophic lesions may be driven by a process in which exposed, “at risk” cells at the border of the lesion are more susceptible to stress than RPE elsewhere well outside the atrophic border. Pathological changes affecting the lesion border may drive the progressive loss of RPE cells in GA, and thus the progression of GA may be proportional to the RPE exposed at the border. Additional studies are needed to understand the cellular mechanisms underlying this relationship.
In previous and current clinical trials, 3 imaging modalities (i.e., CFP, FAF, and OCT) have been used to monitor the progression of GA sizes.11–13, 27, 57 Due to variations in the wavelength of light source, image contrast and resolution among different imaging modalities, there is a concern in the literature that the measured GA area may vary based on the choice of imaging modality. For example, Schmitz-Valckenberg et al reported that the mean baseline GA area measured by CFP is 1.4 mm2 larger than the area measured by FAF.18 In contrast, Domalpally et al and Wong et al reported that the measured GA areas were slightly larger (< 0.5 mm2 difference) on FAF than on CFP.57, 58 Khanifar et al also found a small difference in the GA area between CFP and FAF.59 Despite the variations in the absolute lesion areas measured by different imaging modalities, the growth rate of GA lesions appears to be much less affected by the imaging modality. To the best of our knowledge, all previous studies found a very high correlation in the GA progression rates measured by CFP and FAF.18, 27, 57, 58 In our present study, we found that the GA effective radius growth rates were consistent among studies using CFP, FAF, or OCT in both unifocal and multifocal groups (Figure 7), which supports the validity and reliability of using any of the imaging modality to monitor GA enlargement in clinical trials.
Quality of the Evidence and Study Limitations
To the best of our knowledge, this study is the first systematic review and meta-analysis on the natural history of unifocal and multifocal GA. This study constitutes a thorough literature search and extensive meta-analysis from 12 studies with 3489 unique eyes. The number of eyes in the 2 groups (1824 eyes in unifocal group and 1665 eyes in multifocal group) are similar and adequate. The qualities of the included studies were generally high, as assessed by the QUIPS tool. Also, we did not find any evidence of publication bias and the sensitivity analysis revealed the robustness of the results. However, we found large heterogeneity in the estimated GA effective radius growth rate from different studies as assessed by I2 statistics. Based on subgroup analysis and univariate meta-regressions, difference in the study types (i.e., retrospective observational, prospective observational, or prospective interventional) accounted for most of the heterogeneity among different studies.
This meta-analysis has several limitations. First, our study mainly focuses on the comparison between eyes with 1 lesion (unifocal) and eyes with 2 or more lesions (multifocal). However, the configurations can vary within each group. For example, previous studies have found that the shape-factor or circularity of a unifocal lesion is a prognostic factor for the GA progression speed.10, 21 Moreover, in multifocal groups, the number of lesions can vary widely, and there may sometimes be more than 20 lesions.54 Since our analysis suggests that the effective radius growth rate of a multifocal GA may increase by a factor of the square root of the lesion number, it is likely that the growth rate of multifocal GA varies widely among individual patients. Due to the lack of access to the shape-factors or number of GA lesions in individual patients, we were unable to investigate the impact of variations in configurations. This may account for some heterogeneity of data among different studies. Second, although we analyzed the effects of confounding from different study designs and imaging modalities, there are several other GA prognostic factors (e.g., patient demographic factors, the fellow eye status, FAF patterns surrounding the borders, topographic location of lesions)6, 37, 38, 41 that we could not account for in the meta-analysis. For instance, the diffuse-trickling GA (a FAF phenotype of GA proposed by Fleckenstein et al60, 61) may have some overlaps with multifocal GA. However, as clarified by Fleckenstein et al, multifocal GA (defined as 2 or more lesions in an eye) does not necessarily indicate diffuse-trickling GA, which has more complex definitions (including grayish FAF signals and an obvious separation of the RPE/Bruch’s membrane complex).62 In the Fundus Autofluorescence in Age-related Macular Degeneration Study, the group found 71.5% of eyes with multifocal GA, but only 13.2% exhibited the diffuse trickling phenotype.62 Moreover, Pfau et al reported that 43.2% of the diffuse-trickling GA belonged to the unifocal instead of multifocal group,21 suggesting a relatively balanced distribution of the diffuse-trickling phenotype in unifocal and multifocal group. Since many other prognostics factors also likely distribute evenly among different cohorts and the included studies generally have good numbers of patients (9 studies have more than 100 eyes), the study-level GA growth rate is unlikely to be affected significantly. Third, since many included studies are observational studies, loss to follow-up is a potential concern. Forth, the GA lesion sizes included in the meta-analysis ranged from 2.02 to 9.30 mm2, and we do not know if the results can be applied outside this range. Finally, we did not prospectively register the review. However, we followed our previously published protocol37 regarding a different topic in GA except for necessary modifications in the selection criteria and methods to determine the study quality and sources of heterogeneity.
Conclusions
This meta-analysis demonstrated that the effective radius of GA enlarges linearly as a function of time in both unifocal and multifocal groups. The growth rate of GA effective radius or square root of area measured by 3 imaging modalities (CFP, FAF, and OCT) is comparable and can serve as a reliable outcome measure to monitor the progression of both unifocal and multifocal GA. The growth rate of multifocal GA was 1.46-folds higher than the growth rate of unifocal GA (slightly > ). We propose that the growth rate of GA area (regardless of the number of lesions in the eye) is directly proportional to the total perimeter, which is a measure of the number of RPE cells exposed at the border of the atrophic lesions. The total perimeter of GA lesions should be considered during the assessment of the severity and prognosis of GA. Additional studies are needed to understand the cellular mechanisms underlying this relationship.
Supplementary Material
ACKNOWLEDGEMENTS
The authors would like to thank Dr. Frank G. Holz (Department of Ophthalmology, University of Bonn, Bonn, Germany), Dr. Christopher Brittain (Genentech, Inc., South San Francisco, CA, USA), and Dr. Michael J. Allingham (Duke University Medical Center, Durham, North Carolina) for sharing the data of their studies. We thank Dorota Peglow, Mary Hughes, Vermetha Polite and Khadija El-hazimy (Harvey Cushing/John Hay Whitney Medical Library, Yale University, New Haven, Connecticut) for technical support. Research reported in this publication was supported by the National Institute on Aging of the National Institutes of Health under Award Number T35AG049685. The content is solely the responsibility of the authors and does not necessarily represent the official views of the National Institutes of Health.
Financial support: National Institute on Aging of the National Institutes of Health under Award Number T35AG049685 (Recipient: L.L.S). The sponsor or funding organization had no role in the design or conduct of this research
Meeting presentation: None.
Abbreviations and Acronyms:
- AMD
age-related macular degeneration
- AREDS
Age-Related Eye Disease Study
- BDES
Beaver Dam Eye Study
- CFP
color fundus photography
- CI
confidence interval
- df
degree of freedom
- FAF
fundus autofluorescence
- FAM
Fundus Autofluorescence in Age-related Macular Degeneration
- GA
geographic atrophy
- GAIN
Geographic Atrophy Progression in Patients With Age-Related Macular Degeneration
- GAP
Geographic Atrophy Progression
- OCT
optical coherence tomography
- PRISMA
Preferred Reporting Items for Systematic Reviews and Meta-Analyses
- RE
random-effects
- RPE
retinal pigment epithelium
- SE
standard error
- SEATTLE
safety and efficacy assessment treatment trials of emixustat hydrochloride
Footnotes
Conflict of Interest: L. L. Shen, None; M. Sun, None; H. K. Grossetta Nardini, None; L. V. Del Priore, Astellas Institute for Regenerative Medicine (Consultant).
Address for reprints: 40 Temple Street, Suite 1B, New Haven, CT 06510.
REFERENCES
- 1.Thiele S, Pfau M, Larsen PP, et al. Multimodal imaging patterns for development of central atrophy secondary to age-related macular degeneration. Invest Ophthalmol Vis Sci 2018;59(4):AMD1–AMD11. [DOI] [PubMed] [Google Scholar]
- 2.Li M, Huisingh C, Messinger J, et al. Histology of geographic atrophy secondary to age-related macular degeneration: a multilayer approach. Retina 2018;38(10):1937–53. [DOI] [PMC free article] [PubMed] [Google Scholar]
- 3.Wong WL, Su X, Li X, et al. Global prevalence of age-related macular degeneration and disease burden projection for 2020 and 2040: a systematic review and meta-analysis. The Lancet Global Health 2014;2(2):e106–e16. [DOI] [PubMed] [Google Scholar]
- 4.Rudnicka AR, Kapetanakis VV, Jarrar Z, et al. Incidence of late-stage age-related macular degeneration in american whites: systematic review and meta-analysis. Am J Ophthalmol 2015;160(1):85–93.e3. [DOI] [PubMed] [Google Scholar]
- 5.Friedman DS, O’Colmain BJ, Munoz B, et al. Prevalence of age-related macular degeneration in the United States. Arch Ophthalmol 2004;122(4):564–72. [DOI] [PubMed] [Google Scholar]
- 6.Fleckenstein M, Mitchell P, Freund KB, et al. The progression of geographic atrophy secondary to age-related macular degeneration. Ophthalmology 2018;125(3):369–90. [DOI] [PubMed] [Google Scholar]
- 7.Holz FG, Strauss EC, Schmitz-Valckenberg S, van Lookeren Campagne M. Geographic atrophy: clinical features and potential therapeutic approaches. Ophthalmology 2014;121(5):1079–91. [DOI] [PubMed] [Google Scholar]
- 8.Kassa E, Ciulla TA, Hussain RM, Dugel PU. Complement inhibition as a therapeutic strategy in retinal disorders. Expert Opin Biol Ther 2019;19(4):335–42. [DOI] [PubMed] [Google Scholar]
- 9.Allingham MJ, Nie Q, Lad EM, et al. Semiautomatic segmentation of rim area focal hyperautofluorescence predicts progression of geographic atrophy due to dry age-related macular degeneration. Invest Ophthalmol Vis Sci 2016;57(4):2283–9. [DOI] [PMC free article] [PubMed] [Google Scholar]
- 10.Domalpally A, Danis RP, White J, et al. Circularity index as a risk factor for progression of geographic atrophy. Ophthalmology 2013;120(12):2666–71. [DOI] [PubMed] [Google Scholar]
- 11.Hariri A, Nittala MG, Sadda SR. Outer retinal tubulation as a predictor of the enlargement amount of geographic atrophy in age-related macular degeneration. Ophthalmology 2015;122(2):407–13. [DOI] [PubMed] [Google Scholar]
- 12.Holz FG, Sadda SR, Busbee B, et al. Efficacy and safety of lampalizumab for geographic atrophy due to age-related macular degeneration: Chroma and Spectri phase 3 randomized clinical trials. JAMA ophthalmology 2018;136(6):666–77. [DOI] [PMC free article] [PubMed] [Google Scholar]
- 13.Keenan TD, Agron E, Domalpally A, et al. Progression of geographic atrophy in age-related macular degeneration: AREDS2 report number 16. Ophthalmology 2018;125(12):1913–28. [DOI] [PMC free article] [PubMed] [Google Scholar]
- 14.Klein R, Meuer SM, Knudtson MD, Klein BE. The epidemiology of progression of pure geographic atrophy: the Beaver Dam Eye Study. Am J Ophthalmol 2008;146(5):692–9. [DOI] [PMC free article] [PubMed] [Google Scholar]
- 15.Marsiglia M, Boddu S, Bearelly S, et al. Association between geographic atrophy progression and reticular pseudodrusen in eyes with dry age-related macular degeneration. Invest Ophthalmol Vis Sci 2013;54(12):7362–9. [DOI] [PMC free article] [PubMed] [Google Scholar]
- 16.Mones J, Biarnes M. The rate of progression of geographic atrophy decreases with increasing baseline lesion size even after the square root transformation. Transl Vis Sci Technol 2018;7(6):40. [DOI] [PMC free article] [PubMed] [Google Scholar]
- 17.Rosenfeld PJ, Dugel PU, Holz FG, et al. Emixustat hydrochloride for geographic atrophy secondary to age-related macular degeneration: a randomized clinical trial. Ophthalmology 2018;125(10):1556–67. [DOI] [PubMed] [Google Scholar]
- 18.Schmitz-Valckenberg S, Sahel JA, Danis R, et al. Natural history of geographic atrophy progression secondary to age-related macular degeneration (Geographic Atrophy Progression Study). Ophthalmology 2016;123(2):361–8. [DOI] [PubMed] [Google Scholar]
- 19.Yehoshua Z, Rosenfeld PJ, Gregori G, et al. Progression of geographic atrophy in age-related macular degeneration imaged with spectral domain optical coherence tomography. Ophthalmology 2011;118(4):679–86. [DOI] [PMC free article] [PubMed] [Google Scholar]
- 20.Joachim N, Mitchell P, Kifley A, et al. Incidence and progression of geographic atrophy: observations from a population-based cohort. Ophthalmology 2013;120(10):2042–50. [DOI] [PubMed] [Google Scholar]
- 21.Pfau M, Lindner M, Goerdt L, et al. Prognostic value of shape-descriptive factors for the progression of geographic atrophy secondary to age-related macular degeneration. Retina 2019;39(8):1527–40. [DOI] [PubMed] [Google Scholar]
- 22.Shen L, Liu F, Grossetta Nardini H, Del Priore LV. Natural history of geographic atrophy in untreated eyes with nonexudative age-related macular degeneration: a systematic review and meta-analysis. Ophthalmology Retina 2018;2(9):914–21. [DOI] [PubMed] [Google Scholar]
- 23.Feuer WJ, Yehoshua Z, Gregori G, et al. Square root transformation of geographic atrophy area measurements to eliminate dependence of growth rates on baseline lesion measurements: a reanalysis of age-related eye disease study report no. 26. JAMA Ophthalmology 2013;131(1):110–1. [DOI] [PMC free article] [PubMed] [Google Scholar]
- 24.Stroup DF, Berlin JA, Morton SC, et al. Meta-analysis of observational studies in epidemiology: a proposal for reporting. JAMA 2000;283(15):2008–12. [DOI] [PubMed] [Google Scholar]
- 25.Lindblad AS, Lloyd PC, Clemons TE, et al. Change in area of geographic atrophy in the age-related eye disease study: AREDS report number 26. Arch Ophthalmol 2009;127(9):1168–74. [DOI] [PMC free article] [PubMed] [Google Scholar]
- 26.Krishnadev N, Meleth AD, Chew EY. Nutritional supplements for age-related macular degeneration. Curr Opin Ophthalmol 2010;21(3):184. [DOI] [PMC free article] [PubMed] [Google Scholar]
- 27.Yaspan BL, Williams DF, Holz FG, et al. Targeting factor D of the alternative complement pathway reduces geographic atrophy progression secondary to age-related macular degeneration. Sci Transl Med 2017;9(395). [DOI] [PubMed] [Google Scholar]
- 28.Hayden JA, van der Windt DA, Cartwright JL, et al. Assessing bias in studies of prognostic factors. Ann Intern Med 2013;158(4):280–6. [DOI] [PubMed] [Google Scholar]
- 29.Egger M, Smith GD, Schneider M, Minder C. Bias in meta-analysis detected by a simple, graphical test. BMJ 1997;315(7109):629–34. [DOI] [PMC free article] [PubMed] [Google Scholar]
- 30.Viechtbauer W Conducting meta-analyses in R with the metafor package. Journal of statistical software 2010;36(3):1–48. [Google Scholar]
- 31.Higgins J, Thomas J, Chandler J, et al. Cochrane handbook for systematic reviews of interventions version 6.0 (updated july 2019). Cochrane, 2019. Available from www.training.cochrane.org/handbook. [Google Scholar]
- 32.Hedges LV, Olkin I. Statistical methods for meta-analysis: Academic press, 2014. [Google Scholar]
- 33.van Houwelingen HC, Arends LR, Stijnen T. Advanced methods in meta-analysis: multivariate approach and meta-regression. Stat Med 2002;21(4):589–624. [DOI] [PubMed] [Google Scholar]
- 34.Liu TYA, Shah AR, Del Priore LV. Progression of lesion size in untreated eyes with exudative age-related macular degeneration: a meta-analysis using Lineweaver-Burk plots. JAMA Ophthalmol 2013;131(3):335–40. [DOI] [PubMed] [Google Scholar]
- 35.Shah AR, Del Priore LV. Natural history of predominantly classic, minimally classic, and occult subgroups in exudative age-related macular degeneration. Ophthalmology 2009;116(10):1901–7. [DOI] [PubMed] [Google Scholar]
- 36.Shah AR, Del Priore LV. Progressive visual loss in subfoveal exudation in age-related macular degeneration: a meta-analysis using Lineweaver-Burke plots. Am J Ophthalmol 2007;143(1):83–9. [DOI] [PubMed] [Google Scholar]
- 37.Shen LL, Liu F, Nardini HG, Del Priore LV. Reclassification of fundus autofluorescence patterns surrounding geographic atrophy based on progression rate: a systematic review and meta-analysis. Retina 2019;39(10):1829–39. [DOI] [PubMed] [Google Scholar]
- 38.Shen LL, Liu F, Grossetta Nardini HK, Del Priore LV. Fellow eye status is a biomarker for the progression rate of geographic atrophy: a systematic review and meta-analysis. Ophthalmology Retina 2019;3(4):305–15. [DOI] [PubMed] [Google Scholar]
- 39.Shen LL, Sun M, Grossetta Nardini HK, Del Priore LV. Natural history of autosomal recessive Stargardt disease in untreated eyes: a systematic review and meta-analysis of study- and individual-level data. Ophthalmology 2019;126(9):1288–96. [DOI] [PubMed] [Google Scholar]
- 40.Shah AR, Del Priore LV. Duration of action of intravitreal ranibizumab and bevacizumab in exudative AMD eyes based on macular volume measurements. Br J Ophthalmol 2009;93(8):1027–32. [DOI] [PubMed] [Google Scholar]
- 41.Shen LL, Sun M, Khetpal S, et al. Topographic variation of the growth rate of geographic atrophy in nonexudative age-related macular degeneration: a systematic review and meta-analysis. Invest Ophthalmol Vis Sci 2020;61(1):2-. [DOI] [PMC free article] [PubMed] [Google Scholar]
- 42.Shen L, Ahluwalia A, Sun M, et al. Long-term natural history of atrophy in eyes with choroideremia-a systematic review and meta-analysis of individual-level data. Ophthalmology Retina (in press). [DOI] [PMC free article] [PubMed] [Google Scholar]
- 43.Berro J, Pollard TD. Local and global analysis of endocytic patch dynamics in fission yeast using a new “temporal superresolution” realignment method. Mol Biol Cell 2014;25(22):3501–14. [DOI] [PMC free article] [PubMed] [Google Scholar]
- 44.Shechtman E, Caspi Y, Irani M. Space-time super-resolution. IEEE Transactions on Pattern Analysis and Machine Intelligence 2005;27(4):531–45. [DOI] [PubMed] [Google Scholar]
- 45.Vogl WD, Prosch H, Muller-Mang C, et al. Longitudinal alignment of disease progression in fibrosing interstitial lung disease. Med Image Comput Comput Assist Interv 2014;17(Pt 2):97–104. [DOI] [PubMed] [Google Scholar]
- 46.Schlanitz FG, Baumann B, Kundi M, et al. Drusen volume development over time and its relevance to the course of age-related macular degeneration. Br J Ophthalmol 2017;101(2):198–203. [DOI] [PMC free article] [PubMed] [Google Scholar]
- 47.Cook RD, Weisberg S. Residuals and influence in regression: New York: Chapman and Hall, 1982. [Google Scholar]
- 48.Chen L, Messinger JD, Zhang Y, et al. Subretinal drusenoid deposit in age-related macular degeneration: histologic insights into initiation, progression to atrophy, and imaging. Retina 2019. [DOI] [PMC free article] [PubMed] [Google Scholar]
- 49.Spaide RF. Improving the age-related macular degeneration construct a new classification system. Retina 2018;38(5):891–9. [DOI] [PubMed] [Google Scholar]
- 50.Curcio CA, Zanzottera EC, Ach T, et al. Activated retinal pigment epithelium, an optical coherence tomography biomarker for progression in age-related macular degeneration. Invest Ophthalmol Vis Sci 2017;58(6):BIO211–BIO26. [DOI] [PMC free article] [PubMed] [Google Scholar]
- 51.Balaratnasingam C, Messinger JD, Sloan KR, et al. Histologic and optical coherence tomographic correlates in drusenoid pigment epithelium detachment in age-related macular degeneration. Ophthalmology 2017;124(5):644–56. [DOI] [PMC free article] [PubMed] [Google Scholar]
- 52.Dolz-Marco R, Balaratnasingam C, Messinger JD, et al. The border of macular atrophy in age-related macular degeneration: a clinicopathologic correlation. Am J Ophthalmol 2018;193:166–77. [DOI] [PubMed] [Google Scholar]
- 53.Sunness JS, Gonzalez-Baron J, Applegate CA, et al. Enlargement of atrophy and visual acuity loss in the geographic atrophy form of age-related macular degeneration. Ophthalmology 1999;106(9):1768–79. [DOI] [PubMed] [Google Scholar]
- 54.Bellmann C, Jorzik J, Spital G, et al. Symmetry of bilateral lesions in geographic atrophy in patients with age-related macular degeneration. Arch Ophthalmol 2002;120(5):579–84. [DOI] [PubMed] [Google Scholar]
- 55.Sadda SR, Chakravarthy U, Birch DG, et al. Clinical endpoints for the study of geographic atrophy secondary to age-related macular degeneration. Retina 2016;36(10):1806–22. [DOI] [PMC free article] [PubMed] [Google Scholar]
- 56.Sadda SR, Guymer R, Holz FG, et al. Consensus definition for atrophy associated with age-related macular degeneration on oct classification of atrophy report 3. Ophthalmology 2018;125(4):537–48. [DOI] [PMC free article] [PubMed] [Google Scholar]
- 57.Wong WT, Kam W, Cunningham D, et al. Treatment of geographic atrophy by the topical administration of OT-551: results of a phase II clinical trial. Invest Ophthalmol Vis Sci 2010;51(12):6131–9. [DOI] [PMC free article] [PubMed] [Google Scholar]
- 58.Domalpally A, Danis R, Agron E, et al. Evaluation of geographic atrophy from color photographs and fundus autofluorescence images: Age-Related Eye Disease Study 2 report number 11. Ophthalmology 2016;123(11):2401–7. [DOI] [PMC free article] [PubMed] [Google Scholar]
- 59.Khanifar AA, Lederer DE, Ghodasra JH, et al. Comparison of color fundus photographs and fundus autofluorescence images in measuring geographic atrophy area. Retina 2012;32(9):1884–91. [DOI] [PMC free article] [PubMed] [Google Scholar]
- 60.Fleckenstein M, Schmitz-Valckenberg S, Lindner M, et al. The “diffuse-trickling” fundus autofluorescence phenotype in geographic atrophy. Invest Ophthalmol Vis Sci 2014;55(5):2911–20. [DOI] [PubMed] [Google Scholar]
- 61.Fleckenstein M, Schmitz-Valckenberg S, Martens C, et al. Fundus autofluorescence and spectral-domain optical coherence tomography characteristics in a rapidly progressing form of geographic atrophy. Invest Ophthalmol Vis Sci 2011;52(6):3761–6. [DOI] [PMC free article] [PubMed] [Google Scholar]
- 62.Fleckenstein M, Schmitz-Valckenberg S, Holz FG. Author response: Geographic atrophy and cardiovascular disease. Invest Ophthalmol Vis Sci 2014;55(10):6263–4. [DOI] [PubMed] [Google Scholar]
Associated Data
This section collects any data citations, data availability statements, or supplementary materials included in this article.


