

SUMMARY
While Mediator plays a key role in eukaryotic transcription, little is known about its mechanism of action. This study combines CRISPR-Cas9 genetic screens, degron assays, Hi-C, and cryo-EM to dissect the function and structure of mammalian Mediator (mMED). Deletion analyses in B, T and ES cells identified a core of essential subunits required for PolII recruitment genome-wide. Conversely, loss of non-essential subunits mostly affects promoters linked to multiple enhancers. Contrary to current models however, mMED and PolII are dispensable to physically tether regulatory DNA, a topological activity requiring architectural proteins. Cryo-EM analysis revealed a conserved core, with non-essential subunits increasing structural complexity of the Tail module, a primary transcription factor target. Changes in Tail structure markedly increase PolII and kinase module interactions. We propose that Mediator’s structural pliability enables it to integrate and transmit regulatory signals and act as a functional, rather than an architectural bridge, between promoters and enhancers.
Graphical Abstract
eTOC
Mediator promotes and controls interactions between enhancers and promoters, but is not itself necessary to tether these elements.
INTRODUCTION
The multi-subunit Mediator complex plays an essential role in regulation of RNA polymerase II (PolII) transcription in eukaryotes (Kornberg, 2005; Malik and Roeder, 2010). Comprising 25 subunits in yeast and 33 in mammals, Mediator has been implicated in most stages of PoIII activation (Allen and Taatjes, 2015; Conaway and Conaway, 2013; Jeronimo and Robert, 2017; Soutourina, 2018).
By interacting with general transcription factors (GTFs), Mediator stimulates assembly of the pre-initiation complex (PIC) (Black et al., 2006; Esnault et al., 2008; Eychenne et al., 2016; Petrenko et al., 2017; Schilbach et al., 2017) and phosphorylation of the PolII C-terminal domain (CTD) (Kim et al., 1994). Through mechanisms unknown, Mediator has been proposed to transmit functional information from enhancer-bound TFs to the basal transcription machinery at promoters (Kagey et al., 2010; Lai et al., 2013). In addition, Mediator influences downstream PolII pausing and elongation through interactions with POLR2M and the super elongation complex (Cheng et al., 2012; Donner et al., 2010; Jishage et al., 2012; Takahashi et al., 2011). The importance of these activities is highlighted by the finding that mutations at various Mediator subunits cause marked defects in gene expression and disease in humans (reviewed in (Spaeth et al., 2011)).
Structurally, Mediator is organized into Head, Middle, Tail, and CDK8 Kinase (CKM) modules (Asturias et al., 1999; Plaschka et al., 2016). The complex is stabilized by inter-module interactions facilitated by MED14, which functions as a backbone for Mediator assembly (Cevher et al., 2014; Tsai et al., 2014; Tsai et al., 2017). Structural and functional studies have revealed that subunits of the Head and Middle modules associate through MED14 to form a functional and structural core primarily responsible for interaction with PolII, while the more variable Tail includes subunits that contact activators and repressors (Cevher et al., 2014; Jeronimo and Robert, 2017; Nozawa et al., 2017; Plaschka et al., 2015; Robinson et al., 2016; Tsai et al., 2014; Tsai et al., 2017). By and large, our understanding of Mediator structure-function correlations is derived from yeast studies, as yeast complexes are easier to purify in the amounts required for structural characterization. Such studies point to a mechanism dependent on Mediator structural rearrangements required for interaction with the basal transcription machinery and PIC stabilization (Tsai et al., 2017). Like its yeast counterpart, metazoan Mediator displays minimal enzymatic activity, despite inclusion of 8 additional subunits. Although only a subset of metazoan-specific subunits have been reported to be essential for in vitro transcription and embryonic development, their conservation suggests they likely contribute to the increased complexity of transcriptional regulation in higher organisms.
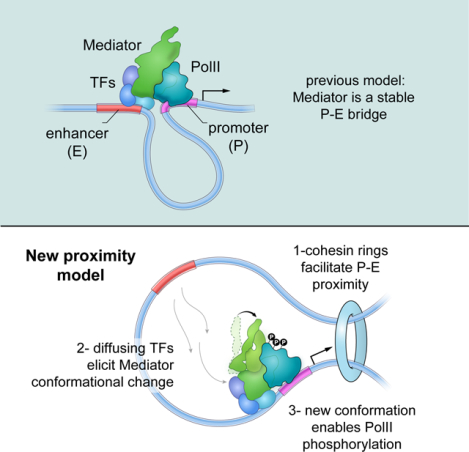
In this report we present a comprehensive study of mMED that combines CRISPR-Cas9 screens, two degron systems, functional and structural analyses of subunit deletions, and a 5.9 Å cryo-EM map of the complex. Our results provide fundamental mechanistic and functional insights into metazoan Mediator, including how targeting of non-core subunits by activators might influence transcription initiation through effects on Mediator conformation and recruitment. The data also clarify Mediators’ role in nuclear architecture by showing that rather than creating a stable topological bridge, Mediator impacts promoter-enhancer contacts indirectly, via recruitment of architectural proteins.
RESULTS
EM analysis of mMED
To investigate mMED structure and subunit organization, including the location of metazoan-specific subunits, we used cryo-EM to obtain a sub-nanometer resolution map of the complex. We immunopurified mMED from CH12 B cells in which MED19 was FLAG-tagged at its N-terminus via CRISPR-Cas9. We prepared cryo-EM specimens on thin amorphous carbon substrates. Both untilted and tilted (20°) cryo-EM images were recorded, as mMED particles tended to adopt one of two main orientations. Final refinement of alignment parameters for 163,184 selected images (~20% from 20° tilted micrographs) resulted in a mM ED cryo-EM map with an overall resolution of 5.9 Å (Figures 1A and S1A–E).
Figure 1. mMED cryo-EM map and module organization.
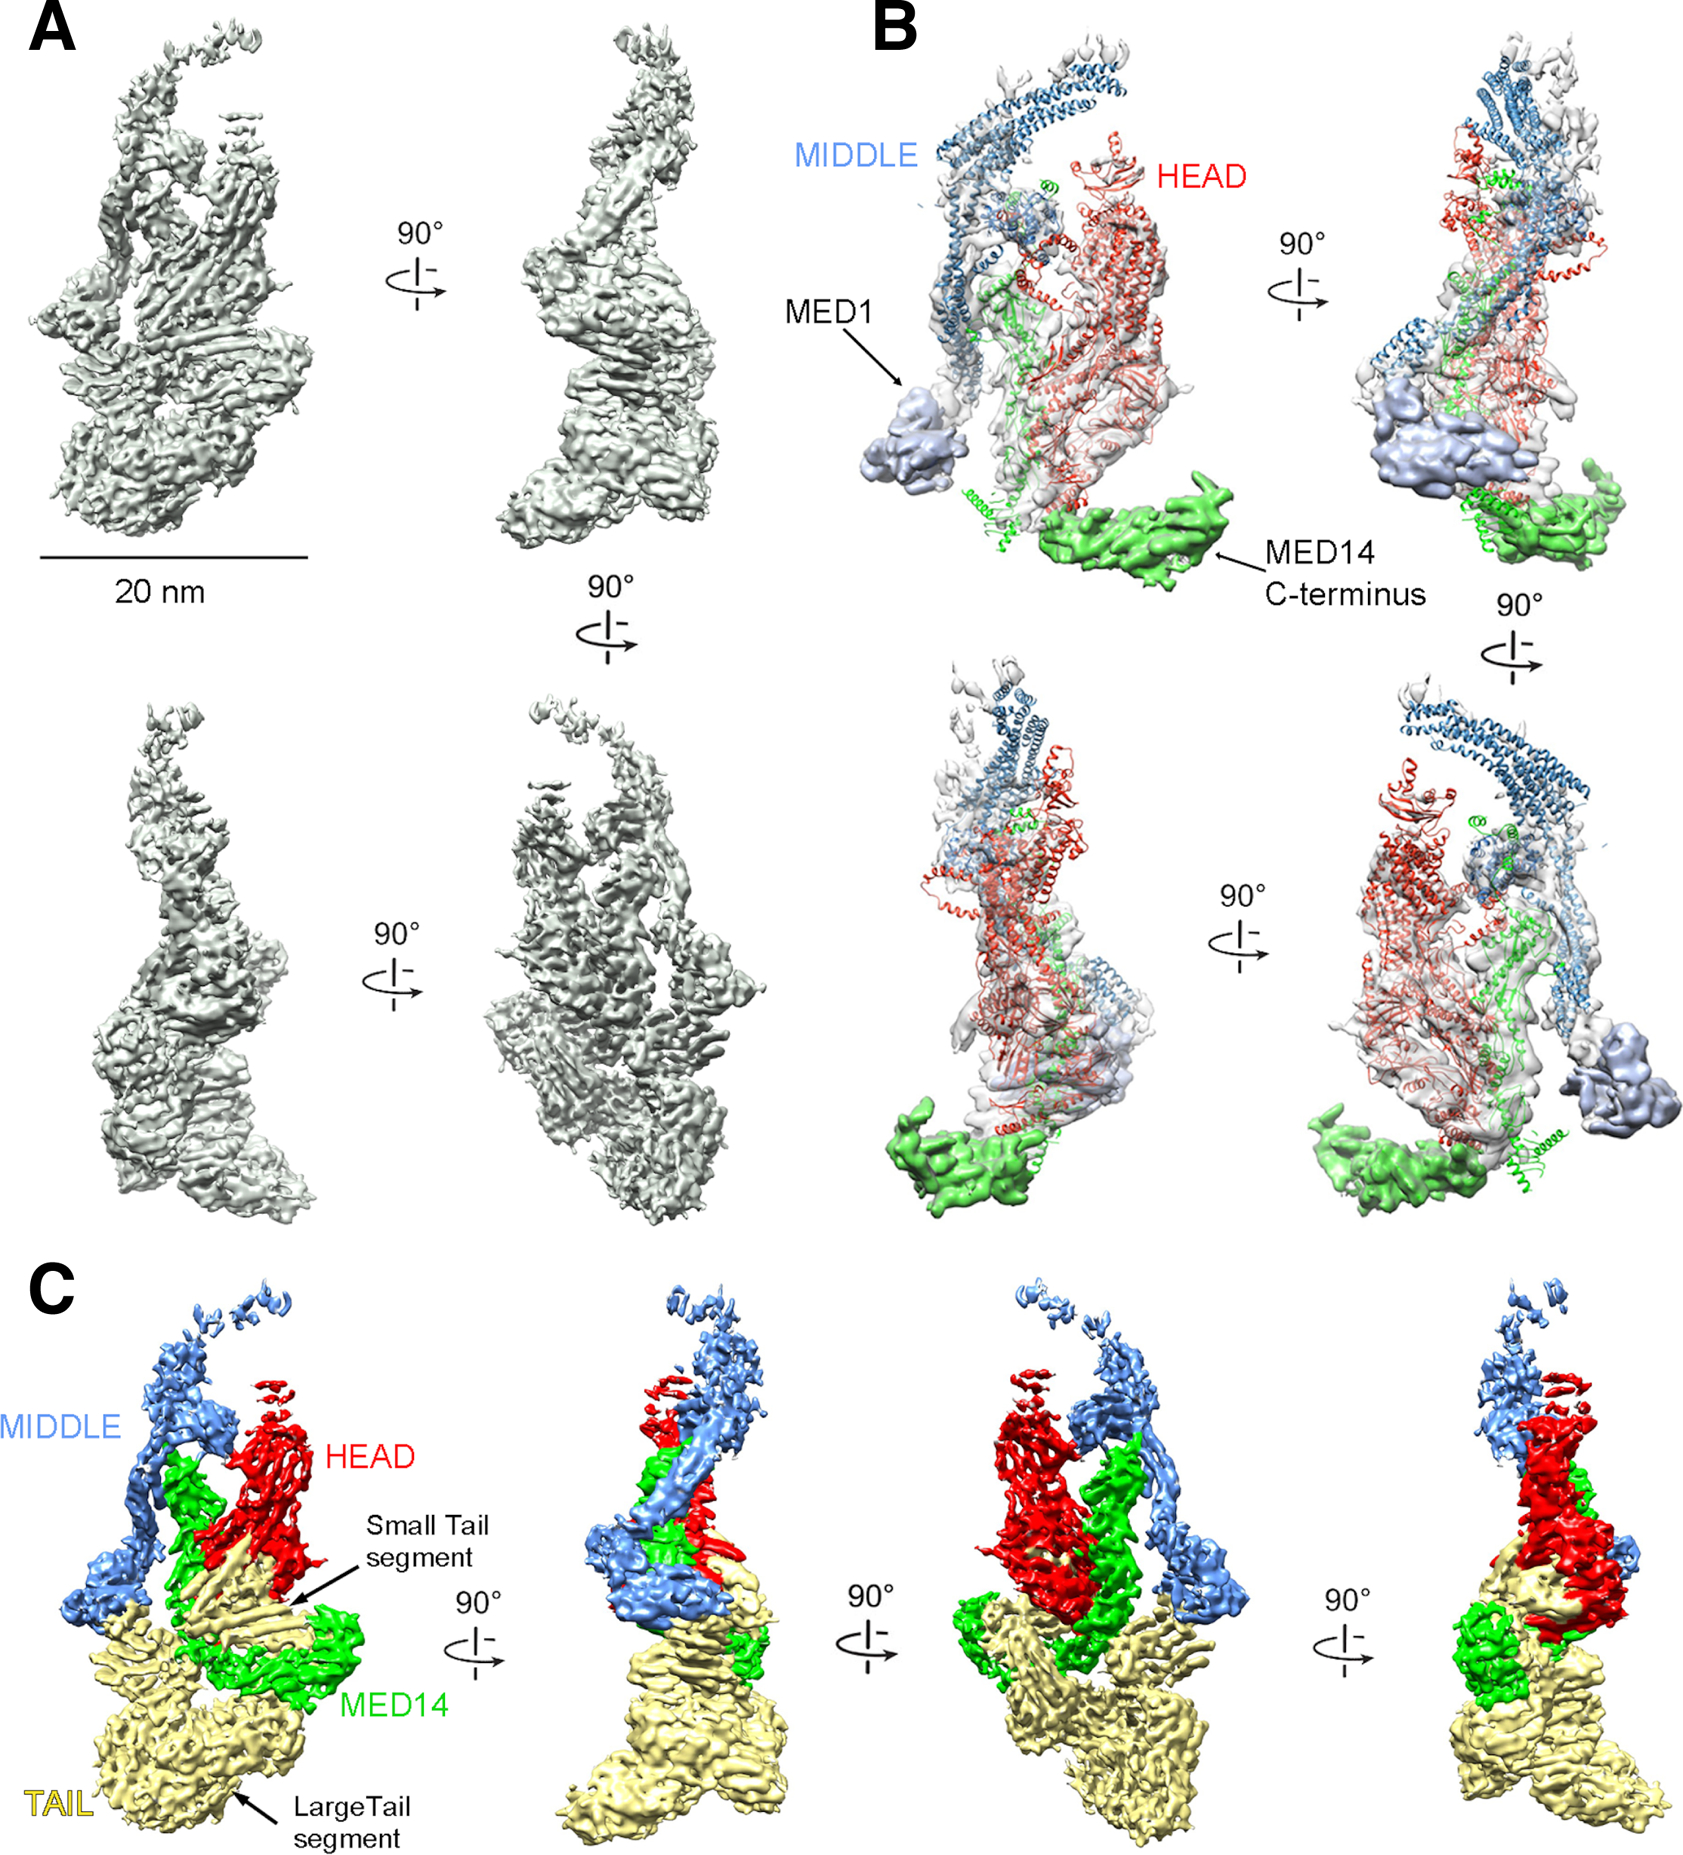
(A) mMED cryo-EM map at 5.9Å resolution. (B) Comparison between mMED core (transparent gray) and the atomic model of Sp Mediator core (Head in red; Middle in blue, Med14 in green). (C) Views of mMED cryo-EM map segmented by modules (Head, Middle and MED14 colored as in (B) and Tail in light yellow).
A large portion of the mMED structure closely matched that of the Head, Middle and Med14 portions of the S. cerevisiae (Sc) and S. pombe (Sp) Mediators (Figure 1B). By localizing key Head and Middle module mammalian subunits and the MED14 C-terminus (Figure S2 and Table S1B), we confirmed that the relative arrangement of core mMED subunits, except for a larger MED14 C-terminus, show remarkable similarity to yeast core Mediator (Figure 1B). This is consistent with results from cross-linking/mass spectrometry analysis of human core Mediator (Cevher et al., 2014).
By determining the boundaries of Head, Middle and MED14 in mMED, based on homology to Sp Mediator, we identified all non-core density in the mammalian structure (Figure 1C). For the sake of clarity and consistency with previous work (Plaschka et al., 2015; Tsai et al., 2014; Tsai et al., 2017), we defined all non-core density as belonging to the Tail module (Figure 1C). Until now, our structural understanding of the Tail was limited by high mobility of this module in yMED (Plaschka et al., 2015; Robinson et al., 2016; Tsai et al., 2014). In agreement with biochemical studies (Li et al., 1995), the cryo-EM structure of Sc Mediator showed the Tail connecting to the core through density formed by the Med14 C-terminus, in an interaction likely involving some portion of a Med2-Med3-Med15 subcomplex (Nozawa et al., 2017; Robinson et al., 2016; Tsai et al., 2014). In mMED, the MED14 C-terminus is involved in Tail anchoring, but the core-Tail interface is considerably more extensive and intricate, including additional contacts between the Tail and both the Head and Middle (Figure 1C).
Arrangement and structure of the mammalian Tail module
The mMED Tail is divided into two connected segments. The upper, smaller one (~165 kDa, based on its volume in the cryo-EM map) is contiguous to the Head jaws and wraps around the MED14 C-terminus. The second, larger Tail segment (~380 kDa) corresponds in position to the Sc Tail module (Figure 1C). We combined subunit deletion and tagging with EM imaging to reveal the location of specific Tail subunits. Difference mapping after deletion of MED23, the largest Tail subunit, localized it to the distal end of the larger Tail segment (Figure S2A–B). Fitting the X-ray structure of human MED23 (Monte et al., 2018) into the corresponding portion of the mMED map highlighted both conservation of MED23 structure and the quality of the cryo-EM map (Figure 2A). After computationally removing MED23 density, the remaining portion of the large Tail segment matched closely the structure of the Sc Tail (Tsai et al., 2014) (Figure 2B). This, along with sequence homology between yeast Med5 and mammalian MED24 suggested that density adjacent to MED23 corresponds to MED24. This was confirmed by maltose-binding protein (MBP) tagging of the MED24 C-terminus, which localized the MED24 C-terminus to a largely helical domain that extends upwards from the distal end of the Tail and contacts MED1 (Figures 2C and S3). This is consistent with secondary structure predictions for the MED24 C-terminus and with a reported interaction between Sc MED5 (MED24 homolog) and MED1 (Robinson et al., 2016). Structural homology between the mammalian and yeast Tail, and observation of a MED23-MED24-MED16 Tail submodule (Ito et al., 2002; Stevens et al., 2002) indicates that density in the middle portion of the larger Tail segment corresponds to MED16. The molecular mass of MED23-MED24-MED16 (~365 kDa) corresponds within <10% to the mass expected based on the volume of the large Tail segments in the mMED map. The final component of the larger Tail segment is MED25, a subunit that appeared to be substoichiometric in our MED19-FLAG mMED preparations, and which we localized to a position between the MED24 N-terminus and MED16 by subtracting class averages of MED19-FLAG mMED from MED25-FLAG mMED in which MED25 was enriched (Figure S2A–B). We obtained further information about MED25 by subtracting the MED19-FLAG mMED from a ~5.5 Å cryo-EM map calculated from images of MED25-FLAG mMED (Table S1A and Figure S1F–K)). This resulted in a 3D difference map showing MED25 density in the same location identified by 2D difference mapping (Figure S2C). The 3D difference analysis shows that MED25 occupies a central position in the large Tail segment, wedged at the intersection of MED16, MED23 and MED24 N-terminus. This is consistent with biochemical analysis of Tail subunit interactions in human Mediator (Tsai et al., 2014), which established that MED25 interacts extensively with MED16, MED23 and MED24.
Figure 2. mMED Tail structure, subunit organization and core interactions.
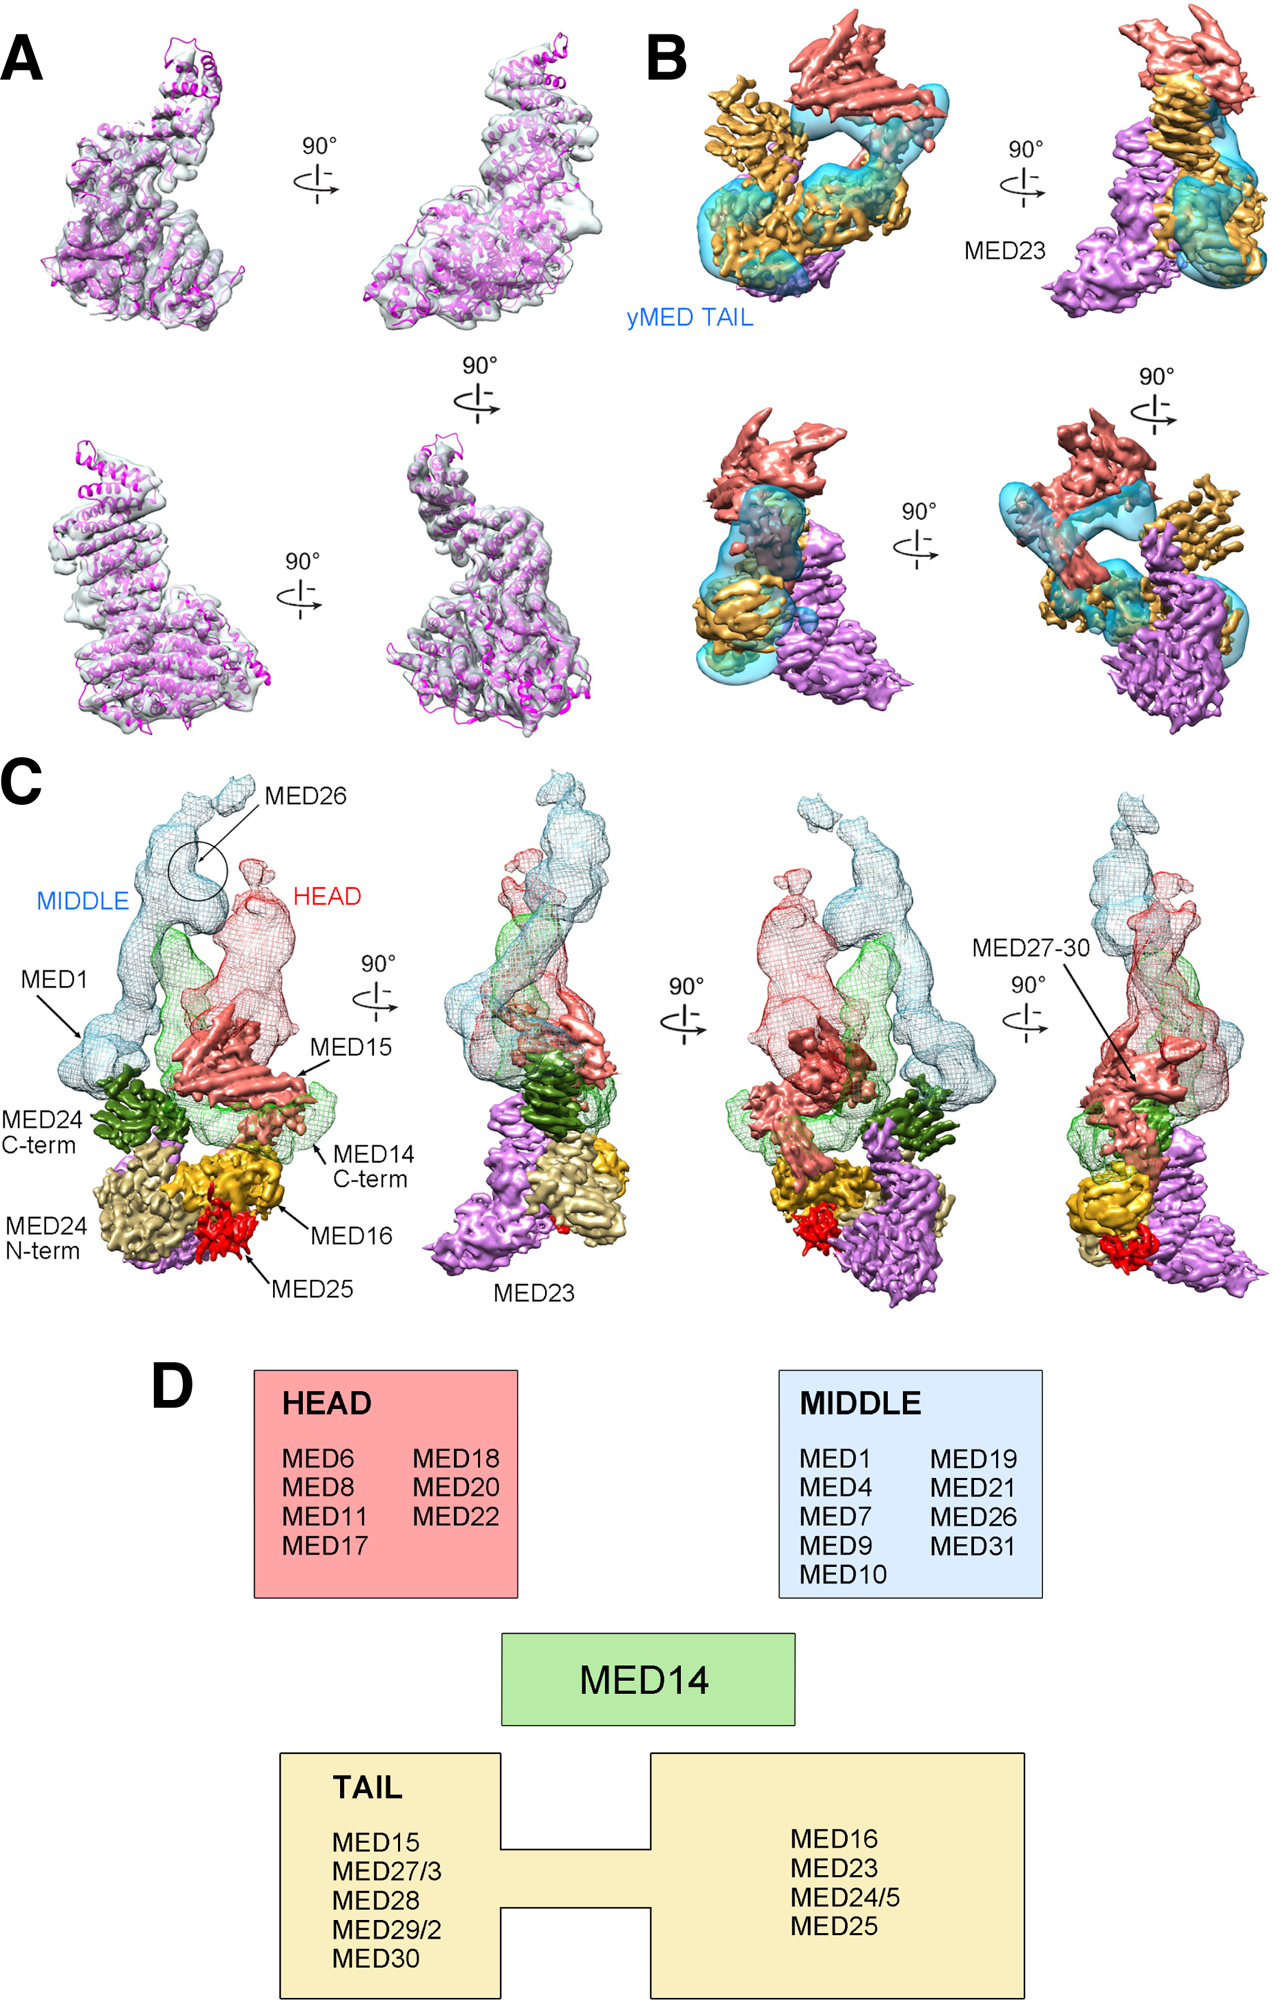
(A) Fit of the MED23 X-ray structure into the corresponding portion of mMED Tail cryo-EM map. (B) Comparison between cryo-EM maps of the mMED Tail (large segment in solid gold, small segment in solid salmon, and MED23 in transparent light purple) and the Sc Tail (transparent blue). (C) Subunit organization and interaction of the mMED Tail. The large Tail segment includes MED16 (gold), MED23 (light purple), MED24 (N-terminal portion in tan; C-terminal portion in dark green) and MED25 (red). The smaller Tail segment (in salmon) includes MED15, and MED27–30. The large Tail segment interacts (through the C-terminal portion of MED24) with MED1 in the Middle module (blue mesh) and with the C-terminus of MED14 (light green mesh). The smaller mMED Tail segment also interacts with the MED14 C-terminus and with the lower part of the Head (red mesh), including the MED18-MED20 Head jaws. The general position of MED26 from EM analysis of human Mediator is indicated. (D) Module assignment for mMED subunits based on EM analysis results. MED14, which functions as a central scaffolding subunit, was not assigned to a specific module.
The remaining mMED Tail subunits were localized, through various approaches, to the small Tail segment, but their precise position and boundaries were not determined. Deletion of MED15 caused a decrease in density in the area surrounding the MED14 C-terminus (Figure S2), consistent with the position of Med15 in Sc Mediator (Tsai et al., 2014). MBP tagging and EM imaging established that, along with MED15, subunits MED28, MED29 and MED30 are adjacent to the Head jaws in the smaller Tail segment. Consistent with close interaction between yeast Tail subunits Med2-Med3-Med15 (Tsai et al., 2014; Zhu et al., 2015), partial mass spectrometry analysis of mMED identified a small number of high-confidence crosslinks (not shown) between MED27 and MED14 C-terminus (MED14(AA697) – MED27(AA42)), placing MED27 in the upper Tail segment. The combined mass of subunits in the upper Tail segment (MED15, MED27, MED28, MED29, and MED30; ~180 kDa) is consistent with the size of the corresponding density in the cryo-EM map. Localization of MED27, MED28, MED29 and MED30 to the upper Tail segment adjacent to the Head is consistent with biochemical analysis of Tail subunit interactions in human Mediator (Tsai et al., 2014), which showed that these four subunits interact extensively with Head components. Finally, previous EM analysis of human Mediator placed MED26 around the hook that forms the upper end of the Middle module (Tsai et al., 2014), completing mMED subunit localization and module assignment (Figure 2D).
The 5.9 Å cryo-EM mMED map greatly increases our understanding of Mediator’s structure, particularly the Tail module. Compared with yMED, the presence of metazoan-specific subunits results in a Tail-core interface that is more extended, involves more inter-module contacts and results in a stable conformation. The Tail is a primary target of TFs, suggesting that its increased complexity could offer opportunities for more intricate transcriptional regulation in higher eukaryotes.
Genetic analysis of mMED
To investigate the functional implications of mMED structure, we pursued comprehensive genetic analyses of Mediator in mouse cells. We did this by targeting all 33 subunits in T cells (primary and EL4), B cells (CH12), and ES cells using CRISPR-Cas9 (Figures S4, S5 and Table S1C). A total of 16,399 targeted clones were analyzed (Table S1D). Remarkably, the genetic screen was 88% (29 of 33) concordant between B, T, and ES cells (Figure 3A). In total, 15 subunits were essential for viability in all cell types, while 14 subunits could be homozygously deleted (Figure 3A). Only four subunits showed variability: MED12 was essential in B and T cells but not in ES cells, consistent with its key role in hematopoiesis but not in the development of other lineages (Aranda-Orgilles et al., 2016); MED9 and MED13 were essential in T cells; and MED26 was lethal in T and ES cells but not in B cells (Figure 3A).
Figure 3. mMED genetic and functional analysis.
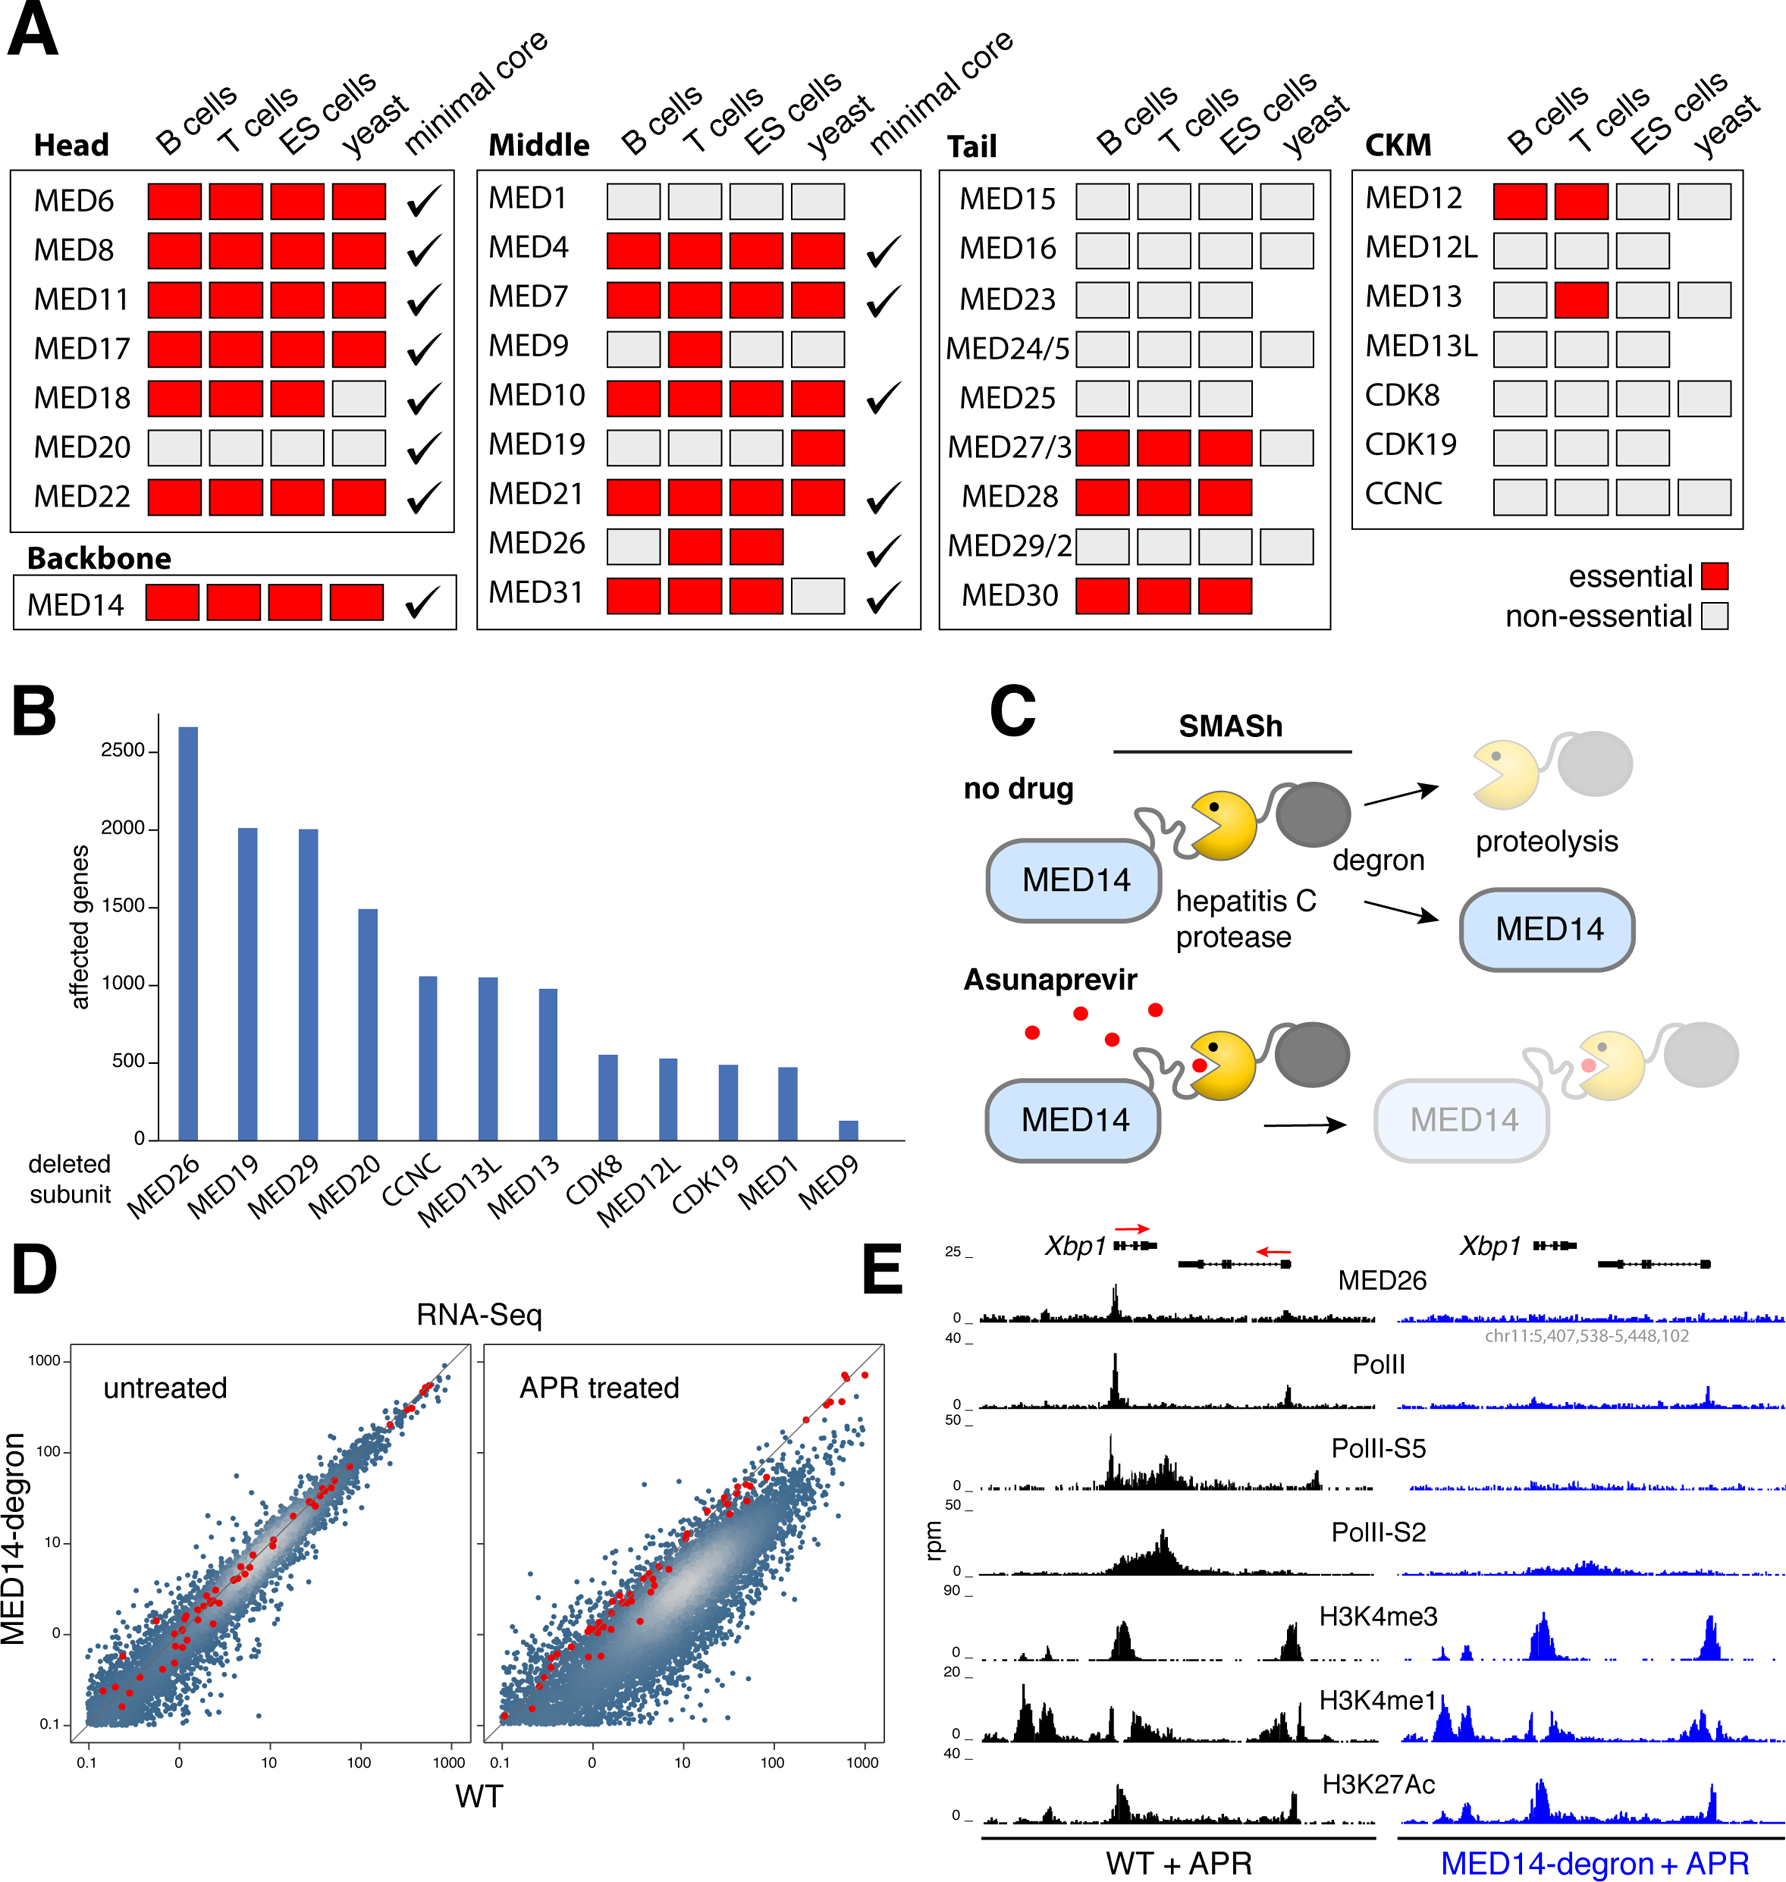
(A) Genetic screen from mouse T, B and ES cells compared to yeast and the hMED minimal core. Essential subunits denoted with red boxes, non-essential with grey ones, minimal core subunits with checkmarks. (B) Bar graph shows the number of transcriptionally affected genes (>1.5 fold) in CH12 B cells deficient for non-essential (non-tail) mMED subunits. (C) Schematic showing MED14-degron strategy. A SMASh tag consisting of a linker, the hepatitis C protease, and a degron subunit was fused to MED14-N terminus. In untreated cells, the protease frees MED14 from SMASh, which is degraded. The hepatitis C protease inhibitor Asunaprevir blocks SMASh cleavage leading to MED14 degradation. (D) Transcriptome analysis of APR-treated Med14SMASh vs. control cells. Red dots represent mRNA spike-ins used to normalize signals on a per cell basis. (E) Med26, PolII, PolII-S5, PolII-S2, H3K4me3, H3K4me1, and H3K27Ac ChIP-Seq profiles at the Xbp1 locus in APR-treated WT (left) or Med14SMASh (right) cells. The orientation of genes is denoted with red arrows.
Compared to yeast, the genetic screen was 72% concordant (18 of 25), with 7 subunits showing lethality in only one species (Figure 3A). Also, compared to the human core (Cevher et al., 2014), which represents the minimal complex capable of basal transcription in nuclear extracts, there was a 73% concordance (24 of 33, Figure 3A).
The essential nature of most mMED core subunits is consistent with the conservation of core Mediator and PIC structures across eukaryotes. At the same time, our results imply that in vivo transcription and overall viability of mammalian cells require Mediator subunits absent in yeast or the minimal core.
Functional analysis of mMED core subunits
To test the in vivo role of non-essential subunits that are not part of the Tail, we applied RNA-Seq. Based on a 1.5-fold cutoff (p < 0.01), we found only a relatively small number of genes affected in each knockout, from 2,675 genes in Med26−/− cells to 133 in Med9−/− (Figure 3B). Consistent with the notion that Mediator links PolII to activators and inhibitors, affected genes were both up and downregulated (Figure S6A). The reproducibility of RNA-Seq was confirmed by deleting mMED subunits with different sgRNA pairs (Figure S6B). Thus, Mediator subunits not required for PIC interaction or cell viability control transcription of a subset of mammalian genes.
To determine the full range of genes regulated by mMED we fused the MED14 backbone to a self-excising hepatitis C virus (HCV) protease-degron (SMASh (Chung et al., 2015), Figure 3C). In the presence of the HCV inhibitor Asunaprevir (APR), SMASh is not cleaved, leading to efficient MED14 degradation between 30–60h (Figure S6C). This led to a cell cycle arrest at ~30h and a reduction in cell size, whereas WT cells were impervious to treatment (Figure S6D–E). These phenotypes were transient, as drug removal restored normal size and proliferation (Figure S6E and not shown). To measure the absolute number of mRNA transcripts before and after APR treatment we spiked-in mRNA standards. This normalization revealed a global, ~7-fold downregulation of the transcriptome in APR-treated cells by 60h (Figure 3D).
Transcriptome downregulation and the small size of mMED-depleted CH12 B cells closely recapitulated the phenotype of quiescent G0 primary B cells, which display basal levels of transcription in part due to poor TFIIH expression (Kouzine et al., 2013). Consistent with Mediator’s role in the recruitment and phosphorylation of PolII via TFIIH, PolII and PolII-S5 were markedly depleted from promoters following mMED depletion (Figure 3E and S6F). Consequently, elongating PolII-S2 complexes were also reduced from gene bodies. These results support the notion that Mediator stabilizes the PIC and facilitates CTD phosphorylation (Eychenne et al., 2016; Soutourina, 2018). Thus, in contrast to non-essential Mediator subunits which regulate expression of a fraction of genes, the full complex is required for global PolII recruitment and transcriptome amplification in mammalian cells. Conversely, epigenetic accessibility does not require Mediator (Figure 3E and S6F).
Functional analysis of the mMED Tail module
One limitation of the MED14-degron is that it cannot distinguish between Mediator’s role at activating PolII at promoters from its role as docking site for enhancer-bound TFs. We thus deleted 5 subunits of the Tail module in CH12 B cells. Remarkably, Med15−/−Med16−/−Med23−/−Med24−/−Med25−/− cells (or Tailless) were viable, although their doubling time was increased from ~16h to ~24h (Figure S6G). Transcriptome analysis showed that the fraction of affected genes increased with the number of deleted subunits: from 163 for Med16−/− to 2,346 for Tailless (Figure 4A). Similar to other knockouts, affected genes were both up (901) and downregulated (1,445), and global PolII profiles reflected those patterns (Figure S6H). Notably, Tailless cells showed a modest (1.3-fold) but reproducible transcriptome downregulation (Figure 4B), reminiscent of the more pronounced one observed in mMED-depleted cells. This indicates that PolII activity is slightly affected across the genome when the Tail is absent. Single knockouts did not display such phenotype (Figure S6I).
Figure 4. Tailless mutant and effect of MED1 and Tail subunit deletions on mMED interaction with PolII and CKM.
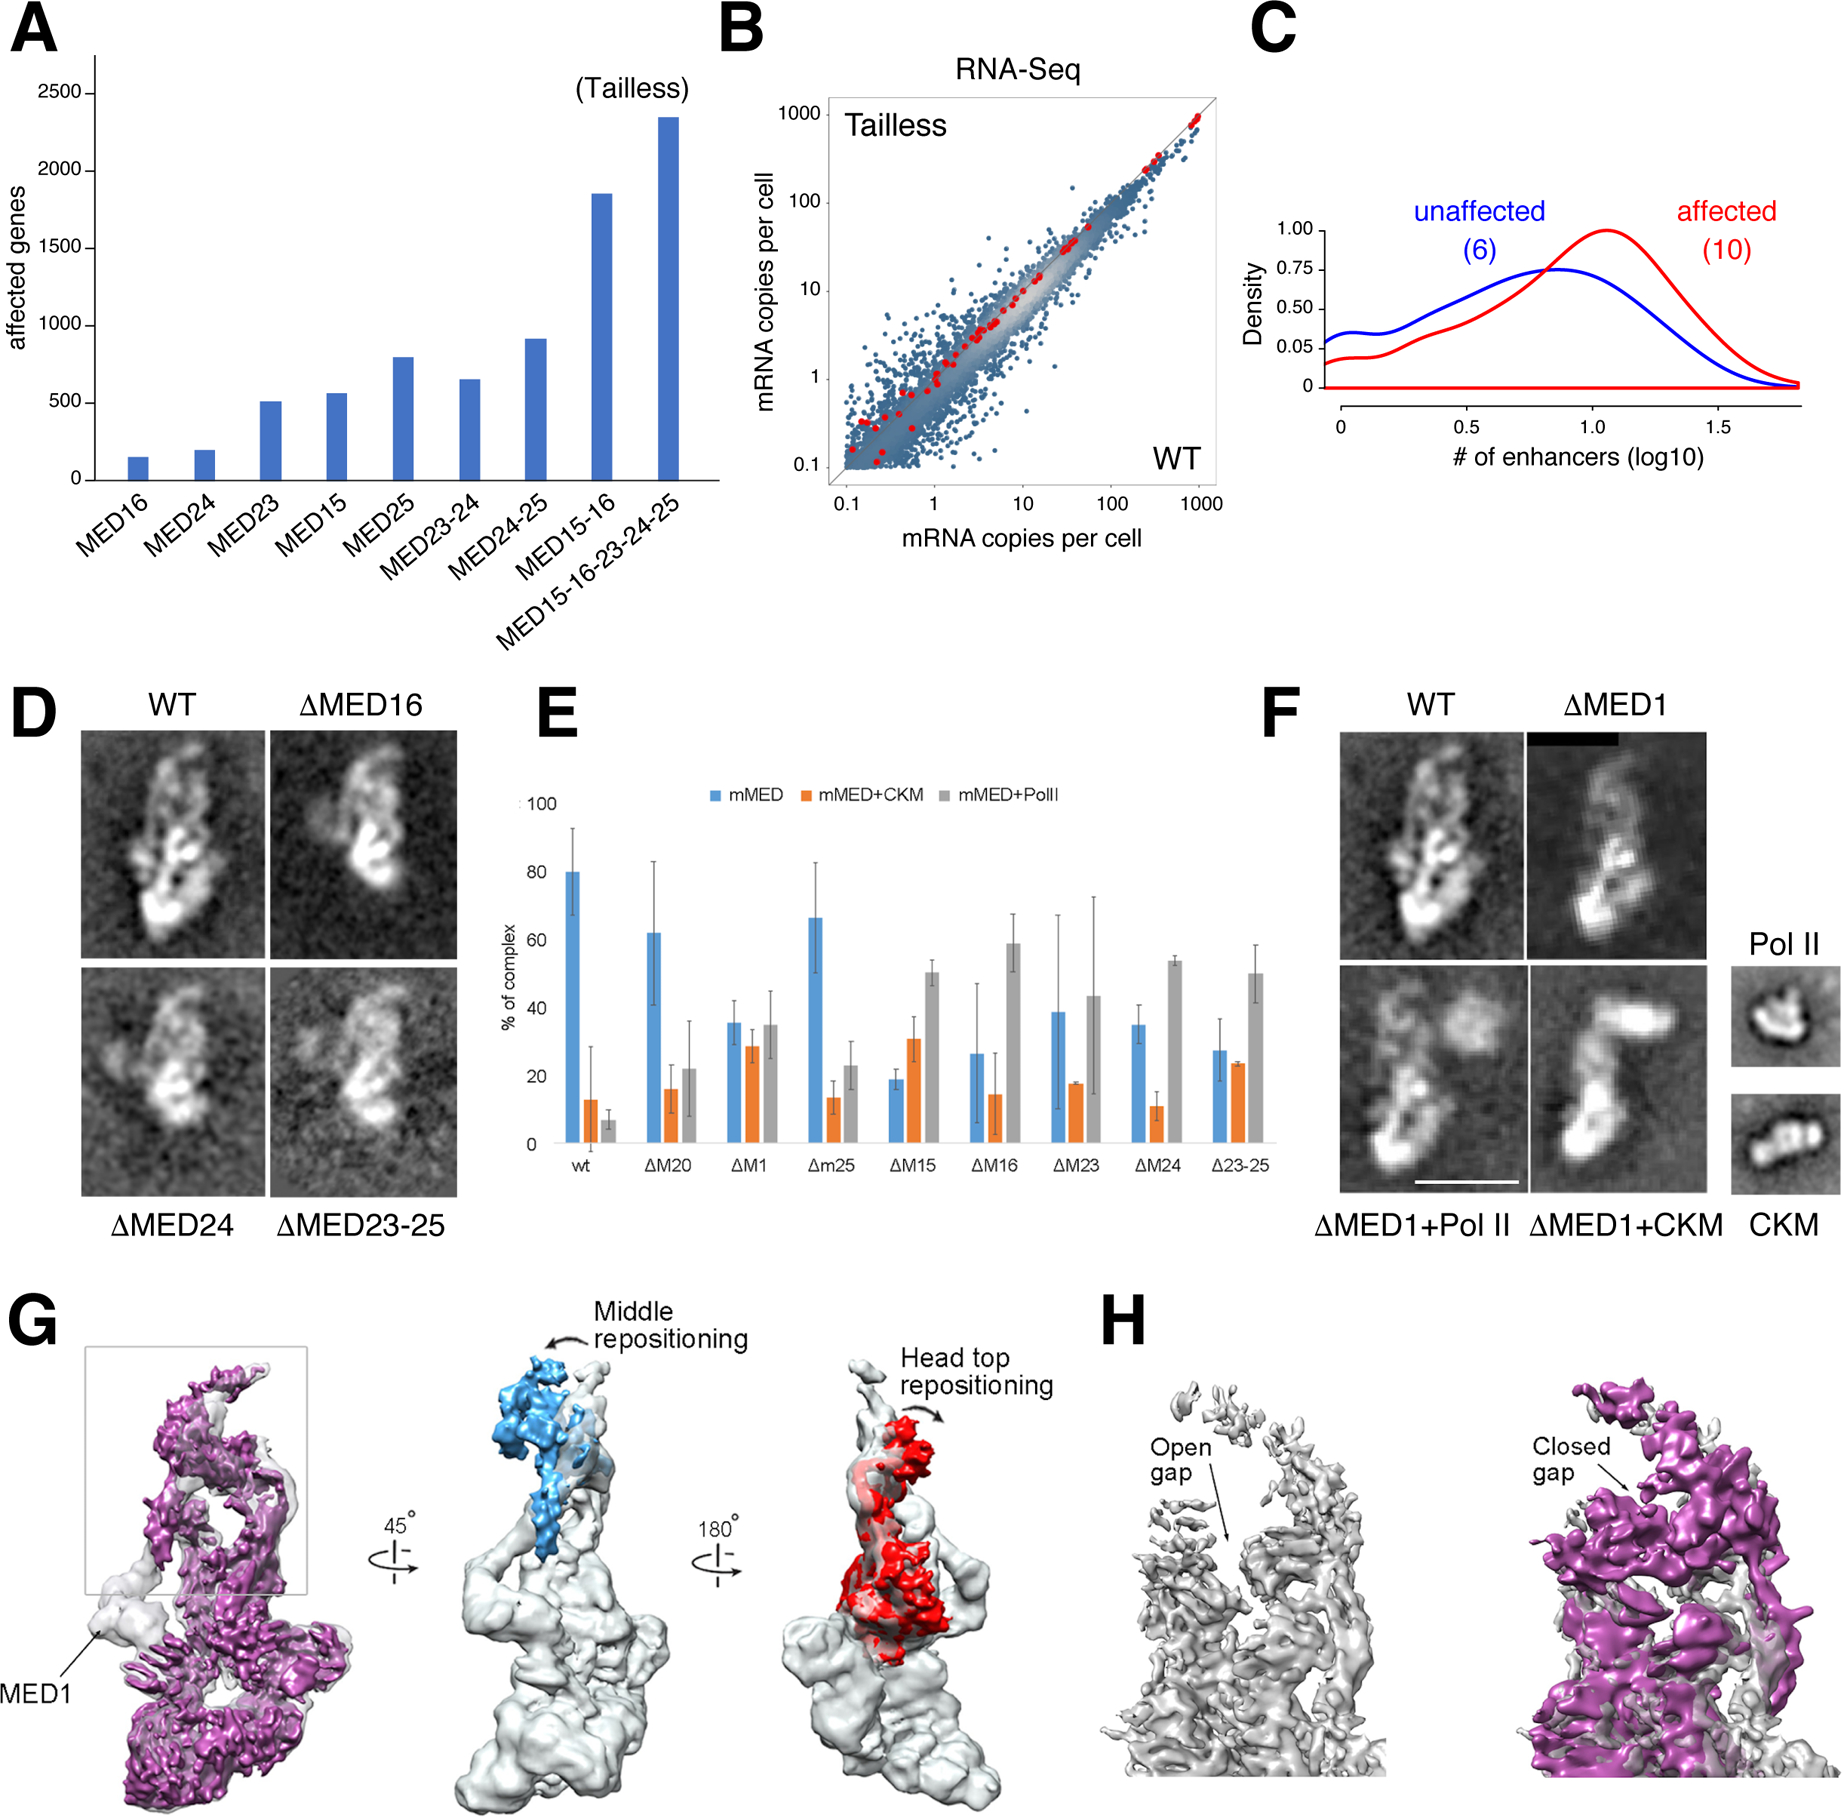
(A) Bar graph denotes transcriptionally affected genes (>1.5 fold) in Tail subunit KOs, including Tailless. (B) Scatter plot compares RNA-Seq from Tailless and WT controls. Red dots are spike-in controls. (C) Histogram showing the number of enhancers associated with affected (red) or unaffected (blue) promoters in Tailless. The median is shown in parenthesis. (D) 2D class averages of WT and single or multiple Tail subunit deletion mutants. Deletion of any subunit in the larger Tail segment (except MED23) results in loss of the entire segment. (E) Effect of MED1 and various Tail subunit deletions on mMED interaction with CKM and PolII. Error bars based on comparison of independent image clustering analyses. (F) 2D class averages calculated from images of ΔMED1, ΔMed1+PolII, and ΔMED1+CKM complexes. PolII and CKM class averages are included for comparison. Scale bar=20nm. (G) Comparison between cryo-EM maps of WT (MED19-FLAG; transparent gray) and ΔMED1 (solid magenta) cryo-EM maps at ~8Å resolution. Loss of MED1 in the ΔMED1 map breaks the connection between the Middle and Tail (leftmost panel) and results in large-scale changes in mMED conformation. The Middle module (blue) and the Head’s neck (red) move closer to each other. (H) Middle-Head repositioning results in closing of the CTD-binding gap (MED19-FLAG transparent gray, ΔMED1 purple; back view opposite to front view shown in leftmost panel).
As Mediator core contacts PolII and GTFs, while the Tail associates primarily with TFs, we explored whether genes deregulated in Tailless rely more readily on enhancers for transcription than unaffected ones. Indeed, promoters of affected genes are associated on average with 10 H3K27Ac+H3K4me1+ enhancers, compared to 6 for unaffected ones (p < 2.2e-16, Figure 4C and S6J). This supports the notion that mMED Tail creates a functional bridge between TFs and PolII.
Tail modulation of Mediator-PolII and Mediator-CKM interactions
A key question in the field is how Mediator contributes to TF activation of PolII. Cryo-EM analysis of Tail mutants provided two important clues:
First, deletion of MED15, MED16, MED24, or MED23-24-25 destabilized the Tail module or its interaction with the core, as the larger Tail segment was absent in 2D class averages of these mutants (Figure 4D). Multidimensional protein identification technology (MudPIT) confirmed that this was due to absence of the corresponding Tail subunits, rather than failure to detect their density due to increased mobility (Table S1E). This points to a highly-integrated Tail organization, whose interaction with core Mediator depends on the presence of multiple, specific Tail-core contacts. For example, despite the fact that MED23 does not contact the core directly, a fraction of ΔMED23 particles lacked Tail density (not shown). Thus, interactions between TFs and Tail subunits could affect Tail structure and, therefore, its interaction with the core.
Second, deletions that affect integrity of the Tail, or its interaction with the core, have a dramatic effect on Mediator interactions. In our mMED preparations, the vast majority of WT particles (~80%) were present as a free complex (Figure 4E). This was largely unchanged after deletion of MED20, a Head subunit not involved in primary Tail contacts, or deletion of MED25, a substoichiometric Tail subunit whose deletion does not affect overall Tail integrity or conformation. In contrast, disruption of Tail-Middle contacts in ΔMED1, or Tail subunit deletions that destabilize the Tail, resulted in a marked increase in mMED-PolII and mMED-CKM interactions (Figure 4E), as evidenced by the presence of a large fraction of mMED particles in which Mediator interacts with either PolII or the CKM (Figure 4F), but not with both at the same time.
Cryo-EM studies in Sp showed that Mediator-PolII contacts depend on a structural rearrangement that repositions the Middle module, closing a “gap” between the Head and the Middle’s “knob” domain where the PolII CTD binds (Tsai et al., 2017). We have proposed that this rearrangement is essential for stabilizing Mediator-PolII contacts and the PIC (Tsai et al., 2017). Although an interaction between Med5 (Tail) and Med1 (Middle) was detected in Sc through crosslinking-mass spectrometry analysis (Robinson et al., 2016), no extended contacts between the Tail and the Head or Middle are apparent in cryo-EM maps of yMED. In contrast, extended Tail interactions in mMED (Figures 1C and 2C), including the MED1-MED24 contact, result in a stable mMED conformation that, we suggest, precludes mMED rearrangements and limits its interaction with PolII. Disruption of the Tail or of Tail-core contacts would release constraints on mMED conformation, explaining the pronounced increase in association with PolII or the CKM.
To investigate whether changes in core-Tail interactions affect binding of PolII and the CKM near the mMED “hook,” located over 250 Å from the Tail ((Tsai et al., 2017) and Figures 4F and 1A), we pursued cryo-EM analysis of ΔMED1 (Table S1A and Figure S1L–P). We found that, although deletion of MED1 left the Tail intact, disrupting the MED1-MED24 contact repositioned the Middle module and closed the CTD binding gap, analogous to that seen during formation of the yMED-PolII holoenzyme (Figure 4G–H). As observed in yMED (Tsai et al., 2017), repositioning of the Middle module in mMED requires changes in MED14 (Figure 4G). Interestingly, changes in mMED conformation that bolster Mediator-PolII interactions are more complex, involving changes in Head conformation not observed in yMED (Figure 4G). The rearrangement of mMED evident in the ΔMED1 map provides a general rationale for the effect of Tail loss on mMED interaction with PolII and the CKM.
One can envision how TF targeting of the Tail could trigger rearrangements leading to mMED interactions with components of the basal transcription machinery. Interestingly, subunits of the small Tail segment (MED15, MED27–30) remain associated with the core upon loss of subunits of the large Tail segment (Table S1E). In fact, the most disruptive single-subunit Tail deletion was MED29, which resulted in both destabilization of the entire Mediator structure and a very strong slow growth phenotype (not shown). These observations suggest that metazoan-specific subunits likely impinge on Mediator interactions through further effects on Mediator structure and conformation.
The role of Mediator in promoter-enhancer interactions
TFs are believed to contact Mediator’s Tail within the context of stable chromatin loops tethering promoters to cognate enhancers (Kagey et al., 2010; Lai et al., 2013; Phillips-Cremins et al., 2013). However, the link between Mediator and promoter-enhancer (P-E) loops is correlative and relies mostly on knockdown experiments of CKM’s MED12, which should be excluded from any loop involving PolII (see Discussion). To directly assess whether Mediator is required for P-E contacts, we performed in situ Hi-C in mMED depleted B cells.
Notably, visual inspection of contact matrices revealed little or no difference in P-E interactions between Mediator-depleted and control cells (Figures 5A and S7A). It is plausible that strong CTCF loop anchors within the 5kB Hi-C bins used in our analysis have masked weak changes in contact frequency due to Mediator loss (e.g. Myc, Figure S7A). Therefore, we analyzed global P-E interactions, as defined by proximity or ChIA-PET, by excluding bins containing CTCF peaks. Despite the marked drop in Mediator and PolII occupancy at regulatory DNA, the composite analysis showed no obvious variation in the contact frequency of P-E pairs upon MED14 degradation (Figure 5B). We conclude that P-E interactions persist in mammalian cells where Mediator and PolII are acutely depleted.
Figure 5. P-E interactions are largely impervious to acute removal of Mediator and PolII but dependent on cohesin.
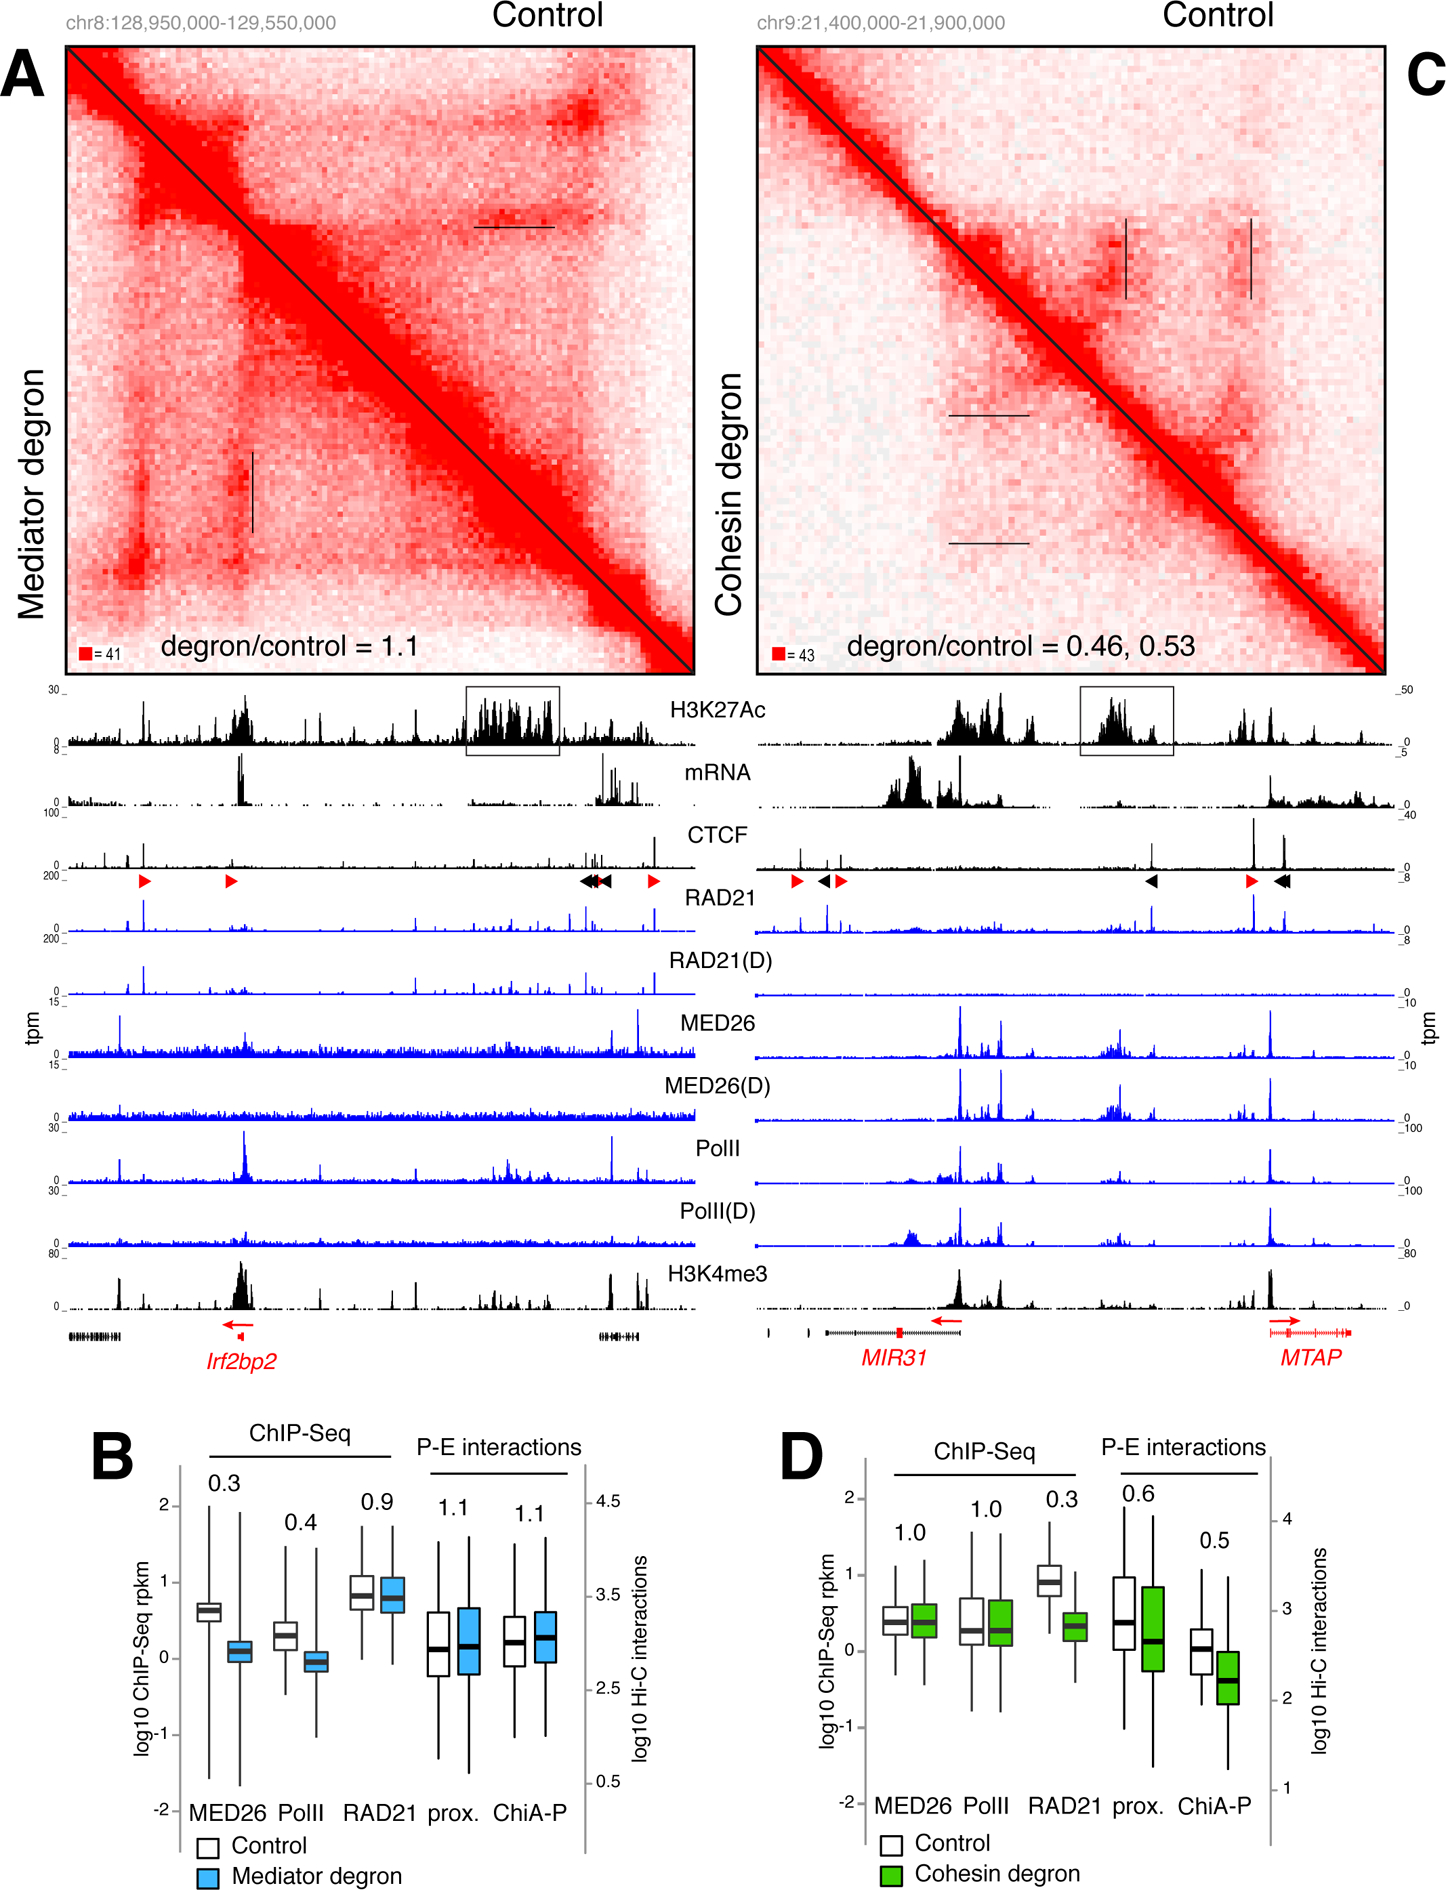
(A) Hi-C contact matrices for the Irf2bp2 locus in Mediator degron (lower left) vs. control WT cells (upper right). Irf2bp2 promoter-SE contacts are underlined in the matrices and the ratio of Hi-C signals between degron and control (1.1) are indicated. H3K27Ac, mRNA, CTCF, RAD21, MED26, PolII, and H3K4me3 ChIP-Seq tracks are shown and the SE is boxed. D = degron treatment. (B) Box plot comparing MED26, PolII, and RAD21 signals in control (empty) or Mediator degron (blue) cells. Comparison of P-E interactions as determined by enhancer proximity (left) or ChIA-PET (right) are shown. (C) Same analysis as in A for the MIR31 locus in HCT116 RAD21 degron and controls cells. Hi-C signal ratio for MIR32 and MTAP promoters are 0.45 and 0.53 respectively. (D) Same analyses as in B for HCT-116 cells. For B and D data are represented as mean +/− SEM.
Using an auxin-inducible degron in HCT-116 cells we recently showed that cohesin loss eliminates all architectural loops but does not alter the integrity or co-segregation of compartment domains (Rao et al., 2017; Vian et al., 2018). Notably, RAD21 depletion led to a significant loss (~0.5 fold) in P-E contacts, while recruitment of PolII or MED26 was unaltered (Figures 5C–D and S7B).
One potential caveat of our experiments is that it takes >30h for MED14 to be fully degraded in CH12 B cells, whereas RAD21 is depleted in 6h in HCT116 cells. Conceivably, B cells may compensate for the loss of Mediator by adjusting their architecture over time. Furthermore, comparing cohesin and Mediator depletion in different cell types from different species makes it difficult to monitor changes in the same genes. To overcome these issues, we developed a system whereby the Mediator-PolII complex and cohesin can be rapidly and independently depleted in the same cells. We did this by deleting one allele of PolII’s largest subunit RPB1 in HCT-116 RAD21degron cells and exposing them to α-amanitin (Figure 6A), which efficiently degrades RPB1 (Nguyen et al., 1996). In the RPB1+/− background, PolII levels are undetected following α-amanitin treatment for 3h (Figure S7C). This led to full depletion of PolII and Mediator from chromatin (Figure 6B) and cell cycle arrest (Figure S7D). As expected, RAD21 was degraded in the presence of auxin but unaffected by α-amanitin (Figure 6B). Consistent with the notion that transcription is not required for cohesin extrusion (Vian et al., 2018), auxin removal in the presence of α-amanitin fully restored RAD21 occupancy (Figure 6B).
Figure 6. Analysis of Mediator-PolII degron.
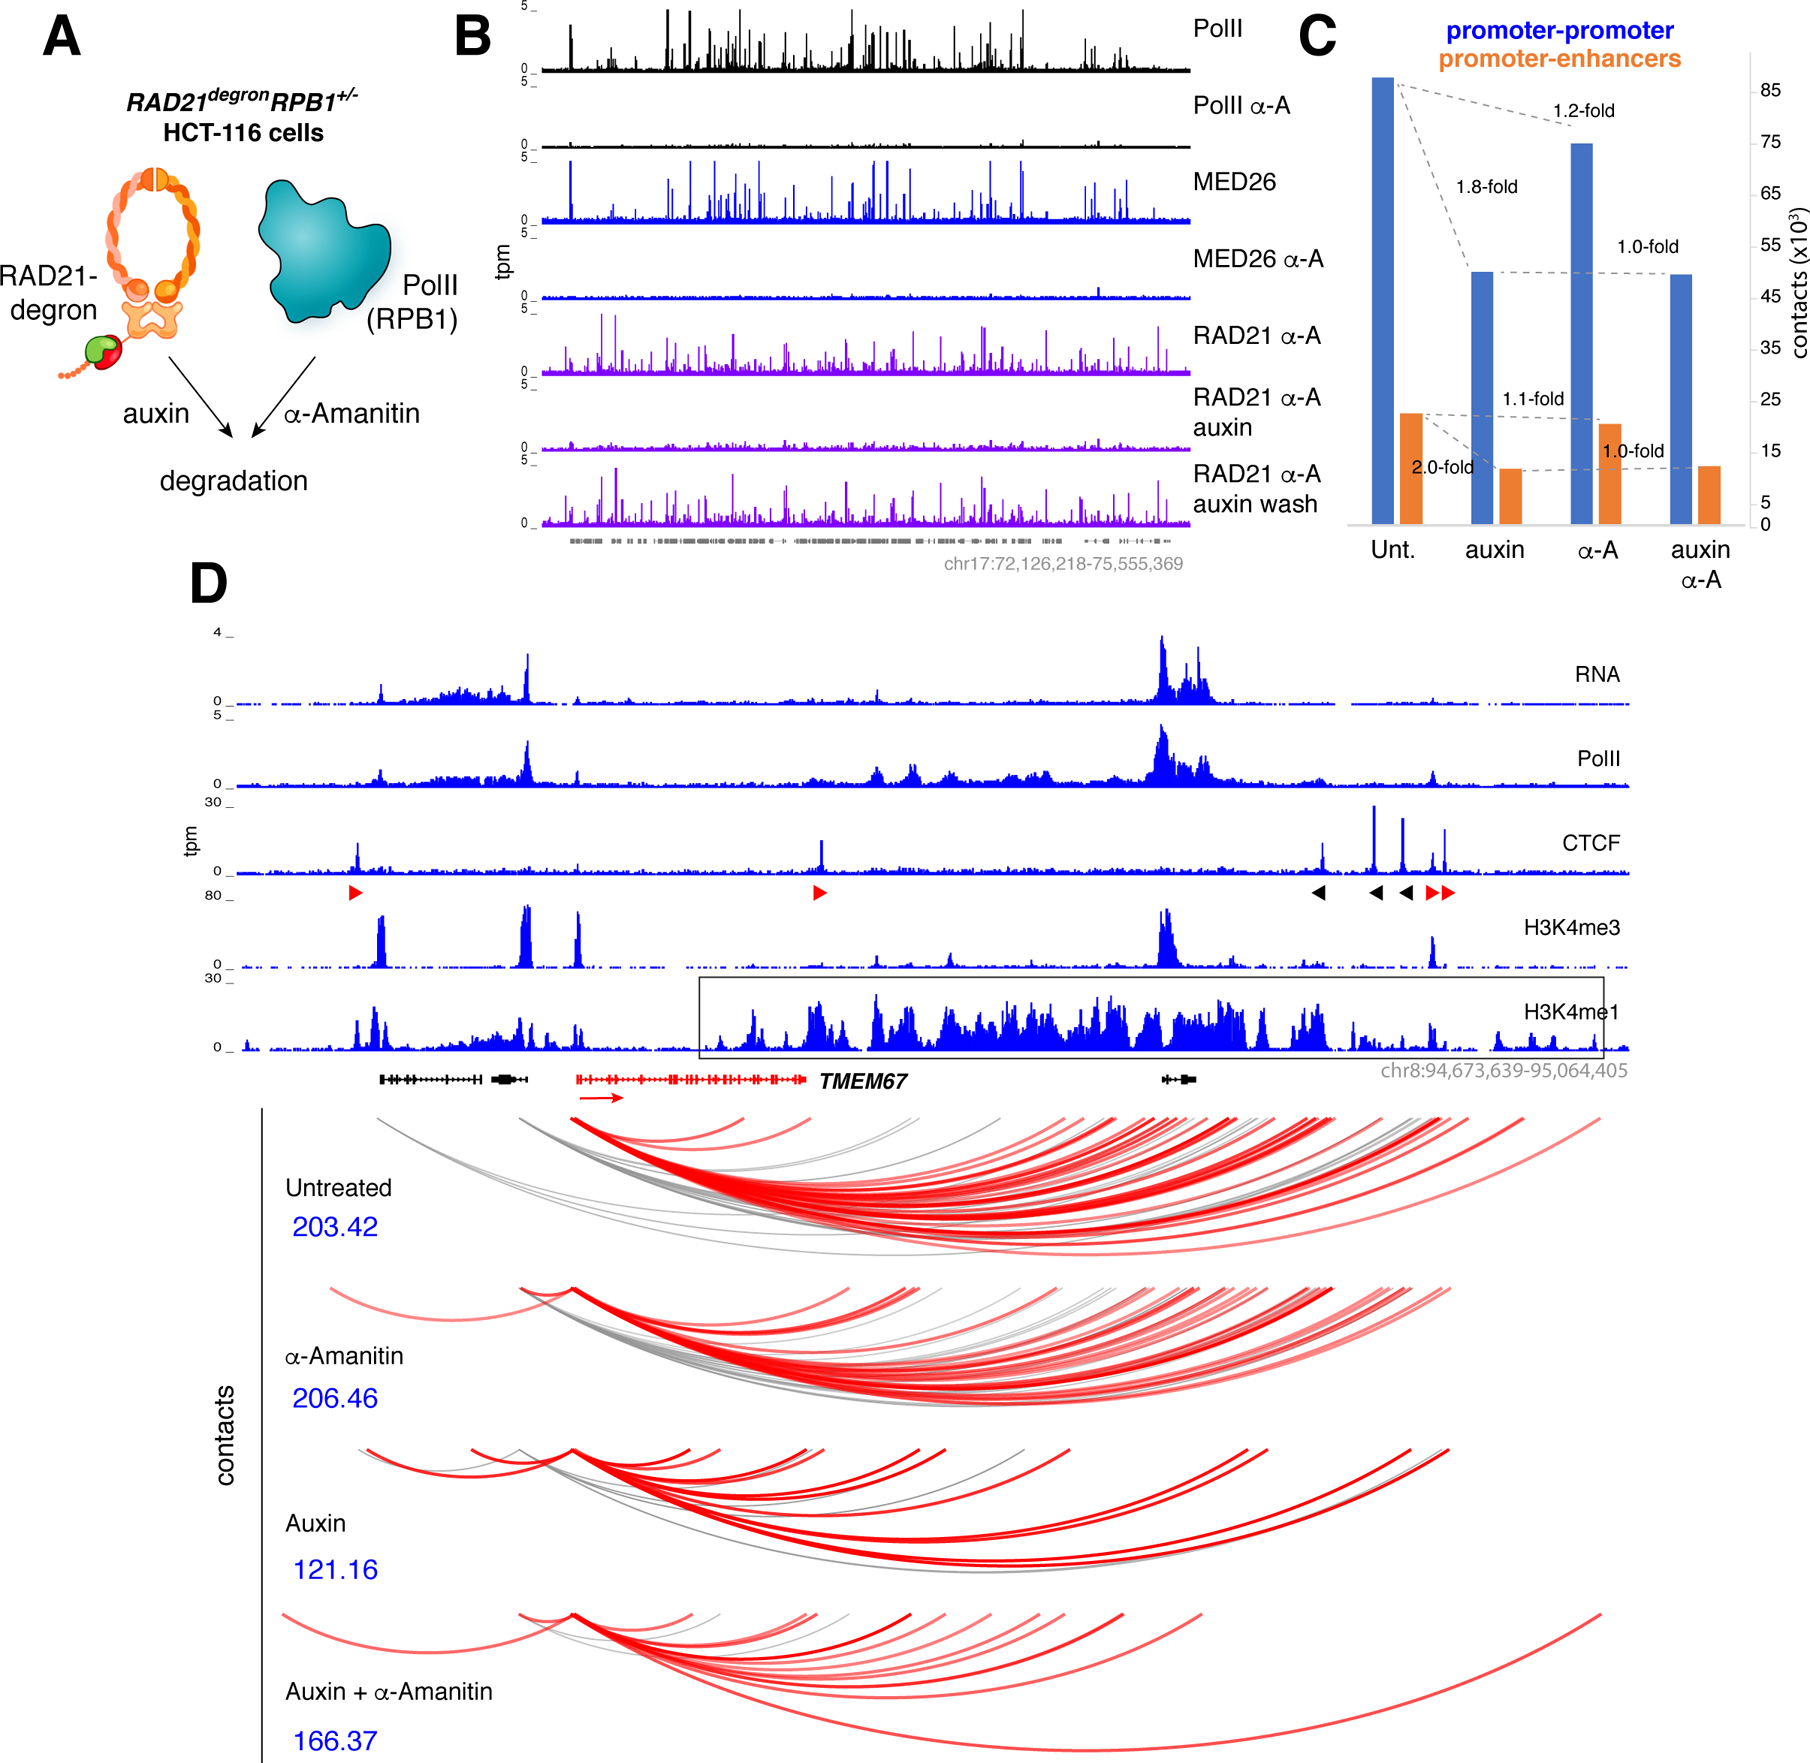
(A) RAD21degronRPB1+/− cells were created by deleting one allele of RPB1 from HCT116 RAD21degron cells to make them highly susceptible to PolII degradation by α-Amanitin. (B) RAD21degronRPB1+/− cells were untreated or treated for 3h with α-Amanitin, 6h with Auxin, or with a combination of Auxin and α-Amanitin and examined for PolII, MED26, or RAD21 occupancy. Auxin-washed cells led to RAD21 recovery in the presence of α-Amanitin (last row). (C) Bar graph showing the total number of reproducible P-P contacts (blue bars) or P-E contacts (orange bars) in RAD21degronRPB1+/− cells that were either untreated or treated with Auxin, α-Amanitin, or both. (D) Representative example of promoter contacts for TMEM67 in RAD21degronRPB1+/− cells grown under the conditions indicated. Scores in blue denote the significance of the interactions and the interacting enhancer domain is boxed.
To assess the contribution of Mediator-PolII or cohesin to P-E contacts we applied promoter capture Hi-C (PCHi-C), which detects interactions involving promoters globally (Montefiori et al., 2018; Schoenfelder et al., 2015). The capturing step in this technique allows regulatory DNA contacts to be saturated more readily than with conventional Hi-C. We cultured RAD21degronRPB1+/− cells in the presence or absence of auxin, α-amanitin, or both, and generated in situ Hi-C libraries (two biological replicates), which were then enriched through hybridization with 77,476 RNA baits targeting 22,600 human promoters. In untreated cells, we identified 5,844 CTCF- promoters reproducibly paired to 5,645 promoters and 1,351 enhancers (237,866 total contacts, Table S1F and Figure 6C). Consistent with the in situ Hi-C experiments, depletion of cohesin led to a 1.8- and 2.0-fold drop in the tethering of P-P and P-E pairs respectively, whereas in the absence of PolII and Mediator there was little or no change (1.2- and 1.1-fold respectively, Figure 6C). Importantly, promoter associations were unchanged between samples depleted of cohesin or cohesin+Mediator (~1.0-fold, Figure 6C and Table S1F), indicating that even in the absence of CTCF-loops there is not noticeable contribution of Mediator and PolII to P-P or P-E interactions. Representative examples are provided in Figures 6D, S7E, and Table S2A–I. We also corroborated the PCHi-C results by in situ Hi-C (e.g. Figure S7F). The data thus argue that neither Mediator nor PolII are required to bridge regulatory DNA.
Long-term architectural changes in MED mutant cells
How can our results be reconciled to previous findings showing a role for Mediator on P-E contacts? We entertained the possibility that Mediator and PolII affect chromatin topology indirectly, by rendering loop domains accessible to architectural proteins over time. As this effect would only be obvious following several rounds of cell division, it would remain undetected in the MED14- or PolII/MED-degron cells, where proliferation is efficiently blocked (Figure S6D and S7D). To test this idea we turned to Tailless cells, where Mediator activity is crippled at some loci with no cell cycle arrest. Notably, P-E contacts in Tailless were either increased or decreased following the up or down shifts in transcription at affected loci (Figure 7A). Relative to loop domains that displayed no changes in transcription, we observed a 3–3.5% change in interactions when the domain contained at least a single up- or downregulated gene (p < 0.003, Figure 7A). By comparison, P-E contacts were decreased ~50% when cohesin was depleted (Figure 7A). In a handful of cases, entire loop domains were lost or gained (Figures 7B–C).
Figure 7. The impact of Mediator Tail deletion on promoter-enhancer interactions.
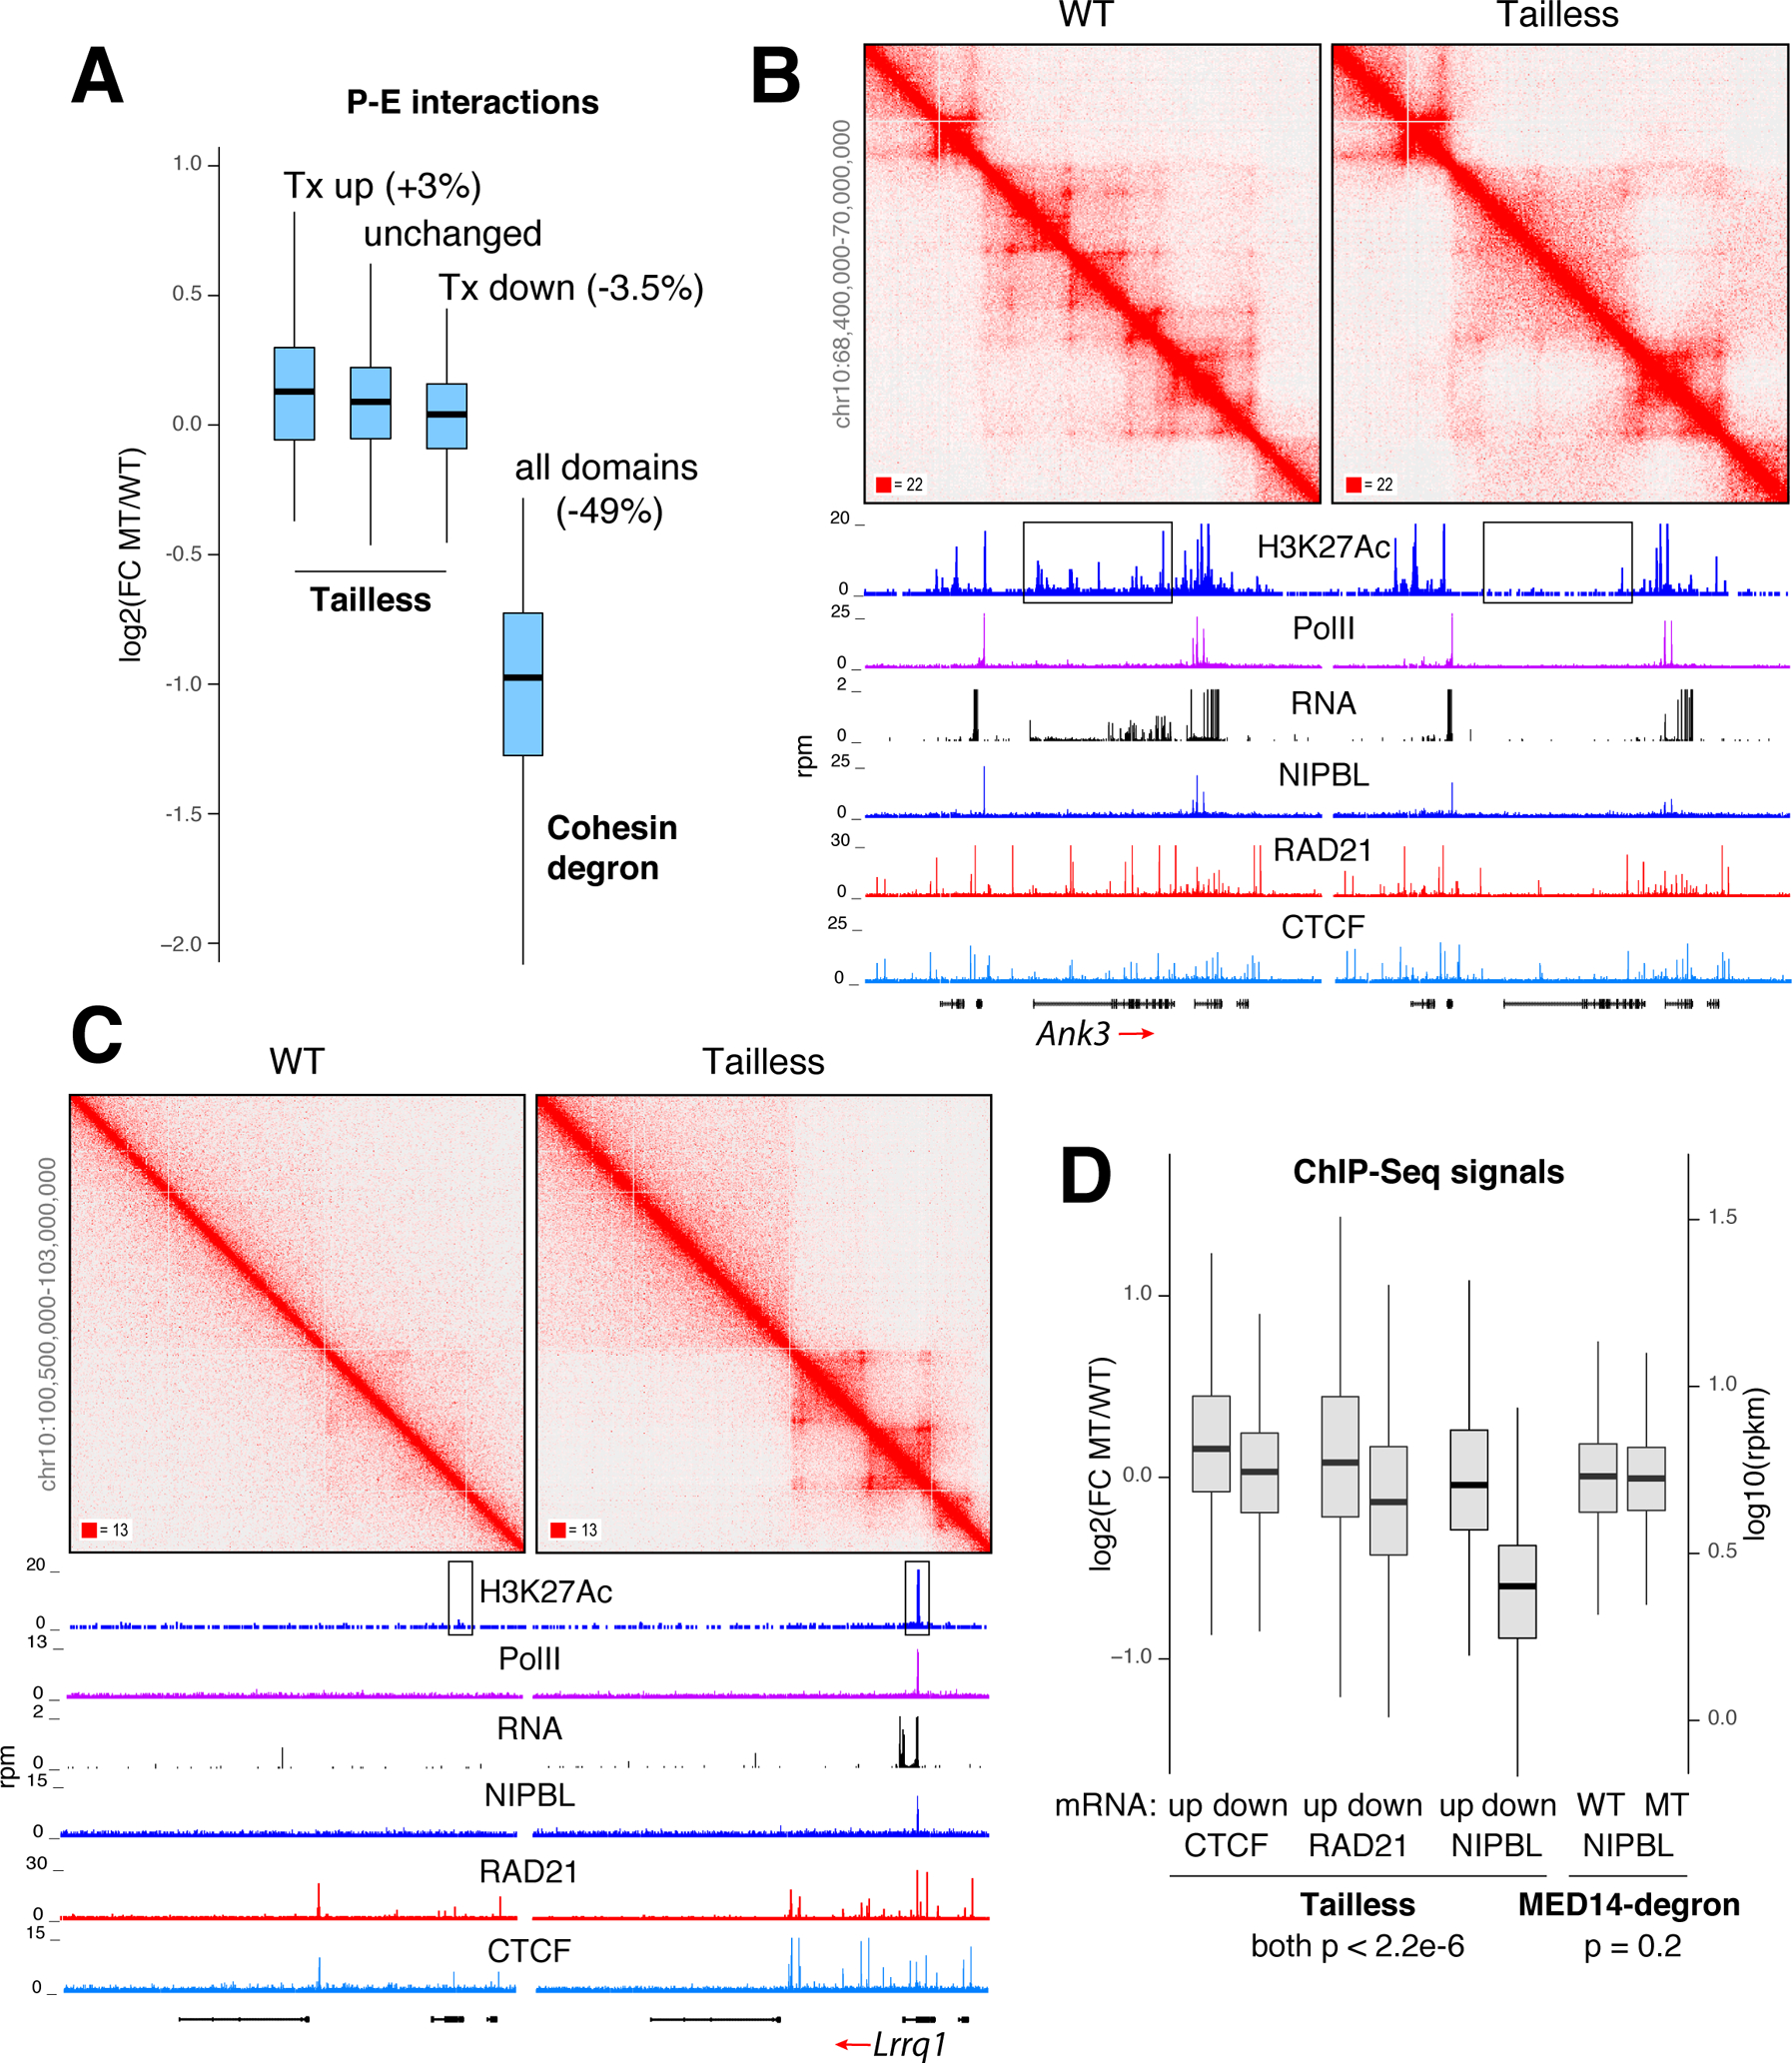
(A) Box plot showing changes in promoter-enhancer interactions at loop domains where transcription is increased, unchanged, or decreased in Tailless cells. For comparison, global changes in P-E interactions in cohesin-degron cells relative to control are shown. (B) Example of loop domains lost in Tailless. Profiles of H3K27Ac, PolII, RNA, NIPBL, RAD21 and CTCF occupancy are shown. Enhancer area is boxed. (C) Example of gained loop domains. (D) Box plot showing changes in CTCF, RAD21, and NIPBL recruitment at loop domains showing an increase or decrease in transcription in Tailless. NIPBL signals in Mediator-degron and control are shown for comparison. For A and D data are represented as mean +/− SEM.
Several lines of evidence argued that the topological phenotype of Tailless cells was indirect. First, changes in contact frequency were not confined to promoters and enhancers but involved non-regulatory DNA across affected TADs (Figure S7G). Second, fluctuations in intradomain contacts were mirrored by corresponding shifts in i) the local recruitment of CTCF, cohesin or NIPBL (Figures 7D) and ii) DNA methylation at their binding sites (Figure S7H). Conversely, architectural proteins were unaffected in MED14-degron cells (Figure 7D). Thus, the impact of Mediator Tail deletion on chromatin interactions likely results from downstream changes in the recruitment of architectural proteins as cells proliferate. DNA methylation and possibly other epigenetic marks playing an accessibility role. Thus, while Mediator and PolII create a functional bridge between promoters and enhancers, they are not absolutely required for their proximity in 3D.
DISCUSSION
Mediator structure suggests that it acts as a functional bridge
Cryo-EM analysis of mMED revealed that the organization and structure of core Mediator, which is primarily involved in interaction with PolII, is remarkably conserved from yeast to mammals. This is consistent with the structural conservation of PolII and the PIC across eukaryotes, and with genetic and functional analyses of mMED indicating that core subunits are essential for Mediator function and cell viability. The organization and structure of key Tail subunits (MED15, MED16 and MED24) are also conserved, but metazoan-specific subunits result in considerably increased complexity of the mMED Tail and its interaction with the core. The highly mobile yMED Tail interfaces with core Mediator primarily through Med14. The considerably larger mammalian Tail makes extended contacts with MED14, the Head and the Middle modules. The nature of core-Tail interactions in mMED helps explain our genetic and functional analyses indicating that non-essential Tail and metazoan specific subunits contribute to more complex regulation.
Cryo-EM studies of Sp Mediator revealed a fraction (~10%) of Mediator particles showing large-scale core rearrangements that facilitate formation of a Mediator-PolII holoenzyme (Tsai et al., 2017). We posited that these rearrangements enable Mediator-PIC contacts, which in turn would explain Mediator’s enhancement of basal transcription and CTD phosphorylation (Tsai et al., 2017). In mMED, loss of the large Tail segment or elimination of Tail-Middle interactions in ΔMED1 disrupts Tail-core contacts. This results in a repositioning of the Middle module analogous to that required for formation of the yMED holoenzyme, and markedly increases mMED-PolII and mMED-CKM interactions. Whereas studies in yeast did not explain how Mediator rearrangements could be linked to targeting of Mediator by TFs, our mMED data now sheds light on this critical issue.
Tail-core interactions in mMED keep the complex in a stable conformation that precludes interaction with PolII. We anticipate that targeting of a highly-integrated mMED Tail by TFs would release constraints on Mediator conformation, enabling interaction with the PIC and enhancing transcription initiation. The increased complexity of the mMED Tail offers additional possibilities for controlling Mediator conformation, consistent with the more elaborate transcriptional regulation in metazoans, and with our observation that, although not essential for Mediator function, Tail subunits are important for fine-tuning transcription of specific genes. Two possible additional avenues for expanding the regulatory potential of Mediator are suggested by our studies. First, Tail subunits could play a role in Mediator recruitment. Second, consistent with biochemical and functional observations, PolII and CKM interaction with mMED are mutually exclusive, but comparably affected by changes in Mediator conformation. Therefore, independent control of Mediator-CKM interaction could further expand the potential for transcription regulation by Mediator.
The complexity of the mMED structure, the intricacy of its interaction with PolII, and the potential for a multi-layered Mediator regulation mechanism, appear inconsistent with Mediator functioning as a simple physical P-E bridge. Instead, they suggest that Mediator acts as a conduit for integrating and conveying functional information to the basal transcription machinery.
Does Mediator create a physical P-E bridge?
Current models of Mediator function propose that the complex, along with TFs, coactivators and PolII creates an architectural bridge between cognate elements. However, using two different degron systems, we clearly showed that acute depletion of Mediator and PolII has little or no impact on P-E contacts whereas cohesin depletion does. A possible explanation for the apparent discrepancy with previous studies in MED12 knockdown cells comes from analysis of Tailless. In contrast to degron cells (but similar to knockdowns), absence of Mediator’s Tail does not block proliferation, but induces local transcriptional changes that correlate with long-term shifts in the recruitment of architectural proteins, which ultimately control intra-TAD and P-E contacts. By inference then, changes in topology previously reported in MED12 knockdown cells might be indirect to shifts in gene expression. Moreover, MED12 is not expected to participate in a TF-MED-PolII bridge in the first place, since it is a member of the CKM module, and CKM and PolII bind Mediator in a mutually exclusive manner.
These considerations raise the long-standing question of whether cognate regulatory elements activate transcription via stable loops, or simply by being proximal to each other. The P-E looping model presupposes that TFs activate PolII while bound to enhancers. However, there is no direct evidence supporting such configuration. An alternative scenario is that enhancers simply enrich for TFs that activate nearby promoters by diffusing over a small nuclear volume (Benabdallah and Bickmore, 2015; Furlong and Levine, 2018; Zabidi and Stark, 2016). Experiments forcing P-E contacts demonstrate that such proximity is key to transcription (Deng et al., 2012; Morgan et al., 2017), but do not necessarily prove that stable loops are the norm. In actuality, while Hi-C have revealed increased, broad interactivity across transcriptionally active domains, there are remarkably few strong P-E loops in mammalian cells (Rao et al., 2014). This is so because, by and large, CTCF loop anchors do not overlap with regulatory elements.
There is also mounting evidence that P-E contacts need not occur for efficient activation (Mateo et al., 2019). In Drosophila, a single enhancer can simultaneously induce transcriptional bursting from separate promoters (Fukaya et al., 2016), and in mammalian cells Sox2 and Sonic hedgehog activation appear independent of enhancer proximity (Alexander et al., 2018; Benabdallah et al., 2018). Furthermore, in FRAP and single molecule experiments TFs and PolII display short residence time on chromatin (in the order of seconds, (Chen et al., 2014; Kieffer-Kwon et al., 2017)). Such transient dynamics are a priori incompatible with the formation of rigid structures. Finally, neither TFs nor Mediator possess intrinsic ATPase motor activity, which would be required to bring together distantly positioned chromatin fibers. Conversely, the cohesin complex, which does form stable loops, is thought to extrude along chromatin in an ATPase manner and displays very long residence time at loop anchors (~30 min, (Hansen et al., 2017; Vian et al., 2018)).
What processes then facilitate P-E proximity? We have here shown that architectural proteins certainly play a role, presumably through loop extrusion, visualized in Hi-C maps as stripes (Vian et al., 2018). At the same time, it is important to point out that loop extrusion appears to increase the probability of regulatory DNA proximity, rather than being absolutely required for it (Bintu et al., 2018; Finn et al., 2019). An additional contributing mechanism might be chromatin accessibility combined with the large number of TFs, modifiers (including Mediator), and remodeling complexes recruited therein, which participate in weak hydrophobic interactions (Cho et al., 2018; Chong et al., 2018; Sabari et al., 2018). It has long been speculated that such forces may be responsible for the segregation of euchromatin and heterochromatin along chromosomes. Whether the same forces drive P-E contacts is an open question. If they do, the underlying protein “hubs” must display a great deal of redundancy, since depletion of PolII and Mediator does not overly disrupt chromatin topology.
STAR METHODS
LEAD CONTACT AND MATERIALS AVAILABILITY
Further information and requests for resources and reagents, including Med14Smash CH12 cells, RAD21degronRBP1+/− HCT cells, MED19FLAG/FLAG, MED25FLAG/FLAG, Tailless, and every other CH12 line carrying mMED mutants or tags, as listed in Table S1B, should be directed to the lead contact: Rafael Casellas (rafael.casellas@nih.gov).
EXPERIMENTAL MODEL AND SUBJECT DETAILS
Mice and primary cells
Primary CD4+ T cells were isolated from the spleen of a 6–8 week old male Cas9 expressing mouse (Gt(ROSA)26Sortm1.1(CAG-cas9*,-EGFP)Fezh) following the instructions of the CD4+ T cell isolation kit (MACS Miltenyi Biotec). Prior to isolation, a six-well plate was coated with anti-CD3 and anti-CD28 (BioXcell) at a final concentration of 10 μg/mL in 1.6 mL of PBS and incubated at 37°C for at least 30 min. The PBS was removed and the isolated CD4+ T cells were added to the wells and cultured in RPMI-1640 media supplemented with 10% FBS (Gemini), 1% Penicillin-Streptomycin, 1% HEPES, 1% Sodium Pyruvate, 1% Glutamax, 1% NEAA, 50 μM β-mercaptoethanol (Thermo Fisher Scientific). Fresh complete media containing 20 U/mL recombinant mouse IL-2 (R&D Systems) was added at day 3. Cells were passaged into fresh IL-2 media every 3–4 days. Reactivation was performed with plate-bound anti-CD3 and anti-CD28 every 8 days.
Cell lines
CH12 B lymphoma cells were cultured in RPMI-1640 media supplemented with 10% FBS (Gemini), 1% Penicillin-Streptomycin and 50 μM of β-mercaptoethanol (Thermo Fisher Scientific).
EL4 T lymphoma cells were cultured in RPMI-1640 media supplemented with 10% FBS (Gemini), 1% Penicillin-Streptomycin, 1% GlutaMAX and 50 μM of β-mercaptoethanol (Thermo Fisher Scientific).
Mouse ES cells (E14) were cultured in Glasgow’s MEM (Thermo Fisher Scientific) supplemented with 10% FBS (ES Cell qualified, ATCC), 1% Penicillin-Streptomycin, 1% HEPES, 1% Non-Essential Amino Acids, 1% Sodium Pyruvate and 50 μM of b-mercaptoethanol (Thermo Fisher Scientific). Before use, mLIF (106 U/L), MEKi (1 μM) and GSKi (3 μM) were freshly added to the complete media. Cells were cultured on gelatin coated culture dishes (0.1% of gelatin in sterile water). E14 ES cells expressing Cas9 were obtained through infection with lentiCas9-blast virus (Addgene plasmid #52962). After blasticidin selection (7.5 μg/mL), clones expressing Cas9 were isolated, expanded and used in the multiCRISPR screen for essential Mediator subunits. Cas9 expression was assessed by western blot analysis (Abcam) and cutting efficiency after transfection with sgRNA plasmids.
HEK293T cells were grown in DMEM media supplemented with 10% FBS (Gemini), 1% GlutaMAX and 1% Sodium Pyruvate (Thermo Fisher Scientific).
Platinum-A (Plat-A) retroviral packaging cell line was grown in DMEM media supplemented with 10% FBS (Gemini), 1% GlutaMAX, 1% Sodium Pyruvate (Thermo Fisher Scientific), 1 μg/ml puromycin (Life technologies) and 10 μg/ml blasticidin (Life technologies).
The HCT-116 RAD21-mAC RPB1+/− cells were cultured in McCoy’s 5A medium (Lonza) supplemented with 10% FBS, 100 U/ml penicillin, and 100ug/ml streptomycin (Thermo Fisher Scientific).
All cells were cultured at 37°C and 5% CO2 in a hum idified incubator.
METHOD DETAILS
sgRNA design and MultiCRISPR library preparation
Suitable sgRNA targets were identified using the Optimized CRISPR Design tool (http://crispr.mit.edu) and the sgRNA online tool (https://crispr.zhaopage.com). Two libraries of lentiGuide plasmids containing sgRNAs to target all Mediator subunits were created (Table S1C). The lentiGuide-puro (Addgene #52963) plasmid library contained one sgRNA per vector and the lentiGuide-Duo (deposited at Addgene) plasmid library delivered two sgRNAs per vector. Selected sgRNA, either targeting 5’ exons for the lentiGuide-puro library or creating large deletions for the lentiGuide-Duo library, were cloned into either vector using BbsI and BsmBI restriction sites. Viral particles were produced by transfecting HEK293T cells with one or the other library, the envelope plasmid pVSV-G and the packing plasmid psPAX2, in the presence of Lipofectamine™ LTX and Plus reagent (Thermo Fisher Scientific). Viruses were harvested 48h and 72h after transfection. Collected supernatants were pooled, centrifuged, 0.45μm sterile filtered and concentrated according to classical virus concentration procedures. Aliquots of concentrated viruses were frozen and conserved at −80°C until subsequent use. Titration was performed for fresh and frozen virus on primary CD4+ T cells and ES cells expressing Cas9.
MultiCRISPR infection on E14 ES cells and primary CD4+ T cells
The two viral libraries (see above) were used to infect Cas9 expressing E14 ES cells and primary CD4+ T cells isolated from Rosa26-Cas9 expressing male mice. Two hundred thousand cells were seeded in a six-well plate and concentrated virus was added to the media in presence of Polybrene (6 μg/mL). The amount of virus was adjusted according to the viral titer to obtain a MOI of 0.3. Cells were transduced by spinfection at 1,350g for 90 min and 28–32°C. Infec ted cells were puromycin selected 24h post-infection at a final concentration of 1 μg/ml for ES cells and 2 μg/mL for CD4+ T cells. Cells were harvested at an early reference time-point (d3 after infection) and two late time-points (14 and 21 days after infection). DNA was extracted using DNeasy Blood and Tissue kit (Qiagen) according to the manufacturer’s instructions. Libraries suitable for next-generation sequencing were prepared using staggered GeCKO readout primers (Shalem et al., 2014). Deep sequencing was performed on MiSeq (Illumina) using 80bp single-end reads.
CRISPR Cas9 engineering of CH12 B cells, EL4 T cells, and ES cells
Cultured cells were nucleofected with 1 μg of plasmid (px330, Addgene #42230, or px458, Addgene #48138) per 1–2 million cells. For CH12 and EL4 cells, we used the SF Cell Line 4D-Nucleofector™ X Kit with the 4D- Nucleofector™ device (Pulse code: CM150 for CH12 cells and CM120 or CM150 for EL4 cells).For ES cells, we used the mouse ES Cell Nucleofector™ Kit with the Nucleofector™ II device (Program A-030). To generate large deletions, we used two sgRNA plasmids per targeted gene. For knock-ins, we transfected the donor DNA (1 μg per one million cells) in addition to the targeting sgRNA. 24h following transfection, cells were either single cell GFP sorted for transfection using px458 or Puromycin selected (final concentration of 1 μg/mL) for those using px330. The sgRNA cutting efficiency was assessed by bulk PCR using DNA from a fraction of the transfected cells. Puromycin selection was stopped after 36–48h and selected cells were counted, and single-cell seeded into a 96 well plate. ES cells were bulk sorted or selected and seeded at a density of ~2,000 cells per 10 cm gelatin-coated dish. Grown single-cell colonies were picked into a new 96-well plate and DNA was extracted after a few days using mouse direct PCR kit (Bimake). Genotyping was performed using specific screening primers. Homozygous or heterozygous (in case homozygous deletions were not obtained) clones were single-cell sub-cloned to ensure clonal purity and expanded for further analyses and conservation.
Control clones were generated in the same conditions, by transfecting cells with scrambled sgRNA.
Second allele targeting assay to confirm the lethality of mutants
This assay was developed for Mediator subunits for which no homozygous knock-out clones could be obtained. Heterozygous clones were transfected with another set of sgRNAs (interspacing the pair of sgRNAs used to target the first allele) in such a way that the sgRNAs only created a large deletion on the second allele. Bulk PCRs with screening PCR primers specific for the targeted second allele were applied to monitor the persistence or loss of the second allele deletion PCR band indicating survival or depletion of homozygous knock-out clones, respectively. For this, DNA was extracted from bulk cell populations at early (24–48h) and late time-points (10 days) and used in genotyping PCR reactions.
RNA-seq
Five hundred thousand cultured cells were harvested, pelleted and lysed in 100 μl of the Ambion RNAqueous lysis solution. RNA was extracted and treated with DNase according to manufacturer’s protocol (RNAqueous®-Micro Kit). mRNA purification, reverse transcription and library preparation were performed using either the automated Neoprep system from Illumina (TruSeq® Stranded mRNA Library Prep Kit for NeoPrep™) or the NEBNext® Ultra™ II Directional RNA Library Prep Kit for Illumina® (New England Biolabs). For each genotype, we sequenced at least two biological replicates except for the CH12 med26 knock-out, for which only a single homozygous knock-out clone was obtained.
Promoter Capture Hi-C (PCHi-C)
The PCHi-C assay was performed as described previously by (Montefiori et al., 2018). Briefly, whole-genome Hi-C libraries were hybridized to a 77,476 biotinylated RNA bait pool (CustomArray, Inc.) that targets promoter regions. The mix was incubated for 24 hours at 65°C. The captured fragments (promoter-containing fragments) were isolated in a pull-down assay using Streptavidin beads (Dynabeads MyOne Streptavidin T1, Thermo Fisher Scientific), which were then washed and resuspended in water. We next performed 6 cycles of post-capture PCR amplification, followed by AMPure XP bead (Agencourt AMPure XP, Beckman Coulter) purification. Libraries were then subject to 100 bp paired-end sequencing on an Illumina HiSeq 3000 machine. For analysis, we used HiCUP v0.5.9 (Wingett et al., 2015) and Bowtie 2.3.4.3 (Langmead and Salzberg, 2012) to align and filter reads. Unique reads that passed HiCUP’s filters were used to call interactions. Normalization was performed by randomly selecting enough reads in order to obtain 73 million read pairs in cis and >10 kb apart from each bait. Reads were then given to CHiCAGO version 1.10.1 (Cairns et al., 2016) and significant interactions were called with default parameters. Enhancer coordinates were assigned to regions interacting with promoters using BEDtools (Quinlan and Hall, 2010) and requiring a minimum overlap of 1 bp.
Whole genome bisulfite sequencing (BS-seq)
Genomic DNA was isolated from 3×10⁶ cells using Qiagen DNeasy blood and tissue kit (Cat #: 69506). The bisulfite conversion was performed using the EZ DNA Methylation-Gold™ Kit (Cat #: D5005) from Zymo Research. Whole-genome bisulfite sequencing libraries were prepared from 50 ng converted DNA using Illumina TruSeq® DNA Methylation Kit (Cat #: EGMK91324), which was performed following the manufacturer’s protocol. Single-end sequencing was performed on the Illumina Hi-Seq 3000 with 20% Illumina PhiX DNA library as the spike-in control.
Chromatin immunoprecipitation sequencing (ChIP-seq)
Cultured cells were fixed with 1% formaldehyde (Sigma) for 10 min at room temperature and the reaction was quenched with 125 mM glycine (Sigma). Twenty million fixed cells were washed with PBS, snap-frozen and stored at −80°C until further processing. Before use, the cells were resuspended in 1 ml of RIPA buffer (10 mM Tris pH 7.6, 1 mM EDTA, 0.1% SDS, 0.1% sodium deoxycholate, 1% Triton X-100 and freshly added Complete Mini EDTA free proteinase inhibitor (Roche). Sonication was performed using Branson Sonifier at amplitude 35%, 12 cycles of 20 sec sonication followed by 30 sec of pause. For histone mark ChIPseq, chromatin was digested with MNase (Sigma) in digestion buffer (50 mM Tris-HCl pH7.6, 1 mM CaCl2, 0.2% Triton X-100, 5 mM butyrate (Sigma) and freshly added Complete Mini EDTA free proteinase inhibitor (Roche)) for 5 min at 37°C. The digestion reaction was dialyzed, using a Slide-A-Lyzer G2 cassette, against 400 mL of RIPA buffer for 2 hours at 4°C under cons tant stirring. Chromatin was incubated with specific histone mark antibody overnight at 4°C under slow rotation. The antibody-protein solution was then incubated with 40 μl of Dynabeads Protein A (or G) for 40 min at room temperature under agitation. Antibody-bound beads were washed twice with RIPA buffer, twice with RIPA buffer containing 0.3M NaCl, twice with LiCl buffer (0.25 M LiCl, 0.5% Igepal-630, 0.5% sodium deoxycholate), once with LiCl buffer (0.25M LiCl, 0.5% NP-40, 0.5% NaDOC), once with TE pH 8.0 containing 0.2% Triton X-100, and once with TE pH 8.0. Crosslinks were reversed by incubating the beads at 65°C for 4 hours in the presence of 0.3% SDS and 1 mg/ml Proteinase K (Thermo Fisher Scientific). ChIP DNA was purified by ChIP DNA clean and concentrator column (Zymo research). Libraries were prepared using the Ovation Ultralow Library System V2 kit and 50bp single-end sequencing was performed on HiSeq3000 (Illumina).
To measure changes in Mediator recruitment by ChIP-Seq, we tested 11 antibodies that recognize 10 different Mediator. In the table below, we have summarized each antibody’s information and results obtained on activated B cells or CH12 B cells. With the exception of anti-Med26 and anti-MED23, the signal to noise ratio for all antibodies was too low for quantitative purposes. Also, anti-MED23 experiments revealed a fraction of peaks that remained in Med23−/− cells. All ChIP-Seq experiments therefore were done with anti-MED26 antibodies.
| Antibody | SOURCE | IDENTIFIER | Tested Cell | Remark |
|---|---|---|---|---|
| Med1 | Bethyl | A300–793A | aB | Not worked |
| Med6 | Origene | TA343540 | CH12 | Not worked |
| Med12 | Bethyl | A300–774A | aB, CH12 | Very low signal-to-noise ratio |
| Med14 | Abcam | ab170605 | CH12 | Not worked |
| Med14 | Thermo Fisher | PA5–44864 | CH12 | Not worked |
| Med19 | Abcam | ab179735 | CH12 | low signal-to-noise ratio |
| Med23 | Bethyl | A300–425A | aB, CH12 | Good quality |
| Med24 | Novus Biologicals | NB100–92293 | aB | low signal-to-noise ratio |
| Med25 | Thermo Fisher | PA5–43616 | aB | low signal-to-noise ratio |
| Med26 | Cell Signaling | 13641S | CH12 | Good quality |
| Cdk8 | Abcam | ab176559 | CH12 | low signal-to-noise ratio |
In situ HiC
We generated 34 in situ Hi-C libraries using the MboI restriction enzyme. 7 libraries were generated for MED14-degron and WT controls including technical replicates. For Tailless mutants, we generated 8 libraries including two sets of biological replicates (four technical replicates per biological replicate). For RAD21degronRBP1+/− cells, 12 libraries were generated including two biological replicates. α-amanitin and auxin + α-amanitin treated cells also included two technical replicates for each biological replicate. The protocol was as follows:
Crosslinking
Grow two to five million mammalian cells under recommended culture conditions to about 80% confluence. Pellet suspension cells or detached adherent cells by centrifugation at 300×G for 5 minutes.
Resuspend cells in fresh medium at a concentration of 1×10⁶ cells per 1ml media. In a fume hood, add freshly made formaldehyde solution (sigma, F1635) to a final concentration of 1%, v/v. Incubate at room temperature for 10 minutes with mixing.
Add 2.5M glycine solution to a final concentration of 0.2M to quench the reaction. Incubate at room temperature for 5 minutes on rocker.
Centrifuge for 5 minutes at 300×G at 4°C. Disca rd supernatant into an appropriate collection container.
Resuspend cells in 1×10⁶ cells per 1ml cold 1X PBS and spin for 5 minutes at 300×G at 4°C. Discard supernatant and flash-freeze cell p ellets in dry ice.
Either proceed to the rest of the protocol or store cell pellets at −80°C.
Lysis and Restriction Digest
Combine 250μl of ice-cold Hi-C lysis buffer (10mM Tris-HCl pH8.0, 10mM NaCl, 0.2% Igepal CA630, protease inhibitor (Sigma, 4693159001)). Add to one crosslinked pellet of cells.
Incubate cell suspension on ice for >15 minutes. Centrifuge at 2500×G for 5 minutes. Discard the supernatant.
Wash pelleted nuclei once with 500μl of ice-cold Hi-C lysis buffer.
Gently resuspend pellet in 50μl of 0.5% sodium dodecyl sulfate (SDS) and incubate at 62°C for 5–10 minutes.
After heating is over, add 145μl of water and 25μl of 10% Triton X-100 (Sigma, 93443) to quench the SDS. Mix well, avoiding excessive foaming. Incubate at 37°C for 15 minutes.
Add 25μl of 10X NEBuffer2 and 100U of MboI restriction enzyme (NEB, R0147) and digest chromatin overnight or for at least 2 hours at 37°C with rotation.
Marking of DNA Ends, Proximity Ligation, and Crosslink Reversal
Incubate at 62°C for 20 minutes to inactivate MboI, then cool to room temperature.
-
To fill in the restriction fragment overhangs and mark the DNA ends with biotin, add 50μl of fill-in master mix:
37.5μl of 0.4mM biotin-14-dATP (Life Technologies, 19524–016)
1.5μl of 10mM dCTP
1.5μl of 10mM dGTP
1.5μl of 10mM dTTP
8μl of 5U/μl DNA Polymerase I, Large (Klenow) Fragment (NEB, M0210)
Mix by pipetting and incubate at 37°C for 45 m inutes-1.5 hours with rotation.
-
Add 900μl of ligation master mix:
663μl of water
120μl of 10X NEB T4 DNA ligase buffer (NEB, B0202)
100μl of 10% Triton X-100
12μl of 10mg/ml Bovine Serum Albumin (100X BSA)
5μl of 400 U/ μl T4 DNA Ligase (NEB, M0202)
Mix by inverting and incubate at room temperature for 4 hours with slow rotation.
Spin for 5 minutes at 2500 rpm. Resuspend nuclei in 500 μl TE (pH8.0), SDS 0.5%. Degrade protein by adding 5μl of 20mg/ml proteinase K (NEB, P8102) and incubate at 55°C for 30 minutes.
Add 50μl of 5M sodium chloride and incubate at 65°C overni ght.
DNA Shearing and Size Selection
Cool tubes at room temperature.
Add 0.1X volumes of 3M sodium acetate, pH 5.2 and 1ml of pure ethanol. Mix by inverting and incubate at −80°C for 15 minutes.
Centrifuge at max speed, 2°C for 15 minutes. C arefully remove the supernatant by pipetting.
Wash 800μl of 70% ethanol. Centrifuge at max speed for 5 minutes.
Remove all supernatant and wash the pellet once more with 800μl of 70% ethanol.
Dissolve the pellet in 130μl of 1X Tris buffer (10 mM Tris-HCl, pH 8) and incubate at 37°C for 15 minutes to fully dissolve the DNA.
-
To make the biotinylated DNA suitable for high-throughput sequencing using Illumina sequencers, shear to a size of 200–400bp using the following parameters: Instrument: Covaris ME220 (Covaris, Woburn, MA)
Volume of Library: 130μl in a Covaris microtube
Durations: 50
Peak Power: 70
Duty Factor: 20%
Cycle/Burst: 1000
Transfer sheared DNA to a fresh 1.5ml tube. Wash the Covaris vial with 70μl of water and add to the sample, bringing the total reaction volume to 200μl. Run 1μl DNA on a 2% agarose gel to verify successful shearing. For libraries containing fewer than 2×10⁶ cells, the size selection using AMPure XP beads described in the next steps could be performed on final amplicons rather than before biotin pull-down.
Warm a bottle of AMPure XP beads (Beckman Coulter, A63881) to room temperature.
Add exactly 120μl of beads to the reaction. Mix well by pipetting and incubate at room temperature for 5 minutes.
Separate on a magnet. Transfer the clear solution to a fresh tube, avoiding any beads. The supernatant will contain fragments shorter than 500bp.
Add exactly 54μl of fresh AMPure XP beads to the solution. Mix by pipetting and incubate at room temperature for 5 minutes.
Separate on a magnet and keep the beads. Fragments in the range of 200–400bp will be retained on the beads. Discard the supernatant containing degraded RNA and short DNA fragments.
Keeping the beads on the magnet, wash twice with 700μl of 70% ethanol without mixing.
Leave the beads on the magnet for 5 minutes to allow remaining ethanol to evaporate.
To elute DNA, add 300μl of 1X Tris buffer, gently mix by pipetting, incubate at room temperature for 5 minutes, separate on a magnet, and transfer the solution to a fresh 1.5ml tube.
Quantify DNA by Qubit dsDNA High Sensitivity Assay (Life Technologies, Q32854) and run undiluted DNA on a 2% agarose gel to verify successful size selection.
Biotin Pull-Down and Preparation for Illumina Sequencing
Prepare for biotin pull-down by washing 75μl of 10mg/ml Dynabeads MyOne Streptavidin T1 beads (Life technologies, 65602) with 400μl of 1X Tween Washing Buffer (1X TWB: 5mM Tris-HCl (pH 7.5); 0.5mM EDTA; 1M NaCl; 0.05% Tween 20). Separate on a magnet and discard the solution.
Resuspend the beads in 300μl of 2X Binding Buffer (2X BB: 10mM Tris-HCl (pH 7.5); 1mM EDTA; 2M NaCl) and add to the reaction. Incubate at room temperature for 15 minutes with rotation to bind biotinylated DNA to the streptavidin beads.
Separate on a magnet and discard the solution.
Wash the beads by adding 600μl of 1X TWB and transferring the mixture to a new tube. Heat the tubes on a Thermomixer at 55°C for 2 min with mixing. Reclaim the beads using a magnet. Discard supernatant.
Repeat wash.
Resuspend beads in 100ul 1X NEB T4 DNA ligase buffer (NEB, B0202) and transfer to a new tube. Reclaim beads and discard the buffer.
-
To repair ends of sheared DNA and remove biotin from unligated ends, resuspend beads in 100μl of master mix:
88μl of 1X NEB T4 DNA ligase buffer with 10mM ATP
2μl of 25mM dNTP mix
5μl of 10U/μl NEB T4 PNK (NEB, M0201)
4μl of 3U/μl NEB T4 DNA polymerase I (NEB, M0203)
1μl of 5U/μl NEB DNA polymerase I, Large (Klenow) Fragment (NEB, M0210)
Incubate at room temperature for 30 minutes. Separate on a magnet and discard the solution.
Wash the beads by adding 600μl of 1X TWB and transferring the mixture to a new tube. Heat the tubes on a Thermomixer at 55°C for 2 min with mixing. Reclaim the beads using a magnet. Discard supernatant.
Repeat wash.
Resuspend beads in 100μl 1X NEBuffer 2 and transfer to a new tube. Reclaim beads and discard the buffer.
-
Resuspend beads in 100μl of dATP attachment master mix: 90μl of 1X NEBuffer 2
5μl of 10mM dATP
5μl of 5U/μl NEB Klenow exo minus (NEB, M0212)
Incubate at 37°C for 30 minutes. Separate on a magnet and discard the solution.
Wash the beads by adding 600μl of 1X TWB and transferring the mixture to a new tube. Heat the tubes on a Thermomixer at 55°C for 2 min with mixing. Reclaim the beads using a magnet. Discard supernatant.
Repeat wash.
Resuspend beads in 100μl 1X Quick ligation reaction buffer (NEB, B6058) and transfer to a new tube. Reclaim beads and discard the buffer.
Resuspend in 50μl of 1X NEB Quick ligation reaction buffer.
Add 2μl of NEB DNA Quick ligase (NEB, M2200). Add 1.8μl of an Illumina indexed adapter (Bioo Scientific). Record the sample-index combination. Mix thoroughly.
Incubate at room temperature for 15 minutes. Separate on a magnet and discard the solution.
Wash the beads by adding 600μl of 1X TWB and transferring the mixture to a new tube. Heat the tubes on a Thermomixer at 55°C for 2 min with mixing. Reclaim the beads using a magnet. Remove supernatant.
Repeat wash.
Resuspend beads in 100μl 1X Tris buffer and transfer to a new tube. Reclaim beads and discard the buffer.
Resuspend in 50μl of 1X Tris buffer.
Final Amplification and Purification
Amplify the Hi-C library directly off of the T1 beads with 4–6 cycles of PCR, using Illumina primers (Bioo Scientific) and Q5 Hi-Fidelity DNA polymerase (NEB).
After amplification is complete, bring the total library volume to 250μl.
Separate on a magnet. Transfer the solution to a fresh tube and discard the beads.
Warm a bottle of AMPure XP beads to room temperature. Gently shake to resuspend the magnetic beads. Add 175μl of beads to the PCR reaction (0.7X volumes). Mix by pipetting and incubate at room temperature for 5 minutes.
Separate on a magnet and remove the clear solution.
Keeping the beads on the magnet, wash once with 700μl of 70% ethanol without mixing.
Remove ethanol completely. To remove traces of short products, resuspend in 100μl of 1X Tris buffer and add another 70μl of AMPure XP beads. Mix by pipetting and incubate at room temperature for 5 minutes.
Separate on a magnet and remove the clear solution.
Keeping the beads on the magnet, wash twice with 700μl of 70% ethanol without mixing.
Leave the beads on the magnet for 5 minutes to allow the remaining ethanol to evaporate.
Add 25–50μl of 1X Tris buffer to elute DNA. Mix by pipetting, incubate at room temperature for 5 minutes, separate on a magnet, and transfer the solution to a fresh labeled tube. The result is a final in situ Hi-C library ready to be quantified and sequenced using an Illumina sequencing platform.
Strategy to degrade MED14 in CH12 cells
A 3xFlag and small molecule–assisted shutoff (SMASh) tag was introduced to the N-terminus of Med14 using CRISPR-Cas9 based knock-in via homologous recombination. Single cell clones were established and degradation of MED14 was assessed by western blotting (Abcam Ab) after treatment of cells with 3 μM Asunaprevir (from MCE). For RNA-seq, cell numbers were assessed by flow cytometry and RNA spike-ins were added to 106 cell lysates (Kouzine et al., 2013). For Hi-C experiments, APR- and mock treated cells were sorted for live cells after 60 hours of treatment and processed as described above.
Strategy to remove RPB1 in HCT-116 cells
We obtained HCT-116-RAD21-mAID-mClover cells (HCT-116 RAD21-mAC) from (Natsume et al., 2016). HCT-116-RAD21-mAID-mClover RPB1 heterogenous knock out was generated using CRISPR/Cas9 technique. Suitable sgRNA targets were identified using Optimized CRISPR Design (https://crispr.zhaopage.com) and cloned into the modified pSpCas9(BB)-2A-GFP (PX458), in which GFP was replaced with mCherry.
A pair of sgRNAs (Table S1B) were cloned in pX458 and introduced into HCT-116 RAD21-mAC line using SE Cell Line 4D-Nucleofector™ X Kit with the 4D-Nucleofector™ device (Pulse code: EN113). Two days post-nucleofection, mCherry positive cells were collected using a BD FACSAriaIII (Becton Dickinson) flow cytometer and seeded at a density of 1,000–2,000 cells in 90 mm plates. After 12–14 days, colonies were picked and plated onto 96-well plates. PCR genotyping was used to identify heterozygous RPB1 clones.
Degradation of AID-tagged RAD21 was induced by addition of 500μM indole-3-acetic acid (IAA; Sigma Aldrich). After 6 hours of IAA treatment, RAD21-mAID-mClover degradation was measured by flowcytometry. For experiments with RBP1 degradation, 100 μg/ml of a-amanitin (Sigma Aldrich or Santa Cruz) was added 3 hours before analysis. Double degradation was performed through addition of IAA, followed by addition of a-amanitin after 3 hours and incubation for a total duration of 6 hours.
Clones generated for cryo-EM
For the structural analysis of mammalian Mediator complex in CH12 B cells, med19 was Flag tagged to facilitate the pull down of the entire Mediator complex. In addition, med13 was initially deleted with the goal of diminishing the interaction frequency with the CKM, hence increasing the fraction of free Mediator complex and facilitating the analysis of the three main modules. However, probably because CH12 cells also express med13L, this strategy did not improve the purification and thus was unnecessary and omitted in other mutants. Targeted clones were obtained after sgRNA transfection, clone selection and validation as described above (section on CRISPR Cas9 engineering). See Table S1B for a list of all sgRNA used to create knock-in and deletion mutants and all PCR primers used to clone targeting constructs.
HMP tagging of mammalian specific Mediator subunits
Mammalian Mediator subunits (med24, med25, med26, med27, med28, med29 and med30) were PCR amplified with gene specific primers and Q5 High Fidelity polymerase (NEB) from cDNA of CH12 cells obtained by Supersript III reverse transcription (Invitrogen) according to the manufacturer’s instructions. HMP tags (8xHis tag and maltose binding protein) were introduced to either the N- or C-terminus of the Mediator subunit and combined together with P2A-EGFP sequences by overlapping (Stitch) PCR (Table S1B for primer information). Stitch PCR products were cloned into the retroviral vector pMy using restriction enzyme digestion and ligation. Retroviral particles were produced in Platinum-A retroviral packaging cell line by transfecting the pMy vector encoding the HMP-tagged Mediator subunit in the presence of Lipofectamine™ LTX and Plus reagent (Life technologies). Infectious retrovirus was harvested 48h post transfection and used to spinfect CH12 med13−/−med19Flag/Flag B cells at 1,350g for 90 min and 28–32°C in the presence of 6 μg/ml polybrene. Infected cells were bulk GFP sorted and single cell sub-cloned to obtain high HMP-Mediator expressing individual clones.
Nuclear protein extraction procedure for EM studies
Engineered CH12 B cells (med13−/−med19Flag/Flag cells carrying additional Mediator subunit deletions or HMP-tagged Mediator subunit overexpression constructs) were expanded to several billion cells in Bell-Flo 3L spinner flasks on 5 Position Digital Stirrer (Bellco). Cells were counted, pelleted, washed with cold PBS, snap-frozen in liquid nitrogen, and stored at −80°C until nuclear extract ion. Cell pellets were resuspended in cold buffer A (10 mM HEPES pH 7.9, 1.5 mM MgCl2, 10 mM KCl, 0.5 mM DTT and protease inhibitor cocktail (Sigma-Aldrich)) and lysed for 15 min on ice. The sample was centrifuged at 220 g and 4°C for 10min with low bra ke. The pellet was resuspended in 2x the pellet volume of buffer A for dounce homogenizing. Cell nuclei were disrupted using a Wheaton® Glass 40mL Dounce Tissue Grinder (DWK Life Sciences Inc) for 10–20 strokes to achieve ~90% of nuclei disruption assessed by trypan blue. The nuclei were pelleted at 25,000 g for 20 min at +4°C and were re suspended in 2.5 ml cold buffer C (20 mM HEPES pH 7.9, 25% glycerol, 1.5 mM MgCl2, 0.2 mM EDTA, 0.5 mM DTT and protease inhibitor cocktail (Sigma-Aldrich)) per one billion cells. A second dounce homogenizing was performed using first the loose pestle followed by the tight pestle. KCl was added drop by drop to a final concentration of 0.3 M while douncing. The nuclear extract was ultracentrifuged at ~140,000 g for 1 hour at +4°C and the supernatant containing extracted nuclear proteins was snap frozen in liquid nitrogen and kept at −80C until further protein purification.
Purification of WT and mMED mutant complexes for EM studies
Mouse Mediator was immunopurified from nuclear extracts through a 3xFLAG tag engineered at the N-terminus of MED19 (or MED25) following a standard protocol. Briefly, the nuclear extract was incubated with FLAG M2 agarose resin previously equilibrated in buffer containing 50 mM HEPES pH 7.9, 300 mM KOAC, 1 mM EDTA, 10% Glycerol, and 0.2% NP-40. After incubation, the resin was washed with buffer containing 50 mM HEPES pH 7.9, 300 mM KOAc, 1 mM EDTA, 10% Glycerol, 0.2% NP-40 and 1X mammalian protease inhibitor cocktail (Sigma P8340). This was followed by washing with a buffer containing 50 mM HEPES pH 7.9, 100 mM KCl, 1 mM EDTA, 5% Glycerol and 0.05% NP-40 without protease inhibitors. Bound proteins were eluted with 500 μg/ml FLAG peptide (Sigma) in 50 mM HEPES pH 7.9, 100 mM KCl, 5% glycerol, 1 mM EDTA and 0.005% NP-40. Purified mMED fractions were flash-frozen in liquid nitrogen and stored at −80°C until needed for EM st udies.
mMED cryo-EM sample preparation, imaging and analysis
MED19-FLAG wt, MED25-FLAG wt and ΔMED1 mMED cryo-EM samples were prepared on lacey carbon grids covered with a thin layer of continuous amorphous carbon (Ted Pella 01824). To prepare cryo-EM samples, 2.5μL of purified mMED (50–75μg/mL) were pipetted onto grids plasma-cleaned for 6 sec on a Solarus plasma cleaner (Gatan) using an Ar/O2 gas mixture. Vitrification was performed in liquid ethane using a manual plunge-freeze apparatus. Imaging was performed on a Thermo Fisher Talos Arctica transmission electron microscope outfitted with an X-FEG electron source and operating at an acceleration voltage of 200kV. Automated data collection was carried out using Leginon (Suloway et al., 2005).
Information about imaging conditions and EM data collection statistics for MED19-FLAG wt, MED25-FLAG wt and ΔMED1 MED19-FLAG mMED cryo-EM specimens are summarized in Table S1A. Both untilted and tilted (20°and 30°) cryo-EM image s were recorded to address possible issues related to anisotropic distribution of mMED particles orientations in the cryo-EM specimens. Direct electron detector frames (see Table S1A) were aligned using the MotioncCor2 program (Zheng et al., 2017), and image processing was carried out using the Sphire (Moriya et al., 2017), Cryosparc (Punjani et al., 2017) and Relion (Scheres, 2012) image processing packages. In general, automated particle picking, carried out in Cryosparc/Relion, was followed by repeated rounds of 2D image clustering in Cryosparc. After initial cleaning, ab-initio volumes were calculated with Cryosparc and alignment parameters for cryo-EM images were calculated by 3D refinement, also in Cryosparc. Images were further screened by 3D image classification with both Cryosparc and Relion, which resulted in the datasets used for final cryo-EM map calculation. Final MED19-FLAG wt, MED25-FLAG wt mMED and ΔMED1 mMED cryo-EM maps were calculated using Cryosparc.
Docking of X-ray models (human MED23, modules of Sp Mediator; see Results) into the mMED cryo-EM maps established that, at their stated overall resolution, they were free of distortions related to anisotropic distribution of particle orientations in the cryo-EM datasets. To have a more quantitative assessment of the resolution of the MED19-FLAG cryo-EM map used for the vast majority of mMED structure interpretation in this paper, we computed the resolution of the map along 3 perpendicular axes using a published algorithm (Tan et al., 2017). This analysis indicated that the resolution of the MED19-FLAG wt mMED map is in the 4–4.5 Å range along two directions, and lower (8–9 Å range) along the third axis (Figure S1E).
mMED cryo-EM map analysis and interpretation
Map visualization and interpretation were done using Chimera (Pettersen et al., 2004). Interpretation of the core portion of mMED cryo-EM maps was aided by docking of X-ray models of Sp Mediator (PDB accession codes 5U0P, 5U0S, and 5N9J) segmented into Head and Middle modules, and MED14. Docking of the Sp Mediator X-ray models guided initial watershed segmentation (with Chimera) of the mMED cryo-EM maps and identification of density corresponding to the mMED Tail module. Interpretation of the mMED Tail was guided by docking of the human MED23 X-ray structure (6H02), comparison with the Tail portion of the cryo-EM structure of Sc Mediator (EMD-2634), consideration of published subunit localization information for Sc Mediator, consideration of published subunit interaction information for the Sc Mediator Tail module (Robinson et al., 2015), subunit localization information for mMED reported here, and analysis of the structure and watershed segmentation of the Tail portion of the 5.9 Å resolution MED19-FLAG WT mMED cryo-EM map. A description of key steps in the Tail segmentation analysis is included in Results.
Quantification by EM image clustering of mMED interaction with PolII and the CKM
To quantify interaction of mMED with PolII and the CKM, wt and specific mutant mMED particles were imaged after preservation in stain. Stained samples were prepared on continuous carbon EM grids (EMS 017543) and preserved using 2% uranyl acetate. Stained samples were imaged using a Thermo-Fisher Talos L120C transmission electron microscope outfitted with a LaB6 filament and operating at an acceleration voltage of 120kV. Automated data collection was carried out using Leginon (Suloway et al., 2005), with images recorded using a Ceta CMOS detector at a magnification of 36,000X (corresponding to a pixel size of 3.98Å). Particles were automatically picked from micrographs with DogPicker (Voss et al., 2009), using a low threshold to capture all possible mMED particle images. Between 30,000 and 90,000 initial particle images were picked for each experiment (Table S1B) and two independent rounds of clustering, one using Relion, and the other one using ISAC (Yang et al., 2012) were used to eliminate non-mMED images. Images in the remaining Mediator class averages were visually separated into 3 groups: free Mediator, PolII-bound Mediator and CKM-bound Mediator. The number of averages and images resulting from the ISAC runs are listed in Table S1B. Error bars for interaction quantification measurements were estimated by comparing results from the Relion and ISAC clustering.
EM localization of deleted or MBP-tagged mMED subunits
The EM image datasets used for mMED interaction quantification were also used for subunit localization through deletion or MBP-tagging. Images in 2D class averages from the initial round of 2D image clustering with ISAC were clustered one more time (also using ISAC, in some cases using a different number of images per group to optimize results) and the cleanest mMED averages were selected for further subunit localization analysis (Table S1B). Intensities in all final class averages were normalized to an average density of zero and a standard deviation of 1.0, and multiple average pairs were compared to identify average pairs that would result in the cleanest difference maps. Difference and heat maps were calculated and displayed using a custom image processing and plotting script written in Matlab, which allowed for interactive fine-tuning of cross-correlation-based map alignment prior to difference map calculation. Difference maps were also represented as heat maps colored by standard deviation, to facilitate their interpretation.
Localization of MED25 by 3D difference mapping was carried out by aligning and subtracting the MED19-FLAG wt 3D cryo-EM map from the MED25-FLAG wt 3D cryo-EM map in Chimera (see below for description of cryo-EM map calculation). No manipulation of the cryo-EM maps beyond normalization of density range was necessary, as both maps had comparable resolution (~6 Å). The 3D difference corresponding to MED25 density was then overlaid on the MED19-FLAG wt 3D cryo-EM map to highlight the position of MED25.
MudPIT analysis of wt and mutant mMED
For MudPIT analysis of wt and mutant mMEDs, ~2 μg of each purified mMED (purified as described) were used. MudPIT analysis results are listed in Table S1E.
QUANTIFICATION AND STATISTICAL ANALYSIS
ChIP-seq, RNA-seq, BS-seq, HiC-seq and Promoter-Capture HiC-seq data pre-processing
Reads were sequenced using the illumina HiSeq 2000, 2500 or 3000, following the manufacturer’s instructions. The standard pipeline (CASAVA 1.8.2) was used for image analysis and base calling. Data quality was inspected with fastqc. For HiC-seq and Promoter-Capture HiC-seq, we performed paired-end sequencing with 100-bp or 150-bp read-length. For others, we conducted single-end sequencing of 50-bp read-length.
CRISPR screening data pre-processing
Reads were sequenced using the illumina MiSeq, following the manufacturer’s instructions. The standard pipeline (CASAVA 1.8.2) was used for image analysis and base calling. Data quality was inspected with fastqc. We performed single-end sequencing with 80-bp read-length.
Alignment of ChIP-seq data processing
Sequence reads were aligned to the mouse genome (mm9) or human genome (hg19) using bowtie with flags -S -m 1 -a --best --strata -n 2, and aligned reads were selected with samtools view -S -b -F4 and sorted.
Visualization of density tracks
For single-nucleotide resolution coverage track, insert sizes were determined using MaSC (Ramachandran et al., 2013). Individual sample alignment files were converted to bed format (bamToBed), and deduplicated, allowing maximally 2 reads at the same position with awk. Then tags were extended by the insert size, sorted and merged with bedops (Neph et al., 2012), and counted using genomeCoverageBed. The resulting bedGraph file was converted to bigWig with bedGraphToBigWig. For others, density tracks were generated using custom software based on the samtools library to count the number of reads in 100 bp windows normalized to window size and library size to obtain densities in units of reads per kb region per million mapped reads (rpkm) across the genome. Up to 2 redundant reads were allowed. Tracks were smoothed and sometimes log-transformed in the UCSC genome browser.
RNA-seq data processing
Reads were aligned to the mouse genome (mm9) with gsnap (Wu and Nacu, 2010) without detecting splice junctions de novo (--novelsplicing=0). Existing splice junctions from RefSeq annotation were taken into account (--use-splicing=/path/to/mm9.splices.iit). Output files were filtered to remove unaligned reads and any alignments with a mapping quality less than 20. Reads were mapped to RefSeq genes with htseq-count -m intersection-nonempty (Andres et al., 2014) and rlog-transformed counts, fold-change and adjusted p-values were calculated using the R package DESeq2 (Anders and Huber, 2010). For some analysis, we calculated the rpkm from the counts directly, instead of DESeq2. To count significant genes in differential gene expression analysis, we used the following thresholds: 0.01 adjusted p-value, 0.58 log2FoldChange, and 100 basemean.
BS-seq data processing
BS-seq is mostly processed by Bismark package (Krueger and Andrews, 2011). After removing first 8nt with cutadapt program, reads were aligned to the mouse genome (mm9) with default parameter. Using BSseeker2 (Guo et al., 2013), low quality sequences and PCR duplicates are removed. BedGraph is generated by bismark_methylation_extractor in Bismark package.
CRISPR screen analysis
By merging possible pairs of primer sequence and sgRNAs, we made an artificial genome to align our sequencing results with bowtie (option: -S -m 1 -p 4 -a --best --strata -n 2 -l 40 or 80). With samtools idxstats program, alignment counts on each sgRNA and primer combination were extracted. The fraction of counts between conditions (2 days vs 12 days after virus infection) were calculated and converted in the matrix format for plotting with R.
Promoter-enhancer interaction definition
For CH12 cell, promoter and enhancer elements were defined by DHS, p300, H3K4me1 and H3K27ac histone modification data. DHS peaks were merged within 1.5kb. Only peaks which are overlapped with p300, H3K4me1 or H3K27ac peaks were selected. For other cells, only DHS data was used for element definition. The non-overlapped DHS peaks with +/− 2kb region around TSS are defined to “enhancer”. Publicly available PolII CHIAPET data was used to define cognate promoter-enhancer pairs. We exclude inter-domain CHIAPET interactions to reduce the false positives. For comparison, we also made all possible promoter-enhancer pairs by distance within domain.
HiC-Seq analysis
Using Juicer software (Durand et al., 2016b), .hic files were generated, and normalized ligation frequency matrices were obtained with dump command. Loop or domain calls and APA analysis were also done by juicer software (Durand et al, 2016a). Interaction matrices were visualized by Juicebox software. Final bin resolution of HiC map is 5kb.
DATA AND CODE AVAILABILITY
The accession numbers for the deep-sequencing data reported in this paper are found at GSE121355, while the cryo-EM maps are found at EMDB-20391, 20392 and 20393.
Supplementary Material
Figure S1. Cryo-EM image analysis of MED19-FLAG, MED25-FLAG and ΔMed1 mMED. Related to Figures 1 and 2. (A) A typical micrograph showing individual WT MED19-FLAG mMED particles (scale bar 200 nm). (B) A sample of class averages obtained by clustering of WT MED19-FLAG mMED images. (C) Fourier Shell Correlation plot used to estimate the resolution of the WT MED19-FLAG mMED cryo-EM map at ~6 Å. (D) Angular Distribution plot showing the distribution of particle orientations in the image dataset used to calculate the WT MED19-FLAG mMED cryo-EM map. (E) Directional resolution FSC plots showing the resolution of the WT MED19-FLAG mMED cryo-EM map along 3 perpendicular axes. The inset shows the orientation of the cryo-EM map with respect to the axis system. (F) A typical micrograph showing individual WT MED25-FLAG mMED particles (scale bar 200 nm). (G) A sample of class averages obtained by clustering of WT MED-25FLAG mMED images. (H) Fourier Shell Correlation plot used to estimate the resolution of the WT MED25-FLAG mMED cryo-EM map at ~5.5 Å. (I) Angular Distribution plot showing the distribution of particle orientations in the image dataset used to calculate the WT MED25-FLAG mMED cryo-EM map. (J) Directional resolution FSC plots showing the resolution of the WT MED25-FLAG mMED cryo-EM map along 3 perpendicular axes. The inset shows the orientation of the cryo-EM map with respect to the axis system. (K) Fourier Shell Correlation plot between the WT MED19-FLAG and WT MED25-FLAG cryo-EM maps, indicating their agreement to ~7.8 Å. (L) A typical micrograph showing individual ΔMED1 mMED particles (scale bar 200 nm). (M) A sample of class averages obtained by clustering of ΔMED1 mMED images. (N) Fourier Shell Correlation plot used to estimate the resolution of the ΔMED1 mMED cryo-EM map at ~8 Å. (O) Angular Distribution plot showing the distribution of particle orientations in the image dataset used to calculate the ΔMED1 mMED cryo-EM map. (P) Directional resolution FSC plots showing the resolution of the ΔMED1 mMED cryo-EM map along 3 perpendicular axes. The inset shows the orientation of the cryo-EM map with respect to the axis system.
Figure S2. Localization of mMED subunits by deletion and difference mapping. Related to Figures 1 and 2. (A) For each deleted subunit (as labeled), a 2D class average (left), a difference map (center) calculated by subtracting the deletion class average from a WT mMED average, and a heat map (right) showing negative differences colored by standard deviation (overlaid on the WT class average used for difference mapping) are shown. For MED1, MED23 and MED25, analogous sets calculated from side view averages are also included (as labeled). In the case of MED25, the subunit was not actually deleted. Instead, the difference map used to localize it was calculated by subtracting an average from MED19-FLAG particles in which MED25 was substoichiometric, from an average calculated from images of MED25-FLAG particles in which the subunits was comparatively enriched. Because deletion of MED15 leads to loss of the large Tail segment (and to interaction with the CKM), ΔMED15 averages were compared to ΔMED23-24-25 averages, which also lack the large Tail segment, but include MED15. (B) A summary of subunit deletion localization results in which differences due to deletion (or absence, for MED25) of a subunit are presented as heat maps, labeled and overlaid on diagrams representing the mMED structure colored by module (Head in light red, Middle in light blue, Tail in yellow). The standard deviation color scale on the right applies to heat maps in panels (A) and (B). (C) Localization of MED25 by 3D difference mapping. The WT MED19-FLAG cryo-EM map is shown in transparent light blue. The position (and rough molecular boundaries) of MED25 is indicated by the difference (in solid red) obtained by subtracting the MED19-FLAG cryo-EM map from a MED25-FLAG cryo-EM map. Both 3D maps were at a resolution of ~6 Å.
Figure S3. Localization of mMED subunits by MBP tagging and difference mapping. Related to figures 1 and 2. (A) For each MBP-tagged subunit (as labeled), a 2D class average (left), a difference map (center) calculated by subtracting a WT mMED average from the tagged subunit class average, and a heat map (right) showing positive differences colored by standard deviation (overlaid on the WT class average used for difference mapping) are shown. For labeling of the MED24 and MED30 C-termini, analogous sets calculated from side view averages are also included (as labeled). (B) A summary of subunit tagging localization results in which differences due to presence of an MBP ta on a specific subunit are presented as heat maps, labeled and overlaid on diagrams representing the mMED structure colored by module (Head in light red, Middle in light blue, Tail in yellow). The standard deviation color scale on the right applies to heat maps in panels (A) and (B).
Figure S4. Genetic screen of mMED in B cells. Related to Figure 3. (A) To knockout mMED genes sgRNA pairs (red scissors) and a Cas9 expressing plasmid were transduced to CH12 cells. Homozygous clones were expanded for further characterization. When only heterozygous clones were obtained, they were expanded and retargeted with a second sgRNA pair (black scissors) and bulk cultures under selection were harvested at 36h and 10d post-transfection. As shown for Med17 the presence of the second allele PCR product at 36h but not at 10d was indicative that homozygous deletion of Med17 led either to lethality or cell cycle arrest. Untargeted (+/+) clones were included in the analysis as controls. (B) Additional representative examples of bulk PCR analysis of CRISPR targeting. Blue arrows denote gene orientation.
Figure S5. Genetic screen of mMED in T cells and ES cells. Related to Figure 3. (A) To target mMED subunits in T and ES cells we constructed a lentiviral library containing 226 barcoded sgRNAs (4–6 sgRNAs per subunit, 1–2 per viral construct. When used in pairs, sgRNAs generally deleted the entire ORF or 5’ most exons, including promoters. When used singly, sgRNAs generated frameshift mutations. Viral supernatants were titrated to a MOI = 0.3 and transduced into ES cells or primary CD4 T cells isolated from Cas9 transgenic mice. DNA samples from puromycin-selected cells were screened 14 or 21 days post-infection for sgRNA abundance by deep-sequencing. (B) Heat map shows the extent of depletion (0–100%) of sgRNAs in ES cells and T cells. To help the comparison, genes were classified as essential (left) or non-essential (right) based on CH12 results. When results were unclear (marked with asterisks), or differed from those obtained in CH12 cells, genes were retargeted following the same strategy outlined in Figure S4. (C) Examples of individually verified mMED subunits in EL4 T cells.
Figure S6. Characterization of clones lacking MED14 and non-essential subunits including Tailless. Related to Figures 3 and 4. (A) Bar graph showing the number of upregulated (orange) and downregulated (blue) genes in various mutants excluding Tail ones. The analysis used a 1.5-fold cutoff (padj < 0.01 (B) Venn diagram showing the overlap in genes affected when Med19 is deleted with sgRNA pairs 1 or 2. (C) Western blot showing expression of MED14 (or β-actin control) in WT (left) or Med14Smash cells untreated (0h) or treated with APR for 30h or 60h. (D) Proliferation of WT and Med14-degron cells in the presence and absence of APR over 72h. (E) Forward-scatter analysis of Med14SMASh cells that were either untreated (blue line), 60h APR-treated (red line), or 60h APR-treated, washed, and analyzed 3 days later (black line). (F) Impact of MED14 degradation on PolII at promoters and enhancers, H3K4me1, H3K4me3, H3K36me3, and H3K27Ac genome-wide. (G) Cell growth comparison between Tailless and WT cells. (H) Box plot showing fold change (Tailless/WT) of PolII ChIP-Seq signals at promoters (left axis) and enhancers (right axis) of unaffected (light blue), upregulated (grey) and downregulated (yellow) genes. (I) Scatter plots showing transcriptome changes in MED23 (left) and MED20 cells (right) vs. WT control. Red dots are spike-in RNA controls. (J) Example of genes that are downregulated (Il5r1) or unchanged (Srrm2) in Tailless cells relative to control. mRNA, MED26, PolII and H3K4me1 profiles are shown.
Figure S7. Impact of Mediator-PolII depletion or MED-Tail deletion. Related to Figures 5–7. (A-B) Hi-C analysis of Mediator or cohesin degron (lower triangle) relative to control (upper triangle). myc and HMGA2 P-E contacts are underlined and the ratio of degron to control Hi-C signals are indicated. H3K27Ac, mRNA, CTCF, RAD21, MED26, PolII, and H3K4me3 tracks are shown. SE are boxed. (C) Western blot showing expression of RPB1 or β-Actin control in RAD21degronRPB1+/− cells. Lanes: PBS, Santa Cruz’ positive control (sc-2122), untreated, and α-Amanitin treated. (D) Proliferation levels in untreated (black) and α-Amanitin treated (red) RAD21degronRPB1+/− cells. (E) Promoter contacts for PHLDB2 in RAD21degronRPB1+/− cells grown under the conditions indicated. Blue scores denote significance. (F) Hi-C analysis of Mediator-PolII + cohesin double degron (lower triangle) relative to Mediator-PolII degron control (upper triangle) for the same locus shown in B. (G) Violin plot showing changes in intradomain interactions at TADs containing transcriptionally upregulated (blue) or downregulated (light green) genes in Tailless compared to controls. Changes in HCT116 cells upon cohesin degradation are shown for comparison. (H) Boxplot showing CpG methylation at CTCF binding sites in Tailless relative to controls. Motifs were classified based on whether CTCF signals were unchanged (left), increased (middle), or decreased (right).
Table S1. Related to all Figures in the main text. (A) cryo-EM dataset information. (B) List of clones used for cryo-EM analysis and creation of RBP1+/− HCT116 cells. (C) list of sgRNAs used to target mMED subunit genes by CRISPR. (D) Statistics of CRISPR targeting. (E) MudPIT analysis. (F) Promoter-Capture Hi-C statistics.
Table S2. Related to Figure 6. (A-I) Additional examples of PCHi-C analysis of CTCF- promoters.
Highlights.
A genetic, functional and structural analysis of mammalian Mediator is provided
Contacts between a conserved core and the Tail impact mMED-PolII interaction
Loss of non-essential mMED subunits affects promoters linked to multiple enhancers
Cohesin is required to tether regulatory DNA; mMED and PolII are not
ACKNOWLEDGEMENTS
This work was supported by NIH Helix Systems (http://helix.nih.gov), NIAMS funding to R.C., and NIGMS grant R01-67167 to FJA. E.L.A. was supported by awards from NIH (1DP2OD008540-01 and UM1HG009375), NSF (PHY-1427654), the Welch Foundation (Q-1866), NVIDIA, IBM University Challenge, Google Research, Cancer Prevention Research Institute of Texas (R1304), McNair Medical Institute, and the President’s Early Career Award in Science and Engineering.
Footnotes
Publisher's Disclaimer: This is a PDF file of an unedited manuscript that has been accepted for publication. As a service to our customers we are providing this early version of the manuscript. The manuscript will undergo copyediting, typesetting, and review of the resulting proof before it is published in its final form. Please note that during the production process errors may be discovered which could affect the content, and all legal disclaimers that apply to the journal pertain.
DECLARATION OF INTERESTS
The authors declare no conflicts of interest.
REFERENCES
- Alexander JM, Guan J, Huang B, Lomvardas S, and Weiner OD (2018). Live-Cell Imaging Reveals Enhancer-dependent Sox2 Transcription in the Absence of Enhancer Proximity. bioRxiv. [DOI] [PMC free article] [PubMed] [Google Scholar]
- Allen BL, and Taatjes DJ (2015). The Mediator complex: a central integrator of transcription. Nat Rev Mol Cell Biol 16, 155–166. [DOI] [PMC free article] [PubMed] [Google Scholar]
- Aranda-Orgilles B, Saldana-Meyer R, Wang E, Trompouki E, Fassl A, Lau S, Mullenders J, Rocha PP, Raviram R, Guillamot M, et al. (2016). MED12 Regulates HSC-Specific Enhancers Independently of Mediator Kinase Activity to Control Hematopoiesis. Cell stem cell 19, 784–799. [DOI] [PMC free article] [PubMed] [Google Scholar]
- Asturias FJ, Jiang YW, Myers LC, Gustafsson CM, and Kornberg RD (1999). Conserved structures of mediator and RNA polymerase II holoenzyme. Science 283, 985–987. [DOI] [PubMed] [Google Scholar]
- Benabdallah NS, and Bickmore WA (2015). Regulatory Domains and Their Mechanisms. Cold Spring Harb Symp Quant Biol 80, 45–51. [DOI] [PubMed] [Google Scholar]
- Benabdallah NS, Williamson I, Illingworth RS, Boyle S, Grimes GR, Therizols P, and Bickmore WA (2018). PARP mediated chromatin unfolding is coupled to long-range enhancer activation. bioRxiv. [Google Scholar]
- Bintu B, Mateo LJ, Su JH, Sinnott-Armstrong NA, Parker M, Kinrot S, Yamaya K, Boettiger AN, and Zhuang X (2018). Super-resolution chromatin tracing reveals domains and cooperative interactions in single cells. Science 362. [DOI] [PMC free article] [PubMed] [Google Scholar]
- Black JC, Choi JE, Lombardo SR, and Carey M (2006). A mechanism for coordinating chromatin modification and preinitiation complex assembly. Mol Cell 23, 809–818. [DOI] [PubMed] [Google Scholar]
- Cairns J, Freire-Pritchett P, Wingett SW, Varnai C, Dimond A, Plagnol V, Zerbino D, Schoenfelder S, Javierre BM, Osborne C, et al. (2016). CHiCAGO: robust detection of DNA looping interactions in Capture Hi-C data. Genome Biol 17, 127. [DOI] [PMC free article] [PubMed] [Google Scholar]
- Cevher MA, Shi Y, Li D, Chait BT, Malik S, and Roeder RG (2014). Reconstitution of active human core Mediator complex reveals a critical role of the MED14 subunit. Nat Struct Mol Biol 21, 1028–1034. [DOI] [PMC free article] [PubMed] [Google Scholar]
- Chen J, Zhang Z, Li L, Chen BC, Revyakin A, Hajj B, Legant W, Dahan M, Lionnet T, Betzig E, et al. (2014). Single-molecule dynamics of enhanceosome assembly in embryonic stem cells. Cell 156, 1274–1285. [DOI] [PMC free article] [PubMed] [Google Scholar]
- Cheng B, Li T, Rahl PB, Adamson TE, Loudas NB, Guo J, Varzavand K, Cooper JJ, Hu X, Gnatt A, et al. (2012). Functional association of Gdown1 with RNA polymerase II poised on human genes. Mol Cell 45, 38–50. [DOI] [PMC free article] [PubMed] [Google Scholar]
- Cho WK, Spille JH, Hecht M, Lee C, Li C, Grube V, and Cisse II (2018). Mediator and RNA polymerase II clusters associate in transcription-dependent condensates. Science 361, 412–415. [DOI] [PMC free article] [PubMed] [Google Scholar]
- Chong S, Dugast-Darzacq C, Liu Z, Dong P, Dailey GM, Cattoglio C, Heckert A, Banala S, Lavis L, Darzacq X, et al. (2018). Imaging dynamic and selective low-complexity domain interactions that control gene transcription. Science 361. [DOI] [PMC free article] [PubMed] [Google Scholar]
- Chung HK, Jacobs CL, Huo Y, Yang J, Krumm SA, Plemper RK, Tsien RY, and Lin MZ (2015). Tunable and reversible drug control of protein production via a self-excising degron. Nat Chem Biol 11, 713–720. [DOI] [PMC free article] [PubMed] [Google Scholar]
- Conaway RC, and Conaway JW (2013). The Mediator complex and transcription elongation. Biochim Biophys Acta 1829, 69–75. [DOI] [PMC free article] [PubMed] [Google Scholar]
- Deng W, Lee J, Wang H, Miller J, Reik A, Gregory PD, Dean A, and Blobel GA (2012). Controlling long-range genomic interactions at a native locus by targeted tethering of a looping factor. Cell 149, 1233–1244. [DOI] [PMC free article] [PubMed] [Google Scholar]
- Donner AJ, Ebmeier CC, Taatjes DJ, and Espinosa JM (2010). CDK8 is a positive regulator of transcriptional elongation within the serum response network. Nat Struct Mol Biol 17, 194–201. [DOI] [PMC free article] [PubMed] [Google Scholar]
- Esnault C, Ghavi-Helm Y, Brun S, Soutourina J, Van Berkum N, Boschiero C, Holstege F, and Werner M (2008). Mediator-dependent recruitment of TFIIH modules in preinitiation complex. Mol Cell 31, 337–346. [DOI] [PubMed] [Google Scholar]
- Eychenne T, Novikova E, Barrault MB, Alibert O, Boschiero C, Peixeiro N, Cornu D, Redeker V, Kuras L, Nicolas P, et al. (2016). Functional interplay between Mediator and TFIIB in preinitiation complex assembly in relation to promoter architecture. Genes Dev 30, 2119–2132. [DOI] [PMC free article] [PubMed] [Google Scholar]
- Finn EH, Pegoraro G, Brandao HB, Valton AL, Oomen ME, Dekker J, Mirny L, and Misteli T (2019). Extensive Heterogeneity and Intrinsic Variation in Spatial Genome Organization. Cell 176, 1502–1515 e1510. [DOI] [PMC free article] [PubMed] [Google Scholar]
- Fukaya T, Lim B, and Levine M (2016). Enhancer Control of Transcriptional Bursting. Cell 166, 358–368. [DOI] [PMC free article] [PubMed] [Google Scholar]
- Furlong EEM, and Levine M (2018). Developmental enhancers and chromosome topology. Science 361, 1341–1345. [DOI] [PMC free article] [PubMed] [Google Scholar]
- Guo W, Fiziev P, Yan W, Cokus S, Sun X, Zhang MQ, Chen PY, and Pellegrini M (2013). BS-Seeker2: a versatile aligning pipeline for bisulfite sequencing data. BMC genomics 14, 774. [DOI] [PMC free article] [PubMed] [Google Scholar]
- Hansen AS, Pustova I, Cattoglio C, Tjian R, and Darzacq X (2017). CTCF and cohesin regulate chromatin loop stability with distinct dynamics. eLife 6. [DOI] [PMC free article] [PubMed] [Google Scholar]
- Ito M, Okano HJ, Darnell RB, and Roeder RG (2002). The TRAP100 component of the TRAP/Mediator complex is essential in broad transcriptional events and development. EMBO J 21, 3464–3475. [DOI] [PMC free article] [PubMed] [Google Scholar]
- Jeronimo C, and Robert F (2017). The Mediator Complex: At the Nexus of RNA Polymerase II Transcription. Trends Cell Biol 27, 765–783. [DOI] [PubMed] [Google Scholar]
- Jishage M, Malik S, Wagner U, Uberheide B, Ishihama Y, Hu X, Chait BT, Gnatt A, Ren B, and Roeder RG (2012). Transcriptional regulation by Pol II(G) involving mediator and competitive interactions of Gdown1 and TFIIF with Pol II. Mol Cell 45, 51–63. [DOI] [PMC free article] [PubMed] [Google Scholar]
- Kagey MH, Newman JJ, Bilodeau S, Zhan Y, Orlando DA, van Berkum NL, Ebmeier CC, Goossens J, Rahl PB, Levine SS, et al. (2010). Mediator and cohesin connect gene expression and chromatin architecture. Nature 467, 430–435. [DOI] [PMC free article] [PubMed] [Google Scholar]
- Kieffer-Kwon KR, Nimura K, Rao SSP, Xu J, Jung S, Pekowska A, Dose M, Stevens E, Mathe E, Dong P, et al. (2017). Myc Regulates Chromatin Decompaction and Nuclear Architecture during B Cell Activation. Mol Cell 67, 566–578 e510. [DOI] [PMC free article] [PubMed] [Google Scholar]
- Kim YJ, Bjorklund S, Li Y, Sayre MH, and Kornberg RD (1994). A multiprotein mediator of transcriptional activation and its interaction with the C-terminal repeat domain of RNA polymerase II. Cell 77, 599–608. [DOI] [PubMed] [Google Scholar]
- Kornberg RD (2005). Mediator and the mechanism of transcriptional activation. Trends Biochem Sci 30, 235–239. [DOI] [PubMed] [Google Scholar]
- Kouzine F, Wojtowicz D, Yamane A, Resch W, Kieffer-Kwon KR, Bandle R, Nelson S, Nakahashi H, Awasthi P, Feigenbaum L, et al. (2013). Global regulation of promoter melting in naive lymphocytes. Cell 153, 988–999. [DOI] [PMC free article] [PubMed] [Google Scholar]
- Krueger F, and Andrews SR (2011). Bismark: a flexible aligner and methylation caller for Bisulfite-Seq applications. Bioinformatics 27, 1571–1572. [DOI] [PMC free article] [PubMed] [Google Scholar]
- Lai F, Orom UA, Cesaroni M, Beringer M, Taatjes DJ, Blobel GA, and Shiekhattar R (2013). Activating RNAs associate with Mediator to enhance chromatin architecture and transcription. Nature 494, 497–501. [DOI] [PMC free article] [PubMed] [Google Scholar]
- Langmead B, and Salzberg SL (2012). Fast gapped-read alignment with Bowtie 2. Nat Methods 9, 357–359. [DOI] [PMC free article] [PubMed] [Google Scholar]
- Li Y, Bjorklund S, Jiang YW, Kim YJ, Lane WS, Stillman DJ, and Kornberg RD (1995). Yeast global transcriptional regulators Sin4 and Rgr1 are components of mediator complex/RNA polymerase II holoenzyme. Proc Natl Acad Sci U S A 92, 10864–10868. [DOI] [PMC free article] [PubMed] [Google Scholar]
- Malik S, and Roeder RG (2010). The metazoan Mediator co-activator complex as an integrative hub for transcriptional regulation. Nat Rev Genet 11, 761–772. [DOI] [PMC free article] [PubMed] [Google Scholar]
- Mateo LJ, Murphy SE, Hafner A, Cinquini IS, Walker CA, and Boettinger AN (2019). Visualizing DNA folding and RNA in embryos at single-cell resolution. Nature. [DOI] [PMC free article] [PubMed] [Google Scholar]
- Monte D, Clantin B, Dewitte F, Lens Z, Rucktooa P, Pardon E, Steyaert J, Verger A, and Villeret V (2018). Crystal structure of human Mediator subunit MED23. Nature communications 9, 3389. [DOI] [PMC free article] [PubMed] [Google Scholar]
- Montefiori LE, Sobreira DR, Sakabe NJ, Aneas I, Joslin AC, Hansen GT, Bozek G, Moskowitz IP, McNally EM, and Nobrega MA (2018). A promoter interaction map for cardiovascular disease genetics. eLife 7. [DOI] [PMC free article] [PubMed] [Google Scholar]
- Morgan SL, Mariano NC, Bermudez A, Arruda NL, Wu F, Luo Y, Shankar G, Jia L, Chen H, Hu JF, et al. (2017). Manipulation of nuclear architecture through CRISPR-mediated chromosomal looping. Nature communications 8, 15993. [DOI] [PMC free article] [PubMed] [Google Scholar]
- Moriya T, Saur M, Stabrin M, Merino F, Voicu H, Huang Z, Penczek PA, Raunser S, and Gatsogiannis C (2017). High-resolution Single Particle Analysis from Electron Cryo-microscopy Images Using SPHIRE. Journal of visualized experiments : JoVE. [DOI] [PMC free article] [PubMed] [Google Scholar]
- Natsume T, Kiyomitsu T, Saga Y, and Kanemaki MT (2016). Rapid Protein Depletion in Human Cells by Auxin-Inducible Degron Tagging with Short Homology Donors. Cell Rep 15, 210–218. [DOI] [PubMed] [Google Scholar]
- Nguyen VT, Giannoni F, Dubois MF, Seo SJ, Vigneron M, Kedinger C, and Bensaude O (1996). In vivo degradation of RNA polymerase II largest subunit triggered by alpha-amanitin. Nucleic Acids Res 24, 2924–2929. [DOI] [PMC free article] [PubMed] [Google Scholar]
- Nozawa K, Schneider TR, and Cramer P (2017). Core Mediator structure at 3.4 A extends model of transcription initiation complex. Nature 545, 248–251. [DOI] [PubMed] [Google Scholar]
- Petrenko N, Jin Y, Wong KH, and Struhl K (2017). Evidence that Mediator is essential for Pol II transcription, but is not a required component of the preinitiation complex in vivo. eLife 6. [DOI] [PMC free article] [PubMed] [Google Scholar]
- Pettersen EF, Goddard TD, Huang CC, Couch GS, Greenblatt DM, Meng EC, and Ferrin TE (2004). UCSF Chimera--a visualization system for exploratory research and analysis. J Comput Chem 25, 1605–1612. [DOI] [PubMed] [Google Scholar]
- Phillips-Cremins JE, Sauria ME, Sanyal A, Gerasimova TI, Lajoie BR, Bell JS, Ong CT, Hookway TA, Guo C, Sun Y, et al. (2013). Architectural Protein Subclasses Shape 3D Organization of Genomes during Lineage Commitment. Cell 153, 1281–1295. [DOI] [PMC free article] [PubMed] [Google Scholar]
- Plaschka C, Lariviere L, Wenzeck L, Seizl M, Hemann M, Tegunov D, Petrotchenko EV, Borchers CH, Baumeister W, Herzog F, et al. (2015). Architecture of the RNA polymerase II-Mediator core initiation complex. Nature 518, 376–380. [DOI] [PubMed] [Google Scholar]
- Plaschka C, Nozawa K, and Cramer P (2016). Mediator Architecture and RNA Polymerase II Interaction. J Mol Biol 428, 2569–2574. [DOI] [PubMed] [Google Scholar]
- Punjani A, Rubinstein JL, Fleet DJ, and Brubaker MA (2017). cryoSPARC: algorithms for rapid unsupervised cryo-EM structure determination. Nat Methods 14, 290–296. [DOI] [PubMed] [Google Scholar]
- Quinlan AR, and Hall IM (2010). BEDTools: a flexible suite of utilities for comparing genomic features. Bioinformatics 26, 841–842. [DOI] [PMC free article] [PubMed] [Google Scholar]
- Rao SS, Huntley MH, Durand NC, Stamenova EK, Bochkov ID, Robinson JT, Sanborn AL, Machol I, Omer AD, Lander ES, et al. (2014). A 3D map of the human genome at kilobase resolution reveals principles of chromatin looping. Cell 159, 1665–1680. [DOI] [PMC free article] [PubMed] [Google Scholar]
- Rao SSP, Huang SC, Glenn St Hilaire B, Engreitz JM, Perez EM, Kieffer-Kwon KR, Sanborn AL, Johnstone SE, Bascom GD, Bochkov ID, et al. (2017). Cohesin Loss Eliminates All Loop Domains. Cell 171, 305–320 e324. [DOI] [PMC free article] [PubMed] [Google Scholar]
- Robinson PJ, Trnka MJ, Bushnell DA, Davis RE, Mattei PJ, Burlingame AL, and Kornberg RD (2016). Structure of a Complete Mediator-RNA Polymerase II Pre-Initiation Complex. Cell 166, 1411–1422 e1416. [DOI] [PMC free article] [PubMed] [Google Scholar]
- Robinson PJ, Trnka MJ, Pellarin R, Greenberg CH, Bushnell DA, Davis R, Burlingame AL, Sali A, and Kornberg RD (2015). Molecular architecture of the yeast Mediator complex. eLife 4. [DOI] [PMC free article] [PubMed] [Google Scholar]
- Sabari BR, Dall’Agnese A, Boija A, Klein IA, Coffey EL, Shrinivas K, Abraham BJ, Hannett NM, Zamudio AV, Manteiga JC, et al. (2018). Coactivator condensation at super-enhancers links phase separation and gene control. Science 361. [DOI] [PMC free article] [PubMed] [Google Scholar]
- Scheres SH (2012). RELION: implementation of a Bayesian approach to cryo-EM structure determination. J Struct Biol 180, 519–530. [DOI] [PMC free article] [PubMed] [Google Scholar]
- Schilbach S, Hantsche M, Tegunov D, Dienemann C, Wigge C, Urlaub H, and Cramer P (2017). Structures of transcription pre-initiation complex with TFIIH and Mediator. Nature 551, 204–209. [DOI] [PMC free article] [PubMed] [Google Scholar]
- Schoenfelder S, Furlan-Magaril M, Mifsud B, Tavares-Cadete F, Sugar R, Javierre BM, Nagano T, Katsman Y, Sakthidevi M, Wingett SW, et al. (2015). The pluripotent regulatory circuitry connecting promoters to their long-range interacting elements. Genome Res 25, 582–597. [DOI] [PMC free article] [PubMed] [Google Scholar]
- Shalem O, Sanjana NE, Hartenian E, Shi X, Scott DA, Mikkelson T, Heckl D, Ebert BL, Root DE, Doench JG, et al. (2014). Genome-scale CRISPR-Cas9 knockout screening in human cells. Science 343, 84–87. [DOI] [PMC free article] [PubMed] [Google Scholar]
- Soutourina J (2018). Transcription regulation by the Mediator complex. Nat Rev Mol Cell Biol 19, 262–274. [DOI] [PubMed] [Google Scholar]
- Spaeth JM, Kim NH, and Boyer TG (2011). Mediator and human disease. Seminars in cell & developmental biology 22, 776–787. [DOI] [PMC free article] [PubMed] [Google Scholar]
- Stevens JL, Cantin GT, Wang G, Shevchenko A, Shevchenko A, and Berk AJ (2002). Transcription control by E1A and MAP kinase pathway via Sur2 mediator subunit. Science 296, 755–758. [DOI] [PubMed] [Google Scholar]
- Suloway C, Pulokas J, Fellmann D, Cheng A, Guerra F, Quispe J, Stagg S, Potter CS, and Carragher B (2005). Automated molecular microscopy: the new Leginon system. J Struct Biol 151, 41–60. [DOI] [PubMed] [Google Scholar]
- Takahashi H, Parmely TJ, Sato S, Tomomori-Sato C, Banks CA, Kong SE, Szutorisz H, Swanson SK, Martin-Brown S, Washburn MP, et al. (2011). Human mediator subunit MED26 functions as a docking site for transcription elongation factors. Cell 146, 92–104. [DOI] [PMC free article] [PubMed] [Google Scholar]
- Tan YZ, Baldwin PR, Davis JH, Williamson JR, Potter CS, Carragher B, and Lyumkis D (2017). Addressing preferred specimen orientation in single-particle cryo-EM through tilting. Nat Methods 14, 793–796. [DOI] [PMC free article] [PubMed] [Google Scholar]
- Tsai KL, Tomomori-Sato C, Sato S, Conaway RC, Conaway JW, and Asturias FJ (2014). Subunit architecture and functional modular rearrangements of the transcriptional mediator complex. Cell 157, 1430–1444. [DOI] [PMC free article] [PubMed] [Google Scholar]
- Tsai KL, Yu X, Gopalan S, Chao TC, Zhang Y, Florens L, Washburn MP, Murakami K, Conaway RC, Conaway JW, et al. (2017). Mediator structure and rearrangements required for holoenzyme formation. Nature 544, 196–201. [DOI] [PMC free article] [PubMed] [Google Scholar]
- Vian L, Pekowska A, Rao SSP, Kieffer-Kwon KR, Jung S, Baranello L, Huang SC, El Khattabi L, Dose M, Pruett N, et al. (2018). The Energetics and Physiological Impact of Cohesin Extrusion. Cell 173, 1165–1178 e1120. [DOI] [PMC free article] [PubMed] [Google Scholar]
- Wingett S, Ewels P, Furlan-Magaril M, Nagano T, Schoenfelder S, Fraser P, and Andrews S (2015). HiCUP: pipeline for mapping and processing Hi-C data. F1000Res 4, 1310. [DOI] [PMC free article] [PubMed] [Google Scholar]
- Yang Z, Fang J, Chittuluru J, Asturias FJ, and Penczek PA (2012). Iterative stable alignment and clustering of 2D transmission electron microscope images. Structure 20, 237–247. [DOI] [PMC free article] [PubMed] [Google Scholar]
- Zabidi MA, and Stark A (2016). Regulatory Enhancer-Core-Promoter Communication via Transcription Factors and Cofactors. Trends Genet 32, 801–814. [DOI] [PMC free article] [PubMed] [Google Scholar]
- Zheng SQ, Palovcak E, Armache JP, Verba KA, Cheng Y, and Agard DA (2017). MotionCor2: anisotropic correction of beam-induced motion for improved cryo-electron microscopy. Nat Methods 14, 331–332. [DOI] [PMC free article] [PubMed] [Google Scholar]
- Zhu X, Chen L, Carlsten JO, Liu Q, Yang J, Liu B, and Gustafsson CM (2015). Mediator tail subunits can form amyloid-like aggregates in vivo and affect stress response in yeast. Nucleic Acids Res 43, 7306–7314. [DOI] [PMC free article] [PubMed] [Google Scholar]
Associated Data
This section collects any data citations, data availability statements, or supplementary materials included in this article.
Supplementary Materials
Figure S1. Cryo-EM image analysis of MED19-FLAG, MED25-FLAG and ΔMed1 mMED. Related to Figures 1 and 2. (A) A typical micrograph showing individual WT MED19-FLAG mMED particles (scale bar 200 nm). (B) A sample of class averages obtained by clustering of WT MED19-FLAG mMED images. (C) Fourier Shell Correlation plot used to estimate the resolution of the WT MED19-FLAG mMED cryo-EM map at ~6 Å. (D) Angular Distribution plot showing the distribution of particle orientations in the image dataset used to calculate the WT MED19-FLAG mMED cryo-EM map. (E) Directional resolution FSC plots showing the resolution of the WT MED19-FLAG mMED cryo-EM map along 3 perpendicular axes. The inset shows the orientation of the cryo-EM map with respect to the axis system. (F) A typical micrograph showing individual WT MED25-FLAG mMED particles (scale bar 200 nm). (G) A sample of class averages obtained by clustering of WT MED-25FLAG mMED images. (H) Fourier Shell Correlation plot used to estimate the resolution of the WT MED25-FLAG mMED cryo-EM map at ~5.5 Å. (I) Angular Distribution plot showing the distribution of particle orientations in the image dataset used to calculate the WT MED25-FLAG mMED cryo-EM map. (J) Directional resolution FSC plots showing the resolution of the WT MED25-FLAG mMED cryo-EM map along 3 perpendicular axes. The inset shows the orientation of the cryo-EM map with respect to the axis system. (K) Fourier Shell Correlation plot between the WT MED19-FLAG and WT MED25-FLAG cryo-EM maps, indicating their agreement to ~7.8 Å. (L) A typical micrograph showing individual ΔMED1 mMED particles (scale bar 200 nm). (M) A sample of class averages obtained by clustering of ΔMED1 mMED images. (N) Fourier Shell Correlation plot used to estimate the resolution of the ΔMED1 mMED cryo-EM map at ~8 Å. (O) Angular Distribution plot showing the distribution of particle orientations in the image dataset used to calculate the ΔMED1 mMED cryo-EM map. (P) Directional resolution FSC plots showing the resolution of the ΔMED1 mMED cryo-EM map along 3 perpendicular axes. The inset shows the orientation of the cryo-EM map with respect to the axis system.
Figure S2. Localization of mMED subunits by deletion and difference mapping. Related to Figures 1 and 2. (A) For each deleted subunit (as labeled), a 2D class average (left), a difference map (center) calculated by subtracting the deletion class average from a WT mMED average, and a heat map (right) showing negative differences colored by standard deviation (overlaid on the WT class average used for difference mapping) are shown. For MED1, MED23 and MED25, analogous sets calculated from side view averages are also included (as labeled). In the case of MED25, the subunit was not actually deleted. Instead, the difference map used to localize it was calculated by subtracting an average from MED19-FLAG particles in which MED25 was substoichiometric, from an average calculated from images of MED25-FLAG particles in which the subunits was comparatively enriched. Because deletion of MED15 leads to loss of the large Tail segment (and to interaction with the CKM), ΔMED15 averages were compared to ΔMED23-24-25 averages, which also lack the large Tail segment, but include MED15. (B) A summary of subunit deletion localization results in which differences due to deletion (or absence, for MED25) of a subunit are presented as heat maps, labeled and overlaid on diagrams representing the mMED structure colored by module (Head in light red, Middle in light blue, Tail in yellow). The standard deviation color scale on the right applies to heat maps in panels (A) and (B). (C) Localization of MED25 by 3D difference mapping. The WT MED19-FLAG cryo-EM map is shown in transparent light blue. The position (and rough molecular boundaries) of MED25 is indicated by the difference (in solid red) obtained by subtracting the MED19-FLAG cryo-EM map from a MED25-FLAG cryo-EM map. Both 3D maps were at a resolution of ~6 Å.
Figure S3. Localization of mMED subunits by MBP tagging and difference mapping. Related to figures 1 and 2. (A) For each MBP-tagged subunit (as labeled), a 2D class average (left), a difference map (center) calculated by subtracting a WT mMED average from the tagged subunit class average, and a heat map (right) showing positive differences colored by standard deviation (overlaid on the WT class average used for difference mapping) are shown. For labeling of the MED24 and MED30 C-termini, analogous sets calculated from side view averages are also included (as labeled). (B) A summary of subunit tagging localization results in which differences due to presence of an MBP ta on a specific subunit are presented as heat maps, labeled and overlaid on diagrams representing the mMED structure colored by module (Head in light red, Middle in light blue, Tail in yellow). The standard deviation color scale on the right applies to heat maps in panels (A) and (B).
Figure S4. Genetic screen of mMED in B cells. Related to Figure 3. (A) To knockout mMED genes sgRNA pairs (red scissors) and a Cas9 expressing plasmid were transduced to CH12 cells. Homozygous clones were expanded for further characterization. When only heterozygous clones were obtained, they were expanded and retargeted with a second sgRNA pair (black scissors) and bulk cultures under selection were harvested at 36h and 10d post-transfection. As shown for Med17 the presence of the second allele PCR product at 36h but not at 10d was indicative that homozygous deletion of Med17 led either to lethality or cell cycle arrest. Untargeted (+/+) clones were included in the analysis as controls. (B) Additional representative examples of bulk PCR analysis of CRISPR targeting. Blue arrows denote gene orientation.
Figure S5. Genetic screen of mMED in T cells and ES cells. Related to Figure 3. (A) To target mMED subunits in T and ES cells we constructed a lentiviral library containing 226 barcoded sgRNAs (4–6 sgRNAs per subunit, 1–2 per viral construct. When used in pairs, sgRNAs generally deleted the entire ORF or 5’ most exons, including promoters. When used singly, sgRNAs generated frameshift mutations. Viral supernatants were titrated to a MOI = 0.3 and transduced into ES cells or primary CD4 T cells isolated from Cas9 transgenic mice. DNA samples from puromycin-selected cells were screened 14 or 21 days post-infection for sgRNA abundance by deep-sequencing. (B) Heat map shows the extent of depletion (0–100%) of sgRNAs in ES cells and T cells. To help the comparison, genes were classified as essential (left) or non-essential (right) based on CH12 results. When results were unclear (marked with asterisks), or differed from those obtained in CH12 cells, genes were retargeted following the same strategy outlined in Figure S4. (C) Examples of individually verified mMED subunits in EL4 T cells.
Figure S6. Characterization of clones lacking MED14 and non-essential subunits including Tailless. Related to Figures 3 and 4. (A) Bar graph showing the number of upregulated (orange) and downregulated (blue) genes in various mutants excluding Tail ones. The analysis used a 1.5-fold cutoff (padj < 0.01 (B) Venn diagram showing the overlap in genes affected when Med19 is deleted with sgRNA pairs 1 or 2. (C) Western blot showing expression of MED14 (or β-actin control) in WT (left) or Med14Smash cells untreated (0h) or treated with APR for 30h or 60h. (D) Proliferation of WT and Med14-degron cells in the presence and absence of APR over 72h. (E) Forward-scatter analysis of Med14SMASh cells that were either untreated (blue line), 60h APR-treated (red line), or 60h APR-treated, washed, and analyzed 3 days later (black line). (F) Impact of MED14 degradation on PolII at promoters and enhancers, H3K4me1, H3K4me3, H3K36me3, and H3K27Ac genome-wide. (G) Cell growth comparison between Tailless and WT cells. (H) Box plot showing fold change (Tailless/WT) of PolII ChIP-Seq signals at promoters (left axis) and enhancers (right axis) of unaffected (light blue), upregulated (grey) and downregulated (yellow) genes. (I) Scatter plots showing transcriptome changes in MED23 (left) and MED20 cells (right) vs. WT control. Red dots are spike-in RNA controls. (J) Example of genes that are downregulated (Il5r1) or unchanged (Srrm2) in Tailless cells relative to control. mRNA, MED26, PolII and H3K4me1 profiles are shown.
Figure S7. Impact of Mediator-PolII depletion or MED-Tail deletion. Related to Figures 5–7. (A-B) Hi-C analysis of Mediator or cohesin degron (lower triangle) relative to control (upper triangle). myc and HMGA2 P-E contacts are underlined and the ratio of degron to control Hi-C signals are indicated. H3K27Ac, mRNA, CTCF, RAD21, MED26, PolII, and H3K4me3 tracks are shown. SE are boxed. (C) Western blot showing expression of RPB1 or β-Actin control in RAD21degronRPB1+/− cells. Lanes: PBS, Santa Cruz’ positive control (sc-2122), untreated, and α-Amanitin treated. (D) Proliferation levels in untreated (black) and α-Amanitin treated (red) RAD21degronRPB1+/− cells. (E) Promoter contacts for PHLDB2 in RAD21degronRPB1+/− cells grown under the conditions indicated. Blue scores denote significance. (F) Hi-C analysis of Mediator-PolII + cohesin double degron (lower triangle) relative to Mediator-PolII degron control (upper triangle) for the same locus shown in B. (G) Violin plot showing changes in intradomain interactions at TADs containing transcriptionally upregulated (blue) or downregulated (light green) genes in Tailless compared to controls. Changes in HCT116 cells upon cohesin degradation are shown for comparison. (H) Boxplot showing CpG methylation at CTCF binding sites in Tailless relative to controls. Motifs were classified based on whether CTCF signals were unchanged (left), increased (middle), or decreased (right).
Table S1. Related to all Figures in the main text. (A) cryo-EM dataset information. (B) List of clones used for cryo-EM analysis and creation of RBP1+/− HCT116 cells. (C) list of sgRNAs used to target mMED subunit genes by CRISPR. (D) Statistics of CRISPR targeting. (E) MudPIT analysis. (F) Promoter-Capture Hi-C statistics.
Table S2. Related to Figure 6. (A-I) Additional examples of PCHi-C analysis of CTCF- promoters.
Data Availability Statement
The accession numbers for the deep-sequencing data reported in this paper are found at GSE121355, while the cryo-EM maps are found at EMDB-20391, 20392 and 20393.