

Abstract
Background:
The authors conducted a scoping review as a first step toward establishing harmonized (ie, consistent and compatible), empirically based best practices for validating step-counting wearable technologies.
Purpose:
To catalog studies validating step-counting wearable technologies during treadmill ambulation.
Methods:
The authors searched PubMed and SPORTDiscus in August 2019 to identify treadmill-based validation studies that employed the criterion of directly observed (including video recorded) steps and cataloged study sample characteristics, protocol details, and analytical procedures. Where reported, speed- and wear location-specific mean absolute percentage error (MAPE) values were tabulated. Weighted median MAPE values were calculated by wear location and a 0.2-m/s speed increment.
Results:
Seventy-seven eligible studies were identified: most had samples averaging 54% (SD = 5%) female and 27 (5) years of age, treadmill protocols consisting of 3 to 5 bouts at speeds of 0.8 (0.1) to 1.6 (0.2) m/s, and reported measures of bias. Eleven studies provided MAPE values at treadmill speeds of 1.1 to 1.8 m/s; their weighted median MAPE values were 7% to 11% for wrist-worn, 1% to 4% for waist-worn, and ≤1% for thigh-worn devices.
Conclusions:
Despite divergent study methodologies, the authors identified common practices and summarized MAPE values representing device step-count accuracy during treadmill walking. These initial empirical findings should be further refined to ultimately establish harmonized best practices for validating wearable technologies.
Keywords: accelerometry, measurement, pedometry, physical activity assessment, scoping review/meta-analysis, motion sensors
Stepping is the principal motor pattern underlying basic human mobility (ie, walking). With walking being the most commonly reported leisure-time physical activity,1 step-based metrics (eg, steps/d, steps/min) provide a simple and straightforward approach to quantifying physical activity. Consumer preference for this trackable and human-scaled measurement is reflected by the fact that most contemporary wearable technologies (ie, devices) offer a step-counting feature.2 The 2018 Physical Activity Guidelines Advisory Committee Scientific Report also recently advocated for the benefits of step counting.3 Simple counts of steps derived from wearable technologies provide movement data that are less distorted by the assumption-based manipulations required to estimate distance or energy expenditure with the same devices (eg, step length, resting metabolic rate).4,5 Step counting also has a clear criterion standard (direct observation), which can be applied even in free-living conditions.6
For step-based metrics to be readily adopted to measure and modulate physical activity, there is a need to harmonize (ie, make consistent or compatible) the protocols, analyses, and data interpretation methods used in validating the rapidly growing range of step-counting wearable technologies.7 This need is further highlighted by the fact that only ~5% of consumer step-counting devices have been formally validated.8 A harmonized methodology for validating these devices would facilitate comprehensive evaluations of device performance and enable direct comparisons between studies and the devices they test. The Consumer Technology Association (CTA) released a standard (their term for a technical publication) in 20169 with guidelines (eg, testing setup, participant considerations, walking/running speeds, bout durations, etc.) for treadmill-based validation of step-counting wearable technologies. The CTA additionally provided an acceptable error requirement for evaluating the accuracy of these devices based on mean absolute percentage error (MAPE), calculated as follows9:
| (1) |
where criterion is the hand-counted steps from direct observation, device is the step-count output from the device being tested, and n is the total number of step-count observations (ie, person bouts) being analyzed. While the CTA stated that a device must perform with a MAPE of ≤10% to meet their acceptable error requirement, they provided no rationale or supporting evidence for this or any of their guidelines. A MAPE of ≤5% has been suggested by other researchers as a threshold for determining the accuracy of step-counting devices, with the rationale that MAPEs below this level do not have “practical relevance.”10,11 In addition, Hatano12 reported that pedometers made in Japan were expected to perform at a MAPE ≤3% for approval by the Japanese Ministry of Economy Trade and Industry. However, these earlier attempts9–12 to guide evaluations of step-counting device validity also lacked any empirical basis.
A first step toward establishing harmonized, empirically based best practices for validating step-counting devices is to review the relevant body of literature and identify common practices employed by researchers in the field. Furthermore, aggregating the results of these validation studies could provide summary MAPE values representing the accuracy of contemporary step-counting devices. Thus, the purpose of this scoping review was to summarize the scientific literature that has focused on the validation of step-counting wearable technologies during treadmill ambulation (a common, controllable, and replicable condition). The specific objectives were to (1) catalog the sample characteristics, protocol details, and analytical procedures of treadmill-based validation studies that employed a criterion of observed steps taken and (2) aggregate the speed- and wear-location-specific MAPE values reported for step-counting devices.
Congruent with the CTA Standard9 and more recent recommendations,13 MAPE was selected as the preferred accuracy metric for 2 main reasons. First, MAPE is a relative measure of error (percentage error). The practical relevance of a given step-counting error value is largely dependent upon the total number of steps taken. For example, an error of 100 steps is marginal relative to a full day of 10,000 accumulated steps (ie, 1%), but substantial relative to a 5-minute bout of 500 steps (ie, 20%). Presenting MAPE, therefore, contextualizes error values to enhance communication of their practical relevance and enable more meaningful comparisons across studies. Second, calculation of the absolute error obviates the cancelation of differences when averaging positive and negative values from underestimation and overestimation.13 For example, a 50-step overestimation (positive error) in 1 bout and 50-step underestimation (negative error) in another would result in a mean error of 0 steps, but a mean absolute error of 50 steps.
Methods
Search Strategy, Inclusion Criteria, and Study Selection
The PRISMA statement14 was used to guide our search and reporting strategies; however, we acknowledge that this checklist was not fully applicable to our stated intentions to catalog study samples, protocols, analytical procedures, and criterion-based MAPE values. Accordingly, an electronic search of PubMed and SPORTDiscus was conducted and updated to August 2019 with the Boolean search string of “(acceleromet* OR pedomet* OR device OR monitor OR wearable) AND (‘steps/min*’ OR ‘steps per min*’ OR ‘step count’) AND (valid* OR reliab*)” and filters of “human” and “English.” All articles identified were screened for inclusion, first by a review of their abstracts and then full texts, using the following inclusion criteria: (1) a validation study of wearable technology, (2) conducted during treadmill walking, (3) using steps as a device outcome measure, and (4) while employing a criterion measure of observed steps taken (ie, hand-counted steps, including video recording and/or dictated executions of stepping patterns). The reference sections of all included studies were then screened for other potentially eligible articles. All articles included from this search comprised the catalog of validation study sample characteristics, protocol details, and analytical procedures.
We subsequently rereviewed all included articles to catalog treadmill speed- and device wear location-specific MAPE values using the following 3 additional criteria: (1) the protocol included level walking (ie, 0% treadmill grade) at treadmill speeds that were consistent across all participants (eg, not set relative to participants’ self-selected walking speeds); (2) devices were worn in a location commonly used for research purposes (ie, on the waist, wrist, upper arm, thigh, ankle, or foot); and (3) the reported MAPE values were calculated using the standard formula (Equation 1). We have chosen to focus on MAPE herein for the reasons previously discussed. Nonetheless, we also cataloged the mean percentage error (MPE) values by speed and device wear location using the same search strategy, thereby quantifying the direction of the device step-count error.
Data Extraction and Synthesis of Results
We first extracted and tabulated the following details for all included studies: reference information (authors and publication year); sample characteristics (sample size, age and sex descriptive data); operational definitions of a step (where reported); duration of treadmill bouts; number of bouts included; speed range (converted to meters per second [m/s] if not originally presented in these units); and use (yes/no) of video recording for directly observed step counts. Once tabulated, we calculated descriptive statistics (range, first quartile [Q1], and third quartile [Q3]) for study sample characteristics (sample size, percentage women, and mean age) and protocol details (bout duration, numbers of bout, and minimum and maximum speeds of walking and running). The calculation of Q1 and Q3 values provides an objective and empirically derived assessment of the sample characteristics and protocol details included in at least half of the included studies. The proportion of studies using a video recording was calculated, and the operational definitions of a step (if provided in the original text) were qualitatively compared and contrasted.
The analytical procedures that were reportedly used to assess device criterion validity (ie, agreement between device and directly observed step counts) were cataloged in terms of bias, precision, accuracy, and additional analytic procedures. Measures of bias (eg, Bland–Altman plots, MPE) were identified as any metric that reflected underestimation and overestimation of steps with respect to the difference between device- and hand-counted steps.15 Measures of precision (eg, standard deviation, coefficient of variation) were identified as those that estimated the degree of variability in differences between the device- and hand-counted steps. Accuracy measures (eg, MAPE, root mean square error) were defined as those that accounted for the overall performance of a step-counting device and thus reflected both bias and precision.15 Additional analytic procedures, in which device- and hand-counted steps were analyzed directly (eg, statistical tests for differences between device- and hand-counted steps and equivalence tests), were also identified. The frequencies and proportions of studies reporting measures of bias, precision, accuracy, or other analytical procedures were then determined. Other explanatory factors that were included in the original analyses (eg, participant waist circumference, treadmill incline) were also cataloged.
To aggregate speed- and wear location-specific MAPE values, the MAPE values reported in the relevant subset of articles were tabulated according to device make/model, device wear location, and treadmill walking speed. Any values derived from treadmill running bouts or those performed at grades other than 0% were excluded. For synthesizing results across studies, treadmill speeds were grouped into 0.2 m/s (0.5 mph) speed increments and separated by wear location. The weighted median, Q1, and Q3 MAPE values were then calculated across the devices worn at each wear location for each 0.2 m/s increment in speed (ie, stratified by wear location and treadmill speed), in order to properly illustrate any potential influences of wear location on device performance16 and/or reductions in step-count accuracy at slow walking speeds.4 These median, Q1, and Q3 values were calculated while weighting the MAPE values by study sample sizes using the “spatstat” package in R (version 3.6.1; R Foundation for Statistical Computing, Vienna, Austria). The median MAPE values were then used to determine speed- and wear location-specific summary errors, representing the accuracy of contemporary step-counting devices during treadmill walking. This same analysis was also conducted to summarize the studies’ MPE values.
Results
Search Results
The search strategy and a modified PRISMA flow chart documenting the search process are presented in Supplementary Material 1 (available online). The search string identified 174 articles in PubMed and 112 in SPORTDiscus, with 218 articles remaining after removing duplicates. After abstract screening, 74 articles were eligible for full-text review, 33 of which met the inclusion criteria. A review of these 33 included the articles’ reference sections and identified an additional 162 potentially eligible articles, 44 of which met the inclusion criteria. In total, 380 articles were screened, and 77 studies5,10,11,17–90 were ultimately included in the catalog of validation study methodologies.
Catalog of Study Methodologies
Supplementary Material 2 (available online) provides the sample characteristics, treadmill protocol descriptions, and analytical procedures for each of the 77 studies cataloged. Any apparent inconsistencies in reporting of the table values (eg, age ranges vs means, number of decimal points, etc) reflect discrepancies in reporting conventions between the original articles. In addition, Table 1 presents summary values (ranges, Q1, and Q3) for the sample characteristics and protocol details of all the studies cataloged. To limit excessive citations, and because all of the study details can be found in Supplementary Material 2 (available online), exhaustive references are not always provided in the sections below.
Table 1.
Summary of the Sample Characteristics and Protocol Details of the 77 Validation Studies
| Sample characteristics | Protocol details | ||||
|---|---|---|---|---|---|
| Characteristic | Range | Q1; Q3 | Detail | Range | Q1; Q3 |
| Sample size, n | 9–259 | 19; 42 | Number of bouts | 1–10 | 3; 5 |
| Female, % | 0–100 | 49; 59 | Bout duration, min | 1–20 | 3; 6 |
| Slowest walking speedb, m/s | 0.1–1.5 | 0.7; 0.9 | |||
| Mean agea, y | 8.3–67.5 | 22.6; 32.3 | Fastest walking speedb,c, m/s | 0.8–2.0 | 1.5; 1.8 |
Abbreviations: Q1, first quartile; Q3, third quartile.
Only considers studies reporting mean age.
Only considers studies where speed was set consistently for all participants.
Only consider studies where participants could not transition to running.
Sample Characteristics.
Although sample sizes ranged from 9 to 259 participants, only 4% (n = 3) of the studies35,70,75 included ≥100 participants. While 6 studies did not report the proportion of their sample that was female, the majority (52% [n = 37]) of the remaining studies were approximately evenly distributed for sex (ie, 54% [5%] female). Information pertaining to the participants’ age was not included in 3 studies,65,76,90 and all but 333,52,70 of those remaining reported the mean age of their sample. The majority (61% [n = 43]) of these studies had a sample with a mean age of 27 (5) years (Table 1). Only one study45 reported a mean age of >55 years (mean age = 67.5 y), and 9% (n = 7) of the studies reported including children <18 years of age.
Protocol Details.
A large proportion (78% [n = 60]) of the included validation studies had treadmill protocols consisting of 3 to 5 bouts. Two studies did not report bout duration,32,90 and bout durations were not consistent across participants (eg, set randomly or relative to total steps taken) in 8 studies. Of the remaining study protocols, most (70% [n = 47]) implemented bout durations of 3 to 6 minutes (Table 1). Treadmill walking speeds were not consistent across all participants (ie, set individually relative to self-selected walking speeds or elicited cadences) in 17% (n = 13) of the studies, and one study protocol consisted of only running bouts.56 Of the remaining 63 protocols, about 3 quarters (73% [n = 46]) had slowest walking speeds that were 0.8 (0.1) m/s (1.8 [0.2] mph). Discounting protocols that allowed participants to transition to running (n = 7), a similar proportion (79% [n = 44]) had fastest walking speeds that were 1.6 (0.2) m/s (3.6 [0.5] mph). In addition, of the 56 studies using speeds consistent across all participants without allowing a transition to running, 41% (n = 23) employed the same range of walking speeds: 0.9 to 1.8 m/s (2.0–4.0 mph). Fewer than half (42% [n = 32]) of the study protocols included video recording of the participants’ feet for counting and/or verifying directly observed steps.
Operational definitions of a step were provided in 6% (n = 5) of the studies.42,50,54,60,74 For contextual purposes, we have included other relevant or common definitions, including those provided by the CTA,9 Merriam-Webster Dictionary,91 and Oxford English Dictionary.92 These 8-step definitions are reported in Supplementary Material 3 (available online). Seven definitions9,50,54,60,74,91,92 included the criteria that the foot must be completely lifted off the ground, whereas the remaining definition42 would recognize the sliding of a foot as a step. Four50,54,60,74 state that the entire foot (toe and heel) must recontact the ground after being lifted to be considered a step. One42 step definition stated that steps were counted “every time the right heel made contact with the ground,” thus requiring a heel strike. This definition is also congruent with the biomechanical definition of a stride (full gait cycle) rather than a step.93 Three definitions included a requirement for movement: 2 similarly required that the foot be put “down in another spot”9 or a “fresh location,”92 whereas the third91 specified that “an advance or movement” must be made by the lifting and planting of the foot, which may imply whole-body movement.
Analytical Procedures.
The numbers and percentages of studies that reported a measure of bias, precision, accuracy, and/or used additional analytic procedures are provided in Table 2. Analytical procedures are also reported individually for the studies included herein in Supplementary Material 2 (available online).
Table 2.
Validation Studies That Reported a Measure of Bias, Precision, and/or Accuracy, Included None or Combinations of These Measures, and/or Used Additional Analytical Approaches
| Measures | Combinations of measures | Additional approaches | |||
|---|---|---|---|---|---|
| Bias | 68 (88) | 0 of 3 | 3 (4) | Any additional approach | 27 (35) |
| Precision | 52 (68) | 1 of 3 | 17 (22) | Differences in means/medians | 24 (31) |
| 2 of 3 | 51 (66) | Equivalence testing | 2(3) | ||
| Accuracy | 17 (22) | 3 of 3 | 6(8) | Overall error volume | 2 (3) |
Note: Values presented as n (percentage of studies).
Bias:
Almost all (88% [n = 68]) of the 77 included studies presented a measure of bias. Bias was most commonly reported as Bland–Altman or Modified Bland–Altman plots (44% [n = 30]) and MPE with respect to device- and hand-counted steps (43% [n = 29]), followed by mean differences between device- and hand-counted steps (34% [n = 23]), the percentage of device-detected steps relative to hand-counted steps (31% [n = 21]), and the proportion of devices that displayed underestimation and overestimation (4% [n = 3]). A subset of these studies further investigated the potential effects of device factors on bias measures, including device make/model (25% [n = 17]), device setting (1% [n = 1]), wear location (10% [n = 7]), device tilt angle (4% [n = 3]), treadmill walking speed (31% [n = 21]), and participant factors—age (6% [n = 4]), sex (3% [n = 2]), health condition (1% [n = 1]), height (1% [n = 1)), weight (1% [n = 1]), waist circumference (1% [n = 1]), and body mass index (BMI; 13% [n = 9]).
Precision:
Over half of the studies (68% [n = 52]) reported a measure of precision for device-detected steps. Precision was reported as the SD of differences between device step counts and directly observed step counts across a majority (71% [n = 37]) of these studies, while another substantial proportion (46% [n = 24]) calculated the observed linear and/or monotonic relationship between device- and hand-counted steps. Precision was also reported as the standard error of measurement (8% [n = 4]), 95% confidence interval for the mean difference in device-detected steps (8% [n = 4]), coefficient of variation (4% [n = 2]), variance (2% [n = 1]), and loss of precision (2% [n = 1]). A small number of these studies investigated the potential effects of treadmill walking speed (6% [n = 3]), device make/model (4% [n = 2]), and wear location (2% [n = 1]) on precision.
Accuracy:
Slightly less than a quarter (22% [n = 17) of the included studies reported a measure of accuracy. The majority of the studies (88% [n = 15]) that did provide an accuracy measure reported MAPE, while 12% (n = 2) presented accuracy as the root mean squared percentage error, and 6% (n = 1) reported the median (not the mean) absolute percentage error. A portion of these studies explored the influence of device and protocol factors on accuracy, including device wear location (12% [n = 2]), device make/model (6% [n = 1]), device tilt angle (6% [n = 1]), treadmill incline (6% [n = 1]), treadmill walking speed (6% [n = 1]), and interdevice agreement with respect to device precision (6% [n = 1]), as well as participant factors, including sex (18% [n = 3]), height (6% [n = 1]), and leg length (6% [n = 1]).
Additional analytic procedures:
Beyond (or in lieu of) calculating and reporting measures of bias, precision, and accuracy, fewer than half of the studies (35% [n = 27]) directly analyzed device- and hand-counted steps. Most (89% [n = 24]) of these studies reported differences in mean/median values for device- and hand-counted steps. In addition, 7% (n = 2) of these studies reported the statistical similarity (eg, equivalence tests) in device- and hand-counted steps, and 7% (n = 2) reported the overall volume of miscounted device-determined steps relative to hand-counted steps. As an extension of these analyses, studies also considered whether the following factors influenced device-determined step counts: treadmill walking speed (21% [n = 7]), sex (6% [n = 2]), device make/model (6% [n = 2]), treadmill grade (6% [n = 2]), device wear location (3% [n = 1]), footwear (3% [n = 1]), and BMI (3% [n = 1]).
Speed- and Wear Location–Specific MAPE Values
Relevant Subset of Studies and Available Data.
Of the 15 articles identified as correctly calculating MAPE, 9 initially could not be included in a calculated summary because the exact MAPE values either were not provided (eg, only plotted in figures)22,27,37,52,62,88 or were not specific to each walking speed.56,65,74 We contacted those authors who did not report exact MAPE values and were able to obtain eligible results from 4.22,52,62,88 Additional MAPE values were also obtained through communications with the authors of a publication18 that presented the median absolute percentage error values. Thus, speed- and wear location-specific MAPE values were available from 11 articles.18,20,22,52,57,62,66,68,82,88,90 One article68 included in this count reported calculating “mean percentage error … using individual error values regardless of directionality,” which we interpreted to be a calculation of MAPE. Relevant information for each of these studies (sample size, number of person bouts [sample size × number of bouts per participant], device makes/models, and treadmill walking speeds) is provided in Supplementary Material 4 (available online). In total, the 11 studies included 335 participants and 1577 person bouts, testing 28 different device makes/models worn on either the wrist, waist, thigh, upper arm, or ankle. Nine device makes/models worn at the wrist were tested at treadmill walking speeds of 0.4 to 1.8 m/s (1.0–4.0 mph) between 2 studies.20,52 A total of 17 waist-worn device makes/models were tested across 6 studies,18,20,22,66,68,90 also at speeds ranging from 0.4 to 1.8 m/s (1.0–4.0 mph). Only one thigh-worn device make/model was tested (activPAL, PAL Technologies Ltd, Glasgow, Scotland, UK), but this same device was tested in 3 studies57,68,82 and at the speeds of 0.5 to 1.8 m/s (1.0–4.0 mph). Two device makes/models worn on the upper arm were tested across 2 studies,20,66 at the speeds of 0.9 to 1.8 m/s (2.0–4.0 mph), and one study68 tested a single ankle–worn device at 0.6 to 1.4 m/s (1.3–3.1 mph).
The MAPE values reported by these studies are depicted in Tukey boxplots in Figure 1, and the weighted median, Q1, and Q3 MAPE values are provided in Table 3, along with the numbers of person bouts and individually reported MAPE values for devices tested at each speed and wear location. In alignment with the scope of this review, the MAPE values presented in Figure 1, and Table 3 were stratified by speed and wear location to summarize the results across the studies and offer speed- and wear location-specific summary MAPE values. We acknowledge that accuracy specific to the device make/model and technology contributes to the high degree of variability in the MAPE values. Therefore, average MAPE values (weighted by sample size) for individual device makes/models are provided in Table 4.
Figure 1 —
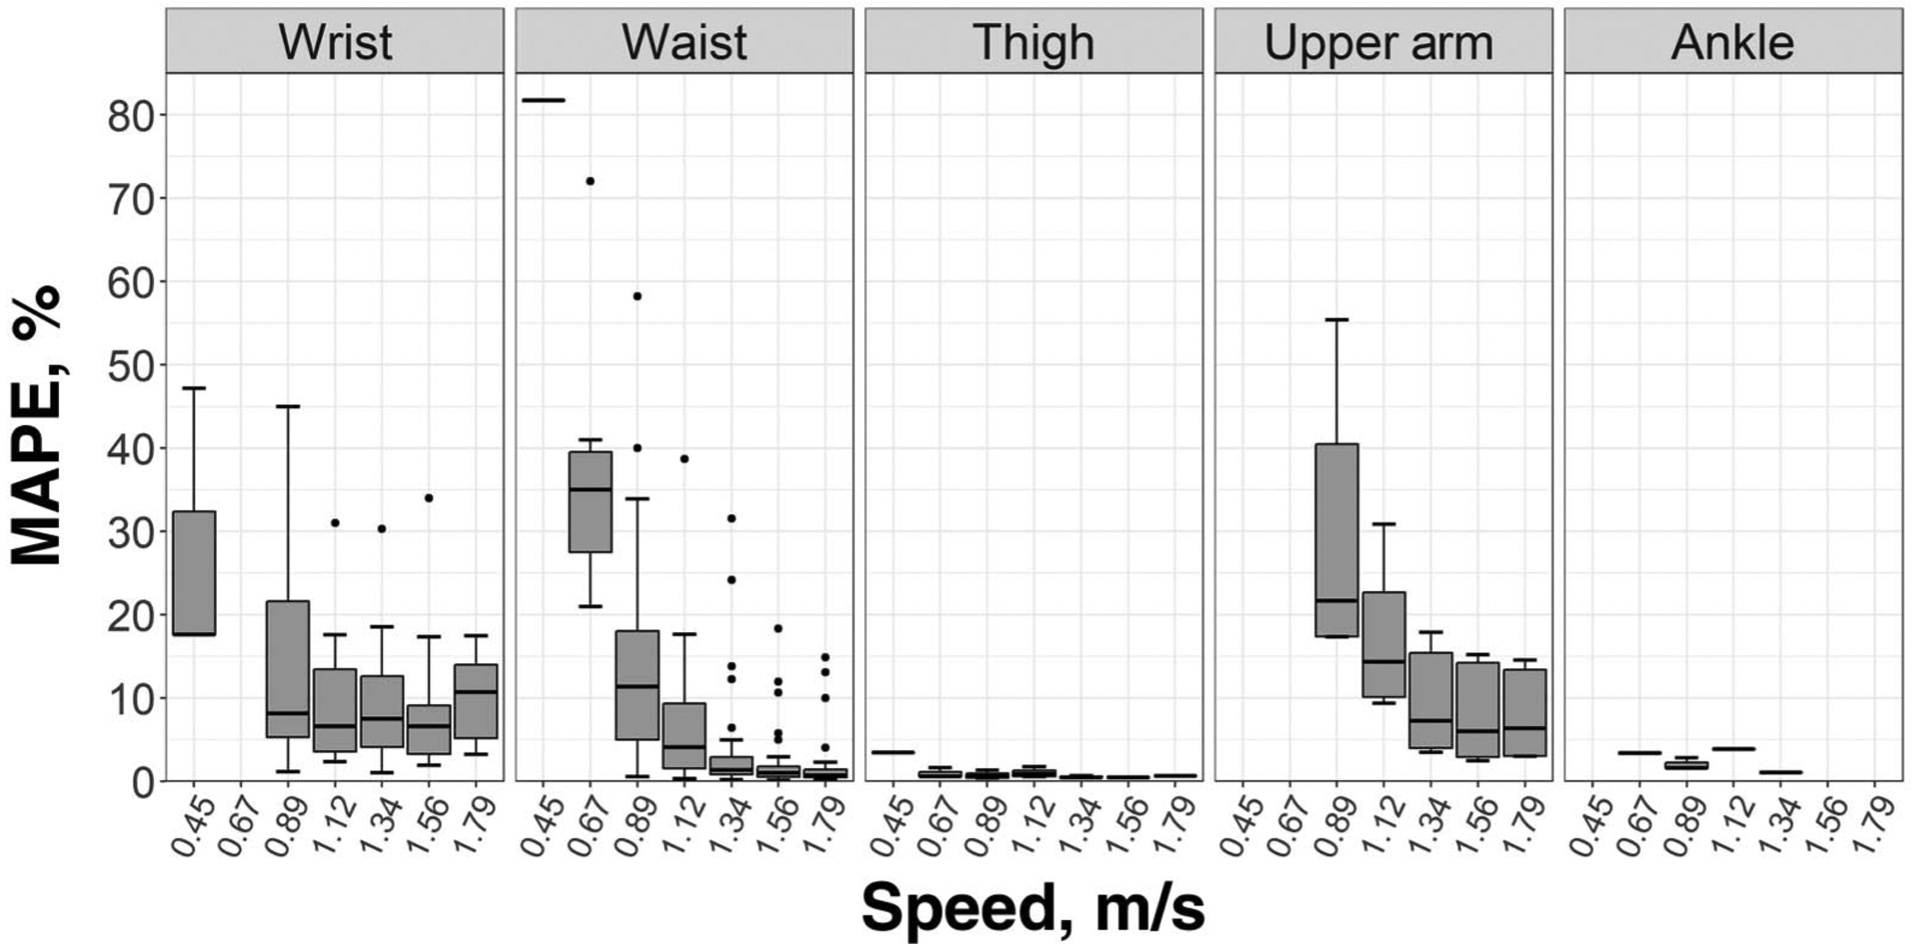
Tukey boxplots of MAPE values reported by treadmill-based validation studies of step-counting devices, with quantiles weighted by sample size. MAPE indicates mean absolute percentage error.
Table 3.
Summary of MAPE Values Reported by Treadmill-Based Validation Studies of Step-Counting Devices Used to Inform Speed- and Wear Location-Specific Summary Error Values
| Wear location and Valuea | 0.45 m/s (1.0 mph) | 0.67 m/s (1.5 mph) | 0.89 m/s (2.0 mph) | 1.12 m/s (2.5 mph) | 1.34 m/s (3.0 mph) | 1.56 m/s (3.5 mph) | 1.79 m/s (4.0 mph) |
|---|---|---|---|---|---|---|---|
| Wrist | |||||||
| M | 17.6 | - | 8.2 | 6.7 | 7.5 | 6.6 | 10.7 |
| Q1; Q3 | 17.6; 32.4 | 5.3; 21.6 | 3.6; 13.5 | 4.2; 12.6 | 3.3; 9.1 | 5.2; 14 | |
| Sampleb | 20 (2) | 0 | 55 (9) | 35 (7) | 55 (9) | 55 (9) | 35 (7) |
| Waist | |||||||
| M | 81.7a | 35.0 | 11.4 | 4.1 | 1.4 | 1.0 | 0.8 |
| Q1; Q3 | 27.5; 39.5 | 5.0; 18.1 | 1.6; 9.4 | 0.9; 3.0 | 0.5; 1.8 | 0.5; 1.5 | |
| Sampleb | 20 (1) | 60 (9) | 264 (33) | 244 (31) | 273 (34) | 224 (31) | 184 (22) |
| Thigh | |||||||
| M | 3.5a | 0.6 | 0.6 | 0.9 | 0.5 | 0.5a | 0.7a |
| Q1; Q3 | 0.6; 1.1 | 0.4; 1.0 | 0.6; 1.3 | 0.5; 0.6 | |||
| Sampleb | 42 (1) | 82 (2) | 102 (4) | 60 (2) | 102 (3) | 20 (1) | 20(1) |
| Upper arm | |||||||
| M | - | - | 21.7 | 14.3 | 7.3 | 6.0 | 6.4 |
| Q1; Q3 | 17.4; 40.5 | 10.2; 22.7 | 4.0; 15.4 | 3.0; 14.2 | 3.1; 13.4 | ||
| Sampleb | 0 | 0 | 83 (4) | 83 (4) | 83 (4) | 83 (4) | 83 (4) |
| Ankle | |||||||
| M | - | 3.4a | 1.6 | 3.9a | 1.1a | - | - |
| Q1; Q3 | 1.6; 2.2 | ||||||
| Sampleb | 0 | 40 (1) | 40 (2) | 40(1) | 40 (1) | 0 | 0 |
Abbreviations: M, median; MAPE, mean absolute percentage error; Q1, first quartile; Q3, third quartile. Note: Values of M, Q1, and Q3 are weighted by study sample size, and their units are percentage (%).
For speed-wear location combinations with only one reported value, only that value is presented.
Samples are presented as the number of person bouts (number of reported values). Person bouts represent (sample size) × (bouts per participant testing a device at respective speed and wear location) summed across all studies. Reported values represent total numbers of MAPE values aggregated from individual studies for a device at a respective speed and wear location.
Table 4.
Summary of MAPE Values Reported by Treadmill-Based Validation Studies of Step-Counting Devices by Device Make/Model
| Device make/model | 0.45 m/s (1.0 mph) | 0.67 m/s (1.5 mph) | 0.89 m/s (2.0 mph) | 1.12 m/s (2.5 mph) | 1.34 m/s (3.0 mph) | 1.56 m/s (3.5 mph) | 1.79 m/s (4.0 mph) |
|---|---|---|---|---|---|---|---|
| Wrist-worn devices | |||||||
| ActiGraph GT3X+ | 47.2a | - | 21.8a | - | 30.3a | 34.0a | - |
| Basis B1 Band | - | - | 8.1a | 7.1a | 7.9a | 3.7a | 5.8a |
| Fitbit Flex | - | - | 8.2a | 6.2a | 7.1a | 8.2a | 11.4a |
| Garmin Vivofit | - | - | 3.9a | 2.4a | 4.9a | 6.9a | 13.6a |
| Garmin Vivofit 2 | 17.6a | - | 1.2a | - | 1.1a | 2.0a | - |
| Jawbone UP24 | - | - | 7.0a | 4.0a | 3.5a | 2.9a | 3.3a |
| Misfit Shine | - | - | 19.3a | 12.1a | 9.1a | 6.3a | 10.0a |
| Nike+ FuelBand SE | - | - | 45.0a | 31.0a | 18.6a | 17.4a | 17.5a |
| Polar Loop | - | - | 23.8a | 17.6a | 15.7a | 9.9a | 15.2a |
| Waist-worn devices (by internal mechanism) | |||||||
| Piezoelectric | |||||||
| ActiGraph 7164 | - | - | 4.0 (1.1) | 0.8 (0.2) | 0.3 (0) | 0.5 (0.1) | 0.5 (0.4) |
| ActiGraph GT3X+ | 81.7a | - | 23.8a | - | 1.2a | 1.9a | - |
| Fitbit One | - | - | 0.8 (0.2) | 0.4 (0) | 0.4 (0.1) | 0.3 (0.1) | 0.6 (0.3) |
| FitBit Zip | - | - | 0.6a | 0.6a | 0.5a | 0.4a | 0.9a |
| New Lifestyles | - | - | 8.7 (2.7) | 3.0 (1.3) | 0.8 (0.2) | 0.5 (0) | 0.6 (0.2) |
| NL-1000 | |||||||
| Omron HJ-112 | - | - | 3.2a | 1.8a | 2.7a | 2.7a | 2.1a |
| Withings Pulse | - | - | 2.4a | 1.1a | 1.1a | 0.7a | 1.5a |
| Spring levered | |||||||
| Kellogg Special K | - | - | - | - | 24.2a | - | - |
| Step Counter | |||||||
| Omron HJ-105 | - | - | 23.4a | 10.5a | 6.5a | 5.8a | 4.1a |
| Sportline 330 | - | - | 58.2a | 38.7a | 31.6a | 18.4a | 14.9a |
| Sun TrekLINQ | - | 56.5 (15.7) | 29.0 (11.1) | 8.5 (5.6) | 3.0 (2.0) | 4.0 (1.0) | - |
| Walk4Life 2505 | - | 30.5 (4.6) | 14.5 (2.5) | 5.5 (3.5) | 1.5 (0.5) | 1.0 (0) | - |
| Walk4Life Pro | - | - | 13.2 (4.9) | 6.6 (2.5) | 1.9 (0.8) | 1.4 (0.4) | 0.5 (0.1) |
| Yamax DigiWalker | - | 30.0 (1.0) | 17.5 (7.9) | 3.7 (0.6) | 1.4 (1.1) | 0.8 (0.3) | 0.2a |
| SW-200 | |||||||
| Yamax DigiWalker | - | 40.4a | 11.1 (5.3) | 6.4a | 3.7a | - | - |
| SW-401 | |||||||
| Yamax DigiWalker | - | 29.0 (8.1) | 19.0 (5.5) | 9.3 (3.7) | 2.9 (1.2) | 1.5 (0.3) | 0.8 (0.1) |
| SW-701 | |||||||
| MEMS | |||||||
| Samsung Galaxy S4 GT-I9500 | - | - | 25.9 (7.7) | 13.4 (5.4) | 10.2 (4.1) | 8.4 (4.2) | 8.5 (4.6) |
| Thigh-worn devices | |||||||
| activPAL | 3.5a | 1.1 (0.6) | 0.9 (0.4) | 1.4 (0.6) | 0.6 (0.1) | 0.5a | 0.7a |
| Upper-arm-worn devices | |||||||
| Samsung Galaxy S4 GT-I9500 | - | - | 37.4 (15.6) | 22 (7.3) | 13 (5.1) | 11.4 (4.7) | 10.3 (5.2) |
| SenseWear Armband Mini | - | - | 18.9a | 9.4a | 3.5a | 2.5a | 5.3a |
| Ankle-worn devices | |||||||
| PALlite | - | 3.4a | 2.2 (0.7) | 3.9a | 1.1a | - | - |
Abbreviations: MAPE, mean absolute percentage error; MEMS, microelectromechanical systems. Note: All values are presented as mean (SD)% and weighted by sample size.
Only one reported value (ie, device tested in only one study at respective speed).
Synthesis of Reported MAPE Values.
The median MAPE values for wrist-worn devices ranged from 6.6% to 17.6% at all speeds at which they were tested (0.4–1.8 m/s [1.0–4.0 mph]; Table 3). The highest MAPE values for wrist-worn devices at each speed were consistently obtained from the Polar Loop (Polar Electro Inc, Bethpage, NY), Nike+ Fuelband SE (Nike Inc, Beaverton, OR), and ActiGraph GT3X+ (ActiGraph LLC, Pensacola, FL) (Table 4).
For waist-worn devices at walking speeds of 1.1 to 1.8 m/s (2.5–4.0 mph), the median MAPE values ranged from 0.8% to 4.1% and were lower than those for wrist-worn devices (Table 3). Waist-worn devices had a greater median MAPE value than wrist-worn devices (11.4% vs 8.2%, respectively), at a slightly slower speed (0.9 m/s [2.0 mph]). However, the MAPE values reported for several waist-worn device make/models (ActiGraph 7164 [ActiGraph LLC], Omron HJ-112 [Omron Corp, Kyoto City, Kyoto, Japan], Fitbit One [Fitbit Inc, San Francisco, CA], Fitbit Zip [Fitbit Inc, San Francisco, CA], Withings Pulse [Withings, Issy-les-Moulineaux, France]) were <5% at this walking speed, through 1.8 m/s (4.0 mph; Table 4). Three studies22,52,68 tested waist-worn devices at an even slower speed (0.4–0.7 m/s [1.0–1.5 mph]), where the median MAPE values were ≥35.0%. The highest MAPE values associated with waist-worn devices were obtained from the Samsung Galaxy S4 GT-I9500 (Samsung Electronics Co, Ltd, Seoul, South Korea) smartphone device (with the 3 apps it used), Kellogg’s Special K Step Counter (K pedometers; manufactured for Kellogg Canada by Sasco Inc, Raleigh, NC), Omron HJ-105, Sun TrekLINQ (Sun Company Inc, Wheat Ridge, CO) and Sportline 330 (Sportline Inc, Elmsford, NY), each of which had MAPE values that were consistently greater than the Q3 MAPE value for the waist wear location at the respective speed (Table 4). Except for the Samsung Galaxy S4 GT-I9500, the waist-worn devices with the highest MAPE values all used a spring-levered mechanism. Therefore, we have also provided results for waist-worn devices stratified by internal mechanism (piezoelectric vs spring levered) in Supplementary Material 5 (available online). Spring-levered devices were not worn at any other wear location.
The only thigh-worn device tested (activPAL) was used in 3 studies.57,68,82 The activPAL had better accuracy than the devices worn on the waist and wrist at each comparable speed, with reported MAPEs remaining ≤3.5% across all speeds (0.5–1.8 m/s [1.0–4.0 mph]).
Two upper arm–worn device makes/models were tested between 2 studies,20,66 each at speeds of 0.9 to 1.8 m/s (2.0–4.0 mph), and with an overall MAPE range of 2.5% to 55.4%. However, the MAPE values reported for the upper arm–worn Samsung Galaxy S4 GT-I9500 were greater at each speed by 2-fold or more, compared with those for the SenseWear Armband Mini (BodyMedia, Pittsburgh, PA) (Table 4). Only one study68 tested a single ankle–worn device (PALlite, PAL Technologies Ltd, Glasgow, Scotland) at speeds of 0.6 to 1.4 m/s (1.3–3.4 mph), which demonstrated MAPE values of 1.1% to 3.9% (Table 3).
Speed- and Wear Location-Specific MPE Values
Speed- and wear location-specific MPE values (a measure of bias) were available from 15 studies. However, we have chosen to focus on MPE herein for the reasons previously discussed. In brief, MPE values were available from 15 studies.11,23,25,28,34,36,37,49,53,55,57,67,76,82,89 At treadmill speeds of 1.1 to 1.8 m/s (2.5–4.0 mph), the weighted median MPE values indicated that wrist- and waist-worn devices underestimated steps by 10% to 1% and 4% to 0%, respectively, while those for thigh-worn devices were ±1%. Limited data were available for devices worn on the foot or ankle. Additional results regarding the screening of eligible studies, weighted median MPE values by wear location, and weighted mean MPE values by device make/model are provided in Supplementary Material 6 (available online).
Discussion
The purpose of this scoping review was to summarize the scientific literature that has focused on the validation of step-counting wearable technologies during treadmill ambulation. The divergent methodologies documented across the included articles (Supplementary Material 2 [available online]) substantiate the need to harmonize the protocols, analyses, and data interpretation methods used in treadmill-based validation studies of step-counting wearable technologies. As a starting point, we were able to identify gaps in the current body of knowledge and common practices employed by researchers: most had samples averaging 54% (5%) female and 27 (5) years of age, treadmill protocols consisting of 3 to 5 bouts at speeds of 0.8 (0.1) to 1.6 (0.2) m/s, and reported measures of bias. Furthermore, aggregating the study results provided preliminary summary MAPE values that represent the accuracy of contemporary step-counting devices across walking speeds and wear locations (Table 3). Specifically, during treadmill walking at the same speeds for which the CTA provided their <10% MAPE requirement for acceptable device error (1.1–1.8 m/s [2.5–4.0 mph]), our empirically informed findings support the following wear location-specific summary MAPE values: 7% to 11% for the wrist, 1% to 4% for the waist, and ≤1% for the thigh. Further research is needed to strengthen and refine these ranges and establish summary MAPE values for ankle- and upper arm–worn step-counting devices.
Identification of Common Practices
The samples included in a majority of studies consisted of ~20 to 40 participants and were somewhat sex-balanced in their design (Table 1). A study’s research aims may also be a consideration for sample size selection, such as the statistical power required to explore the impact of participant factors (eg, age, sex, BMI, or health status) on device performance. Treadmill protocols tended to include 3 to 5 bouts that were ~5 minutes in duration (3–6 min). In regard to the range of treadmill speeds used, the majority of studies with speeds consistently applied across participants included walking bouts at least as slow as 0.9 m/s (89%; median [and Q3] slowest walking speed) and at least as fast as 1.8 m/s (60%; median [and Q3] fastest walking speed). In addition, 0.9 to 1.8 m/s (2.0–4.0 mph) was the most common range of walking speeds employed within each protocol (used in 41% of studies with speeds consistently applied across all participants) and is inclusive of all the speeds implemented in 55% of these studies. The inclusion of this specific range of walking speeds would therefore enable between-study, speed-specific comparisons with a majority of validation studies conducted to date. This range also includes the normal walking speeds of the vast majority of healthy adults.93 Still, we acknowledge that the specific research intent and application (eg, population of concern) may necessitate the inclusion of slower or faster walking speeds and/or running bouts. In addition, at least 1 bout per 0.2 to 0.3 m/s (~0.5 mph) speed increment was included in 86% of the studies with speeds consistently applied across all participants and at least 2 bouts. This suggests that the selected range of speeds may help to inform the appropriate number of bouts that a protocol should include (eg, a greater number of bouts when covering a wider range of speeds). Treadmill walking speeds were set individually (ie, relative to participants’ self-selected walking speeds or elicited cadences) in 17% of the studies included. As observed herein, the use of such protocols hinders the ability to make speed-specific evaluations and comparisons of device accuracy, but may still reflect other valid research aims.
All identified studies used a hand tally counter to obtain the criterion measure of directly observed steps. High agreement (intraclass correlations >.96) between hand-counted step counts of 2 observers has been reported previously.22,36,38 Video recording participants’ feet during the treadmill protocol was reported in fewer than half (42%) of the studies. Although this practice does not appear to be widely adopted, video recording enables directly observed criterion step counts to be verified as needed. Maintaining a real-time count of steps may also be advantageous in preventing data loss in the event of video recorder malfunction.
We documented substantial inconsistencies in the analytical procedures used to evaluate the validity of devices. For example, although bias was reported in the vast majority (88%) of studies, the most commonly reported measures of bias (MPE and Bland-Altman/Modified Bland-Altman plots) were each included in only ~45% of studies. Of the 77 included articles, comprehensive validation metric reporting (ie, providing measures of bias, precision, and accuracy) was present in only 8% of the studies (Table 2). We suggest that researchers consistently report measures of device bias, precision, and accuracy to yield more comprehensive evaluations of device step-counting performance. Moreover, to further facilitate comparisons of device performance across studies, we suggest that researchers consider scaled measures of bias (eg, MPE), precision (eg, coefficient of variation), and accuracy (eg, MAPE),15 in addition to the corresponding unscaled metric.
This review provides an initial advancement toward harmonizing the validation of step-counting wearable technologies by identifying the prevailing methodologies used in treadmill-based validation studies. These common practices reflect the shared wisdom of researchers who have published in the field. Further research and deliberation by experts using these devices for research and practice is necessary to evaluate and build upon these methodologies and, ultimately, establish standard best practices for validating step-counting devices. Still, this initial effort to catalog the methods previously employed sheds light on the samples, protocols, and analytical procedures currently used in the literature and establishes a platform of empirical findings for the future creation of best practice recommendations.
Operational Definitions of a Step
Harmonious validation of step-counting wearable technologies requires the use of a common criterion measure (ie, directly observed steps). The use of this criterion measure further requires a definition of a step that is both standardized and observable. As Bassett et al94 described previously, several definitions of a step have been proposed to reflect the anticipated natural variations in step execution that might occur under free-living conditions. Although the studies assembled herein were all treadmill based (and not free living), we still identified a range of nuanced definitions of a step (Supplementary Material 3 [available online]). Considering the assembled definitions, we suggest a standardized operational definition of a step for specific use in treadmill-based device validation purposes: a foot strike following the complete lifting of that foot from the surface of the treadmill belt. Although previous publications have included additional criteria for the occurrence of a step (eg, requiring movement of the foot or body, a heel strike, or a goal of locomotion), this simple definition could be used for operationally defining observed steps taken in the context of treadmill walking. Defining a step in the free-living setting appears to be much more nuanced94 and is beyond the scope of treadmill-based validation.
The CTA Standard
The CTA Standard provides guidelines for the protocols, analyses, and interpretations of the treadmill-based validation of step-counting wearable technologies,9 but as we indicate above, the empirical basis for these guidelines is not clear. Regardless, a post hoc comparison showed that the CTA Standard’s guidelines for participant selection (ie, including ≥20 ostensibly healthy participants) were met by most (70% [n = 54]) of the studies included herein. However, fewer studies met the protocol-related CTA guidelines: 5-minute bout durations were reported in 29% (n = 22) of the included studies, 6% (n = 5) implemented walking speeds that were consistent across the participants and within the CTA-recommended range (1.1–1.8 m/s [2.5–4.0 mph]), running bouts at 2.2 to 5.4 m/s (5.0–12.0 mph) were included in 16% (n = 12), video recording was used in 42% (n = 32), and MAPE was calculated with the specified formula (Equation 1) in 19% (n = 15).
These findings reveal discrepancies between the guidelines provided by the CTA for the treadmill-based validation of step-counting wearable technologies and the common practices employed by researchers. It bears mentioning that many of the studies included in this review were published prior to the release of the 2016 CTA Standard. The CTA Standard was also developed with commercial manufacturers’ interests in mind and, thus, may not be directly relevant to research needs. For example, the CTA Standard ambiguously states that participants should be “representative across body types” and in “good health,” whereas researchers may aim to evaluate the validity of devices in specific populations, such as obese individuals or those living with a disability or chronic disease. In addition, the CTA Standard’s guideline that requires testing of step-counting devices at both walking and running speeds does not accommodate some researchers’ need to tailor their protocol to their specific population of interest and/or research question. Diversity of participants’ characteristics may not be as relevant to manufacturers of commercial devices used in the general population, but can be a central concern for researchers working with special populations.
When determining whether step-counting devices meet their acceptable error requirement (a MAPE ≤10%), the CTA Standard specifies that device accuracy be analyzed separately for walking and running but averaged across participants and speeds within each locomotor mode. These guidelines do not allow for examining potentially relevant factors like speed, BMI, and chronic disease status.4,5 This specific MAPE requirement is also not supported with any rationale or empirical evidence anywhere in their documents. Moreover, it is notably greater than the median MAPE values (≤4%) observed for waist- and thigh-worn devices at the CTA-recommended walking speeds and the MAPE values reported for many device makes/models (Table 4). Thus, when determining whether a step-counting wearable technology performs comparably to (or better than) those that currently exist, researchers and device manufacturers may need to employ an acceptable error requirement that is more stringent than a MAPE ≤10%.
Interpretation of Device Accuracy
Aggregating the results of validation studies is a logical step toward establishing empirically based summary MAPE values that represent the accuracy of contemporary step-counting wearable technologies during treadmill walking. Although the values presented for this purpose herein are preliminary, device manufacturers and researchers may choose to consider or refine these summary MAPE values when determining whether a device meets or improves upon the performance of other technologies. Specifically, during treadmill walking at speeds of 1.1 to 1.8 m/s (2.5–4.0 mph), the current review observed the following wear location-specific median values of MAPE for step-counting wearable technologies: 7% to 11% for the wrist, 1% to 4% for the waist, and ≤1% for the thigh. To reiterate, all MAPE values included in this analysis were observed during treadmill walking at 0% grade. We have also provided results stratified by internal mechanism (piezoelectric vs spring-levered waist-worn devices) in Supplementary Material 5 (available online) and summarized the reported MPE values in Supplementary Material 6 (available online).
This range of walking speeds (1.1–1.8 m/s [2.5–4.0 mph]) is the same as that for which the CTA provided a guideline for acceptable device error. However, we included additional data available to inform summary MAPE values for slower speeds (Table 3). For example, at 0.9 m/s (2.0 mph), the accuracy of wrist-worn devices was similar to that reported at faster speeds (median MAPE = 8%), but the accuracy of waist-worn devices appeared to decrease (median MAPE = 11%). Still, several individual device makes/models worn on the waist are capable of attaining MAPE values <5% at this speed (Table 4). At even slower speeds (0.6–0.9 m/s [1.3–2.0 mph]), the thigh-worn activPAL continued to exhibit MAPE values of ~1%.
Limited data were available to inform the summary MAPE values for ankle- and upper arm–worn step-counting devices. The 2 upper arm–worn devices included (each tested in a single study) had speed-specific MAPE values that differed by over 2-fold (Table 4). Only one ankle-worn device was included in a single study. These data did not appear to be sufficient for establishing preliminarily summary error values for devices worn on the upper arm or ankle.
As mentioned previously, other validation studies have evaluated device step-count accuracy against a MAPE value of 5%, citing the rationale that errors below this level do not have “practical relevance.”10,11 A MAPE value of ≤3% during usual walking has also been used for ensuring the quality of pedometers manufactured under industrial standards in Japan.12 We considered the alternative approach of creating standards based on “practical relevance” (eg, measurement needs and/or health outcomes). However, we believe that this approach would require a degree of conjecture and generalization (eg, steps accumulated in 150 min, how much change in which health outcome to relate to) that would detract from any empirical basis. In addition, improving device accuracy beyond such a minimum requirement would still enable greater precision and/or reduced bias. Our suggested approach of evaluating devices against summary (ie, median) MAPE values (1) is empirically based; (2) creates a simple, transparent framework for continually improving step-counting technologies; and (3) includes considerations for factors influencing step-count accuracy (ie, treadmill walking speed and wear location). We believe that this framework will advance efforts to harmonize the data interpretation methods used for validating step-counting wearable technologies during treadmill walking. Future studies are needed to strengthen and/or refine these preliminary summary MAPE values and provide more data regarding device accuracy at speeds and wear locations.
Strengths, Limitations, and Future Directions
We are not aware of any other publications that have adopted a similar approach to reporting common practices used for validating step-counting devices or informing evidence-based summary MAPE values. This approach enabled us to evaluate and summarize a fractured body of literature that was littered with inconsistencies and punctuated with closeable knowledge gaps. The inclusion criteria used in our search strategy facilitated the identification and coherent synthesis of 77 validation studies (individually described in Supplementary Material 2 [available online]) published over the past 24 years. For comparison, a recent systematic review of general wearable technology performance included only 5 studies specifically examining step-counting performance.95 The larger range of studies we included allowed us to more precisely catalog the various points of divergence and convergence in study methodologies, thereby identifying opportunities to harmonize validation efforts.
This review was purposefully delimited to treadmill-based validation studies in a concerted effort to initially harmonize this common, controlled, and easily replicable activity for evaluating device performance. The findings reported herein therefore may not be applicable to the development of best practices and/or acceptable levels of accuracy for device validation during overground walking and in the free-living setting. We also chose to delimit our search to studies that employed a criterion of directly observed steps taken. Some well-known validation studies may appear conspicuously absent if they employed “research-grade” devices as an alternative near-criterion standard (ie, to establish convergent validity between devices). Similarly, with our focus on criterion validity, issues specific to intradevice and interdevice reliability are outside the scope of this review. Future efforts are needed to develop and harmonize best practices for examining these important components of step-counting device performance.
Device step count MAPE values were available from only 11 out of 77 studies. We chose (a priori) to focus on MAPE because relative measures of error enable more meaningful comparisons across studies, and calculation of the absolute error obviates the cancellation of differences when averaging underestimation and overestimation.13 Furthermore, the choice of an alternative error metric did not substantially increase the data available. Specifically, MPE was the second most commonly reported error metric (reported in 29 articles; Bland-Altman plots provided in 30 articles), but only 15 studies provided speed- and wear location-specific MPE values that could be used in analyses (reported in Supplementary Material 6 [available online]). Therefore, the fact that the MAPE (and MPE) values were only available from a limited number of studies stems from inconsistent/incomplete reporting in the literature. Finally, the MAPE values aggregated herein were all observed during level treadmill walking with ostensibly healthy participants. Step-counting devices may perform differently when walking on an incline or running, and certain participants’ characteristics (eg, BMI, pregnancy, and chronic disease status) are known to independently influence device accuracy.4,5 Therefore, the preliminary summary MAPE values reported herein may not be generalizable to inclined ambulation, running, or special populations.
This study has revealed several knowledge gaps in the literature. For example, few of the included treadmill-based validation studies had a sample with a mean age representative of older adults or children, explicitly reported including obese participants, or recruited participants with a health-related condition. In addition, only 12% (n = 9) of the studies included walking speeds <0.7 m/s (Q1 for slowest walking speed). Extremely frail older adults are categorized by normal walking speeds of 0.2 m/s or less,96 yet only 3% (n = 2) of the included studies included speeds this slow. Similarly, only 21% (n = 16) of the studies included running bouts. Future studies are needed to test step-counting wearable technologies and inform summary values representing their performance with diverse samples, at slower walking speeds, and during running.
Conclusions
In summary, this scoping review identified common practices in treadmill-based validation studies of step-counting wearable technologies. Despite divergent methodologies, these congruencies identified across study sample characteristics, protocol details, and analytical procedures reflect the shared wisdom of researchers who have published in the field. Furthermore, we have taken an empirical approach to proposing preliminary summary MAPE values that may be useful for evaluating the performance of step-counting wearable technologies relative to other contemporary devices. Moving forward, these common practices and summary speed- and wear location-specific MAPE values should be considered and further refined through more robustly designed studies. With input from additional experts in the field, these advancements will propel the field toward the harmonization of a treadmill-based validation of step-counting wearable technologies.
Supplementary Material
Acknowledgments
This work was supported by an award (5R01AG049024; the CADENCE-Adults Study) from the National Institutes of Health, National Institute on Aging. The funding agency had no role in the design of the study, the collection, analysis, or interpretation of data, or in the writing or decision to submit the article for publication.
Contributor Information
Christopher C. Moore, Department of Epidemiology, University of North Carolina at Chapel Hill, Chapel Hill, NC, USA.
Aston K. McCullough, Department of Music and Dance, University of Massachusetts Amherst, Amherst, MA, USA.
Elroy J. Aguiar, Department of Kinesiology, The University of Alabama, Tuscaloosa, AL, USA.
Scott W. Ducharme, Department of Kinesiology, California State University, Long Beach, Long Beach, CA, USA.
Catrine Tudor-Locke, College of Health and Human Services, University of North Carolina at Charlotte, Charlotte, NC, USA..
References
- 1.Hulteen RM, Smith JJ, Morgan PJ, et al. Global participation in sport and leisure-time physical activities: a systematic review and meta-analysis. Prev Med. 2017;95:14–25. doi: 10.1016/j.ypmed.2016.11.027 [DOI] [PubMed] [Google Scholar]
- 2.The State of Wearables Today—2018 Consumer Surve. Raleigh, NC: Valencell Inc; 2018. [Google Scholar]
- 3.2018 Physical Activity Guidelines Advisory Committee. 2018 Physical Activity Guidelines Advisory Committee Scientific Report. Washington, DC: U.S. Department of Health and Human Services; 2018. [Google Scholar]
- 4.Kooiman TJ, Dontje ML, Sprenger SR, Krijnen WP, van der Schans CP, de Groot M. Reliability and validity of ten consumer activity trackers. BMC Sports Sci Med Rehabil. 2015;7(1):24. doi: 10.1186/s13102-015-0018-5 [DOI] [PMC free article] [PubMed] [Google Scholar]
- 5.Crouter SE, Schneider PL, Karabulut M, Bassett DR Jr. Validity of 10 electronic pedometers for measuring steps, distance, and energy cost. Med Sci Sports Exerc. 2003;35(8):1455–1460. doi: 10.1249/01.MSS.0000078932.61440.A2 [DOI] [PubMed] [Google Scholar]
- 6.Toth LP, Park S, Springer CM, Feyerabend MD, Steeves JA, Bassett DR. Video-recorded validation of wearable step counters under free-living conditions. Med Sci Sports Exerc. 2018;50(6):1315–1322. doi: 10.1249/MSS.0000000000001569 [DOI] [PubMed] [Google Scholar]
- 7.Wijndaele K, Westgate K, Stephens SK, et al. Utilization and harmonization of adult accelerometry data: review and expert consensus. Med Sci Sports Exerc. 2015;47(10):2129–2139. doi: 10.1249/MSS.0000000000000661 [DOI] [PMC free article] [PubMed] [Google Scholar]
- 8.Peake JM, Kerr G, Sullivan JP. A critical review of consumer wearables, mobile applications, and equipment for providing bio-feedback, monitoring stress, and sleep in physically active populations. Front Physiol. 2018;9:743. doi: 10.3389/fphys.2018.00743 [DOI] [PMC free article] [PubMed] [Google Scholar]
- 9.Consumer Technology Association Health and Fitness Technology Subcommittee. Physical Activity Monitoring for Fitness Wearables: Step Counting. Arlington, VA: Consumer Technology Association; 2016. [Google Scholar]
- 10.Feito Y, Bassett DR, Thompson DL. Evaluation of activity monitors in controlled and free-living environments. Med Sci Sports Exerc. 2012;44(4):733–741. doi: 10.1249/MSS.0b013e3182351913 [DOI] [PubMed] [Google Scholar]
- 11.Feito Y, Garner HR, Bassett DR. Evaluation of ActiGraph’s low-frequency filter in laboratory and free-living environments. Med Sci Sports Exerc. 2015;47(1):211–217. doi: 10.1249/MSS.0000000000000395 [DOI] [PubMed] [Google Scholar]
- 12.Hatano Y Prevalence and use of pedometer. Res J Walking. 1997; 1:45–54. [Google Scholar]
- 13.Welk GJ, Bai Y, Lee JM, Godino J, Saint-Maurice PF, Carr L. Standardizing analytic methods and reporting in activity monitor validation studies. Med Sci Sports Exerc. 2019;51(8):1767–1780. doi: 10.1249/MSS.0000000000001966 [DOI] [PMC free article] [PubMed] [Google Scholar]
- 14.Moher D, Liberati A, Tetzlaff J, Altman DG, Group P. Preferred reporting items for systematic reviews and meta-analyses: the PRISMA statement. BMJ. 2009;339:b2535. doi: 10.1136/bmj.b2535 [DOI] [PMC free article] [PubMed] [Google Scholar]
- 15.Walther BA, Moore JL. The concepts of bias, precision and accuracy, and their use in testing the performance of species richness estimators, with a literature review of estimator performance. Ecography. 2005;28(6):815–829. doi: 10.1111/j.2005.0906-7590.04112.x [DOI] [Google Scholar]
- 16.Tudor-Locke C, Barreira TV, Schuna JM Jr. Comparison of step outputs for waist and wrist accelerometer attachment sites. Med Sci Sports Exerc. 2015;47(4):839–842. doi: 10.1249/MSS.0000000000000476 [DOI] [PubMed] [Google Scholar]
- 17.Abel MG, Hannon JC, Sell K, Lillie T, Conlin G, Anderson D. Validation of the Kenz lifecorder EX and ActiGraph GT1M accelerometers for walking and running in adults. Appl Physiol Nutr Metab. 2008;33(6):1155–1164. doi: 10.1139/h08-103 [DOI] [PubMed] [Google Scholar]
- 18.Abel MG, Peritore N, Shapiro R, Mullineaux DR, Rodriguez K, Hannon JC. A comprehensive evaluation of motion sensor step-counting error. Appl Physiol Nutr Metab. 2011;36(1):166–170. doi: 10.1139/H10-095 [DOI] [PubMed] [Google Scholar]
- 19.Alsubheen SA, George AM, Baker A, Rohr LE, Basset FA. Accuracy of the vivofit activity tracker. J Med Eng Technol. 2016;40(6):298–306. doi: 10.1080/03091902.2016.1193238 [DOI] [PubMed] [Google Scholar]
- 20.An HS, Jones GC, Kang SK, Welk GJ, Lee JM. How valid are wearable physical activity trackers for measuring steps? Eur J Sport Sci. 2017;17(3):360–368. doi: 10.1080/17461391.2016.1255261 [DOI] [PubMed] [Google Scholar]
- 21.Bassett DR Jr, Ainsworth BE, Leggett SR, et al. Accuracy of five electronic pedometers for measuring distance walked. Med Sci Sports Exerc. 1996;28(8):1071–1077. doi: 10.1097/00005768-199608000-00019 [DOI] [PubMed] [Google Scholar]
- 22.Beets MW, Patton MM, Edwards S. The accuracy of pedometer steps and time during walking in children. Med Sci Sports Exerc. 2005;37(3):513–520. doi: 10.1249/01.MSS.0000155395.49960.31 [DOI] [PubMed] [Google Scholar]
- 23.Beevi FH, Miranda J, Pedersen CF, Wagner S. An evaluation of commercial pedometers for monitoring slow walking speed populations. Telemed J E Health. 2016;22(5):441–449. doi: 10.1089/tmj.2015.0120 [DOI] [PubMed] [Google Scholar]
- 24.Bergman RJ, Spellman JW, Hall ME, Bergman SM. Is there a valid app for that? Validity of a free pedometer iPhone application. J Phys Act Health. 2012;9(5):670–676. doi: 10.1123/jpah.9.5.670 [DOI] [PubMed] [Google Scholar]
- 25.Brown DK, Grimwade D, Martinez-Bussion D, Taylor MJ, Gladwell VF. The validity of the ActiPed for physical activity monitoring. Int J Sports Med. 2013;34(5):431–437. [DOI] [PubMed] [Google Scholar]
- 26.Case MA, Burwick HA, Volpp KG, Patel MS. Accuracy of smartphone applications and wearable devices for tracking physical activity data. JAMA. 2015;313(6):625–626. doi: 10.1001/jama.2014.17841 [DOI] [PubMed] [Google Scholar]
- 27.Chen MD, Kuo CC, Pellegrini CA, Hsu MJ. Accuracy of wristband activity monitors during ambulation and activities. Med Sci Sports Exerc. 2016;48(10):1942–1949. doi: 10.1249/MSS.0000000000000984 [DOI] [PubMed] [Google Scholar]
- 28.Chow JJ, Thom JM, Wewege MA, Ward RE, Parmenter BJ. Accuracy of step count measured by physical activity monitors: the effect of gait speed and anatomical placement site. Gait Posture. 2017;57:199–203. doi: 10.1016/j.gaitpost.2017.06.012 [DOI] [PubMed] [Google Scholar]
- 29.Colley RC, Barnes JD, Leblanc AG, Borghese M, Boyer C, Tremblay MS. Validity of the SC-StepMX pedometer during treadmill walking and running. Appl Physiol Nutr Metab. 2013;38(5):520–524. doi: 10.1139/apnm-2012-0321 [DOI] [PubMed] [Google Scholar]
- 30.Connolly CP, Coe DP, Kendrick JM, Bassett DR Jr, Thompson DL. Accuracy of physical activity monitors in pregnant women. Med Sci Sports Exerc. 2011;43(6):1100–1105. doi: 10.1249/MSS.0b013e3182058883 [DOI] [PubMed] [Google Scholar]
- 31.Crouter SE, Schneider PL, Bassett DR Jr. Spring-levered versus piezoelectric pedometer accuracy in overweight and obese adults. Med Sci Sports Exerc. 2005;37(10):1673–1679. doi: 10.1249/01.mss.0000181677.36658.a8 [DOI] [PubMed] [Google Scholar]
- 32.Dahlgren G, Carlsson D, Moorhead A, Hager-Ross C, McDonough SM. Test–retest reliability of step counts with the ActivPAL device in common daily activities. Gait Posture. 2010;32(3):386–390. doi: 10.1016/j.gaitpost.2010.06.022 [DOI] [PubMed] [Google Scholar]
- 33.Diaz KM, Krupka DJ, Chang MJ, et al. Fitbit(R): an accurate and reliable device for wireless physical activity tracking. Int J Cardiol. 2015;185:138–140. doi: 10.1016/j.ijcard.2015.03.038 [DOI] [PMC free article] [PubMed] [Google Scholar]
- 34.Diaz KM, Krupka DJ, Chang MJ, et al. Validation of the Fitbit One (R) for physical activity measurement at an upper torso attachment site. BMC Res Notes. 2016;9(1):213. doi: 10.1186/s13104-016-2020-8 [DOI] [PMC free article] [PubMed] [Google Scholar]
- 35.Dondzila CJ, Swartz AM, Miller NE, Lenz EK, Strath SJ. Accuracy of uploadable pedometers in laboratory, overground, and free-living conditions in young and older adults. Int J Behav Nutr Phys Act. 2012;9(1):143. doi: 10.1186/1479-5868-9-143 [DOI] [PMC free article] [PubMed] [Google Scholar]
- 36.Dueker D, Gauderman WJ, McConnell R. Accuracy of a new time-resolved step counter in children. Pediatr Exerc Sci. 2012;24(4): 622–633. doi: 10.1123/pes.24.4.622 [DOI] [PubMed] [Google Scholar]
- 37.Duncan JS, Schofield G, Duncan EK, Hinckson EA. Effects of age, walking speed, and body composition on pedometer accuracy in children. Res Q Exerc Sport. 2007;78(5):420–428. doi: 10.1080/02701367.2007.10599442 [DOI] [PubMed] [Google Scholar]
- 38.Duncan MJ, Wunderlich K, Zhao Y, Faulkner G. Walk this way: validity evidence of iphone health application step count in laboratory and free-living conditions. J Sports Sci. 2018;36(15):1695–1704. doi: 10.1080/02640414.2017.1409855 [DOI] [PubMed] [Google Scholar]
- 39.Dwyer TJ, Alison JA, McKeough ZJ, Elkins MR, Bye PT. Evaluation of the SenseWear activity monitor during exercise in cystic fibrosis and in health. Respir Med. 2009;103(10):1511–1517. doi: 10.1016/j.rmed.2009.04.013 [DOI] [PubMed] [Google Scholar]
- 40.Edbrooke L, Lythgo N, Goldsworthy U, Denehy L. Can an accelerometer-based monitor be used to accurately assess physical activity in a population of survivors of critical illness? Glob J Health Sci. 2012;4(3):98–107. doi: 10.5539/gjhs.v4n3p98 [DOI] [PMC free article] [PubMed] [Google Scholar]
- 41.Esliger DW, Probert A, Connor Gorber S, Bryan S, Laviolette M, Tremblay MS. Validity of the Actical accelerometer step-count function. Med Sci Sports Exerc. 2007;39(7):1200–1204. doi: 10.1249/mss.0b013e3804ec4e9 [DOI] [PubMed] [Google Scholar]
- 42.Feito Y, Bassett DR, Thompson DL, Tyo BM. Effects of body mass index on step count accuracy of physical activity monitors. J Phys Act Health. 2012;9(4):594–600. doi: 10.1123/jpah.9.4.594 [DOI] [PubMed] [Google Scholar]
- 43.Fokkema T, Kooiman TJ, Krijnen WP, VAN DER Schans CP, DE Groot M. Reliability and validity of ten consumer activity trackers depend on walking speed. Med Sci Sports Exerc. 2017;49(4):793–800. doi: 10.1249/MSS.0000000000001146 [DOI] [PubMed] [Google Scholar]
- 44.Foster RC, Lanningham-Foster LM, Manohar C, et al. Precision and accuracy of an ankle-worn accelerometer-based pedometer in step counting and energy expenditure. Prev Med. 2005;41(3–4):778–783. doi: 10.1016/j.ypmed.2005.07.006 [DOI] [PubMed] [Google Scholar]
- 45.Furlanetto KC, Bisca GW, Oldemberg N, et al. Step counting and energy expenditure estimation in patients with chronic obstructive pulmonary disease and healthy elderly: accuracy of 2 motion sensors. Arch Phys Med Rehabil. 2010;91(2):261–267. doi: 10.1016/j.apmr.2009.10.024 [DOI] [PubMed] [Google Scholar]
- 46.Gaz DV, Rieck TM, Peterson NW, et al. Determining the validity and accuracy of multiple activity-tracking devices in controlled and free-walking conditions. Am J Health Promot. 2018;32(8):1671–1678. doi: 10.1177/0890117118763273 [DOI] [PubMed] [Google Scholar]
- 47.Giannakidou DM, Kambas A, Ageloussis N, et al. The validity of two Omron pedometers during treadmill walking is speed dependent. Eur J Appl Physiol. 2012;112(1):49–57. doi: 10.1007/s00421-011-1951-y [DOI] [PubMed] [Google Scholar]
- 48.Harrington DM, Welk GJ, Donnelly AE. Validation of MET estimates and step measurement using the ActivPAL physical activity logger. J Sports Sci. 2011;29(6):627–633. doi: 10.1080/02640414.2010.549499 [DOI] [PubMed] [Google Scholar]
- 49.Hasson RE, Haller J, Pober DM, Staudenmayer J, Freedson PS. Validity of the Omron HJ-112 pedometer during treadmill walking. Med Sci Sports Exerc. 2009;41(4):805–809. doi: 10.1249/MSS.0b013e31818d9fc2 [DOI] [PubMed] [Google Scholar]
- 50.Hickey A, John D, Sasaki JE, Mavilia M, Freedson P. Validity of activity monitor step detection is related to movement patterns. J Phys Act Health. 2016;13(2):145–153. doi: 10.1123/jpah.2015-0203 [DOI] [PubMed] [Google Scholar]
- 51.Hiebert JM, Hoover DL, Connelly A, Hollis J, Marlow J, Schneider N. Effects of footwear and grade conditions on pedometer accuracy. J Strength Cond Res. 2010;24:1. [Google Scholar]
- 52.Höchsmann C, Knaier R, Eymann J, Hintermann J, Infanger D, Schmidt-Trucksass A. Validity of activity trackers, smartphones, and phone applications to measure steps in various walking conditions. Scand J Med Sci Sports. 2018;28(7):1818–1827. doi: 10.1111/sms.13074 [DOI] [PubMed] [Google Scholar]
- 53.Huang Y, Xu J, Yu B, Shull PB. Validity of FitBit, Jawbone UP, Nike + and other wearable devices for level and stair walking. Gait Posture. 2016;48:36–41. doi: 10.1016/j.gaitpost.2016.04.025 [DOI] [PubMed] [Google Scholar]
- 54.Imboden MT, Nelson MB, Kaminsky LA, Montoye AH. Comparison of four Fitbit and Jawbone activity monitors with a research-grade ActiGraph accelerometer for estimating physical activity and energy expenditure. Br J Sports Med. 2018;52(13):844–850. doi: 10.1136/bjsports-2016-096990 [DOI] [PubMed] [Google Scholar]
- 55.Johnson M, Meltz K, Hart K, Schmudlach M, Clarkson L, Borman K. Validity of the Actical activity monitor for assessing steps and energy expenditure during walking. J Sports Sci. 2015; 33(8):769–776. doi: 10.1080/02640414.2014.964747 [DOI] [PubMed] [Google Scholar]
- 56.Jones D, Crossley K, Dascombe B, Hart HF, Kemp J. Validity and reliability of the Fitbit Flex™ and ActiGraph GT3X+ at jogging and running speeds. Int J Sports Phys Ther. 2018;13(5):860–870. doi: 10.26603/ijspt20180860 [DOI] [PMC free article] [PubMed] [Google Scholar]
- 57.Kanoun N Validation of the ActivPAL activity monitor as a measure of walking at pre-determined slow walking speeds in a healthy population in a controlled setting. Reinvention Int J Undergrad Res. 2009;2(2). http://www.warwick.ac.uk/go/reinventionjournal/issues/Vol.2issue2/kanoun. Accessed March 7, 2018. [Google Scholar]
- 58.Karabulut M, Crouter SE, Bassett DR Jr. Comparison of two waist-mounted and two ankle-mounted electronic pedometers. Eur J Appl Physiol. 2005;95(4):335–343. doi: 10.1007/s00421-005-0018-3 [DOI] [PubMed] [Google Scholar]
- 59.Kumahara H, Ayabe M, Ichibakase M, Tashima A, Chiwata M, Takashi T. Validity of activity monitors worn at multiple nontraditional locations under controlled and free-living conditions in young adult women. Appl Physiol Nutr Metab. 2015;40(5):448–456. doi: 10.1139/apnm-2014-0183 [DOI] [PubMed] [Google Scholar]
- 60.Larkin L, Nordgren B, Purtill H, Brand C, Fraser A, Kennedy N. Criterion validity of the activPAL activity monitor for sedentary and physical activity patterns in people who have rheumatoid arthritis. Phys Ther. 2016;96(7):1093–1101. doi: 10.2522/ptj.20150281 [DOI] [PubMed] [Google Scholar]
- 61.Le Masurier GC, Lee SM, Tudor-Locke C. Motion sensor accuracy under controlled and free-living conditions. Med Sci Sports Exerc. 2004;36(5):905–910. doi: 10.1249/01.MSS.0000126777.50188.73 [DOI] [PubMed] [Google Scholar]
- 62.Le Masurier GC, Tudor-Locke C. Comparison of pedometer and accelerometer accuracy under controlled conditions. Med Sci Sports Exerc. 2003;35(5):867–871. doi: 10.1249/01.MSS.0000064996.63632.10 [DOI] [PubMed] [Google Scholar]
- 63.Lee JA, Laurson KR. Validity of the SenseWear armband step count measure during controlled and free-living conditions. J Exerc Sci Fit. 2015;13(1):16–23. doi: 10.1016/j.jesf.2014.11.002 [DOI] [PMC free article] [PubMed] [Google Scholar]
- 64.Lee JA, Williams SM, Brown DD, Laurson KR. Concurrent validation of the Actigraph gt3x+, polar active accelerometer, Omron HJ-720 and Yamax Digiwalker SW-701 pedometer step counts in lab-based and free-living settings. J Sports Sci. 2015;33(10): 991–1000. doi: 10.1080/02640414.2014.981848 [DOI] [PubMed] [Google Scholar]
- 65.Leicht AS, Crowther RG. Influence of non-level walking on pedometer accuracy. J Sci Med Sport. 2009;12(3):361–365. doi: 10.1016/j.jsams.2008.01.007 [DOI] [PubMed] [Google Scholar]
- 66.Leong JY, Wong JE. Accuracy of three android-based pedometer applications in laboratory and free-living settings. J Sports Sci. 2017;35(1):14–21. doi: 10.1080/02640414.2016.1154592 [DOI] [PubMed] [Google Scholar]
- 67.Lutzner C, Voigt H, Roeder I, Kirschner S, Lutzner J. Placement makes a difference: accuracy of an accelerometer in measuring step number and stair climbing. Gait Posture. 2014;39(4):1126–1132. [DOI] [PubMed] [Google Scholar]
- 68.Maddocks M, Petrou A, Skipper L, Wilcock A. Validity of three accelerometers during treadmill walking and motor vehicle travel. Br J Sports Med. 2010;44(8):606–608. doi: 10.1136/bjsm.2008.051128 [DOI] [PubMed] [Google Scholar]
- 69.Mammen G, Gardiner S, Senthinathan S, McClemont L, Stone M, Faulkner G. Is this Bit Fit? Measuring the quality of the Fitbit step-counter. Health Fitness J Can. 2012;5(4):30–39. [Google Scholar]
- 70.Melanson EL, Knoll JR, Bell ML, et al. Commercially available pedometers: considerations for accurate step counting. Prev Med. 2004;39(2):361–368. doi: 10.1016/j.ypmed.2004.01.032 [DOI] [PubMed] [Google Scholar]
- 71.Mitre N, Lanningham-Foster L, Foster R, Levine JA. Pedometer accuracy for children: can we recommend them for our obese population? Pediatrics. 2009;123(1):e127–e131. doi: 10.1542/peds.2008-1908 [DOI] [PMC free article] [PubMed] [Google Scholar]
- 72.Montes J, Young JC, Tandy R, Navalta JW. Reliability and validation of the Hexoskin wearable bio-collection device during walking conditions. Int J Exerc Sci. 2018;11(7):806–816. [DOI] [PMC free article] [PubMed] [Google Scholar]
- 73.Motl RW, Snook EM, Agiovlasitis S. Does an accelerometer accurately measure steps taken under controlled conditions in adults with mild multiple sclerosis? Disabil Health J. 2011;4(1):52–57. doi: 10.1016/j.dhjo.2010.02.003 [DOI] [PubMed] [Google Scholar]
- 74.Nelson MB, Kaminsky LA, Dickin DC, Montoye AH. Validity of consumer-based physical activity monitors for specific activity types. Med Sci Sports Exerc. 2016;48(8):1619–1628. doi: 10.1249/MSS.0000000000000933 [DOI] [PubMed] [Google Scholar]
- 75.Nielson R, Vehrs PR, Fellingham GW, Hager R, Prusak KA. Step counts and energy expenditure as estimated by pedometry during treadmill walking at different stride frequencies. J Phys Act Health. 2011;8(7):1004–1013. doi: 10.1123/jpah.8.7.1004 [DOI] [PubMed] [Google Scholar]
- 76.Oliver M, Badland H, Shepherd J, Schofield GM. Counting steps in research: a comparison of accelerometry and pedometry. Open J Prev Med. 2011;1(1):1–7. doi: 10.4236/ojpm.2011.11001 [DOI] [Google Scholar]
- 77.Park W, Lee VJ, Ku B, Tanaka H. Effect of walking speed and placement position interactions in determining the accuracy of various newer pedometers. J Exerc Sci Fit. 2014;12(1):31–37. doi: 10.1016/j.jesf.2014.01.003 [DOI] [Google Scholar]
- 78.Ramirez-Marrero FA, Smith BA, Kirby TE, Leenders N, Sherman WM. Evaluation of a step-counter during treadmill walking in 7–12 year old African-American children. J Natl Black Nurses Assoc. 2002;13(1):1–5. [PubMed] [Google Scholar]
- 79.Rosenkranz RR, Rosenkranz SK, Weber C. Validity of the Actical accelerometer step-count function in children. Pediatr Exerc Sci. 2011;23(3):355–365. doi: 10.1123/pes.23.3.355 [DOI] [PubMed] [Google Scholar]
- 80.Rowlands AV, Stone MR, Eston RG. Influence of speed and step frequency during walking and running on motion sensor output. Med Sci Sports Exerc. 2007;39(4):716–727. doi: 10.1249/mss.0b013e318031126c [DOI] [PubMed] [Google Scholar]
- 81.Ryan CG, Grant PM, Gray H, Newton M, Granat MH. Measuring postural physical activity in people with chronic low back pain. J Back Musculoskelet Rehabil. 2008;21(1):43–50. doi: 10.3233/BMR-2008-21106 [DOI] [Google Scholar]
- 82.Ryan CG, Grant PM, Tigbe WW, Granat MH. The validity and reliability of a novel activity monitor as a measure of walking. Br J Sports Med. 2006;40(9):779–784. doi: 10.1136/bjsm.2006.027276 [DOI] [PMC free article] [PubMed] [Google Scholar]
- 83.Sears T, Avalos E, Lawson S, McAlister I, Eschbach C, Bunn J. Wrist-worn physical activity trackers tend to underestimate steps during walking. Int J Exerc Sci. 2017;10:764–773. [Google Scholar]
- 84.Stackpool CM, Porcari JP, Mikat RP, Gillette C, Foster C. The accuracy of various activity trackers in estimating steps taken and energy expenditure. J Fitness Res. 2014;3(3):32–48. [Google Scholar]
- 85.Stansfield B, Hajarnis M, Sudarshan R. Characteristics of very slow stepping in healthy adults and validity of the activPAL3 activity monitor in detecting these steps. Med Eng Phys. 2015; 37(1):42–47. doi: 10.1016/j.medengphy.2014.10.003 [DOI] [PubMed] [Google Scholar]
- 86.Steeves JA, Tyo BM, Connolly CP, Gregory DA, Stark NA, Bassett DR. Validity and reliability of the Omron HJ-303 tri-axial accelerometer-based pedometer. J Phys Act Health. 2011;8(7):1014–1020. doi: 10.1123/jpah.8.7.1014 [DOI] [PubMed] [Google Scholar]
- 87.Sushames A, Edwards A, Thompson F, McDermott R, Gebel K. Validity and reliability of Fitbit flex for step count, moderate to vigorous physical activity and activity energy expenditure. PLoS One. 2016;11(9):e0161224. doi: 10.1371/journal.pone.0161224 [DOI] [PMC free article] [PubMed] [Google Scholar]
- 88.Takacs J, Pollock CL, Guenther JR, Bahar M, Napier C, Hunt MA. Validation of the Fitbit one activity monitor device during treadmill walking. J Sci Med Sport. 2014;17(5):496–500. doi: 10.1016/j.jsams.2013.10.241 [DOI] [PubMed] [Google Scholar]
- 89.Tam KM, Cheung SY. Validation of electronic activity monitor devices during treadmill walking. Telemed J E Health. 2018;24(10): 782–789. doi: 10.1089/tmj.2017.0263 [DOI] [PubMed] [Google Scholar]
- 90.Tudor-Locke C, Sisson SB, Lee SM, Craig CL, Plotnikoff RC, Bauman A. Evaluation of quality of commercial pedometers. Can J Public Health. 2006;97(Suppl 1):S10–S15, S10–S16. doi: 10.1007/BF03405359 [DOI] [PMC free article] [PubMed] [Google Scholar]
- 91.Merriam-Webster Dictionary [online]. Step, 2 a(1). In: Merriam- Webster Dictionary [online]. Merriam-Webster; 2018. https://www.merriam-webster.com/dictionary/step. Accessed August 20, 2019. [Google Scholar]
- 92.Oxford English Dictionary [online]. Step, n.1. In: Oxford English Dictionary [online]. Oxford University Press; 2018. https://www.merriam-webster.com/dictionary/step. Accessed August 20, 2019. [Google Scholar]
- 93.Zatsiorky VM, Werner SL, Kaimin MA. Basic kinematics of walking. Step length and step frequency. A review. J Sports Med Phys Fitness. 1994;34(2):109–134. [PubMed] [Google Scholar]
- 94.Bassett DR Jr, Toth LP, LaMunion SR, Crouter SE. Step counting: a review of measurement considerations and health-related applications. Sports Med. 2017;47(7):1303–1315. doi: 10.1007/s40279-016-0663-1 [DOI] [PMC free article] [PubMed] [Google Scholar]
- 95.Bunn JA, Navalta JW, Fountaine CJ, Reece JD. Current state of commercial wearable technology in physical activity monitoring 2015–2017. Int J Exerc Sci. 2018;11(7):503–515. [DOI] [PMC free article] [PubMed] [Google Scholar]
- 96.van Kan GA, Rolland Y, Andrieu S, et al. Gait speed at usual pace as a predictor of adverse outcomes in community-dwelling older people an International Academy on Nutrition and Aging (IANA) task force. J Nutr Health Aging. 2009;13(10):881–889. doi: 10.1007/s12603-009-0246-z [DOI] [PubMed] [Google Scholar]
Associated Data
This section collects any data citations, data availability statements, or supplementary materials included in this article.