Abstract
The emergence of degenerative disease after traumatic brain injury is often described as an acceleration of normal age-related processes. Whether similar molecular processes occur after injury and in age is unclear. Here we identify a functionally dynamic and lasting transcriptional response in glia, mediated by the conserved transcription factor AP1. In the early post-TBI period, glial AP1 is essential for recovery, ensuring brain integrity and animal survival. In sharp contrast, chronic AP1 activation promotes human tau pathology, tissue loss, and mortality. We show a similar process activates in healthy fly brains with age. In humans, AP1 activity is detected after moderate TBI and correlates with microglial activation and tau pathology. Our data provide key molecular insight into glia, highlighting that the same molecular process drives dynamic and contradictory glia behavior in TBI, and possibly age, first acting to protect but chronically promoting disease.
Introduction:
Traumatic brain injury (TBI) has long been suggested to promote an advanced age state of the brain1. Both injury and age herald neurodegenerative pathology and disease, though on dramatically different timelines2,3. In extreme cases, repetitive head injury in professional football players and boxers, disease usually manifests as chronic traumatic encephalopathy4,5. But select hallmarks of degeneration—tissue loss, gliosis, and aggregates of hyperphosphorylated tau—are also found months after a single moderate injury in otherwise healthy individuals3,6–9. These early changes do not guarantee clinical disease2, but they influence the continued trajectory of brain health. Despite the parallels between TBI and age, whether parallel cell and molecular processes occur is entirely unclear.
Glia, a collection of resident CNS immune and support cells, have an emergent role in the pathogenesis of age-onset degenerative diseases10. As guardians of the CNS, glia maintain homeostasis by remedying pathologic and physiologic disturbances. But glia adopt aberrant states in advanced age and disease11,12, with growing evidence for deleterious and degenerative impact on neurons. Alterations in genes, like TREM2, APOE4, and TARDBP, linked to distinct neuropathologies commonly modify glia behavior to accelerate protein aggregation13–16. Inflammatory processes within glia can seed neuronal protein pathology17,18. Glia also propagate disease protein pathology between neurons19,20.
The role of glia in TBI is less clear and often appears paradoxical21. In early TBI recovery, astrocytes and microglia have been reported to serve a beneficial role, though underlying intracellular processes have not been defined21. However, glia remain morphologically activated for decades after injury22. This dystrophic state, termed chronic gliosis, coincides with regions of eventual tissue loss and tau pathology23. Such observations hint that glia instigate degeneration long after injury, but a mechanism has yet to be identified24. Overall, our understanding of the molecular status of glia in TBI is incomplete, including chronic gliosis and its degenerative ramifications.
Many discoveries fundamental to human biology and disease have been made first in Drosophila11,25–35. To investigate the molecular consequences of TBI, we used a head-specific Drosophila TBI approach, termed dTBI36. Fly TBI models overcome limitations in mammals37 and offer exceptional genetic tractability and a short lifespan. The fly and mammalian brain have analogous core elements: namely, a repertoire of glial and neuronal subtypes, organized into functionally distinct regions and protected by a “blood”-brain barrier and a hard cuticle38,39. The dTBI method uses machine-controlled, tunable head compression. Brain degeneration progresses along a highly reproducible timeline, facilitating precise delineation of conserved molecular changes.
Here, using this highly-reproducible TBI model, we demonstrate a dynamic, lasting response in glia, mediated by the conserved transcription factor AP1. Glial AP1 has an established role in Wallerian degeneration40,41—a specific process to resolve axonal lesion. However, we show that AP1 activation after TBI trauma is mechanistically distinct, with implications for glia function and disease pathogenesis. In early injury, AP1 orchestrates a protective response that maintains brain integrity and ensures animal survival. In sharp contrast, sustained AP1 activity promotes pathologic hallmarks of human tau. Intriguingly, a similar process activates in glia with normal brain aging. We find evidence of an AP1 response in humans, decades after moderate TBI, which correlates with microglial activation and tauopathy. These findings indicate that AP1 drives paradoxical behavior of glia in TBI and possibly age, first acting to protect but, in time, promoting disease progression.
Results:
Evidence of lasting AP1 transcriptional activity after TBI
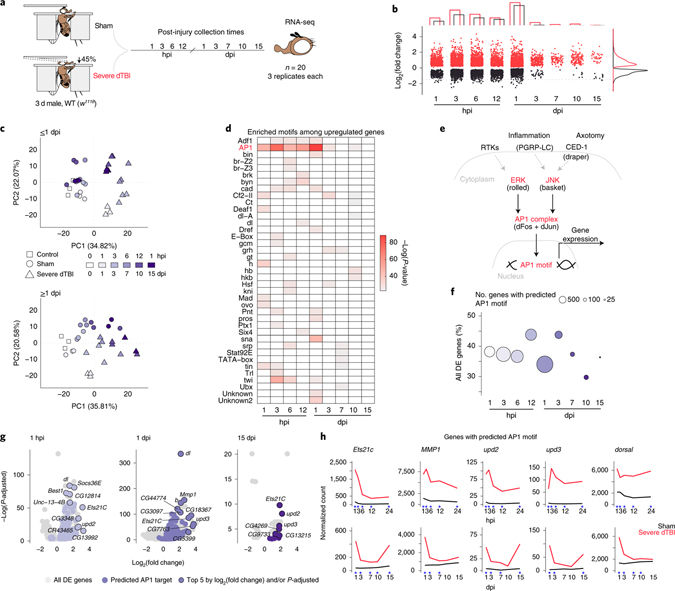
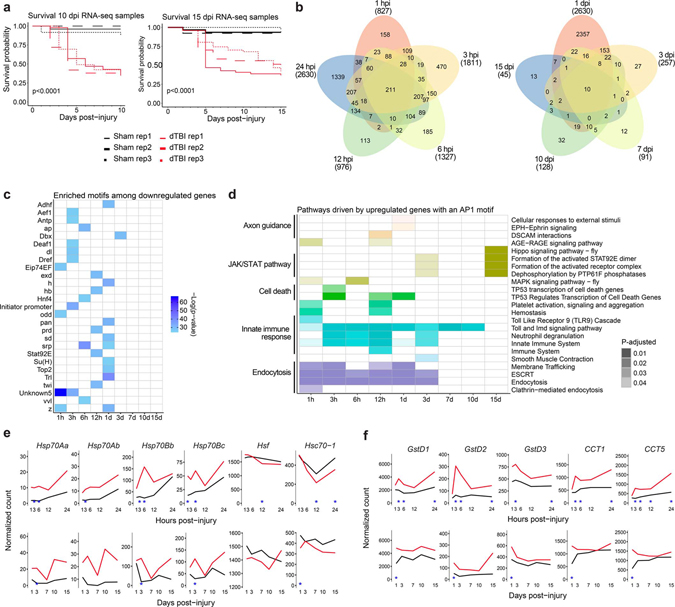
To investigate molecular drivers of degeneration after traumatic brain injury, we mapped the transcriptional time course of the dTBI response. We compared gene expression by RNAseq in sham and severe dTBI heads at 9 timepoints spanning from 1 hour post-injury (hpi) to 15 days post-injury (dpi; Fig. 1a). By 15 dpi, the brain is considerably degenerated36 and survival approximates 50% (Extended Data Fig. 1a). In the first 24 hpi, hundreds of genes were affected, and the number of genes up or downregulated was roughly comparable at each time point (FDR<0.05; Fig. 1b; Extended Data Fig. 1b; Supplementary Table 5).
Fig. 1 |. A lasting AP1 transcriptional response to TBI.
a, Design of time course RNA-seq experiment. Sham and severe dTBI heads were collected at 1 pre-injury (0 hours per injury; hpi) and 9 post-injury timepoints, in 3 biological replicates (n = 20 heads per replicate) for each injury condition and time (n = 57 samples total). b, Plot showing the number of significantly differentially expressed genes (upregulated in red, downregulated in black) at each post-injury time. Bar graph annotation (top) summarizes the total number of genes up and down. Density plot annotation (right) summarizes the distribution by log2 fold change (each point = 1 gene; FDR < 0.05). c, Principal component analysis of ≤1 dpi (days post-injury; top) and ≥1 dpi samples (bottom). Each point represents 1 biological replicate. Shape encodes condition. Color encodes post-injury time. d, Tile plot showing results of HOMER de novo motif enrichment analysis among upregulated genes (FDR<0.05). Presence of a colored tile indicates motif enrichment at a given post-injury time. Tile color encodes significance. e, Regulation of the conserved transcriptional complex AP1. Drosophila-specific gene names in parenthesis. f, Summary of the proportion of all differentially expressed genes with a predicted AP1 motif. Color key as in c. g, Volcano plots highlighting genes with predicted AP1 motifs (purple points), with the top 5 genes by L2FC and/or p-adjusted labelled. h, Average sham (black) and severe dTBI (red) expression of highly affected AP1 target genes at ≤1 dpi (top) and ≥1 dpi (bottom; blue star indicates FDR < 0.05 at a given time). See Supplementary Table 1 for genotypes in all figures.
By 3 dpi, the transcriptional response was substantially attenuated, and affected genes were skewed towards activation. This trend of disproportional upregulation continued through 15 dpi, with 37 of 45 genes upregulated. Notably, ~1/3 of 15 dpi genes were also upregulated at earlier timepoints, suggesting a subset of genes may be persistently active (Extended Data Fig. 1b). Principal component analysis complimented and refined this characterization (Fig. 1c). In the first 24 hpi, dTBI and sham animals segregated across PC1 and replicates tightly clustered. After 1 dpi, samples distributed along PC1 by time, consistent with overall transcriptional resolution, though dTBI animals remained right-shifted relative to age-matched shams.
The large number of immediate gene changes, and subset of lasting gene changes, suggested key transcription factors may orchestrate the dTBI response. To uncover potential regulators, we analyzed the promoters of up and downregulated genes for de novo DNA motifs. A unifying motif did not emerge from downregulated genes (Extended Data Fig. 1c). However, upregulated genes at nearly all times were unexpectedly enriched for a common motif, predicted to be targeted by the transcriptional complex AP1 (Fig. 1d).
AP1 is a conserved, dimeric complex typically comprised of one member each of the Fos and Jun protein families42. Drosophila have a single member of each, referred to here as dFos and dJun (Fig. 1e), with structural and functional homology to mammalian Fos and Jun43–45. We compiled all predicted AP1 target genes (Supplementary Table 6) to estimate their contribution to the transcriptional response. Between 30–45% of affected genes had an AP1 motif at all timepoints (Fig. 1f), suggesting AP1 may mediate a substantial and continued response to injury in the fly brain.
We examined the predicted AP1 targets. In the first 24 hpi, targeted genes mapped to immune and endocytic pathways (Extended Data Fig. 1d). This shifted to immune and JAK/STAT signaling at later times. The most highly affected genes included known fly AP1 targets—Ets21c, upd2, upd3, MMP141,46,47—and genes with a previously unrecognized AP1 motif, like dorsal, an NFkB homolog (Fig. 1g). Strong upregulation of these specific genes was noted throughout the post-injury period (Fig. 1h). By contrast, canonical stress response genes, such as the heat shock proteins and glutathione transferases, normalized to baseline by 3 dpi (Extended Data Fig. 1e,f).
AP1 activation is a lasting, severity-dependent TBI response
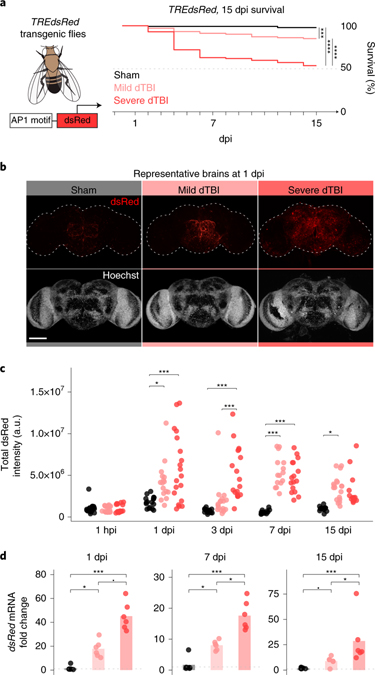
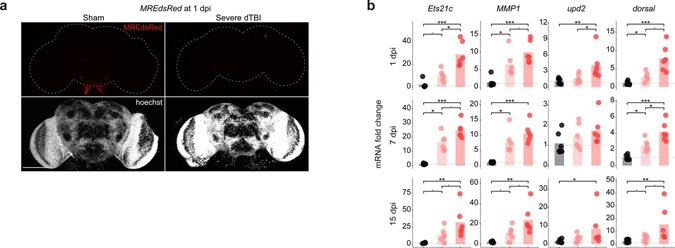
To investigate AP1 activity in the brain, we used an established in vivo reporter line, TREdsRed, that expresses dsRed under the control of 4x AP1 motifs48. We compared changes in dsRed protein and mRNA in dissected brains of mild and severe dTBI flies through 15 dpi; mild vs severe insults convey dramatically different mortality (Fig. 2a), functional impairment and brain degeneration during this period36. By whole mount immunofluorescence (IF), dsRed protein increased by 1 dpi and lasted through 15 dpi (Fig. 2b and 2c). dTBI did not affect dsRed with a mutated AP1 motif, MREdsRed48, confirming AP1 specificity (Extended Data Fig. 2a). To exclude an effect due to dsRed protein perdurance, we probed AP1 target gene mRNA levels by realtime quantitative PCR (RT-qPCR). We found lasting, severity-dependent upregulation of dsRed (Fig. 2d), as well as RNA-seq predicted AP1 target genes (Extended Data Fig. 2b). Thus, AP1 activity appears to be an enduring consequence of dTBI. This occurs even after mild injury, where injured flies are largely indistinguishable from shams in behavior, but develop degeneration with time36.
Fig. 2 |. AP1 activation is sustained and is severity-dependent.
a, AP1 activation was assessed in TREdsRed transgenic flies, with dsRed driven by 4X AP1 motifs. Right, 15 dpi survival of TREdsRed flies injured with sham (black), mild (35% head compression), or severe (45% head compression) dTBI (n = 100 per condition; sham vs mild dTBI: p = 0.00011, sham vs severe dTBI: p < 2e-16, mild vs severe dTBI: p = 1.6e-7, Kaplan-Meier analysis with log-rank comparison). b, Representative z-stacked whole mount brains at 1 dpi across injury conditions. Scale bar, 100μm. c, Quantification of dsRed immunofluorescence in whole mount brains throughout the post-injury period (each point = 1 brain; n = 14–19 brains per condition/time pooled examined over two independent experiments; p = 3.33e-09, two-way ANOVA with Tukey’s test). d, Mean relative expression of dsRed mRNA by RT-qPCR at 1, 7, and 15 dpi between injury conditions (each point = 1 biological replicate of 9 brains; n = 6 biological replicates per condition; Kruskal–Wallis test with Dunn’s multiple comparison test and Holm adjustment). See Extended Data Fig. 2b for additional AP1 target genes. Statistical annotations are ****p<0.0001, ***p<0.001, **p<0.01, *p<0.05, -p<0.10. All statistical tests were two-sided where applicable. For full statistical reporting, including exact p-values, see Source Data Fig. 2. Scale bar 100μm. Color code for injury in a and b.
AP1 activates and persists in glia
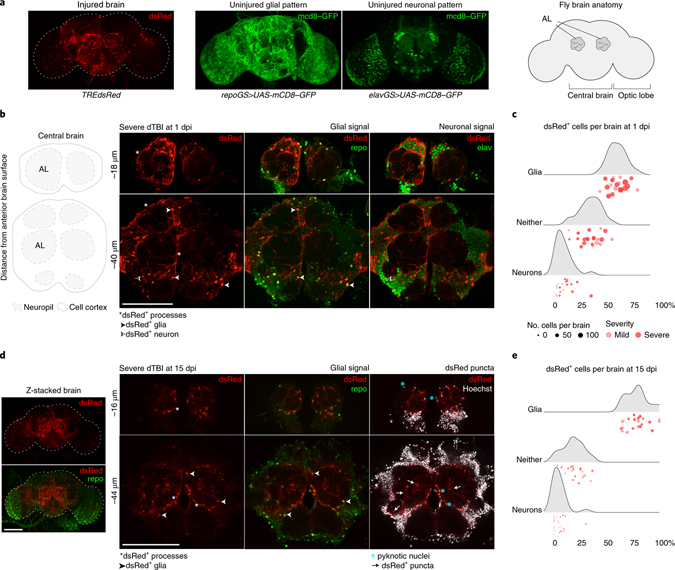
To localize AP1 activation within the brain, we examined TREdsRed whole mount brains by confocal microscopy. Surprisingly, the pattern of dsRed strongly resembled glial processes and not neurons (Fig. 3a), the latter of which constitute most cells (~90%) in the fly brain38. We therefore quantified dsRed in glia (repo+) and neurons (elav+) by whole mount IF after mild and severe dTBI.
Fig. 3 |. AP1 activates and persists in glia.
a, Representative z-stacked whole-mount brain showing dsRed pattern in an injured brain (severe dTBI, 1 dpi). Also shown are the pattern of glial and neural membranes in uninjured brains, highlighted using a membrane-targeted GFP variant (mcd8-GFP) expressed under an inducible glial (repoGS aka repoGeneSwitch) or neural-specific (elavGS aka elavGeneSwitch) promoter. Simplified anatomy of the fly brain on the right, as seen in whole mount brain images. b, Representative high-magnification images of the central brain at 1 dpi. Thick, hypertrophic dsRed+ membrane processes are detected throughout the brain. Many dsRed+ cells co-localize with a nuclear glia-specific antibody (repo). c, Ridgeline plot demonstrating the proportion of dsRed+ cells that are glia (repo+), neurons (elav+) or neither (repo−/elav−) in mild (pink) and severe (red) dTBI brains (each point = 1 brain). X-axis indicates the percentage of all dsRed+ cells. Y-axis indicates sample density along the x-axis. d, Representative high-magnification images of the central brain at 15 dpi. dsRed+ processes are thinner and appear fragmented (white arrowheads). dsRed+ repo+ nuclei appear shrunken (blue *). dsRed+ puncta are abundant throughout the neuropil (white arrows). On the left is the whole z-stacked brain, demonstrating the overall pattern of dsRed in late dTBI. e, Ridgeline plot as in c for 15 dpi dTBI brains. All scale bars 100μm.
At 1 dpi, most dsRed+ cells were repo+ glia (59.99 ± 8.51%) and only a minority of cells were elav+ neurons (8.99 ± 8.01%; Fig. 3b and 3c). Severe dTBI brains on average had more dsRed+ cells than mild dTBI brains (159 vs 83), though the proportion of dsRed+ glia to neurons was comparable. Overall, AP1 activity was greatly enriched in glia, representing ~6-fold greater proportion of cells compared to neurons (Fisher’s exact test, p = 2.53e-33). dsRed+ glia appeared morphologically reactive, with characteristic thick, hypertrophic processes and were concentrated around primary impact areas, like the antenna lobes (see Fig. 3b).
By 15 dpi, the total number of dsRed+ cells per brain decreased (from 125±53 to 31±12), though a greater percentage were repo+ glia (78.77±10.70%; Fig. 3e). Key histological differences further distinguished dsRed+ repo+ glia at 15 dpi from 1 dpi (Fig. 3d). dsRed+ glia had pyknotic nuclei and dsRed+ processes appeared irregular. We also found dsRed+ puncta that did not localize with nuclear staining throughout the neuropil and around repo+ nuclei, suggestive of blebbing or cytoplasmic fragmentation. Altogether, these changes are reminiscent of dystrophic gliosis, a morphological phenomenon of chronically active mammalian glia49,50 previously unreported in flies38. These changes appeared as early as 3 dpi after mild and severe dTBI and were predominant by 7 dpi. Thus, a fraction of glia transition to an altered state, defined by their morphology and chronic activation of AP1.
AP1 activation in TBI differs from Wallerian degeneration
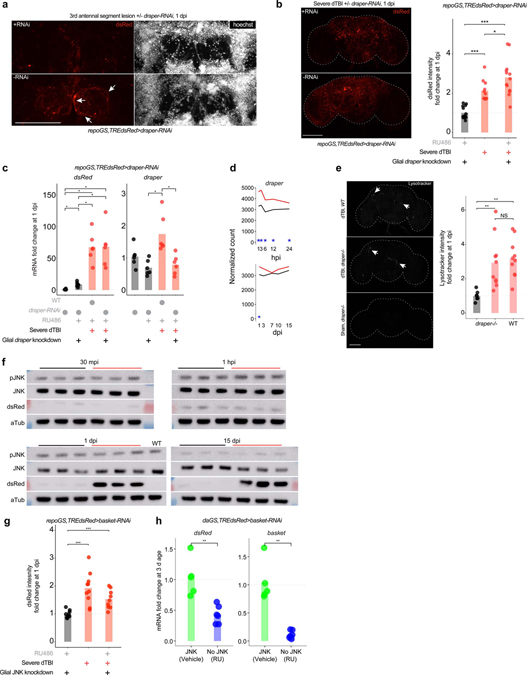
Glial AP1 is integral to Wallerian degeneration, an active degeneration process following axonal lesion40,51,52. In flies, glia sense this neuron-specific injury via the CED1 receptor, draper, without which glia fail to upregulate AP1 target genes40,41. We investigated if the AP1 response in dTBI is draper-dependent, by eliminating draper gene function in glia and assessing AP1 activity via TREdsRed. Unlike antennal nerve transection lesion (AL) injury51, where draper-RNAi prevents dsRed expression and glial hypertrophy (Extended Data Fig. 3a), draper-RNAi had no effect on dsRed protein or mRNA upon dTBI (Extended Data Fig. 3b,c). As draper detects the molecular signature of axonal debris, glia seemingly answer to distinct cues with dTBI.
Glial phagocytosis is essential for removing debris after axonal transection injury, and this process involves draper51. AP1 augments phagocytosis, by increasing membranous draper (via Stat92E) and directly upregulating pro-engulfment genes40,53. By RNAseq, we observed elevated draper mRNA in early injury (Extended Data Fig. 3d), though we were unable to detect protein changes (data not shown). Thus, we asked if draper facilitates glial phagocytosis in dTBI by assessing lysosome formation. Surprisingly, lysosomal activity was similarly increased in dTBI draper−/− and WT flies (Extended Data Fig. 3e), arguing a phagocytotic response to dTBI can occur without draper.
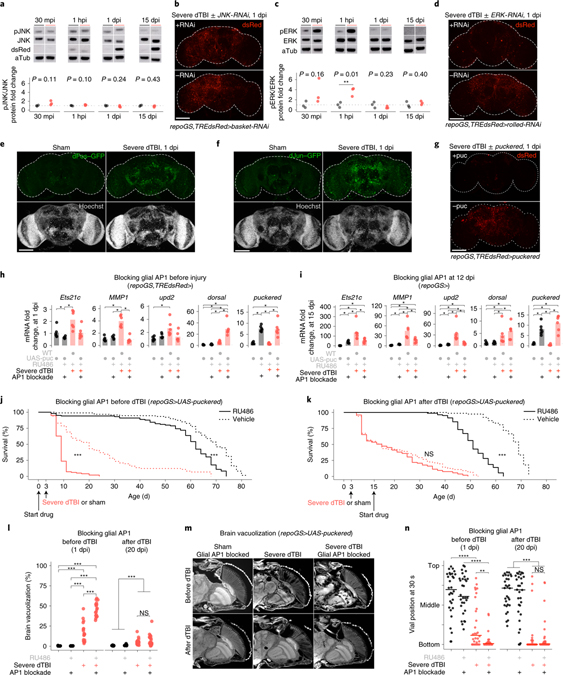
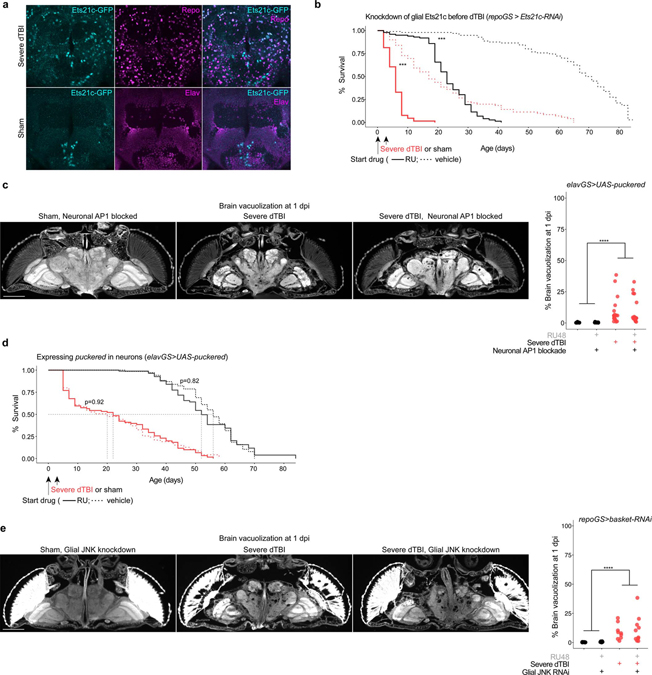
Two mechanisms are known to promote the transcriptional activity of AP1. Dimer stabilization via phosphorylation by MAP kinases (MAPK), and increased levels of component proteins54,55. In Wallerian degeneration, AP1 is phosphorylated by the c-Jun terminal kinase (JNK/basket; see Fig. 1e), which acts downstream of draper40. To determine if JNK also regulates AP1 in dTBI, we assessed active pJNK, JNK, and dsRed by western immunoblot in TREdsRed brains at 30 min post-injury (mpi), 1 hpi, 1 dpi, and 15 dpi. Though dsRed increased, we failed to detect a concomitant change in pJNK/JNK (Fig. 4a; Extended Data Fig. 3f). Genetic reduction of JNK with basket RNAi failed to mitigate dTBI-induced upregulation of dsRed (Fig. 4b; Extended Data Fig. 3g), despite validation of RNAi efficiency to reduce basal dsRed and basket mRNA in whole flies under a ubiquitous driver (Extended Data Fig. 3h). Thus, unlike Wallerian degeneration, glial AP1 activation in TBI appears to be both draper and JNK-independent.
Fig. 4 |. Glial AP1 is activated by ERK and promotes early TBI recovery.
a, Representative protein changes (top) and quantification of pJNK/JNK by western immunoblot (each point = 1 biological replicate (8 brains); n = 3 biological replicates/condition; Student’s t-test for each timepoint). See Extended Data Fig. 3d for immunoblots. b, Endogenous dsRed protein in whole mount brains at 1 dpi, with (top) or without (bottom) glial JNK-RNAi. See Extended Data Fig. 3e for quantification. c, Representative immunoblot (top) and quantification of pERK/ERK (each point = 1 biological replicate (8 brains); n = 3 biological replicates/condition; Student’s t-test for each timepoint). See Extended Data Fig. 4b for immunoblots. d, dsRed protein in whole mount brains at 1 dpi, with (top) or without (bottom) glial ERK-RNAi (representative of n = 7–9 brains per condition). e, Whole mount of dFos-GFP flies. Representative of n = 9–16 brains per condition. f, Whole mount of dJun-GFP flies. Representative of n = 8–13 brains per condition. g, Representative brains at 1 dpi, with (top) or without (bottom) glial puckered upregulation. See Extended Data Fig. 4c for quantification. h, Mean relative expression of AP1 target genes by RT-qPCR at 1 dpi, with or without glial AP1 blocked (WT is w1118; each point = 1 biological replicate, 9 brains; n = 6 biological replicates per condition; Kruskal–Wallis test with Dunn’s test). i, Mean relative expression of AP1 target genes by RT-qPCR at 15 dpi, with or without glial AP1 blocked from 12 dpi (WT is w1118; each point = 1 biological replicate, 9 brains; n = 6 biological replicates/condition; Kruskal–Wallis test with Dunn’s test). j, Post-injury survival with (RU; solid line) or without (vehicle; dashed line) glial AP1 blocked before dTBI (n = 100 per condition, 5 vials of 20 flies; Kaplan-Meier analysis with log-rank comparison). k, Post-injury survival with (RU; solid line) or without (vehicle; dashed line) glial AP1 blocked from 12 dpi (n = 100 per condition, 5 vials of 20 flies; Kaplan-Meier analysis with log-rank comparison). l, Total brain area vacuolized when glial AP1 is blocked before dTBI (left; measured at 1 dpi; interaction p = 4.67e-10, two-way ANOVA with Tukey’s test) or from 12 dpi (right; measured at 20 dpi; interaction p = 0.45, two-way ANOVA with Tukey’s test). Each point = 1 brain; n = 15–18 brains per condition from two independent experiments. m, Representative paraffin sections for brain vacuolization corresponding to 4l. n, Locomotor activity with glial AP1 blocked before (left; 1 dpi; interaction p = 0.028, two-way ANOVA with Tukey’s test) or after dTBI (right; 20 dpi; interaction p = 0.49). Vial height 8 cm; each point = 1 animal; n = 30 animals/condition, from 3 independent experiments. a,c,h-l, and n: black sham, red severe dTBI. Statistical annotations ****p<0.0001, ***p<0.001, **p<0.01, *p<0.05. All statistical tests were two-sided where applicable. Full statistical reporting in Source Data Fig. 4. All scale bars 100μm.
ERK is required for early but not late glial AP1 activity
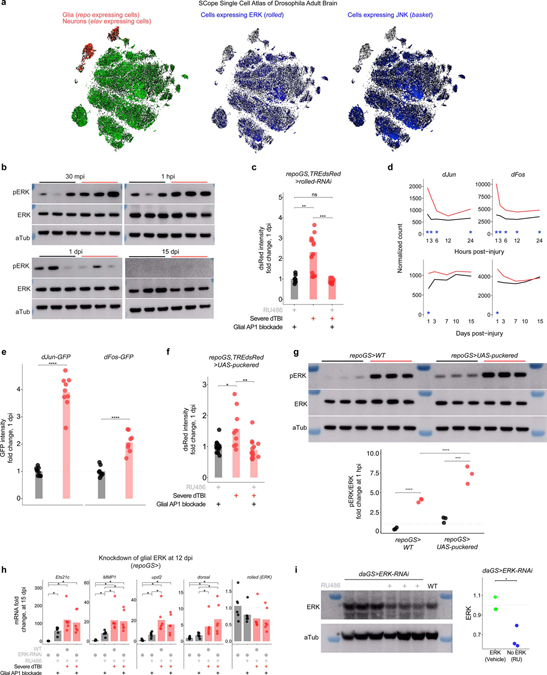
To identify the upstream activator of AP1, we considered the MAPK extracellular signal-regulated kinase, ERK. ERK phosphorylates dFos and dJun at sites distinct from JNK56,57. Rolled, the gene encoding fly ERK, is also detected in a greater a proportion of glia than basket at baseline (Extended Data Fig. 4a). Active pERK and ERK were assessed by western immunoblot after dTBI. pERK/ERK ratios mildly increased at 30 mpi, strongly increased at 1 hpi then normalized by 1 dpi (Fig. 4c; Extended Data Fig. 4b). RNAi knockdown of rolled in glia entirely eliminated cellular dsRed signal (Fig. 4d; Extended Data Fig. 4c). Altogether, these findings indicate ERK is activated by dTBI and is required for activation of glial AP1.
AP1 is a dimer, typically comprised of Fos and Jun. By RNAseq, dFos and dJun expression increased with injury (Extended Data Fig. 4d). GFP-tagged variants of dFos and dJun robustly increased at 1 dpi (Fig. 4e and 4f; Extended Data Fig. 4e), indicating that the protein levels are also increased and suggesting that AP1 is a dFos/dJun heterodimer. To assess the function of these AP1 components, we examined the effects of puckered, a MAPK phosphatase shown to reduce dFos and dJun protein58. As with ERK RNAi, puckered expression in glia eliminated cellular dsRed signal (Fig. 4g; Extended Data Fig. 4f). Puckered did not alter pERK levels, consistent with an effect on AP1 and not ERK activity (Extended Data Fig. 4g). Expression of puckered in glia also suppressed dTBI-induced upregulation of AP1 target genes by RT-qPCR at 1 dpi (Fig. 4h), with the exception of dorsal, which was unexpectedly and strongly upregulated. These data indicate that perturbation of AP1 in glia can abolish select dTBI-induced gene changes.
To determine if AP1 continues to drive gene expression in late injury, we expressed puckered at 12 dpi then assessed AP1 target genes by RT-qPCR at 15 dpi. Gene levels were reduced by more than 50% in dTBI though expression was not restored to sham levels (Fig. 4i). Curiously, dorsal was no longer affected by AP1 blockade in late injury. We also found that eliminating glial ERK in late injury did not affect AP1 target genes (Extended Data Fig. 4h). Although RNAi did not reduce brain ERK mRNA levels, we suspect knockdown was masked, as RNAi driven by a ubiquitous promoter reduced ERK protein in whole flies (Extended Data Fig. 4i). Thus, AP1 appears to drive gene expression chronically in glia, independent of ERK.
Glial AP1 ensures early TBI recovery
The precise role of glia in TBI, whether helpful or harmful, is unclear and may depend on both context and duration of glia activation21. To define the function of AP1 in the early dTBI period (<3 dpi), when glia were strongly hypertrophied and without dsRed+ puncta, we blocked glial AP1 activity via puckered before injury and assessed animal survival. Mean and maximum lifespan were dramatically reduced in dTBI animals lacking glial AP1 activation (Fig. 4j). Curiously, shams were also affected, but only late in age. To distinguish mortality due to a loss of AP1 target genes from other possible effects of puckered, we blocked the AP1 target Ets21c, which was highly expressed in glia after dTBI (Extended Data Fig. 5a). RNAi knockdown of Ets21c in glia phenocopied mortality, resulting in hastened death after dTBI (Extended Data Fig. 5b). Altogether, these findings indicate dTBI would be rapidly lethal in the absence of glial AP1 activation.
Neurodegeneration, which manifests as vacuolization in the fly brain and correlates with reduced locomotor activity, typically progresses gradually after dTBI and in age36. However, blocking glial AP1 with puckered dramatically accelerated degeneration by 1 dpi, with ~50% loss of brain tissue (Fig. 4l and 4m) and an extreme climbing deficit (Fig. 4n). Vacuoles were concentrated in cortical layers rather than the neuropil, suggestive of loss of neuronal cell bodies. Large, coalescent vacuoles formed as early as 30 mpi (not shown), indicating that preventing glial AP1 activation has a remarkable effect to promote neuronal loss and impair locomotor function. We next examined the effects of puckered expression in neurons, given that some neurons appeared dsRed+ after dTBI. Neither brain vacuolization nor animal survival were appreciably altered (Extended Data Fig. 5c and 5d), underscoring a highly specific role for glial AP1. Emphasizing the ERK-specificity of glial AP1 activity in dTBI, targeting glial JNK also had no effect on brain vacuolization (Extended Data Fig. 5e).
We next examined whether AP1 continues to promote recovery through late injury. Glial AP1 was blocked from 12 dpi and outcomes were assessed. Remarkably, there was no effect: neither mortality (Fig. 4k), brain degeneration (Fig. 4l and 4m), nor climbing activity (Fig. 4n) were appreciably altered by late AP1 blockade in dTBI flies. Altogether, these findings suggest glial AP1 is highly protective in early dTBI and without it, brain injury is catastrophic. Yet, despite continued transcriptional activity, AP1 appears dispensable in late dTBI.
Glial AP1 activates with age in healthy brains
As noted, TBI is hypothesized to accelerate normal brain aging processes59,60: survivors develop cognitive impairment and pathology associated with advanced age and are at risk for degenerative disease2,6,61,62. But whether common molecular processes govern the seemingly analogous changes in TBI and in age is unclear.
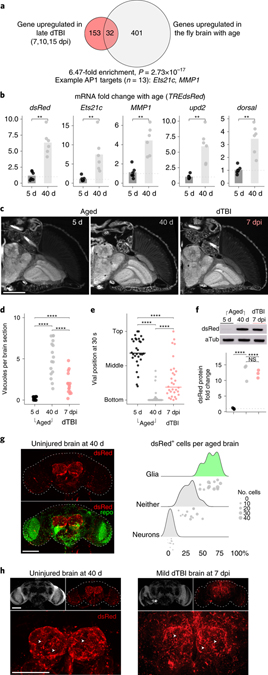
We observed in the PCA analysis of late post-injury RNAseq data (see Fig. 1c) that dTBI survivors were right-shifted compared to shams, suggestive of an “older” transcriptome. To investigate this, we compared genes upregulated in the fly brain with age63 to those upregulated in late dTBI (Fig. 5a). Age-associated genes showed a 6.4-fold enrichment in late injury (Fisher’s exact test, p = 2.73e-17), consistent with premature upregulation of age-associated genes after dTBI. Even more striking, 40% of shared genes were predicted AP1 targets (n = 13/32). A broader analysis of all RNAseq predicted AP1 targets (n=729) revealed at least 17% of all age-upregulated genes are potential AP1 targets (Fisher’s test, 3.95-fold enrichment, p = 8.50e-26). We performed RT-qPCR for dsRed and common AP1 targets in 5 vs 40 d old brains of reporter TREdsRed flies. All assayed genes showed a robust increase with age (mean fold change 2.3–7.4; Fig. 5b), suggesting AP1 activates with normal brain aging.
Fig. 5 |. Age and injury evoke a glial AP1 response.
a, Enrichment of genes upregulated in late dTBI (severe) and with age (0 vs 40 d male) in the fly brain (one-sided Fisher’s exact test). 40% of overlapping genes (13/32) are predicted AP1 targets. b, Mean relative expression of select AP1 target genes mRNA by RT-qPCR in 5 vs 40 d old brains (each point = 1 biological replicate, 9 brains; n = 6 biological replicates per condition; Wilcoxon test and Holm adjustment for each gene). c, Representative paraffin sections showing brain vacuolization in young (5 d), aged (40 d) and injured (7 dpi, mild dTBI) TREdsRed flies. d, Quantification for (c) showing the average number of vacuoles per brain section in young (black), aged (grey) and injured (pink) TREdsRed flies (p = 1.95e-8, Kruskal-Wallis test with Wilcoxon test and Holm adjustment). Each point = 1 animal measured across 5 non-consecutive 2 μm sections. e, Locomotor activity of young, aged, and injured TREdsRed flies (p = 2e-16; one-way ANOVA with Tukey’s test; n = 30 animals per condition, examined over 3 independent experiments). f, Representative protein changes (top) and quantification of dsRed by western immunoblot in TREdsRed flies (each point = 1 biological replicate, 8 brains; p = 2.59e-4; one-way ANOVA with Tukey’s test). d-f, Black symbols, 5 d uninjured; grey symbols, 40 d uninjured; pink symbols, 7 dpi mild dTBI. g, Left, representative z-stacked wholemount uninjured 40 d brain. Right, ridgeline plot, as shown in Figs 3c and 3e, for 40 d brains (each point = 1 brain). h, Representative z-stacked whole mount brains in age (left) and dTBI (right). Not shown is dsRed signal in 5 d uninjured brains, which is identical to shams at 1 dpi (see Fig. 2b). White arrowheads highlight dsRed+ puncta. Statistical annotations are ****p<0.0001, ***p<0.001, **p<0.01, *p<0.05. All statistical tests were two-sided where applicable. For full statistical reporting, including exact p-values, see Source Data Fig. 5. All scale bars 100μm.
We next compared AP1 activity in brains of aged (5 vs 40 d) vs mild dTBI flies (7 dpi), as mild injury produces features reflective of modest brain aging (Fig. 5c–e). Western immunoblot showed similarly increased total dsRed protein with age and after injury (Fig. 5f). Whole mount IF in 40 d old brains further revealed dsRed largely localized to glia in the antenna lobes of aged brains (Fig. 5g), as with dTBI. Remarkably, dsRed+ glia in aged brains morphologically resembled dsRed+ glia in late dTBI, with noticeable dsRed+ puncta throughout the antenna lobes (Fig. 5h). Altogether, these data suggest age and TBI evoke a similar response by glia, marked by morphological dystrophy and AP1 activation.
Chronic glial AP1 activation promotes human tau pathology
Pathological aggregates of hyperphosphorylated tau emerge with age and in age-onset degenerative diseases. Human tau also forms pathologic aggregates in aged flies64. However, tauopathy appears within months following TBI4,6,7,22,65. In TBI patients and animal models, tau pathology colocalizes with chronically activated microglia and astrocytes6,7,22,23,66–69. Thus, we considered that sustained glial AP1 activity after dTBI may promote human tau pathology.
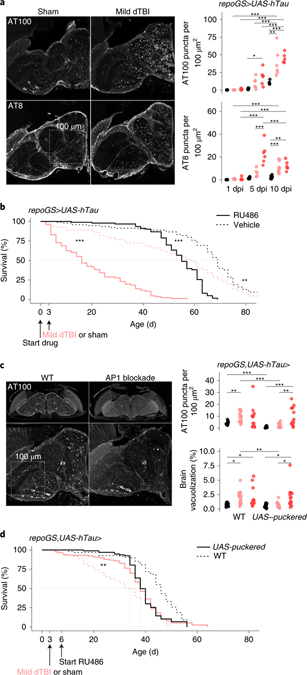
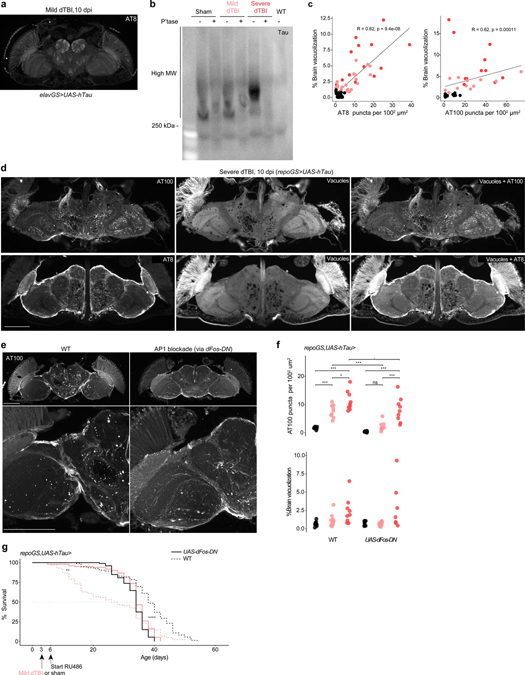
We expressed human wild-type tau (0N4R isoform) in glia and subjected animals to injury. Paraffin embedded heads were examined for phosphorylated tau over time. While 1 dpi showed no immunoreactivity, by 5 dpi, dTBI brains showed dramatic puncta positive for AT100 or AT8, two distinct pathological phosphorylation sites on tau (Fig. 6a). Phospho-tau puncta did not form after injury when tau was expressed in neurons (Extended Data Fig. 6a). Increased puncta upon glial expression coincided with a size shift of tau to a higher molecular weight by semi-denaturing gel electrophoresis; this resolved with phosphatase treatment (Extended Data Fig. 6b) indicating the formation of phosphorylated tau oligomers. There was also a positive correlation between puncta and brain vacuole area (Extended Data Fig. 6c), suggesting tauopathy exacerbates tissue loss. Puncta appeared concentrated around multi-vesicular vacuoles in the neuropil (Extended Data Fig. 6d). The functional impact of tauopathy was assessed in mild injury, as tau was highly toxic with severe dTBI with most animals expiring soon after 10 dpi. Mild dTBI mortality was significantly increased, indicating tau pathology is injurious and exacerbates dTBI (Fig. 6b).
Fig. 6 |. Chronic AP1 activity promotes human tau pathology.
a, Left, representative hemisection of paraffin-embedded heads at 10 dpi, immunostained for tau phosphorylation sites AT100 and AT8. Box illustrates area of 1002 μm2. Right, quantification of the number of AT100+ and AT8+ puncta, represented as puncta per 100 μm2 at 1, 5 and 10 dpi (each point = 1 brain, n = 6 per condition/time pooled from two independent experiments; AT8: p = 6.40e-05, AT100: p=0.000336, two-way ANOVA with Tukey’s test). Black = sham, pink = mild dTBI and red = severe dTBI. b, Post-injury survival with (RU; solid) or without (vehicle; dashed) human tau expression in glia (n = 100 per condition, 5 vials of 20 flies; p < 0.0001, Kaplan-Meier analysis with log-rank comparison). c, Left, representative z-stacked hemisections of paraffin-embedded in WT (left; w1118) or AP1 blocked (right) mild dTBI at 10 dpi, immunostained for AT100. Right, quantification of AT100+ as in 6a (top) and % brain vacuolization (bottom) at 10 dpi without puckered (WT; w1118) or with puckered expression in glia from 3 dpi (each point = 1 brain, n = 12–16 per condition/genotype pooled from two independent experiments; AT100: p=0.0093, brain vacuolization: p=0.068, two-way ANOVA with Tukey’s test). Black = sham, pink = mild dTBI and red = severe dTBI. d, Post-injury survival with (solid) or without (dashed) added puckered expression in glia in the setting of tau expression (n = 100 per condition, 5 vials of 20 flies; p < 0.0001, Kaplan-Meier analysis with log-rank comparison). Statistical annotations are ****p<0.0001, ***p<0.001, **p<0.01, *p<0.05. All statistical tests were two-sided where applicable. For full statistical reporting with exact p-values, see Source Data Fig. 6. All scale bars 100μm. Color code for injury in a and c.
To determine whether glial AP1 activation modulated tauopathy, we perturbed AP1 with puckered. We initiated puckered expression at 3 dpi, when glia begin to exhibit a morphological shift to dystrophy, then quantified AT100 puncta at 10 dpi. Compared to flies expressing tau alone, puckered significantly reduced puncta after mild, but not severe, dTBI (Fig. 6c). Brain vacuolization in mild dTBI brains was also restored to sham levels (Fig. 6c). Blocking glial AP1 partially rescued tauopathy-exacerbated mortality in mild dTBI (Fig. 6d; mean survival, 31 d vs 37 d; median survival, 34 vs 38 d). After this period, mortality increased in both sham and dTBI flies expressing puckered, consistent with earlier findings (see shams in Fig. 4j) that targeting glial AP1 activity is deleterious in aged animals. Of note, tauopathy rescue in mild dTBI may be due to severity-dependent differences in AP1 activity, such that puckered overexpression does not fully block AP1 after severe dTBI (see Fig. 4i). We confirmed these findings with an alternative approach, by blocking glial AP1 via overexpression of a dominant negative dFos (Extended Data Fig. 6e–g). These data indicate that blocking glial AP1 activity during an optimal window after mild dTBI can prevent tauopathy along with associated degenerative and functional consequences.
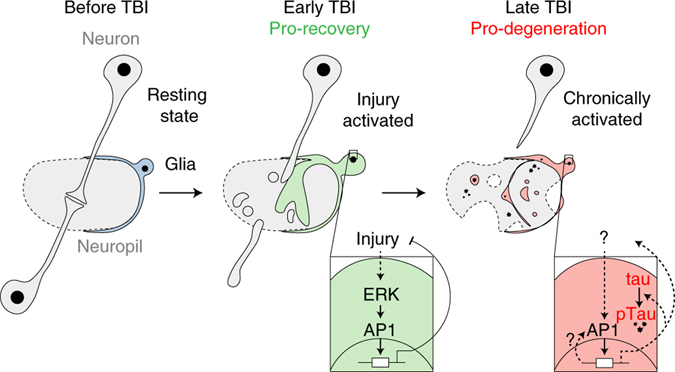
Altogether, these data suggest a model (Fig. 7) in which trauma initiates rapid, ERK-mediated AP1 activation in glia. AP1 then orchestrates a glial response essential for early brain recovery and continued animal survival. However, shortly after injury AP1 becomes functionally dispensable. In fact, continued glial AP1 activation has a toxic interaction with human tau, promoting tauopathy with brain tissue loss and mortality.
Fig. 7 |. Glial AP1 promotes early TBI recovery but chronically drives tauopathy.
Left, simplified fly brain schematic showing an intracortical synapse surrounded by a resting state glial cell. Middle, in the early post-injury period (<3 dpi), ERK activates glial AP1, which orchestrates a gene program vital to injury recovery. Right, sustained AP1 activity fosters a prodegenerative glial state that promotes human tau pathology. Solid lines are known interactions; dashed lines are proposed interactions.
Evidence of AP1 activation after moderate human TBI
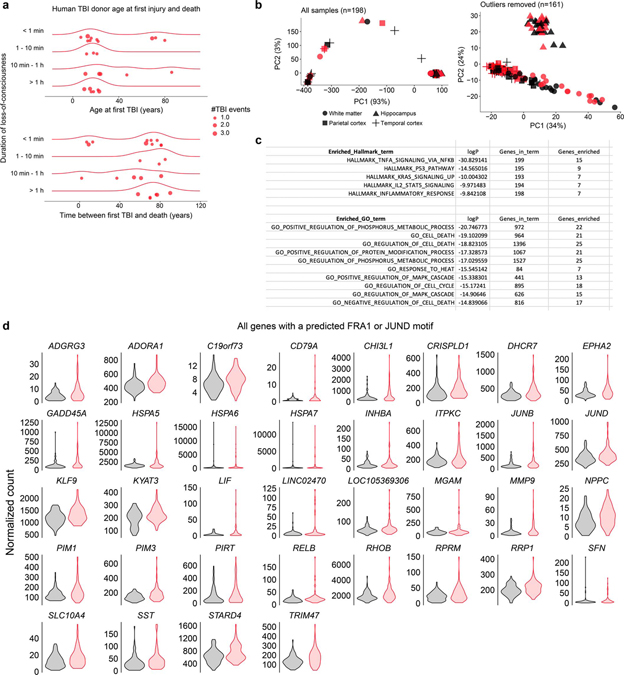
To extend our findings to human TBI, we leveraged RNA-seq and pathology data from the Allen Institute’s Aging, Dementia and TBI study. In contrast to studies focused on CTE-confirmed athletes, donors in this cohort had moderate injury exposure. The majority of injuries occurred before age 30, with loss-of-consciousness lasting less than ten minutes (Extended Data Fig. 7a). All donors were of advanced age (70–100+ years old) and expired from non-TBI causes.
To understand long-term changes following moderate human brain injury, we performed differential gene expression analysis between TBI (n = 80 samples) and non-TBI brains (n = 81 samples). A total of 478 genes were affected (FDR < 0.10; Supplementary Table 7), with more down (n = 359) than upregulated genes (n = 119). Focusing on the upregulated genes, gene set enrichment analysis (GSEA) using the Molecular Signature Data Base’s (MSigDB) Hallmark genes sets revealed the most enriched set as “TNFα signaling via NFkB”. The top ten enriched GO (gene ontology) terms (p < 0.00001; Extended Data Fig. 7c) were dominated by processes relating to MAPK activation and protein modification.
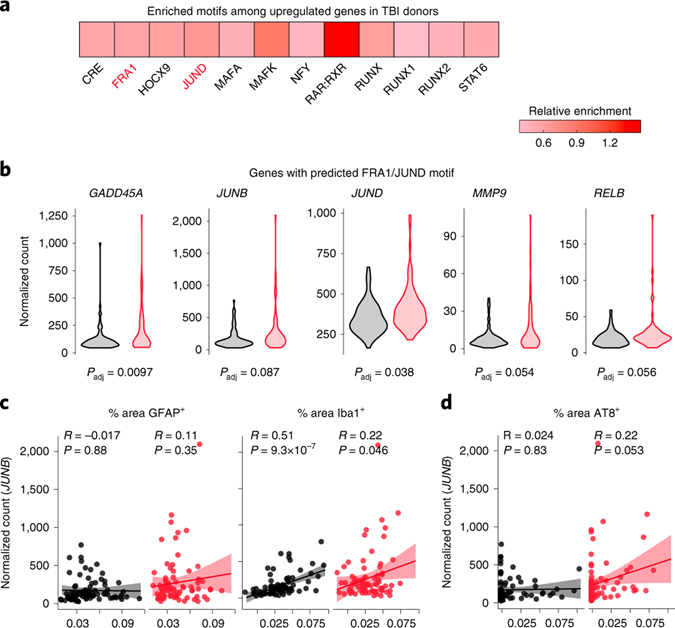
We next identified the transcription factors associated with upregulation genes. Motif enrichment analysis uncovered 12 motifs. Remarkably, two corresponded to AP1 component motifs—FRA1 (fos-related antigen 1) and JUND (Fig. 8a). As seen in dTBI, predicted AP1 targets included a matrix metalloprotease (MMP9) and an NFkB (RELB), as well as members of the heat shock protein family (Fig. 8b; Extended Data Fig. 7d). We also noted upregulation of JUND and JUNB, which could indicate a feed-forward effect to sustain AP1 activation.
Fig. 8 |. AP1 activity decades after moderate TBI in humans.
a, The 12 enriched motifs detected by HOMER among upregulated genes in TBI donors (FDR<0.05), colored by enrichment relative to non-TBI donors. b, Violin plots showing expression of select predicted FRA1/JUND genes in non-TBI (black; n = 81 samples) and TBI (red; n = 80 samples) donors (FDR<0.10). See Extended Data Fig. 8d for all target genes. c, Pearson correlation between JUNB expression and % area GFAP+ versus Iba1+ by IHC in non-TBI (black; n = 81 samples) and TBI (red; n = 80 samples) donors (each point = 1 sample; 95% confidence interval shown; without adjustment for multiple comparison). d, Pearson correlation between JUNB expression and % area AT8+ by IHC in non-TBI (black; n = 81 samples) and TBI (red; n = 80 samples) donors (each point = 1 sample; 95% confidence interval shown).
Given AP1’s glia specific role in fly TBI, we asked if the expression of AP1 targets correlated with glial activation with human TBI. Using JUNB as a proxy gene, as JUNB was among the most highly expressed targets and showed considerable sample variance (see Extended Data Fig. 7d), we tested the correlation between the number of JUNB reads and the abundance of IHC markers of activated microglia (Iba1) and astrocytes (GFAP). Regardless of injury, JUNB levels positively correlated with Iba1 (Fig. 8c), suggesting AP1 activity may generally associate with an activated microglial state.
As glial AP1 promotes human tau pathology after dTBI, we assessed if JUNB levels correlated with tauopathy in humans. Pearson correlation between JUNB levels and AT8 abundance by IHC revealed a near significant positive association in TBI donors (R=0.22, p=0.053; Fig. 8d). Thus, AP1 activity may correlate with tau pathology in human injury. Altogether, these data suggest glial AP1 activation could be a conserved TBI outcome, with implications for disease pathogenesis in humans.
Discussion:
We find that TBI triggers sustained but functionally dynamic glial activity, mediated by the transcriptional complex AP1. In the early post-injury period, AP1 coordinates a protective molecular response that accompanies hypertrophic morphology, akin to glial hypertrophy described in mammalian injury21. Preventing AP1 activation dramatically worsens dTBI outcomes. In sharp contrast, continued glial AP1 activity coincides with a morphological shift, reminiscent of mammalian glial dystrophy, and promotes human tau pathology, degeneration, and death. Altogether, these findings suggest that AP1 activation in glia fulfills both acutely protective but chronically deleterious roles following TBI.
In dTBI, we find that glial AP1 activation is draper and JNK-independent. Thus, the glial response to TBI (this work) and Wallerian degeneration40,51,52 may be distinct. In the latter case, glia sense neuronal injury via the draper/CED-1 family of receptors, and AP1 is activated by JNK. By contrast, TBI is a global trauma that can directly damage neurons and glia, and our findings support AP1 activation by ERK. These data are consistent with distinct roles for JNK and ERK, whereby site-specific phosphorylation of AP1 achieves distinct biological outcomes56,57. TBI and Wallerian degeneration likely converge downstream of AP1 to promote glial phagocytosis41. Critically, Wallerian degeneration does not lead to chronic gliosis or chronic AP1 activation51, as draper-dependent processes terminate the glial response70. These data raise several paths by which TBI may uniquely trigger chronic glial activation.
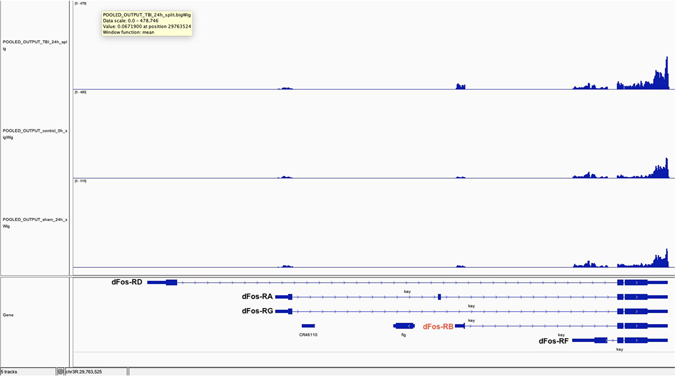
Chronic AP1 activity may be the remnant of an early response that fails to terminate, as with positive feedback loops71, or chronically activate AP1 variants72. Our analysis of human TBI shows a positive association between TBI, pathologic AT8, microglial activation, and activity of JUND/FRA1. Mammalian FRA (fos-related antigen) proteins are stress-induced splice variants of fosB73, are preferentially targeted by ERK, and, unlike immediate early variants cFos/cJun, form chronically active AP1 dimers74. Intriguingly, FRA activity is most robust upon repeated stress74, with implications for repetitive TBI. Though Drosophila lack FRA proteins45, our RNAseq data suggest dTBI upregulates dFos isoform B (Extended Data Fig. 8). Thus, injury-induced AP1 may behave like mammalian FRA.
Exactly how and why glial AP1 promotes tauopathy remains to be determined. AP1 was recently identified as a pioneer factor for cell senescence in vitro75. Thus, sustained AP1 activity may promote glial senescence, a state known to drive tauopathy in Alzheimer’s disease76. Notably, from our analysis of both fly and human TBI, we find that AP1 targets are canonical SASP genes77–79 – including cytokines, matrix metalloproteases, and NFkB. In a mouse AD model, microglial accumulation of c/EBPβ accelerates tauopathy80. c/EBPβ was suggested to interact with AP180, showing an overlap with the process we define. Altogether, these data indicate an emergent role for AP1 in pro-degenerative glial behavior.
TBI has been suggested to promote an advanced age state of the brain62,81. Injury and age evoke abnormal glial states11,22,82–84. Recent work identifies that aged and injured glia are transcriptionally similar12,85,86, though without insight into the factors driving these patterns. Our data indicate that a molecular similarity between TBI and aging may be driven, in part, by glial AP1. We find AP1-related transcriptional and morphological changes in glia of young injured brains and old uninjured brains. Glial AP1 perturbation hastens mortality in aged flies (see Fig. 4j and 6d), as in early dTBI. In age, AP1 may first counter harmful age-onset processes, but chronic activity leads to deleterious pathological and functional consequences.
Overall, our data demonstrate that degenerative disease may not be inevitable consequence of brain trauma, but rather can arise when glia lose molecular homeostasis. Perhaps pathology with age is also preventable by remedying glial dysfunction. Critically, strategies to modulate glial function must balance their necessity to protect neurons with their potentially harmful effects.
Methods:
Fly work and lifespan analysis:
All Drosophila melanogaster strains were maintained on standard cornmeal-molasses medium, flipped to fresh vials every 2 d and housed at 25°C on a 12 h light/dark cycle. For geneSwitch (inducible gal4-UAS)87 experiments, food was prepared with either 100 ul of RU486 (4 mg/ml in 100% EtOH; Sigma-Aldrich, M8046–1G) or vehicle (100% EtOH) pipetted onto food vials and allowed to dry for 24 h. For activating UAS-transgenes prior to injury, adult males were collected at eclosion and aged on RU486 or vehicle food for 3 d, ensuring robust expression. For all experiments, flies were flipped to fresh food vials every 2 d. For lifespan analysis, the number of dead/censored flies was recorded after flipping. See Supplementary Tables 1 and 2 for full experimental and genotype information.
Localized head injury using dTBI model.
The Drosophila TBI (dTBI) paradigm was performed as described36,88. Briefly, adult male flies were collected at eclosion and aged for 3 d. Flies were lightly anesthetized, collar restrained (n = 10 flies/collar) and allowed to recover from anesthesia (5 min) For dTBI injury, flies were individually subjected to closed-head injury at 35% (mild dTBI) or 45% (severe dTBI) head compression via controlled depression of a piezoelectric bar. See reference88 for the detailed step by step dTBI protocol. For sham injury, sibling flies were handled in parallel without head injury. An experimental cohort typically consisted of randomly assigned flies to sibling sham or dTBI, with all sham and dTBI flies collared at the same time and dTBI animals injured at the same time (n = 20 per vial). An independent experiment is defined as sham/dTBI experiments performed with non-sibling flies and independent downstream processing. Experimental animals are always compared with sham or control animals treated and aged in parallel, as detailed88. Flies were maintained on standard cornmeal-molasses medium, flipped to fresh vials every 2 d and housed at 25°C on a 12 h light/dark cycle.
RNAseq experiment, library prep and sequencing.
Severe and sham dTBI flies were injured and collected at 0, 1, 3, 6, 12, 24 h and 3, 7, 10 and 15 d post-injury. Each timepoint had three independent experimental cohorts of n = 20 flies each. dTBI was performed between 09:00 – 12:00 EST to control for potential circadian effects. Whole flies were collected in 15 ml tubes, flash-frozen in liquid nitrogen then vortexed to separate heads from bodies. Total RNA from heads was extracted by TRIzol/Chloroform extraction (ThermoFisher, 15596026) with DNase treatment (ThermoFisher, AM1907). Total RNA integrity was checked by BioAnalyzer (no RIN score for flies). Dual-indexed libraries were generated using TruSeq Stranded mRNA Library Prep Kit with 96 Indices (Illumina, RS-122–2103) following the High Sample protocol. Libraries were prepared in two batches: samples from 0, 1, 3, 7, 10 and 15 d (Library 1) and samples from 0, 1, 3, 6, 12, 24 h (Library 2). Library preparation failed for one 15 dpi dTBI replicate so this sample, along with the matched sham, were excluded from further analyses. To aid bioinformatic correction of batch effects introduced during library prep, libraries were prepped from 0 and 1 d samples twice (Library 1 and 2), using the same total RNA. Library concentration was measured by Qubit and quality checked for insert size and primer-dimer contamination (200–300 bp; TapeStation). Libraries were pooled and sequenced on a NextSeq, using the NextSeq 500/550 High Output Kit v2 with 75 cycles (Illumina, FC4042005).
RNAseq alignment and differential expression analysis.
Demultiplexed reads passing QC filter (Q > 30) were obtained from BaseSpace then merged across sequencing lanes for each sample, with approximately 13–20 million reads total per sample. Single-end reads were aligned to the fly genome using HISAT2 (v2.1.0)89. The HISAT2 index was built from FlyBase’s Drosophila melanogaster reference genome r6.17. Alignment sorted BAM files (samtools v.15) for each sample were merged across sequencing runs (picard)90. Reads that uniquely aligned to exonic regions were counted with HTSeq (v0.9.1)91 with the union setting to produce a count matrix for differential expression analysis using the DESeq292 package in the R environment as follows.
Principal component analysis was used to determine batch effects due to library preparation as follows. First, variance stabilized count data for all samples was visualized with plotPCA (). When samples were colored by library preparation, PC1 was associated with library preparation. Removing library effects with limmaRemoveBatchEffect () restored PC1 and PC2 to injury status and/or time post-injury. Thus, library was included in the DESeq2 design. Libraries prepared twice (0, 1d) did not cluster by condition after batch effect correction thus were treated as biological, not technical, replicates. To identify differentially expressed genes at each time post-injury, samples were reclassified into groups based on injury condition and post-injury time (i.e: TBI_15dpi, TBI_1dpi). The design model formula was “~library + group”. Pairwise comparisons were made between sham and dTBI samples at each time using “contrast=c(“group”), with an alpha cutoff of 0.05 with lfcShrink() applied.
Motif and pathway enrichment analyses.
De novo motif enrichment analysis was performed with HOMER’s (v.4.11.1)93 findMotifs.pl using the provided fly promoter set. All default parameters were used with the following exceptions: promoter region (−1000, 300 bp from TSS) and background promoter frequency. Background promoter frequency was derived from our RNAseq data and consisted of all expressed genes (non-zero read count; n = 16,201). Enrichment for de novo motifs was performed on significantly up or down-regulated genes at each time post-injury. Motifs passing a false positive cutoff (p < 1.0e-10) were matched to the best-known Drosophila motif or motif binding factor. Motif target genes were obtained using HOMER’s annotatePeaks.pl. Enrichment for KEGG and Reactome pathways was determined using the interactive online tool FlyMine94. Curated gene sets were analyzed for pathway enrichment with Benjamini-Hochberg correction, using the same RNAseq defined background gene set.
Real-time quantitative PCR (RT-qPCR).
Total RNA was isolated from dissected brains (n = 9 brains per experimental cohort) by RNeasy Mini Kit (Qiagen, 74104), with on-column removal of genomic DNA (Qiagen, 79254). Complementary DNA was prepared from total RNA (Applied Biosystems, 4368814) then quantified by Qubit ssDNA Assay (Invitrogen, Q10212). qPCR reactions were set up using Fast SYBR Green reagents (ThermoFisher, 4385612), 384-well plates, 20 ng of cDNA per reaction, and analyzed on a ViiA 7 Real-Time PCR System (Applied Biosystems). Relative expression was determined using the ΔΔCT method. For each sample, mean CT values were determined from 2–3 technical replicates. ΔCT was determined relative to the housekeeping gene, RpL32, which was unaffected by dTBI according to RNAseq data. ΔΔCT was then calculated as fold-change relative to the control group noted in the Fig. legend. qPCR primers were sourced from FlyPrimerBank95 or prior publications, BLAST against the fly (and human) genome was used for specificity and primers were optimized by serial dilution curve and melt curve analysis. See Supplementary Table 3 for primer information.
Whole mount brain immunofluorescence.
Fly brains were dissected in cold phosphate buffered saline (PBS), as described96. Brains were fixed in 4% paraformaldehyde in PBS for 55 min at room temperature (RT) then permeabilized overnight in 0.5% Triton-X in PBS (PBST) at 4°C. Genotypes with TREdsRed, MREdsRed, or UAS-mCD8-GFP were imaged without further antibody staining. Brains were blocked with 5% normal goat serum in PBST for 1h at RT then incubated with 1° antibody overnight at 4°C (see Supplementary Table 3 for antibody information). Brains were washed in PBST then incubated with fluorescently conjugated 2° antibody for 1 h at RT. See Supplementary Table 4 for antibody information. Brains were counterstained with Hoechst (0.10 mg/ml in PBS) for 15 min, cleared in mounting media (20 mM Tris pH 8.0, 0.5% N-propyl gallate, 80% glycerol, PBS), mounted and cover slipped. Brains were imaged by confocal microscopy (Leica DM 6000 CS) with identical laser power and gain settings across experiments. For whole brain imaging, images were acquired throughout the full brain at 2 μM steps, 1024×1024 resolution by 10X, 20X (dry) or 60X (oil) objectives. For dsRed quantification, dsRed was measured in FIJI as raw integrated density in scaled images of the z-stacked brain. For colocalization of dsRed with repo and elav, nucleated dsRed+ cells were counted using the cell counter feature. Colocalization with repo or elav was determined. Image acquisition and analysis was performed blind to sample identity.
Western immunoblot.
Brains were rapidly dissected in cold PBS (n = 8 per biological replicate), then homogenized in 5 ul sample buffer per brain (1x Laemmli Buffer [Bio-Rad, 161–0737], 1x cOmplete mini EDTA-free protease inhibitor cocktail, 1 mM PMSF [Sigma, P7626], 50 μl BME [Sigma,M6250]). Samples were denatured (98°C for 3 min) prior to loading onto 4–12% Bis-Tris gel. Volume equivalent of 1 brain per sample was run in 1x MES buffer, transferred to 0.45 μM nitrocellulose membrane overnight by electrophoresis. Membranes were stained by Ponceau S to confirm transfer. Membranes were blocked in 3% bovine serum albumin in 1X Tris-Buffered Saline, 0.1% Tween® 20 Detergent (TBST), incubated in primary antibody overnight at 4°C. See Supplementary Table 4 for antibody information. Blots were incubated with 1:5000 dilution of species-appropriate HRP-conjugated secondary antibody for 1 h at RT, then detected by ECL (Cytiva (Formerly GE Healthcare Life Sciences), RPN2232) using an Amersham Imager 600. Quantification was performed in FIJI by ROI. Sample protein was normalized to the loading control alpha Tubulin.
Paraffin embedding of fly heads and brain vacuole quantification:
Heads were rapidly decapitated under anesthesia then fixed in Bouin’s solution (Sigma-Aldrich, HT10132) for 5 d. Fixation was terminated by submersion in leaching buffer (50mM Tris pH 8.0, 150mM NaCl) for 1 h at RT. Heads were then processed through graded EtOH dehydration at the following times and concentrations: 30 min 70%, 30 min 90%, 30 min 95%, 30 min 100%, 30 min 100%, followed by xylenes (2x, 30 min) and finally fixed in paraffin. Heads were blocked and sectioned into 8 uM thick ribbons. Ribbons were deparaffinized by heating at 65°C for 1 h followed by washes in histoclear I and II (VWR; 101412–876, 10141–8822) for 5 min. For assessing brain vacuolization, sections were mounted with Cytoseal XYL (ThermoFisher, 8312–4). Sections were imaged on a Leica DFC360 FX under 10x objective, 1.2x magnification with fixed exposure settings. Fly brain tissue is auto-fluorescent for pigmented eyes thus signal was detected using an I3 filter cube. Brain vacuolization was quantified in FIJI as follows: for each brain, vacuolized area and total brain area were averaged across 5 non-consecutive sections (every 3rd section) to determine % of brain vacuolization. Vacuole area was set by manual thresholding. For data shown in Fig. 6d, total number of vacuoles (rather than vacuole area) was determined by averaging the number of vacuoles across 5 non-consecutive brain sections (every 3rd section) across the same brain level for all samples. Image acquisition and analyses were performed blind to sample identity.
Immunofluorescence on paraffin sections.
Sections were rehydrated to water as follows: 100% EtOH for 3 min, 100% EtOH for 3 min, 95% EtOH for 1 min, 80% EtOH for 1 min, H2O for 5 min. Antigen retrieval was performed by boiling slides in citric acid buffer (Vector; H-3300) at 95°C for 40 min. Sections were then permeabilized in PBS with 0.1% Tween-20 (PBSTw), blocked in 3% bovine serum albumin (BSA) for 1 h at RT then incubated in 1° antibody overnight at 4°C. Sections were washed (2x, PBSTw) then incubated in 2° antibody for 1 h at RT. See Supplementary Table 4 for antibody information. Sections were washed in PBSTw, rinsed in deionized water then coverslipped with mounting media. For phospho-tau puncta quantification, sections were imaged on a Leica DFC360 FX under a 10x objective, 1.2x magnification and identical exposure settings. Puncta were counted in FIJI using the cell counter. Puncta were counted in one brain hemisphere across 5 non-consecutive sections (every 3rd section) across the same brain level for all samples to calculate puncta per 1002 μM2. High resolution representative images were acquired using a 20x and 60x objective (oil immersion) on a Leica DM6000 CS. Image acquisition and analysis was performed blind to sample identity.
Climbing Assay.
Flies were single-housed in empty vials and allowed to acclimate for 30 min. Climbing was measured by tapping flies to the bottom of the vial then recording height climbed after 30 s. Climbing height for each animal was assessed in FIJI and averaged across 3 trials taken with a 3 min testing interval. Data expressed as % of max vial height of 8 cm.
Phosphatase shift assay with SDD-AGE.
Whole flies (n = 30 per condition) were flash frozen then vortexed to collect heads. Tissue was homogenized in 100 μl cold RIPA buffer (Pierce, 8990) supplemented with cOmplete mini EDTA-free protease inhibitor cocktail (Roche, 11836170001). Protein abundance was measured by Qubit. Samples were diluted to 4 μg/μl then split into two 50 μg samples (treated and untreated). Phosphatase treated samples were enzymatically treated for 3 h at 37°C shaking (1.25 μl 10 μM MnCl2, 1.25 μl 20X NEB buffer, 2.5 μl lambda phosphatase enzyme). Samples were run on 1.5% agarose gel with 0.1% SDS at 100 mV. Protein was transferred to 0.45 μM nitrocellulose membrane overnight97. Membrane was then processed by immunoblotting as above. See Supplementary Table 4 for antibody information.
Human TBI analysis.
All human data were obtained from the public repository for the Allen Institute for Brain Science’s Aging, Dementia and Traumatic Brain Injury study98,99. Pathology data for brain samples from male donors (n = 191 samples, n = 59 unique donors; see Extended Data Fig. 7a for donor injury and age information) was downloaded. Corresponding RNAseq data was obtained as aligned BAM files. Exonic read counts were calculated using the R package Rsubread (GTF file was GRCh38.p2). Differential gene expression analysis (FDR < 0.10) was performed in DESeq2 as above, with the following modifications. Model design (injury + brain region) was determined after principal component analysis. PCA revealed extreme outliers without an obvious pattern (n = 37; see Extended Data Fig. 7b). Removal resulted in all samples clustering by brain region along PC1 and PC2, allowing for inclusion of samples from distinct brain regions from the same donor (n = 161; 80 non-TBI and 81 TBI samples). Motif enrichment analysis against known motifs was performed using HOMER. Enriched molecular signature data base (mSigdB) gene sets and gene ontology terms were obtained from HOMER’s hypergeometric comparison (p < 1.0e-7).
Statistical analyses and data visualization.
All statistical analyses and data visualization were performed in the bash (RNAseq alignment and HOMER analysis) or R environment using RStudio and the following packages: annotables, biomaRt, cowplot, DESeq2, ggplot2, ggrepel, ggridges, ggsignif, ggpubr, homerkit, lawstat, RColorBrewer, RBase, survminer, tidyverse. Specific tests are indicated in the Fig. legends. Data were analyzed by either parametric or non-parametric tests based on the sample size, homogeneity of variance (Levene’s test) and normality (Shapiro-Wilks test).
Extended Data
Extended Data Fig 1 |. A lasting AP1 transcriptional response to TBI.
a, Kaplan-Meier survival curve for 10 and 15 dpi RNAseq replicates. b, Venn diagram showing the number of common and distinct differentially expressed genes (FDR<0.05) between post-injury times. Value in parenthesis shows total (up and down) number of DE genes for a given timepoint. c, Results for HOMER de novo motif enrichment among downregulated genes (FDR<0.05). d, Tile plot showing Reactome pathways enriched among upregulated genes with a predicted AP1 motif (FDR<0.05). Presence of a colored tile indicates enrichment at a given post-injury time. Tile opacity encodes significance. Color corresponds to the parent process, as defined by the Reactome annotation database (annotated on left). e, Average sham (black) and severe dTBI (red) expression of genes related to the heat shock response at ≤1 dpi (top) and ≥1 dpi (bottom; blue star indicates FDR < 0.05 at a given time). f, Average sham (black) and severe dTBI (red) expression of canonical stress response genes at ≤1 dpi (top) and ≥1 dpi (bottom; blue star indicates FDR < 0.05 at a given time). See Supplementary Table 1 for genotypes.
Extended Data Fig. 2 |. Sustained and severity-dependent activation of AP1.
a, Representative z-stacked whole mount brains at 1 dpi in flies with dsRed expressed under a mutated TRE-promoter (MREdsRed; representative of n = 9 – 11 brains per condition from two independent experiments). b, Mean relative expression of select RNAseq predicted AP1 genes by RT-qPCR at 1, 7 and 15 dpi across injury conditions (each point = 1 biological replicate, 9 dissected brains; n = 6 biological replicates per condition; Kruskal–Wallis test with Dunn’s multiple comparison test and Holm adjustment for each gene). Black symbols, sham. Pink symbols, mild dTBI. Red symbols, severe dTBI. Statistical annotations are ****p<0.0001, ***p<0.001, **p<0.01, *p<0.05, .<p<0.10. All scale bars 100 μm. See Supplementary Table 1 for genotypes.
Extended Data Fig. 3 |. Glial AP1 activation is draper and JNK-independent.
a, Representative z-stack of the first 6 slices (2 μm each) of the antennal lobe in flies with (RU; top) and without (vehicle; bottom) draper-RNAi in glia. White arrows highlight hypertrophic glial processes. Image shown is 1 day after 3rd antennal segment ablation (abbreviated AL injury; images are representative of n = 7 – 9 brains per condition). b, Left, representative z-stacked whole mount brains at 1 day post-dTBI with (RU; top) and without (vehicle; bottom) draper-RNAi in glia. Right, quantification of dsRed immunofluorescence fold change, relative to left most condition (each point = 1 brain; n = 11 – 14 brains per condition pooled from two independent experiments; p = 2.17e-06, Kruskal–Wallis test with Wilcoxon rank sum test). c, Mean relative expression of dsRed and draper mRNA by RT-qPCR at 1 dpi, with or without glial draper-RNAi (each point = 1 biological replicate, 9 dissected brains; n = 6 biological replicates per condition; Kruskal–Wallis test with Dunn’s multiple comparison test and Holm adjustment). d, Average sham (black) and severe dTBI (red) expression of draper from RNAseq experiment at ≤1 dpi (top) and ≥1 dpi (bottom; blue star indicates FDR < 0.05 at a given time). e, Representative whole mount IF for lysotracker signal at 1 dpi after severe dTBI in WT (top; w1118) and draper−/− flies (middle: dTBI; bottom: sham). Right, quantification of lysotracker immunofluorescence fold change, relative to left most condition (each point = 1 brain; n = 7 – 11 brains per condition pooled from two independent experiments; p = 0.00072, Kruskal–Wallis test with Dunn’s multiple comparison test and Holm adjustment). f, Western immunoblots for all replicates of Fig. 4a. Samples are biological replicates. WT is w1118. g, Quantification of dsRed immunofluorescence fold change for representative whole mount brains shown in Fig. 4b, relative to left most condition (each point = 1 brain; n = 9–10 brains per condition pooled from two independent experiments; p = 0.000238, Kruskal–Wallis test with Wilcoxon rank sum test). h, Mean relative expression of basal dsRed and basket mRNA by RT-qPCR in 3 d old whole flies, with (blue) or without JNK (green) RNAi expressed under a ubiquitous driver, daughterlessGeneSwitch (each point = 1 biological replicate, 20 whole flies; Student’s t-test).
a-g, Black symbols, sham Red symbols, severe dTBI. Statistical annotations are ****p<0.0001, ***p<0.001, **p<0.01, *p<0.05. All scale bars 100μm. See Supplementary Table 1 for genotypes.
Extended Data Fig. 4 |. AP1 activation requires ERK.
a, Images from Scope Single Cell Atlas of the Drosophila adult brain showing relative expression levels of repo, elav, rolled (ERK), and basket (JNK). ERK is detected in a greater proportion of repo+ cells than JNK. b, Western immunoblots for all replicates of Fig. 4c. Samples are biological replicates. Genotype is TREdsRed. c, Quantification of dsRed immunofluorescence fold change for representative whole mount brains shown in Fig. 4d, relative to leftmost condition (each point = 1 brain; n = 9–15 brains per condition pooled from two independent experiments; p = 6.08e-7, one-way ANOVA with Tukey’s test). d, RNAseq data showing average sham (black) and severe dTBI (red) expression of dFos and dJun at ≤1 dpi (top) and ≥1 dpi (bottom; blue star indicates FDR < 0.05 at a given time). e, Quantification of dJun-GFP (left) and dFos-GFP (right) immunofluorescence fold change for representative whole mount brains shown in Fig. 4e and 4f, relative to sham (each point = 1 brain; n = 7–10 brains per condition pooled from two independent experiments; Student’s t-test for each genotype). f, Quantification of dsRed immunofluorescence fold change for representative whole mount brains shown in Fig. 4g, relative to leftmost condition (each point = 1 brain; n = 9–15 brains per condition pooled from two independent experiments; p = 0.0040, one-way ANOVA with Tukey’s test). g, Glial expression of the MAPK phosphatase, puckered, does not reduce pERK levels at 1 hpi. Left, full western blots. Right, quantification of pERK/ERK ratio by western immunoblot (each point = 1 biological replicate, 8 dissected brains; n = 3 biological replicates per condition/genotype; p = 0.0159, two-way ANOVA). h, Mean relative expression of AP1 target genes by RT-qPCR at 15 dpi, with or without ERK knockdown in glia via RNAi beginning at 12 dpi (each point = 1 biological replicate, 9 dissected brains; n = 6 biological replicates per condition; Kruskal–Wallis test with Dunn’s multiple comparison test and Holm adjustment). i, Western immunoblot for ERK protein in whole flies with (blue) or without (green) ERK-RNAi expressed under an inducible ubiquitous promoter (daughterless-geneSwitch). Right, quantification (each point = 1 biological replicate, 8 whole flies; Student’s t-test).
b-h, Black symbols, sham. Red symbols, severe dTBI. Statistical annotations are ****p<0.0001, ***p<0.001, **p<0.01, *p<0.05. See Supplementary Table 1 for genotypes.
Extended Data Fig. 5 |. Glial AP1 is required for TBI recovery.
a, Representative z-stacked whole mount brains focused on the central brain at 1 dpi in flies expressing a GFP-tagged variant of the AP1 target gene, Ets21c. Ets21c-GFP is detected in a handful of neurons at baseline but is dramatically upregulated in glia by 1 dpi (representative of n = 11–15 brains per condition, two independent experiments). b, Post-injury survival with (RU; dashed line) or without (vehicle; solid line) Ets21c-RNAi expressed in glia (n = 100 per condition, 5 vials of 20 flies; p < 0.0001, Kaplan-Meier analysis with log-rank comparison). c, Representative brain vacuolization at 1 dpi under sham and dTBI conditions, with (RU) or without (vehicle) JNK RNAi expression in glia. Quantification on right, expressed as % of total brain area that is vacuolized (each point = 1 brain; n = 9–10 brains per condition; two-way ANOVA revealed a non-significant interaction but a significant effect of dTBI, p = 6.1e-05). d, Representative brain vacuolization at 1 dpi under sham and dTBI conditions, with (RU) or without (vehicle) puckered expression in neurons. Quantification on right, expressed as % of total brain area that is vacuolized (each point = 1 brain; n = 18–19 brains per condition pooled from two independent experiments; two-way ANOVA revealed a non-significant interaction but a significant effect of dTBI, p = 3.55e-06).e, Post-injury survival with (RU; dashed line) or without (vehicle; solid line) puckered expression in neurons (n = 100 per condition, 5 vials of 20 flies; p < 0.0001, Kaplan-Meier analysis with log-rank comparison).
Black symbols, sham. Red symbols, severe dTBI. Statistical annotations are ****p<0.0001, ***p<0.001, **p<0.01, *p<0.05. All scale bars 100μm. See Supplementary Table 1 for genotypes.
Extended Data Fig. 6 |. Sustained glial AP1 activity drives human tau pathology.
a, Representative section of paraffin-embedded head at 10 dpi stained for AT8 when human tau is expressed in neurons (representative of n = 7 animals). b, Membrane immunostained for human tau in phosphatase treated (+) and untreated (−) protein samples isolated from the heads of 5 dpi (repoGS>0N4R) or WT (w1118) flies (n = 30 per sample). c, Spearman correlation between percentage of total brain area vacuolized and number of AT8+ puncta (top) or AT100+ puncta (bottom) at 5 and 10 dpi (combined) in sham, mild or severe dTBI. Data shown is an alternative representation of Fig. 6a. d, Representative sections of paraffin embedded heads immunostained for AT100 (top row) or AT8 (bottom row), highlighting the concentration of phosphorylated tau puncta in neuropil and around vacuoles. Vacuoles are visualized by autofluorescence. e, Representative z-stacked hemisections of paraffin-embedded in WT (left; w1118) or AP1 blocked (right) mild dTBI at 10 dpi, immunostained for AT100. AP1 was blocked by expressing a dominant negative variant of dFos (dFos-DN). f, Quantification of AT00+ puncta (top) and % brain vacuolization (bottom) at 10 dpi with (UAS-dFos-DN) or without AP1 blockade (WT) in glia from 3 dpi (each point = 1 brain, n = 9–10 per condition/genotype pooled from two independent experiments; AT100: p=0.051, brain vacuolization: p=0.072, two-way ANOVA with Tukey’s test). g, Post-injury survival with (solid) or without (dashed) dFos-DN expression in glia in the setting of tau expression (n = 100 per condition, 5 vials of 20 flies; p < 0.0001, Kaplan-Meier analysis with log-rank comparison).
Black symbols, sham. Pink symbols, mild dTBI. Red symbols, severe dTBI. Statistical annotations are ****p<0.0001, ***p<0.001, **p<0.01, *p<0.05. All scale bars 100μm. See Supplementary Table 1 for genotypes.
Extended Data Fig. 7 |. Evidence of AP1 activity decades after moderate human TBI.
a, TBI exposure history for donors; the same data is visualized two ways. Top shows age at first TBI, with most injuries occurring before age 30. Donors are further separated by duration of loss-of-consciousness. Total lifetime TBI events for each donor are shown by point size. Bottom shows the duration of time between first TBI and death. b, PCA of all samples (left) compared PCA of samples with outliers removed (right). Each point represents 1 tissue sample. Shape encodes brain region. Black symbols, non-TBI samples. Red symbols, TBI samples. c, Top 5 Molecular Signature Data Base (MSigDb) Hallmark gene sets and top 10 gene ontology (GO) terms enriched among upregulated genes (FDR<0.10) in TBI donors. d, Violin plots showing expression of all predicted FRA1/JUND genes in non-TBI (black; n samples = 81) and TBI (red; n samples = 80) exposed donors (FDR < 0.10).
Extended Data Fig. 8 |.
Aligned bigWig files (IGV; aligned to Fly Base d. mel r6.17) for severe dTBI (top row) and sham injury at 24 hpi (bottom row), along with controls (0h; middle row), at the dFos locus (Fly gene name kay or kayak). With dTBI, reads map to dFos-RB, which encodes isoform B.
Supplementary Material
Acknowledgements:
We thank G. Donahue for early guidance on analyzing RNAseq data; V. Lee and S. Narasimhan for helpful discussions on tau; R. Bonasio, L. Goodman, E. Lee, A. Perlegos, and K. Simeonov for manuscript feedback; F. Carranza and Z. Jin for technical assistance; M. Kayser, G. Ming, and D. Meany for helpful thesis feedback; S. Lindquist for continued inspiration; This work was supported by T32-AG000255, F31-NS111868 (to CNB), a predoctoral Howard Hughes Medical Institute fellowship (to JS), and R35-NS097275 (to NMB).
Footnotes
Declaration of Interests: The authors declare no competing interests.
Data Availability:
The differential gene expression lists generated in this study are included in this published article (Supplementary Tables 5–7). dTBI sequencing data (fastq files and HTseq counts) that support the findings of this study have been deposited in Gene Expression Omnibus (GEO accession GSE171185). Additional data that support the findings of this study are available from the corresponding author upon reasonable request.
References:
- 1.Corkin S, Rosen TJ, Sullivan EV & Clegg RA Penetrating head injury in young adulthood exacerbates cognitive decline in later years. J Neurosci 9, 3876–3883 (1989). [DOI] [PMC free article] [PubMed] [Google Scholar]
- 2.Gardner RC et al. Dementia risk after traumatic brain injury vs nonbrain trauma: the role of age and severity. JAMA Neurol 71, 1490–1497, doi: 10.1001/jamaneurol.2014.2668 (2014). [DOI] [PMC free article] [PubMed] [Google Scholar]
- 3.Smith DH, Johnson VE & Stewart W Chronic neuropathologies of single and repetitive TBI: substrates of dementia? Nat Rev Neurol 9, 211–221, doi: 10.1038/nrneurol.2013.29 (2013). [DOI] [PMC free article] [PubMed] [Google Scholar]
- 4.McKee AC et al. Chronic traumatic encephalopathy in athletes: progressive tauopathy after repetitive head injury. J Neuropathol Exp Neurol 68, 709–735, doi: 10.1097/NEN.0b013e3181a9d503 (2009). [DOI] [PMC free article] [PubMed] [Google Scholar]
- 5.Mackay DF et al. Neurodegenerative Disease Mortality among Former Professional Soccer Players. New Engl J Med 381, 1801–1808, doi: 10.1056/NEJMoa1908483 (2019). [DOI] [PMC free article] [PubMed] [Google Scholar]
- 6.Johnson VE, Stewart W & Smith DH Widespread tau and amyloid-beta pathology many years after a single traumatic brain injury in humans. Brain Pathol 22, 142–149, doi: 10.1111/j.1750-3639.2011.00513.x (2012). [DOI] [PMC free article] [PubMed] [Google Scholar]
- 7.Tagge CA et al. Concussion, microvascular injury, and early tauopathy in young athletes after impact head injury and an impact concussion mouse model. Brain 141, 422–458, doi: 10.1093/brain/awx350 (2018). [DOI] [PMC free article] [PubMed] [Google Scholar]
- 8.Rubenstein R et al. Comparing Plasma Phospho Tau, Total Tau, and Phospho Tau-Total Tau Ratio as Acute and Chronic Traumatic Brain Injury Biomarkers. JAMA Neurol 74, 1063–1072, doi: 10.1001/jamaneurol.2017.0655 (2017). [DOI] [PMC free article] [PubMed] [Google Scholar]
- 9.Zanier ER et al. Induction of a transmissible tau pathology by traumatic brain injury. Brain 141, 2685–2699, doi: 10.1093/brain/awy193 (2018). [DOI] [PMC free article] [PubMed] [Google Scholar]
- 10.Hickman S, Izzy S, Sen P, Morsett L & El Khoury J Microglia in neurodegeneration. Nat Neurosci 21, 1359–1369, doi: 10.1038/s41593-018-0242-x (2018). [DOI] [PMC free article] [PubMed] [Google Scholar]
- 11.Liu L et al. Glial lipid droplets and ROS induced by mitochondrial defects promote neurodegeneration. Cell 160, 177–190, doi: 10.1016/j.cell.2014.12.019 (2015). [DOI] [PMC free article] [PubMed] [Google Scholar]
- 12.Habib N et al. Disease-associated astrocytes in Alzheimer’s disease and aging. Nat Neurosci 23, 701–706, doi: 10.1038/s41593-020-0624-8 (2020). [DOI] [PMC free article] [PubMed] [Google Scholar]
- 13.Liu CC et al. ApoE4 Accelerates Early Seeding of Amyloid Pathology. Neuron 96, 1024–1032 e1023, doi: 10.1016/j.neuron.2017.11.013 (2017). [DOI] [PMC free article] [PubMed] [Google Scholar]
- 14.Zhao Y et al. TREM2 Is a Receptor for beta-Amyloid that Mediates Microglial Function. Neuron 97, 1023–1031 e1027, doi: 10.1016/j.neuron.2018.01.031 (2018). [DOI] [PMC free article] [PubMed] [Google Scholar]
- 15.Paolicelli RC et al. TDP-43 Depletion in Microglia Promotes Amyloid Clearance but Also Induces Synapse Loss. Neuron 95, 297–308 e296, doi: 10.1016/j.neuron.2017.05.037 (2017). [DOI] [PMC free article] [PubMed] [Google Scholar]
- 16.Heckmann BL et al. LC3-Associated Endocytosis Facilitates beta-Amyloid Clearance and Mitigates Neurodegeneration in Murine Alzheimer’s Disease. Cell 178, 536–551 e514, doi: 10.1016/j.cell.2019.05.056 (2019). [DOI] [PMC free article] [PubMed] [Google Scholar]
- 17.Ising C et al. NLRP3 inflammasome activation drives tau pathology. Nature 575, 669–673, doi: 10.1038/s41586-019-1769-z (2019). [DOI] [PMC free article] [PubMed] [Google Scholar]
- 18.Venegas C et al. Microglia-derived ASC specks cross-seed amyloid-beta in Alzheimer’s disease. Nature 552, 355–361, doi: 10.1038/nature25158 (2017). [DOI] [PubMed] [Google Scholar]
- 19.Narasimhan S et al. Pathological Tau Strains from Human Brains Recapitulate the Diversity of Tauopathies in Nontransgenic Mouse Brain. J Neurosci 37, 11406–11423, doi: 10.1523/JNEUROSCI.1230-17.2017 (2017). [DOI] [PMC free article] [PubMed] [Google Scholar]
- 20.Asai H et al. Depletion of microglia and inhibition of exosome synthesis halt tau propagation. Nat Neurosci 18, 1584–1593, doi: 10.1038/nn.4132 (2015). [DOI] [PMC free article] [PubMed] [Google Scholar]
- 21.Jassam YN, Izzy S, Whalen M, McGavern DB & El Khoury J Neuroimmunology of Traumatic Brain Injury: Time for a Paradigm Shift. Neuron 95, 1246–1265, doi: 10.1016/j.neuron.2017.07.010 (2017). [DOI] [PMC free article] [PubMed] [Google Scholar]
- 22.Johnson VE et al. Inflammation and white matter degeneration persist for years after a single traumatic brain injury. Brain 136, 28–42, doi: 10.1093/brain/aws322 (2013). [DOI] [PMC free article] [PubMed] [Google Scholar]
- 23.Cherry JD et al. Microglial neuroinflammation contributes to tau accumulation in chronic traumatic encephalopathy. Acta Neuropathol Commun 4, 112, doi: 10.1186/s40478-016-0382-8 (2016). [DOI] [PMC free article] [PubMed] [Google Scholar]
- 24.Collins-Praino LE & Corrigan F Does neuroinflammation drive the relationship between tau hyperphosphorylation and dementia development following traumatic brain injury? Brain Behav Immun 60, 369–382, doi: 10.1016/j.bbi.2016.09.027 (2017). [DOI] [PubMed] [Google Scholar]
- 25.Freibaum BD et al. GGGGCC repeat expansion in C9orf72 compromises nucleocytoplasmic transport. Nature 525, 129–133, doi: 10.1038/nature14974 (2015). [DOI] [PMC free article] [PubMed] [Google Scholar]
- 26.Zhang K et al. The C9orf72 repeat expansion disrupts nucleocytoplasmic transport. Nature 525, 56–61, doi: 10.1038/nature14973 (2015). [DOI] [PMC free article] [PubMed] [Google Scholar]
- 27.Marsh JL & Thompson LM Drosophila in the study of neurodegenerative disease. Neuron 52, 169–178, doi: 10.1016/j.neuron.2006.09.025 (2006). [DOI] [PubMed] [Google Scholar]
- 28.Bier E Drosophila, the golden bug, emerges as a tool for human genetics. Nat Rev Genet 6, 9–23, doi: 10.1038/nrg1503 (2005). [DOI] [PubMed] [Google Scholar]
- 29.Bellen HJ, Tong C & Tsuda H 100 years of Drosophila research and its impact on vertebrate neuroscience: a history lesson for the future. Nat Rev Neurosci 11, 514–522, doi: 10.1038/nrn2839 (2010). [DOI] [PMC free article] [PubMed] [Google Scholar]
- 30.Warrick JM et al. Suppression of polyglutamine-mediated neurodegeneration in Drosophila by the molecular chaperone HSP70. Nat Genet 23, 425–428, doi: 10.1038/70532 (1999). [DOI] [PubMed] [Google Scholar]
- 31.Auluck PK, Chan HY, Trojanowski JQ, Lee VM & Bonini NM Chaperone suppression of alpha-synuclein toxicity in a Drosophila model for Parkinson’s disease. Science 295, 865–868, doi: 10.1126/science.1067389 (2002). [DOI] [PubMed] [Google Scholar]
- 32.Wittmann CW et al. Tauopathy in Drosophila: neurodegeneration without neurofibrillary tangles. Science 293, 711–714, doi: 10.1126/science.1062382 (2001). [DOI] [PubMed] [Google Scholar]
- 33.Frost B, Hemberg M, Lewis J & Feany MB Tau promotes neurodegeneration through global chromatin relaxation. Nat Neurosci 17, 357–366, doi: 10.1038/nn.3639 (2014). [DOI] [PMC free article] [PubMed] [Google Scholar]
- 34.Steffan JS et al. Histone deacetylase inhibitors arrest polyglutamine-dependent neurodegeneration in Drosophila. Nature 413, 739–743, doi: 10.1038/35099568 (2001). [DOI] [PubMed] [Google Scholar]
- 35.Fernandez-Funez P et al. Identification of genes that modify ataxin-1-induced neurodegeneration. Nature 408, 101–106, doi: 10.1038/35040584 (2000). [DOI] [PubMed] [Google Scholar]
- 36.Saikumar J, Byrns CN, Hemphill M, Meaney DF & Bonini NM Dynamic neural and glial responses of a head-specific model for traumatic brain injury in Drosophila. Proc Natl Acad Sci U S A, doi: 10.1073/pnas.2003909117 (2020). [DOI] [PMC free article] [PubMed] [Google Scholar]
- 37.Shah EJ, Gurdziel K & Ruden DM Mammalian Models of Traumatic Brain Injury and a Place for Drosophila in TBI Research. Front Neurosci 13, 409, doi: 10.3389/fnins.2019.00409 (2019). [DOI] [PMC free article] [PubMed] [Google Scholar]
- 38.Freeman MR Drosophila Central Nervous System Glia. Cold Spring Harb Perspect Biol 7, doi: 10.1101/cshperspect.a020552 (2015). [DOI] [PMC free article] [PubMed] [Google Scholar]
- 39.Kremer MC, Jung C, Batelli S, Rubin GM & Glia GU The glia of the adult Drosophila nervous system. The glia of the adult Drosophila nervous system, doi: 10.1002/glia.23115 (2017). [DOI] [PMC free article] [PubMed] [Google Scholar]
- 40.Lu T-Y et al. Axon degeneration induces glial responses through Draper-TRAF4-JNK signalling. Nature communications 8, 14355, doi: 10.1038/ncomms14355 (2017). [DOI] [PMC free article] [PubMed] [Google Scholar]
- 41.Purice MD et al. A novel Drosophila injury model reveals severed axons are cleared through a Draper/MMP-1 signaling cascade. eLife 6, doi: 10.7554/eLife.23611 (2017). [DOI] [PMC free article] [PubMed] [Google Scholar]
- 42.Hess J, Angel P & Schorpp-Kistner M AP-1 subunits: quarrel and harmony among siblings. J Cell Sci 117, 5965–5973, doi: 10.1242/jcs.01589 (2004). [DOI] [PubMed] [Google Scholar]
- 43.Perkins KK, Dailey GM & Tjian R Novel Jun- and Fos-related proteins in Drosophila are functionally homologous to enhancer factor AP-1. EMBO J 7, 4265–4273 (1988). [DOI] [PMC free article] [PubMed] [Google Scholar]
- 44.Perkins KK, Admon A, Patel N & Tjian R The Drosophila Fos-related AP-1 protein is a developmentally regulated transcription factor. Genes Dev 4, 822–834, doi: 10.1101/gad.4.5.822 (1990). [DOI] [PubMed] [Google Scholar]
- 45.Kockel L, Homsy JG & Bohmann D Drosophila AP-1: lessons from an invertebrate. Oncogene 20, 2347–2364, doi: 10.1038/sj.onc.1204300 (2001). [DOI] [PubMed] [Google Scholar]
- 46.Külshammer E et al. Interplay among Drosophila transcription factors Ets21c, Fos and Ftz-F1 drives JNK-mediated tumor malignancy. Disease models & mechanisms 8, 1279–1293, doi: 10.1242/dmm.020719 (2015). [DOI] [PMC free article] [PubMed] [Google Scholar]
- 47.Toggweiler J, Willecke M & Basler K The transcription factor Ets21C drives tumor growth by cooperating with AP-1. Scientific reports 6, 34725, doi: 10.1038/srep34725 (2016). [DOI] [PMC free article] [PubMed] [Google Scholar]
- 48.Chatterjee N & Bohmann D A Versatile ΦC31 Based Reporter System for Measuring AP-1 and Nrf2 Signaling in Drosophila and in Tissue Culture. PLoS ONE 7, doi: 10.1371/journal.pone.0034063 (2012). [DOI] [PMC free article] [PubMed] [Google Scholar]
- 49.Streit WJ, Khoshbouei H & Bechmann I Dystrophic microglia in late-onset Alzheimer’s disease. Glia 68, 845–854, doi: 10.1002/glia.23782 (2020). [DOI] [PubMed] [Google Scholar]
- 50.Streit WJ, Sammons NW, Kuhns AJ & Sparks DL Dystrophic microglia in the aging human brain. Glia 45, 208–212, doi: 10.1002/glia.10319 (2004). [DOI] [PubMed] [Google Scholar]
- 51.MacDonald JM et al. The Drosophila cell corpse engulfment receptor Draper mediates glial clearance of severed axons. Neuron 50, 869–881 (2006). [DOI] [PubMed] [Google Scholar]
- 52.Macdonald JM, Doherty J, Hackett R & Freeman MR The c-Jun kinase signaling cascade promotes glial engulfment activity through activation of draper and phagocytic function. Cell Death Differ 20, 1140–1148, doi: 10.1038/cdd.2013.30 (2013). [DOI] [PMC free article] [PubMed] [Google Scholar]
- 53.Doherty J et al. PI3K signaling and Stat92E converge to modulate glial responsiveness to axonal injury. PLoS Biol 12, e1001985, doi: 10.1371/journal.pbio.1001985 (2014). [DOI] [PMC free article] [PubMed] [Google Scholar]
- 54.Angel P & Karin M The role of Jun, Fos and the AP-1 complex in cell-proliferation and transformation. Biochim Biophys Acta 1072, 129–157, doi: 10.1016/0304-419x(91)90011-9 (1991). [DOI] [PubMed] [Google Scholar]
- 55.Karin M The regulation of AP-1 activity by mitogen-activated protein kinases. J Biol Chem 270, 16483–16486, doi: 10.1074/jbc.270.28.16483 (1995). [DOI] [PubMed] [Google Scholar]
- 56.Ciapponi L, Jackson DB, Mlodzik M & Bohmann D Drosophila Fos mediates ERK and JNK signals via distinct phosphorylation sites. Genes Dev 15, 1540–1553, doi: 10.1101/gad.886301 (2001). [DOI] [PMC free article] [PubMed] [Google Scholar]
- 57.Kockel L, Zeitlinger J, Staszewski LM, Mlodzik M & Bohmann D Jun in Drosophila development: redundant and nonredundant functions and regulation by two MAPK signal transduction pathways. Genes Dev 11, 1748–1758, doi: 10.1101/gad.11.13.1748 (1997). [DOI] [PubMed] [Google Scholar]
- 58.Dobens LL, Martin-Blanco E, Martinez-Arias A, Kafatos FC & Raftery LA Drosophila puckered regulates Fos/Jun levels during follicle cell morphogenesis. Development 128, 1845–1856 (2001). [DOI] [PubMed] [Google Scholar]
- 59.Crane PK et al. Association of Traumatic Brain Injury With Late-Life Neurodegenerative Conditions and Neuropathologic Findings. JAMA Neurol 73, 1062–1069, doi: 10.1001/jamaneurol.2016.1948 (2016). [DOI] [PMC free article] [PubMed] [Google Scholar]
- 60.Cole JH, Leech R, Sharp DJ & Alzheimer’s Disease Neuroimaging I Prediction of brain age suggests accelerated atrophy after traumatic brain injury. Ann Neurol 77, 571–581, doi: 10.1002/ana.24367 (2015). [DOI] [PMC free article] [PubMed] [Google Scholar]
- 61.Moretti L et al. Cognitive decline in older adults with a history of traumatic brain injury. Lancet Neurol 11, 1103–1112, doi: 10.1016/S1474-4422(12)70226-0 (2012). [DOI] [PubMed] [Google Scholar]
- 62.Nordstrom A & Nordstrom P Traumatic brain injury and the risk of dementia diagnosis: A nationwide cohort study. PLoS Med 15, e1002496, doi: 10.1371/journal.pmed.1002496 (2018). [DOI] [PMC free article] [PubMed] [Google Scholar]
- 63.Pacifico R, MacMullen CM, Walkinshaw E, Zhang X & Davis RL Brain transcriptome changes in the aging Drosophila melanogaster accompany olfactory memory performance deficits. PLoS One 13, e0209405, doi: 10.1371/journal.pone.0209405 (2018). [DOI] [PMC free article] [PubMed] [Google Scholar]
- 64.Colodner KJ & Feany MB Glial fibrillary tangles and JAK/STAT-mediated glial and neuronal cell death in a Drosophila model of glial tauopathy. J Neurosci 30, 16102–16113, doi: 10.1523/JNEUROSCI.2491-10.2010 (2010). [DOI] [PMC free article] [PubMed] [Google Scholar]
- 65.Schmidt ML, Zhukareva V, Newell KL, Lee VM & Trojanowski JQ Tau isoform profile and phosphorylation state in dementia pugilistica recapitulate Alzheimer’s disease. Acta Neuropathol 101, 518–524, doi: 10.1007/s004010000330 (2001). [DOI] [PubMed] [Google Scholar]
- 66.McKee AC, Abdolmohammadi B & Stein TD The neuropathology of chronic traumatic encephalopathy. Handb Clin Neurol 158, 297–307, doi: 10.1016/B978-0-444-63954-7.00028-8 (2018). [DOI] [PubMed] [Google Scholar]
- 67.McKee AC, Stein TD, Kiernan PT & Alvarez VE The neuropathology of chronic traumatic encephalopathy. Brain Pathol 25, 350–364, doi: 10.1111/bpa.12248 (2015). [DOI] [PMC free article] [PubMed] [Google Scholar]
- 68.Blennow K, Hardy J & Zetterberg H The neuropathology and neurobiology of traumatic brain injury. Neuron 76, 886–899, doi: 10.1016/j.neuron.2012.11.021 (2012). [DOI] [PubMed] [Google Scholar]
- 69.Velazquez A, Ortega M, Rojas S, Gonzalez-Olivan FJ & Rodriguez-Baeza A Widespread microglial activation in patients deceased from traumatic brain injury. Brain Inj 29, 1126–1133, doi: 10.3109/02699052.2015.1018325 (2015). [DOI] [PubMed] [Google Scholar]
- 70.Logan MA et al. Negative regulation of glial engulfment activity by Draper terminates glial responses to axon injury. Nat Neurosci 15, 722–730, doi: 10.1038/nn.3066 (2012). [DOI] [PMC free article] [PubMed] [Google Scholar]
- 71.Szuts D & Bienz M An autoregulatory function of Dfos during Drosophila endoderm induction. Mech Dev 98, 71–76, doi: 10.1016/s0925-4773(00)00455-x (2000). [DOI] [PubMed] [Google Scholar]
- 72.Nestler EJ FosB: a transcriptional regulator of stress and antidepressant responses. Eur J Pharmacol 753, 66–72, doi: 10.1016/j.ejphar.2014.10.034 (2015). [DOI] [PMC free article] [PubMed] [Google Scholar]
- 73.Chen J, Kelz MB, Hope BT, Nakabeppu Y & Nestler EJ Chronic Fos-related antigens: stable variants of deltaFosB induced in brain by chronic treatments. J Neurosci 17, 4933–4941 (1997). [DOI] [PMC free article] [PubMed] [Google Scholar]
- 74.Nestler EJ, Kelz MB & Chen J DeltaFosB: a molecular mediator of long-term neural and behavioral plasticity. Brain Res 835, 10–17, doi: 10.1016/s0006-8993(98)01191-3 (1999). [DOI] [PubMed] [Google Scholar]
- 75.Martinez-Zamudio RI et al. AP-1 imprints a reversible transcriptional programme of senescent cells. Nat Cell Biol 22, 842–855, doi: 10.1038/s41556-020-0529-5 (2020). [DOI] [PMC free article] [PubMed] [Google Scholar]
- 76.Bussian TJ et al. Clearance of senescent glial cells prevents tau-dependent pathology and cognitive decline. Nature 562, 578–582, doi: 10.1038/s41586-018-0543-y (2018). [DOI] [PMC free article] [PubMed] [Google Scholar]
- 77.Sharpless NE & Sherr CJ Forging a signature of in vivo senescence. Nat Rev Cancer 15, 397–408, doi: 10.1038/nrc3960 (2015). [DOI] [PubMed] [Google Scholar]
- 78.Gorgoulis V et al. Cellular Senescence: Defining a Path Forward. Cell 179, 813–827, doi: 10.1016/j.cell.2019.10.005 (2019). [DOI] [PubMed] [Google Scholar]
- 79.Chien Y et al. Control of the senescence-associated secretory phenotype by NF-kappaB promotes senescence and enhances chemosensitivity. Genes Dev 25, 2125–2136, doi: 10.1101/gad.17276711 (2011). [DOI] [PMC free article] [PubMed] [Google Scholar]
- 80.Ndoja A et al. Ubiquitin Ligase COP1 Suppresses Neuroinflammation by Degrading c/EBPbeta in Microglia. Cell, doi: 10.1016/j.cell.2020.07.011 (2020). [DOI] [PubMed] [Google Scholar]
- 81.Wood RL Accelerated cognitive aging following severe traumatic brain injury: A review. Brain Inj 31, 1270–1278, doi: 10.1080/02699052.2017.1332387 (2017). [DOI] [PubMed] [Google Scholar]
- 82.Shahidehpour RK et al. Dystrophic microglia are associated with neurodegenerative disease and not healthy aging in the human brain. Neurobiol Aging 99, 19–27, doi: 10.1016/j.neurobiolaging.2020.12.003 (2021). [DOI] [PMC free article] [PubMed] [Google Scholar]
- 83.Ramlackhansingh AF et al. Inflammation after trauma: microglial activation and traumatic brain injury. Ann Neurol 70, 374–383, doi: 10.1002/ana.22455 (2011). [DOI] [PubMed] [Google Scholar]
- 84.Marschallinger J et al. Lipid-droplet-accumulating microglia represent a dysfunctional and proinflammatory state in the aging brain. Nat Neurosci 23, 194–208, doi: 10.1038/s41593-019-0566-1 (2020). [DOI] [PMC free article] [PubMed] [Google Scholar]
- 85.Sheng L et al. Social reprogramming in ants induces longevity-associated glia remodeling. Sci Adv 6, eaba9869, doi: 10.1126/sciadv.aba9869 (2020). [DOI] [PMC free article] [PubMed] [Google Scholar]
- 86.Hammond TR et al. Single-Cell RNA Sequencing of Microglia throughout the Mouse Lifespan and in the Injured Brain Reveals Complex Cell-State Changes. Immunity 50, 253–271 e256, doi: 10.1016/j.immuni.2018.11.004 (2019). [DOI] [PMC free article] [PubMed] [Google Scholar]
- 87.Osterwalder T, Yoon KS, White BH & Keshishian H A conditional tissue-specific transgene expression system using inducible GAL4. Proc Natl Acad Sci U S A 98, 12596–12601, doi: 10.1073/pnas.221303298 (2001). [DOI] [PMC free article] [PubMed] [Google Scholar]
- 88.Saikumar J et al. Inducing different severities of traumatic brain injury in Drosophila using a piezoelectric actuator. Nat Protoc 16, 263–282, doi: 10.1038/s41596-020-00415-y (2021). [DOI] [PMC free article] [PubMed] [Google Scholar]
- 89.Kim D, Langmead B & Salzberg SL HISAT: a fast spliced aligner with low memory requirements. Nat Methods 12, 357–360, doi: 10.1038/nmeth.3317 (2015). [DOI] [PMC free article] [PubMed] [Google Scholar]
- 90.“Picard Toolkit”. Broad Institute, GitHub Repository. (2019). [Google Scholar]
- 91.Anders S, Pyl PT & Huber W HTSeq--a Python framework to work with high-throughput sequencing data. Bioinformatics 31, 166–169, doi: 10.1093/bioinformatics/btu638 (2015). [DOI] [PMC free article] [PubMed] [Google Scholar]
- 92.Love MI, Huber W & Anders S Moderated estimation of fold change and dispersion for RNA-seq data with DESeq2. Genome Biol 15, 550, doi: 10.1186/s13059-014-0550-8 (2014). [DOI] [PMC free article] [PubMed] [Google Scholar]
- 93.Heinz S et al. Simple combinations of lineage-determining transcription factors prime cis-regulatory elements required for macrophage and B cell identities. Mol Cell 38, 576–589, doi: 10.1016/j.molcel.2010.05.004 (2010). [DOI] [PMC free article] [PubMed] [Google Scholar]
- 94.Lyne R et al. FlyMine: an integrated database for Drosophila and Anopheles genomics. Genome Biol 8, R129, doi: 10.1186/gb-2007-8-7-r129 (2007). [DOI] [PMC free article] [PubMed] [Google Scholar]
- 95.Hu Y et al. FlyPrimerBank: an online database for Drosophila melanogaster gene expression analysis and knockdown evaluation of RNAi reagents. G3 (Bethesda) 3, 1607–1616, doi: 10.1534/g3.113.007021 (2013). [DOI] [PMC free article] [PubMed] [Google Scholar]
- 96.Tito AJ, Cheema S, Jiang M & Zhang S A Simple One-step Dissection Protocol for Whole-mount Preparation of Adult Drosophila Brains. J Vis Exp, doi: 10.3791/55128 (2016). [DOI] [PMC free article] [PubMed] [Google Scholar]
- 97.Halfmann R & Lindquist S Screening for amyloid aggregation by Semi-Denaturing Detergent-Agarose Gel Electrophoresis. J Vis Exp, doi: 10.3791/838 (2008). [DOI] [PMC free article] [PubMed] [Google Scholar]
- 98.Allen Institute for Brain Science. Aging, Dementia and TBI. Available from: https://aging.brain-map.org/overview/home. (© 2016).
- 99.Miller JA et al. Neuropathological and transcriptomic characteristics of the aged brain. Elife 6, doi: 10.7554/eLife.31126 (2017). [DOI] [PMC free article] [PubMed] [Google Scholar]
Associated Data
This section collects any data citations, data availability statements, or supplementary materials included in this article.
Supplementary Materials
Data Availability Statement
The differential gene expression lists generated in this study are included in this published article (Supplementary Tables 5–7). dTBI sequencing data (fastq files and HTseq counts) that support the findings of this study have been deposited in Gene Expression Omnibus (GEO accession GSE171185). Additional data that support the findings of this study are available from the corresponding author upon reasonable request.


