Abstract
Breast cancers are complex ecosystems of malignant cells and the tumour microenvironment1. The composition of these tumour ecosystems and interactions within them contribute to responses to cytotoxic therapy2. Efforts to build response predictors have not incorporated this knowledge. We collected clinical, digital pathology, genomic and transcriptomic profiles of pre-treatment biopsies of breast tumours from 168 patients treated with chemotherapy with or without HER2 (encoded by ERBB2)-targeted therapy before surgery. Pathology end points (complete response or residual disease) at surgery3 were then correlated with multi-omic features in these diagnostic biopsies. Here we show that response to treatment is modulated by the pre-treated tumour ecosystem, and its multi-omics landscape can be integrated in predictive models using machine learning. The degree of residual disease following therapy is monotonically associated with pre-therapy features, including tumour mutational and copy number landscapes, tumour proliferation, immune infiltration and T cell dysfunction and exclusion. Combining these features into a multi-omic machine learning model predicted a pathological complete response in an external validation cohort (75 patients) with an area under the curve of 0.87. In conclusion, response to therapy is determined by the baseline characteristics of the totality of the tumour ecosystem captured through data integration and machine learning. This approach could be used to develop predictors for other cancers.
Subject terms: Breast cancer, Chemotherapy, Tumour biomarkers, Data integration, Translational research
Integration of pre-treatment tumour features in predictive models using machine learning could inform on response to therapy.
Main
Neoadjuvant treatment, that is, systemic therapy (chemotherapy with or without targeted therapy) administered before surgery, is increasingly used in the management of breast cancer to improve rates of breast-conserving surgery and increase survival4. However, many patients do not have a good response3,5. Features associated with response to neoadjuvant therapy have been derived from clinical6, molecular7–12 and digital pathology analysis13,14. However, these studies have been frequently small, combined data from patients receiving different treatments and used single platform profiling that fails to capture the complexity of the tumour ecosystem. Unsurprisingly, physicians continue to select patients for neoadjuvant therapies using empirical clinical risk-stratification15.
Tumour ecosystems are increasingly recognized as major determinants of treatment response2 and we hypothesized that improved prediction models need to account for tumours as complex ecosystems, comprising communities of malignant clones within a microenvironment of stromal, vascular and immune cell types that are perturbed by therapy.
Here we characterized biological parameters extracted from a prospective neoadjuvant study that collected detailed pre-therapy tumour multi-omic data and associated these with eventual response. We found that malignant cell, immune activation and evasion features were associated with treatment response. These features, derived from clinicopathological variables, digital pathology and DNA and RNA sequencing, were used as input into an ensemble machine learning approach to generate predictive models. We validated the accuracy of the predictive models in independent, external cohorts and demonstrated that the best performers integrated clinicopathological and molecular data. The overall approach is widely applicable to other cancers and can be customized to include both fewer and newer features.
Multi-platform profiling of tumour biopsies
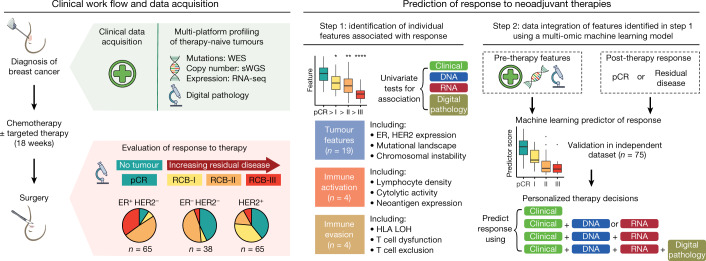
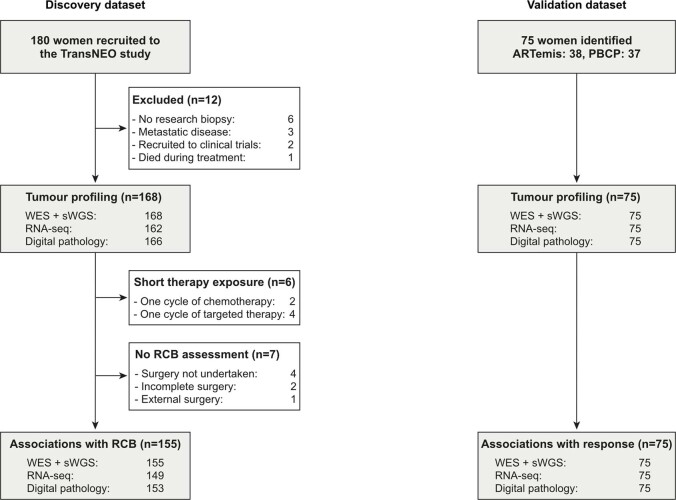
We prospectively enrolled 180 women with early and locally advanced breast cancer undergoing neoadjuvant treatment into a molecular profiling study (TransNEO) (Fig. 1, the cohort characteristics are summarized in Supplementary Table 1). Fresh-frozen pre-treatment core tumour biopsies were collected from 168 cases using ultrasound guidance (Extended Data Fig. 1). DNA and RNA were extracted and profiled by shallow whole-genome sequencing (168 samples), whole-exome sequencing (168 samples) and RNA sequencing (162 cases). The diagnostic core biopsy haematoxylin and eosin-stained slides from 166 cases were digitized. The tumours sampled (n = 168) included all major subtypes of breast cancer. Chemotherapy (block-sequential taxane and anthracycline) was administered for a median of 18 weeks (6 cycles) in 145 cases; 22 cases received a taxane (in combination with carboplatin in 3 cases and cyclophosphamide in 13 cases) and 1 case received an anthracycline in combination with cyclophosphamide. Two patients received only one cycle owing to drug toxicities (Supplementary Table 1). Patients with HER2+ tumours (n = 65) received a median of three cycles of anti-HER2 therapy in combination with a taxane. Response was assessed at surgery using the residual cancer burden (RCB) classification3,5 (Extended Data Fig. 2a, b). On completion of neoadjuvant treatment, in the 161 cases with RCB assessment, 42 (26%) had a pathological complete response (pCR), 25 (16%) had a good response (RCB-I), 65 (40%) had a moderate response (RCB-II) and 29 (18%) had extensive residual disease (RCB-III).
Fig. 1. Overview of the study design.
Pre-therapy breast tumours from 168 patients were profiled using DNA sequencing and RNA sequencing (RNA-seq) and digital pathology analysis. Response was assessed on completion of neoadjuvant therapy using the RCB classification. Individual pre-therapy clinical, molecular and digital pathology features associated with pCR were identified and integrated within machine learning models to predict responses, which were then validated in an independent dataset. sWGS, shallow whole-genome sequencing; WES, whole-exome sequencing.
Extended Data Fig. 1. Summary of cases analysed within this study.
180 women were recruited to the TransNEO neoadjuvant breast cancer study. Tumour profiling was performed in 168 cases and associations with response identified in 155 cases who received more than one cycle of neoadjuvant chemotherapy or targeted therapy. 147 cases had a complete molecular/digital pathology dataset, received more than one cycle of chemotherapy and targeted therapy and had an RCB assessment available: data from these cases were used to build a machine learning predictor of response to neoadjuvant therapy. Validation was performed across a cohort of 75 cases recruited to the ARTemis and Personalised Breast Cancer (PBCP) studies.
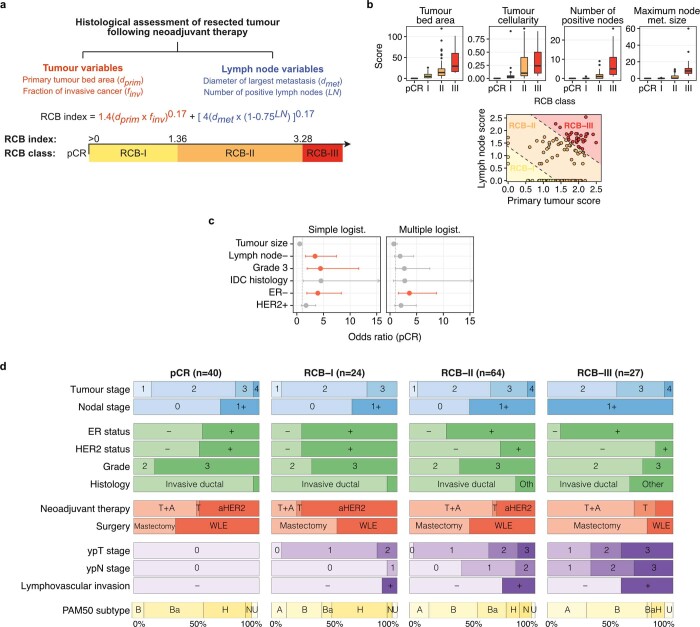
Extended Data Fig. 2. Calculation of the Residual Cancer Burden index and associations between clinical features and response.
a, Tumour and lymph node histological features used to calculate the continuous Residual Cancer Burden (RCB) index and categorical RCB class. Increasing RCB index denotes increasing burden of residual disease post-neoadjuvant therapy and increasing chemoresistance. b, Top: Box plots showing distribution of tumour and lymph node histological features in n = 161 cases with clinical data and RCB assessment across the RCB classes. The box bounds the interquartile range divided by the median, with the whiskers extending to a maximum of 1.5 times the interquartile range beyond the box. Outliers are shown as dots. Bottom: distribution of primary tumour score and lymph node score across RCB classes. c, Associations of clinical variables with pCR using simple and multiple logistic regression. Significant associations (P < 0.05, logistic regression) are shown in red. The measure of centre is the parameter estimate and error bars represent 95% confidence intervals. d, Distribution of tumour features across RCB classes: pre-operative staging (blue), pre-operative histological features (green), neoadjuvant therapy (red, T: taxane, A: anthracycline, aHER2: anti-HER2 therapy), surgical approach (red, WLE: wide local excision), post-operative tumour (ypT) and nodal (ypN) staging and lymphovascular invasion (purple) and PAM50 subtypes (yellow, A: Luminal A, B: Luminal B, Ba: Basal, H: HER2-enriched, N: Normal-like, U: Unknown). Tumours with RCB assessment and adequate therapy exposure only included (more than 1 cycle of chemotherapy or anti-HER2 therapy received, n = 155).
Clinical phenotypes are limited predictors
The clinical features individually associated with pCR (Extended Data Fig. 2c, d; univariable logistic regression) included tumour grade (odds ratio (OR): 4.2, confidence interval (CI): 1.8–11, false discovery rate (FDR) = 0.009), ER− receptor status (OR: 4.2, CI: 2–9.1, FDR = 0.002) and absence of lymph node involvement at diagnosis (OR: 3, CI: 1.4–6.6, FDR = 0.01). When all of these variables were combined by multiple logistic regression, only ER− status was associated with pCR (OR: 3.8,CI: 1.6–9.2, FDR = 0.009), but there was response heterogeneity (for example, 55% of ER− tumours did not attain pCR).
Genomic landscapes associate with response
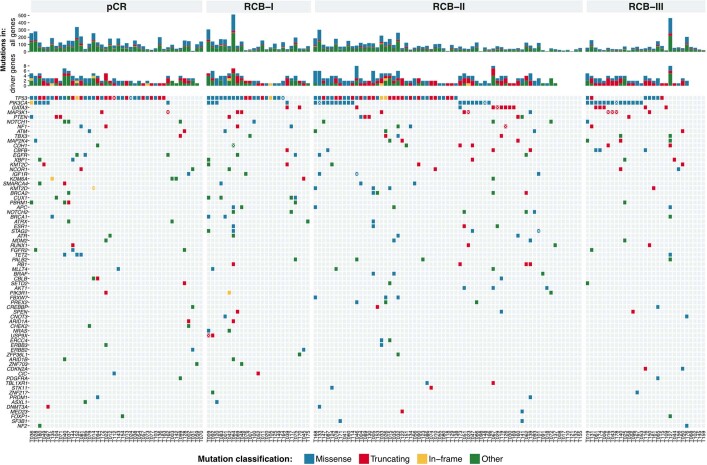
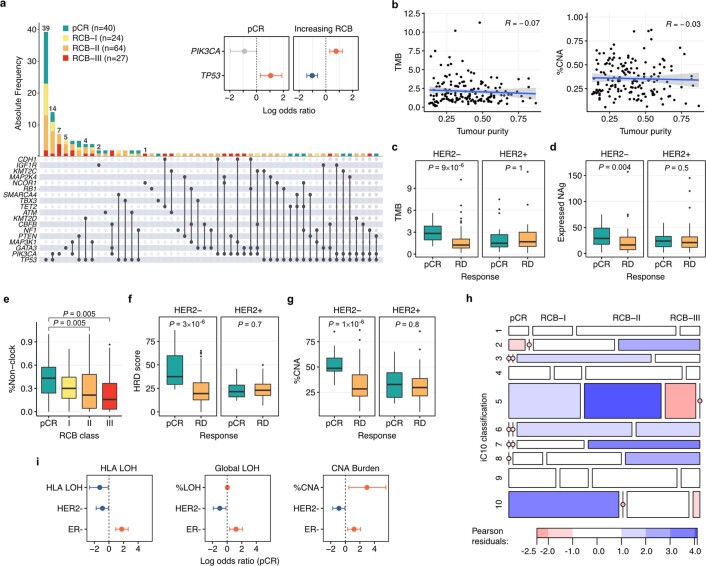
Whole-exome sequencing (n = 168 tumours) identified 16,134 somatic mutations (Supplementary Table 2), with the highest frequency in driver genes, including TP53 (n = 96, 57%), PIK3CA (n = 44, 26%), GATA3 (n = 16, 10%) and MAP3K1 (n = 13, 8%) (Extended Data Figs. 3, 4a). TP53 mutations were associated with pCR (OR: 2.9, CI: 1.3–6.6, P = 0.01; Extended Data Fig. 4a), as previously reported7, whereas PIK3CA mutations were associated with residual disease (OR: 2.1, CI: 1.3–3.4, P = 0.002).
Extended Data Fig. 3. The somatic mutational driver landscape of tumours prior to neoadjuvant therapy.
Oncoprint showing somatic mutations in breast cancer driver gene identified using WES. Cases classified by RCB class. Multiple mutations in a case are denoted by a white × . Truncating mutations (red) include nonsense, splice site and frame shift insertions and deletions. In-frame mutations (yellow) include in-frame insertions and deletions. Other mutations (green) include silent exonic mutations, 3’ and 5’ UTR flank mutations and intronic mutations.
Extended Data Fig. 4. Further associations between genomic features and response to neoadjuvant therapy.
a, Interaction plot showing co-occurrence of non-silent driver gene mutations and response. Associations between TP53 and PIK3CA mutations and response shown in inset (logistic regression, red: positive, blue: negative, grey: not significant, error bars represent 95% confidence intervals). b, Pearson’s product-moment correlations (R) between tumour purity and (left) tumour mutation burden and (right) %CNAs. The shaded area, in grey, represents the 95% confidence interval. c, Box plots showing associations between TMB and response, stratified by HER2 status. d, Box plots showing association between expressed neoantigen (NAg) load and response, stratified by HER2 status. e, Box plot showing monotonic association (P = 0.005, ordinal logistic regression) between exposure of non-clock signatures and RCB class. f, Box plots showing associations between HRD score and response, stratified by HER2 status. g, Box plots showing associations between %CNA and response, stratified by HER2 status. c–g, The box bounds the interquartile range divided by the median, with the whiskers extending to a maximum of 1.5 times the interquartile range beyond the box. Outliers are shown as dots. Wilcoxon rank sum tests, all P values two-sided. Number of cases analysed (n) = 155 (HER2- pCR = 22, RD (residual disease) = 76; HER2+ pCR = 18, RD = 39)). h, Associations between RCB class and iC10: Pearson residuals indicate overrepresentation of iC10 subtype with response (blue: overrepresentation, red: underrepresentation). i, Associations between HLA LOH, global LOH and global copy number alterations with pCR (logistic regression, red: positive association, blue: negative association). The measure of centre is the parameter estimate and error bars represent 95% confidence intervals.
Tumour mutation burden was higher in tumours that attained pCR (median mutations per megabase pCR: 2.3, residual disease: 1.4, P = 0.0005) and monotonically associated with RCB class (P = 0.004; Fig. 2a). This was independent of computationally estimated tumour purity (Extended Data Fig. 4b). In subgroup analysis, the association was observed only in HER2− (P = 9 × 10⁻⁶) tumours (Extended Data Fig. 4c). The clonal status of mutations16 also associated with response: tumours that failed to attain pCR had a higher percentage of subclonal mutations (Fig. 2b). Accordingly, tumours that attained pCR had higher predicted neoantigen burdens (median neoantigens pCR: 28, residual disease: 17, P = 0.009; Fig. 2c), and after stratification, this was observed only in HER2− tumours (P = 0.004; Extended Data Fig. 4d).
Fig. 2. Genomic features monotonically associate with response to therapy.
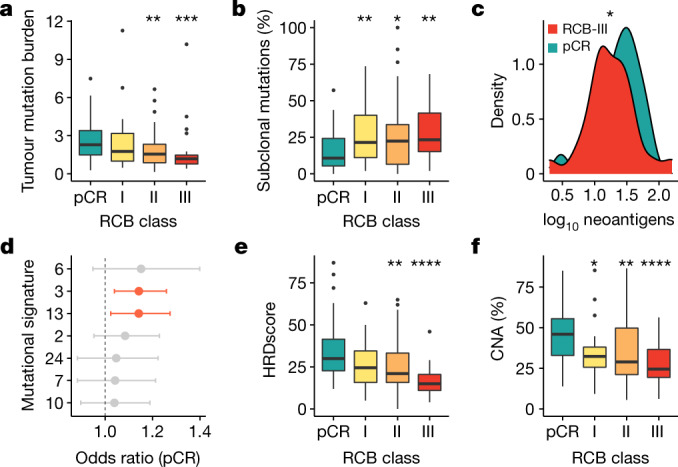
a, b, Box plots showing monotonic association between RCB class: total tumour mutation burden (a) (P = 0.004, ordinal logistic regression; pCR versus RCB-II **P = 0.001 and RCB-III ***P = 0.0002), and the percentage of subclonal mutations (b) (P = 0.02, ordinal logistic regression; pCR versus RCB-I **P = 0.007, RCB-II *P = 0.04 and RCB-III **P = 0.001). c, Density curves showing distribution of neoantigens in tumours that attained pCR and RCB-III (monotonic association, P = 0.03, ordinal logistic regression; pCR versus RCB-III *P < 0.05). d, Associations between mutational signatures and pCR. Statistically significant associations obtained from logistic regression are shown in red (HRD: 3; APOBEC: 13). The measure of the centre is the parameter estimate, and the error bars represent 95% confidence intervals; the vertical dashed line corresponds to an odds ratio of 1. e, f, Box plots showing monotonic association between RCB class and HRD score (e) (P = 0.00001, ordinal logistic regression; pCR versus RCB-II **P = 0.006 and RCB-III ****P = 3 × 10⁻⁶), and the percentage of copy number alterations (CNAs; f) (P = 0.0002, ordinal logistic regression; pCR versus RCB-I *P = 0.01, RCB-II **P = 0.004 and RCB-III ****P = 7 × 10⁻⁵). In a–f, the number of patients with DNA sequencing data: 40 (for pCR), 24 (for RCB-I), 64 (for RCB-II) and 27 (for RCB-III). In a, b, e, f, the box bounds the interquartile range divided by the median, with the whiskers extending to a maximum of 1.5 times the interquartile range beyond the box. Outliers are shown as dots. Wilcoxon rank-sum tests; all P values are two-sided.
Analysis of mutational signatures17 (Fig. 2d) showed homologous recombination deficiency (HRD) and APOBEC signatures were associated with pCR across the entire cohort (HRD OR: 1.1, P = 0.006; APOBEC OR: 1.1, P = 0.02; logistic regression). Tumours that attained pCR had a greater contribution from non-clock signatures (P = 0.002; Extended Data Fig. 4e). Similarly, increasing HRD18 was monotonically associated with response (P = 0.00001; Fig. 2e) and associated with pCR in HER2− tumours (P = 3 × 10⁻⁶; Extended Data Fig. 4f).
Tumours that attained pCR had more copy number alterations and chromosomal instability was monotonically associated with RCB class (P = 0.0002; Fig. 2f, Extended Data Fig. 4g). To capture the ensemble of copy number alterations, which dominate the genomic landscapes, we stratified the pre-treated tumours into the 10 genomic driver-based integrative cluster (iC) subtypes19 (Extended Data Fig. 4h). iC10 tumours, mostly triple-negative with high prevalence of TP53 mutations and copy number alterations, showed the strongest association with pCR. By contrast, tumours from indolent ER+ subtypes, iC3, iC7 and iC8 were unlikely to attain pCR. Two of the aggressive ER+ subtypes, iC2 (11q13/14 amplification) and iC6 (amplification of ZNF703 at 8p12), also associated with lack of treatment response. We had previously reported a similar association for iC2 tumours20.
In summary, tumours that attained pCR mostly came from more-aggressive iC subtypes, were enriched for TP53 mutations, had higher tumour mutation burdens and neoantigen loads, had less-complex clonal architectures and were enriched for APOBEC and HRD signatures.
HLA class I allelic loss confers resistance
Loss of heterozygosity (LOH) over the HLA class I locus21 was identified in 29 cases and associated with residual disease (OR: 3.5, CI: 1.1–14.2, P < 0.05; logistic regression) independently of global LOH and copy number instability (Extended Data Fig. 4i). HLA LOH events were predicted to result in inability to present 30% of tumour neoantigens and 69% of LOH events targeted HLA alleles that presented an equal or greater number of neoepitopes than the retained allele. These data support a model in which some tumours appear to have immune escaped by losing copies of the HLA locus and these tumours are less likely to respond to treatment.
Tumour proliferation and immune signatures
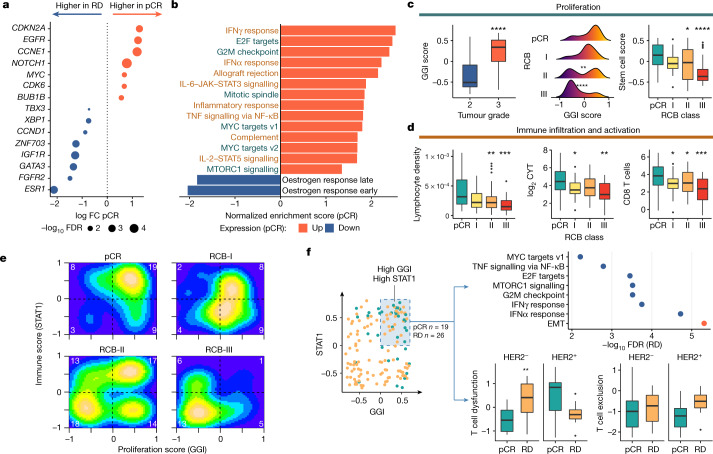
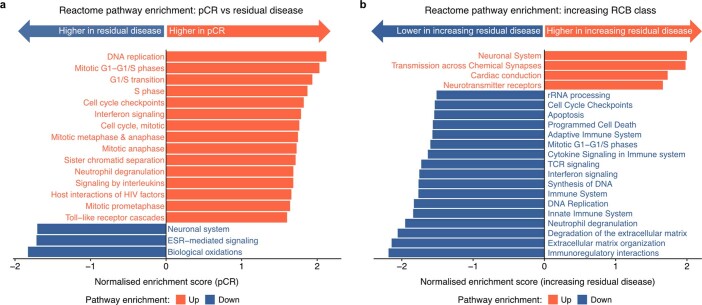
We modelled response as a binary variable (pCR versus residual disease) and differential RNA expression analysis showed 2,071 genes underexpressed and 2,439 genes overexpressed in tumours attaining pCR (FDR < 0.05). pCR associated with overexpression of driver genes CDKN2A, EGFR, CCNE1 and MYC and underexpression of CCND1 (iC2), ZNF703 (iC6) and ESR1 (Fig. 3a). Gene set enrichment analysis on the MsigDB Hallmarks22 and Reactome23 gene sets showed that proliferation and immune activation strongly associated with response (Fig. 3b, Extended Data Fig. 5a, b).
Fig. 3. Transcriptomic features associated with response to neoadjuvant therapy.
a, Expression of breast cancer driver genes associated with pCR. FC, fold change; RD, residual disease. b, MSigDB Hallmark gene sets associated with pCR. Response was predominantly associated with proliferative (green) and immune (brown) gene sets. c, Box plot showing association of GGI score with histological grade (P = 5 × 10⁻¹¹) (left); density plots showing monotonic association (P = 2 × 10⁻⁵, ordinal logistic regression) between GGI score and RCB (pCR versus RCB-II **P = 0.01 and RCB-III ****P = 3 × 10⁻⁵) (middle); and box plot showing monotonic association (P = 0.0001, ordinal logistic regression) between stem -cell enrichment score and RCB (pCR versus RCB-II *P = 0.02 and RCB-III ****P = 7 × 10⁻⁵) (right). The number of patients with RNA sequencing data: 39 (for pCR), 23 (for RCB-I), 62 (for RCB-II) and 25 (for RCB-III). d, Box plots showing monotonic associations between computationally estimated lymphocyte density and RCB (P < 1 × 10⁻¹⁰, ordinal logistic regression; n = 153 cases with digital pathology data; pCR versus RCB-II **P = 0.006 and RCB-III ***P = 0.0001) (left); CYT score and RCB (P = 0.001; n = 149 cases with RNA sequencing data; pCR versus RCB-I *P = 0.03 and RCB-III **P = 0.001) (middle); and Danaher CD8 T cell enrichment and RCB (P = 0.0002; n = 149 cases; pCR versus RCB-I *P = 0.04, RCB-II *P = 0.04 and RCB-III ***P = 0.0003) (right). e, 2D density plot showing the relationship between proliferation and immune activation across RCB classes. The number of cases in each quadrant is shown in white. f, The distribution of GGI and STAT1 scores across cohort (left). The shaded area represents samples with proliferation and immune enrichment values above the mean (n = 45 cases). The MSigDB Hallmarks pathways associated with residual disease in these 45 tumours (red represents overexpressed, and blue indicates underexpressed) (top right). Box plots showing association between T cell dysfunction (**P = 0.006 HER2−) and exclusion with response in these tumours are also shown (bottom right). EMT, epithelial-to-mesenchymal transition. In c, d, f, the box bounds the interquartile range divided by the median, with the whiskers extending to a maximum of 1.5 times the interquartile range beyond the box. Wilcoxon rank-sum tests; all P values are two-sided.
Extended Data Fig. 5. Reactome pathways associated with response to neoadjuvant therapy.
a, b, Reactome pathway enrichment showing pathways associated with (a) pCR versus residual disease, (b) degree of residual disease following neoadjuvant therapy.
To further explore this association, we performed gene set variation analysis using the Genomic Grade Index (GGI) gene set24 (Supplementary Table 3). The GGI gene set variation analysis score associated with tumour grade (Fig. 3c, left panel) and was monotonically associated with RCB class (P = 2 × 10⁻⁵; Fig. 3c, middle panel). Similar results were observed on enriching over an embryonic stem-cell metagene25 (P = 0.0001; Fig. 3c, right panel), indicating that tumour dedifferentiation associates with response. In a subgroup analysis, this association was only observed in HER2− tumours (P = 4 × 10⁻⁵; Extended Data Fig. 6a), suggesting that efficacy of anti-HER2-targeted therapies is independent of proliferation. We also explored the utility of a taxane response metagene26, computed as the difference in expression of proliferation and ceramide metagenes: HER2− tumours that attained pCR had higher enrichment scores (P = 5 × 10⁻⁷; Extended Data Fig. 6b).
Extended Data Fig. 6. Associations between tumour proliferation and response.
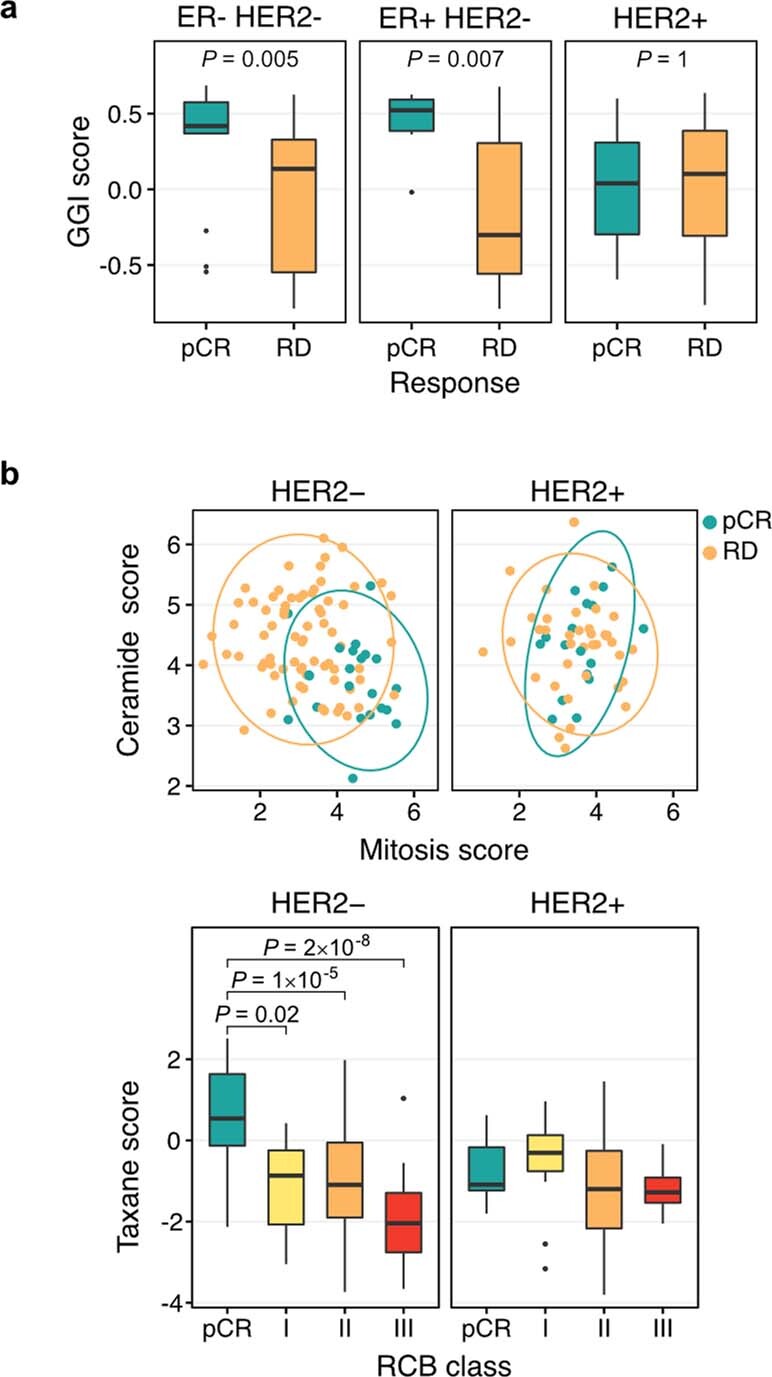
a, Box plots showing associations between proliferation (GGI) GSVA scores across ER/HER subtypes. b, Top: Scatter plots showing the distribution of the mitotic and ceramide score components of a taxane response metagene within the HER2- and HER2+ cohorts. Bottom: Box plots showing association of the combined taxane response metagene score within the HER2- and HER2+ cohorts. In a, b, the box bounds the interquartile range divided by the median, with the whiskers extending to a maximum of 1.5 times the interquartile range beyond the box. Outliers are shown as dots. Two-tailed Wilcoxon rank sum tests. Number of cases (n): ER-HER2-: 37, ER+HER2-: 57, HER2+: 55.
The role of the tumour immune microenvironment (TiME) in predicting response was suggested by the automated scoring of digitally scanned core biopsy haematoxylin and eosin slides showing that lymphocytic density was a good predictor of pCR (P = 0.0006; Fig. 3d, left panel), in line with previous reports13,14. The immune cytolytic activity score27 was also monotonically associated with response across all tumours (P = 0.001; Fig. 3d, middle panel) and correlated with tumour lymphocytic density (R2 = 0.4, P = 1 × 10⁻¹⁵).
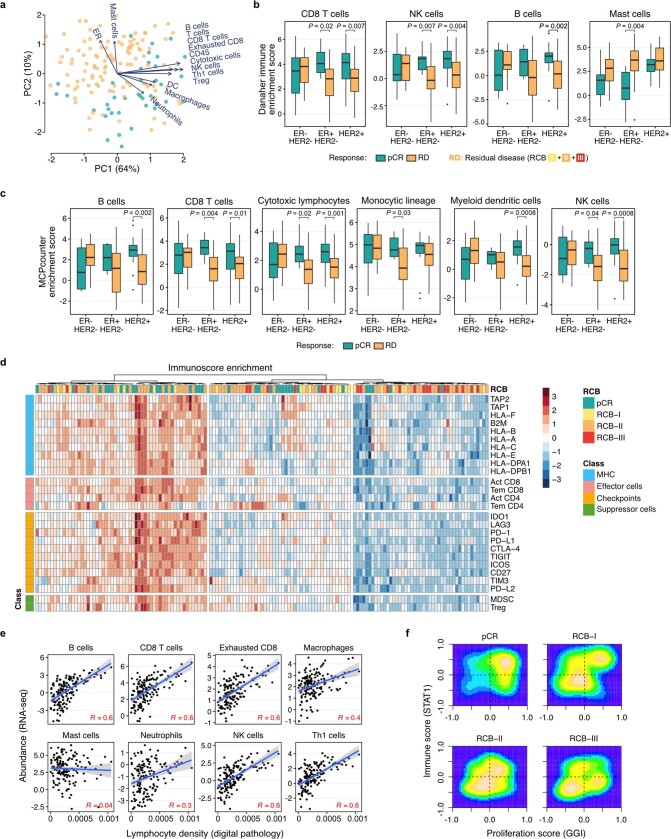
These results motivated a detailed analysis of the TiME in pre-treatment biopsies using three different methods for RNA expression deconvolution (enrichment over Danaher gene sets28, MCPcounter29 and Immunophenoscore30; Fig. 3d, right panel, Extended Data Fig. 7a–d). These analyses converged to reveal enrichment of both innate and adaptive immunity cell populations in ER+HER2− and HER2+ tumours that attained pCR. Computationally estimated lymphocyte density also strongly correlated with the enrichment of many adaptive and innate immune components (Extended Data Fig. 7e). Immunologically active tumours were co-enriched for both cytotoxic and immunoinhibitory cell types and gene signatures (Extended Data Fig. 7d). The Danaher gene set enrichment also showed that mast cells were enriched in resistant tumours (enrichment score pCR: 2.1, residual disease: 3.4, P = 0.0001).
Extended Data Fig. 7. The relationship between tumour immune microenvironment and response.
a, PCA analysis on the abundance of tumour immune microenvironment components obtained through the deconvolution of RNA-seq data using Danaher’s immune signatures (number of cases (n): pCR (green) = 39, RD (orange) = 110). b, c, Box plots showing associations between response and (b) Danaher immune cell enrichment and (c) MCPcounter immune cell enrichment across ER/HER subtypes. The box bounds the interquartile range divided by the median, with the whiskers extending to a maximum of 1.5 times the interquartile range beyond the box. Outliers are shown as dots. Two-tailed Wilcoxon rank sum tests. Number of cases (n): ER-HER2-: 37, ER+HER2-: 57, HER2+: 55. d, Heatmap showing unsupervised clustering of cancer immunity parameters across n = 149 cases with RNA sequencing data. e, Scatter plot showing association between computationally derived lymphocyte density and immune cell enrichment using Danaher’s immune signatures across n = 147 cases with digital pathology and RNA sequencing data. Pearson’s product-moment correlations (R) shown. The shaded area, in grey, represents the 95% confidence interval. f, 2D density plot validating relationship between GGI and STAT1 GSVA across RCB subgroups in two external microarray gene sets comprising 457 cases.
We then integrated proliferation (using GGI) and immune response in the pre-therapy tumours. We used the STAT1 gene expression module31 to represent immune response in a single score and computed correlations between GGI and STAT1 scores with RCB classes. Tumours that attained pCR mostly had high proliferation and high immune activation, with both signatures decreasing in a stepwise manner as the degree of residual disease increased (Fig. 3e). Similar findings were observed on analysing external data from the ISPY-I and NCT00455533 studies10,11 (Extended Data Fig. 7f).
In summary, in therapy-naive tumours, proliferation and immune response, both innate and adaptive, have combined effects that associate with sensitivity to treatment. In general, tumours that attain pCR tend to be highly proliferative and display evidence of an active TiME.
Immune dysfunction in resistant tumours
We noted that there were 26 of the 45 tumours with high GGI and STAT1 scores that failed to attain pCR. Differential gene expression analysis in these 45 cases (residual disease versus pCR) showed enrichment of epithelial-to-mesenchymal transition and downregulation of immune response pathways in tumours with residual disease (Fig. 3f). We hypothesized that an attenuated immune response could explain this and derived T cell dysfunction and T cell exclusion metrics using TIDE32 (Fig. 3f). This showed that HER2− tumours with residual disease had higher T cell dysfunction at diagnosis (P = 0.006) with no difference in T cell exclusion scores. The increased dysfunction was associated with enrichment of inhibitory natural killer CD56dim cells (P = 0.01) and regulatory T cells (P = 0.02; Extended Data Fig. 8a). Across the whole cohort, active T cell exclusion (Extended Data Fig. 8b) was associated with poorer response: exclusion was higher in residual disease (P = 0.02), with increased enrichment of cancer-associated fibroblasts (P = 0.009) and M2 tumour-associated macrophages (P = 0.0009).
Extended Data Fig. 8. T-cell dysfunction and exclusion.
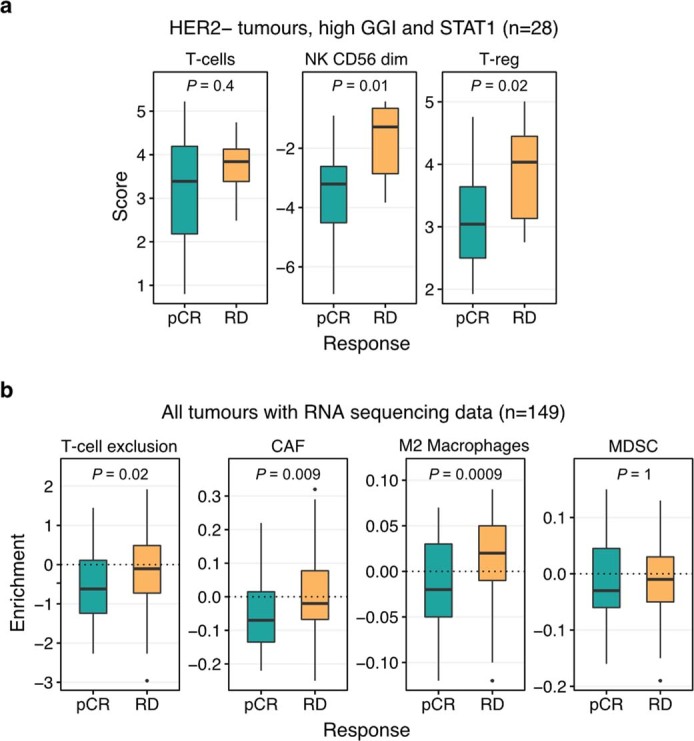
a, Box plots showing enriched inhibitory immune cell types (Danaher gene sets) in HER2- tumours with high GGI and STAT1 (number of cases (n): pCR = 12, RD = 16). b, Box plots showing association between components of T-cell exclusion score and response (number of cases (n): pCR = 39, RD = 110). CAF: Cancer associated fibroblasts, MDSC: Myeloid-derived suppressor cells. In a, b, the box bounds the interquartile range divided by the median, with the whiskers extending to a maximum of 1.5 times the interquartile range beyond the box. Outliers are shown as dots. Two-tailed Wilcoxon rank sum tests.
In summary, some tumours, despite being proliferative and with an enriched TiME, display features of T cell dysfunction and tend to be resistant to therapy.
Machine learning integrates multi-omic features
Above, we identified clinical, digital pathology, genomic and transcriptomic features present in the naive tumour ecosystem that associated with response to therapy, although individually none of these features performed robustly. This motivated the use of a machine learning framework (Fig. 4a) to integrate features into a predictive model of pCR.
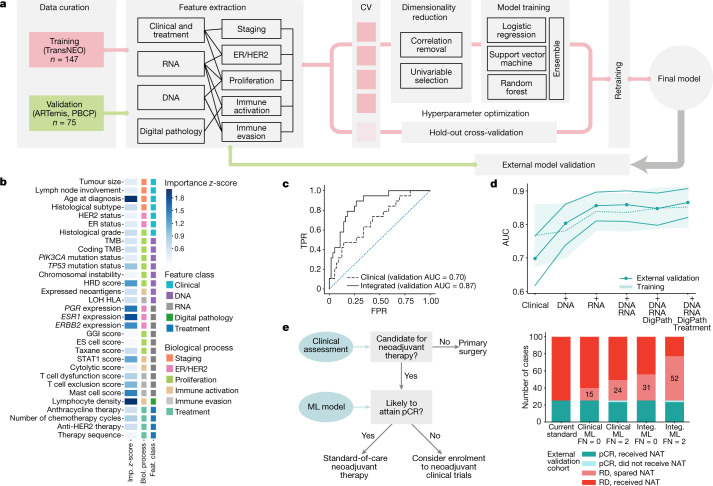
Fig. 4. Predicting response to therapy using a composite machine learning model.
a, Schematic of the machine learning framework. CV, cross validation. b, Feature importance calculated as the average z-score resulting from dropping each individual feature from the three components of the model and calculating the new area under the receiver operating characteristic curve (AUC). The importance of chemotherapy sequence features have been averaged into a ‘therapy sequence’ row for simplicity. ES cell, embryonic stem cell; TMB, tumour mutation burden. c, Receiver operating characteristic curves for the clinical (dashed) and fully integrated (continuous) models applied on the external validation cohort. The dotted line indicates random performance. FPR, false positive rate; TPR, true positive rate. d, AUCs for models with increasing levels of data integration. The continuous line on the foreground corresponds to the AUCs obtained from the external validation cohorts (filled markers), with bands representing the standard deviation estimated with bootstrap. The filled band on the background corresponds to the standard deviation of the AUCs obtained using cross-validation on the training dataset, with mean values represented by a dashed line. DigPath, digital pathology. e, Potential clinical impact of the pCR model, using data from the external validation confusion matrix (left). Bar plots show the number of patients that would be identified to be chemoresistant using operating thresholds of 0 and 2 false negatives (FN), using either the clinical or fully integrated models, respectively (right). ML, machine learning; NAT, neoadjuvant therapy.
A series of six pCR prediction models including different feature combinations were derived using: (1) clinical features only, and adding (2) DNA, (3) RNA, (4) DNA and RNA, (5) DNA, RNA and digital pathology, and (6) DNA, RNA, digital pathology and treatment. The number of predictive features totalled 34 (Fig. 4b, Extended Data Fig. 9a, b, Supplementary Table 4).
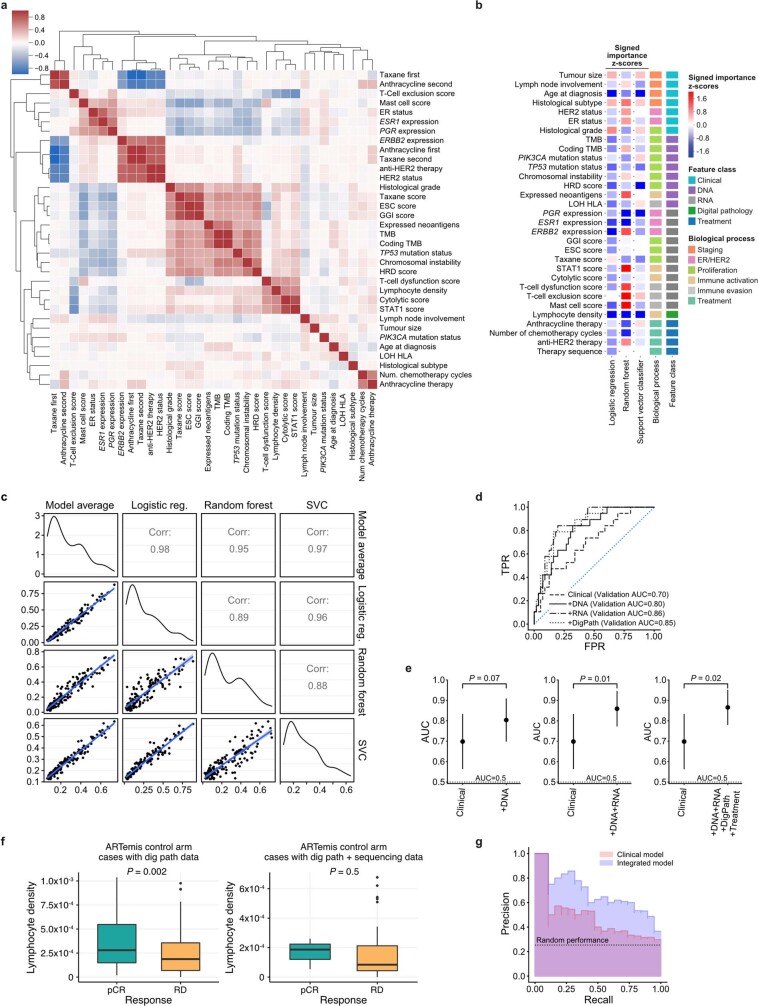
Extended Data Fig. 9. Machine learning model performance.
a, Correlation plot showing the results of unsupervised clustering between all the features explored. b, Signed feature importance split by algorithm. Negative numbers (blue) signify a decrease in AUC as a result of dropping, and therefore indicate that the feature improves the performance. c, Correlation of the three classification pipeline scores across the training dataset. Two-sided P values of all correlations < 2.2 x 10⁻¹⁶. d, Receiver-operating characteristic curves for the clinical and integrated models applied on the external validation cohort. e, Comparison between AUCs of the clinical model and models with different levels of data integration. The measure of centre is the parameter estimate and error bars represent 95% DeLong confidence intervals. f, Association between lymphocyte density and treatment response in ARTemis patients with digital pathology and sequencing data (right, n = 38 cases) vs. patients with only digital pathology available (left, n = 313 cases). The box bounds the interquartile range divided by the median, with the whiskers extending to a maximum of 1.5 times the interquartile range beyond the box. Outliers are shown as dots. P values obtained from Wilcoxon rank sum tests. g, Precision-recall curves of the clinical and fully integrated models applied on the test cohorts. The average precision values are 0.46 (clinical model) and 0.68 (fully integrated model). The areas under the precision-recall curves are 0.43 (clinical model) and 0.67 (fully integrated model).
The models were based on a multi-step predictor pipeline. Inside the pipeline, features were first filtered by univariable selection and collinearity reduction, and then fed into an unweighted ensemble classifier33. Each ensemble consisted of three algorithms acting in parallel: logistic regression with elastic net regularization, a support vector machine and a random forest. The three algorithm scores were then averaged to form the predictor (Extended Data Fig. 9c). A fivefold cross-validation scheme was used to optimize model hyperparameters (Methods and Supplementary Methods).
The fully trained models were tested for validation on an independent external cohort of 75 patients that received neoadjuvant therapy, either cases randomized to the control arm of the ARTemis clinical trial34 or cases recruited into the Personalised Breast Cancer Programme (details listed in Supplementary Table 5). In the external cohort, the models achieved the following areas under the curve: 0.70 (clinical), 0.80 (clinical and DNA), 0.86 (clinical and RNA), 0.86 (clinical, DNA and RNA), 0.85 (clinical, DNA, RNA and digital pathology), 0.87 (fully integrated model (clinical, DNA, RNA, digital pathology and treatment)) (Fig. 4c, d, Extended Data Fig. 9d, e). The baseline clinical model, as implemented using our machine learning algorithms, performed similarly to other clinical predictors reported in larger datasets35,36.
We explored the importance of the features used in the integrated training model and found that it used clinical phenotypes in combination with DNA, RNA and digital pathology features. The dominant features were age, lymphocyte density, and expression of PGR, ESR1 and ERBB2 (Fig. 4b, Extended Data Fig. 9b, Supplementary Table 6). In addition, the predictive model also used features associated with proliferation, immune activation and immune evasion. The fully integrated model relied on features obtained from all modalities of data, with RNA features having the largest contribution (Fig. 4b, Extended Data Fig. 9b).
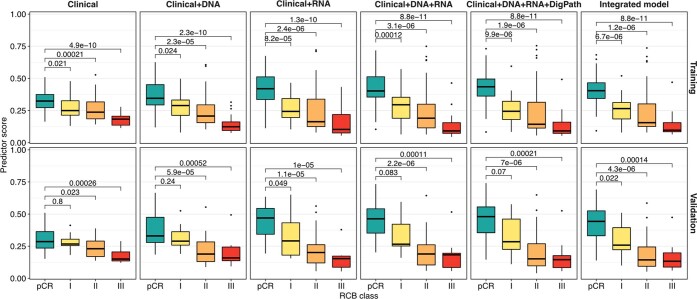
Despite the models being trained using a binary response variable (pCR versus residual disease), an analysis of the predictor scores across both training and validation sets showed that these were highly correlated with RCB class, with a monotonic association observed (training: P = 3 × 10⁻¹⁰, validation: P = 1 × 10⁻⁶; Extended Data Fig. 10).
Extended Data Fig. 10. Predictor score ordinally associated with RCB class.
Box plots showing the distribution of predictor scores obtained by the six models across RCB classes in both training (n = 147 cases) and validation (n = 75 cases) sets. The box bounds the interquartile range divided by the median, with the whiskers extending to a maximum of 1.5 times the interquartile range beyond the box. Outliers are shown as dots. P values two-sided and obtained from FDR-corrected Wilcoxon rank sum tests.
In a clinical workflow, the predictive models could be applied to candidates for neoadjuvant therapy; any predicted to have chemoresistant tumours should be considered for enrolment into clinical trials of novel therapies, as their prognosis is poor if they are treated with standard-of-care therapies (Fig. 4e). We explored this in a simulation study and applied the confusion matrix obtained in the external validation cohorts on a total of 100 patients about to receive neoadjuvant therapy. If the criterion was that no patient guaranteed to obtain pCR should miss out on treatment (no false negatives), the clinical machine learning model would identify 15 non-responders, whereas the fully integrated machine learning model would increase this number to 31. By relaxing the false-negative threshold and allowing two false negatives, 24 (clinical model) and 52 (fully integrated model) patients who would not attain pCR would be correctly identified (Fig. 4e).
In summary, we used an ensemble machine learning approach that inputs multi-omic features from the pre-treatment biopsy to derive predictors of pCR. The models were externally validated demonstrating very good discrimination power.
Discussion
Human tumours are complex ecosystems formed in the malignant compartment by communities of clones and cell phenotypes, and in the tumour microenvironment by a very diverse array of stromal, vascular, innate and adaptive immune cell types1,2,37. How these ecosystems are organized in breast cancer appears to be strongly associated with their genomic features38. Therapy perturbs these tumour ecosystems and this is increasingly recognized as one of the main determinants of treatment response2. Remarkably, efforts to identify features in untreated tumours that predict response to therapy have mostly ignored this.
Our findings showed that response is determined to a great degree by the baseline characteristics of the totality of the tumour ecosystem. Tumour proliferation emerged as a key determinant of response as reported previously9,26. Genomic features that associated with response to chemotherapy in HER2− tumours, and usually correlated with proliferation, included TP53 mutations, tumour mutation burden, BRCA, HRD and APOBEC mutational signatures, and chromosomal instability. Remarkably, in HER2+ tumours, treated with chemotherapy and HER2-targeted antibodies, response appeared to be independent of proliferation. This observation was previously reported39 and should motivate a search for the underlying mechanism. Clonal diversity and subclonal mutations were associated with residual disease. This has also been reported in oesophageal carcinoma40, suggesting that clonally diverse tumours are more likely to contain or be able to select resistant subclones.
A central finding was that the TiME in treatment-naive tumours is a major determinant of response to therapy. Previous work in mouse models had shown that an effective response to chemotherapy requires an immunocompetent tumour microenvironment41. Deconvolution of immune subpopulations using our RNA expression data suggested that both innate and adaptive immunity were already engaged in tumours that went on to have pCR. We previously reported digital pathology-derived lymphocytic density as an independent predictor of pCR13,14, and here confirm this and also show that it strongly correlates with the cytolytic activity score (a surrogate for CD8 and natural killer cytotoxic cells). Pathologist-assessed infiltration of tumour lymphocytes has been reported by many groups as a predictor of response to chemotherapy42 and immunotherapy43, and international guidelines for scoring exist44. The direct role of the immune system in killing tumour cells as a result of chemotherapy, so-called chemotherapy-induced immunogenic cell death, has been proposed45. We hypothesize that the presence of an engaged immune infiltrate in the tumour microenvironment in therapy-naive tumours mediates such chemotherapy-induced immunogenic cell death.
By contrast, a suppressed immune response in naive tumours associated with a propensity for poor response. HLA LOH was first implicated in immune evasion in lung cancer21 and we show here that it predicts poor response to therapy. T cell dysfunction46 and exclusion47 showed similar effects. The similarity of features predicting response to cytotoxic therapy compared with those reported to predict response to immune checkpoint inhibitors48 raises the intriguing possibility that similar mechanisms of killing tumour cells are engaged.
We show that machine learning models for prediction of therapy response that combine clinical, molecular and digital pathology data significantly outperform those based on clinical variables. The high accuracy obtained in external validation suggests that the models are robust and may enable using molecular and digital pathology to determine therapy choice in future clinical trials, including in the adjuvant therapy setting. More generally, the framework highlights the importance of data integration in machine learning models for response prediction and could be used to generate similar predictors for other cancers.
Methods
Study population and tissue collection
We analysed breast tumours from patients with primary invasive cancer enrolled in the TransNEO study at Cambridge University Hospitals NHS Foundation Trust between 2013 and 2017. Appropriate ethical approval from the institutional review board (research ethics reference: 12/EE/0484) was obtained for the use of biospecimens with linked pseudo-anonymized clinical data. All patients provided informed consent for sample collection and all participants consented to the publication of research results. Clinical data were collected in Microsoft Excel (as part of the office 365 suite) by data managers.
Pre-neoadjuvant and post-neoadjuvant chemotherapy specimens were handled following departmental standard operating procedures in accordance with international guidelines49. RCB post-neoadjuvant therapy was assessed by experienced breast histopathologists (E.P. and J.T.) using the pathology protocol for assessment of RCB as provided on the MD Anderson RCB website (https://www.mdanderson.org/education-and-research/resources-for-professionals/clinical-tools-and-resources/clinical-calculators/calculators-rcb-pathology-protocol2.pdf?_ga=2.93785373.1680005878.1594213442-1702172112.1568299785). RCB assessment was not available in seven cases (Extended Data Fig. 1). pCR was defined as the absence of residual invasive cancer on haematoxylin and eosin (H&E) evaluation of the complete resected breast specimen and all sampled lymph nodes. Results for oestrogen receptor (ER) and HER2 status were extracted from pathology reports. ER and HER2 testing were performed in an accredited diagnostic laboratory and scored according to UK guidelines50. ER staining was regarded as positive if the Allred score was more than 2. HER2 was regarded as positive if immunohistochemical staining was 3+, or if there was borderline 2+ staining with HER2 gene amplification on FISH (HER2 copy number ≥ 6.0 and/or HER2:CEP17 ratio ≥ 2).
Whole blood from all patients was collected before commencing neoadjuvant therapy in S-Monovette 7.5 ml EDTA tubes and centrifuged at 820g for 10 min at room temperature to partition plasma, buffy coat and erythrocytes. The buffy coat fraction was isolated and suspended in 10 ml of red cell lysis buffer (155 mM NH4Cl, 10 mM KHCO3 and 0.1 mM EDTA pH 7.4), centrifuged at 3,600g for 10 min at room temperature, followed by a further step of resuspension and centrifugation. The final cell pellet was suspended in 1 ml of phosphate-buffered saline, centrifuged at 10,000 r.p.m. for 5 min, isolated and frozen. Tumour tissue was collected before the initiation of neoadjuvant chemotherapy via an ultrasound-guided biopsy, flash-frozen in liquid nitrogen and stored at −80 °C. Sectioning of the samples was performed on a cryostat (CM1520; Leica Biosystems). Following an initial 6-μm section taken for H&E staining, 20 30-μm sections were taken and 10 sections were placed in each of the two tubes containing either 180 μl ATL buffer or 700 μl of QIAzol for DNA or RNA extraction, respectively. The histology slides were stained with H&E, and tumour, stromal and immune infiltrate quantification was performed.
Nucleic acid processing and library preparation
Isolation of DNA from all buffy coat and sectioned tumour tissue samples was performed using the Qiagen DNeasy Blood and Tissue Kit (catalogue no. 69506). DNA from tumour tissue was extracted using the manufacturer-recommended protocol. DNA quantification was performed using the Qubit Fluorometer (Invitrogen) and nucleic acid purity was assessed using the NanoDrop 8000 (Thermo Fisher Scientific). Normal and tumour DNA samples were normalized to a concentration of 5 ng/μl using a fluorescence-based method (Quant-IT dsDNA BR, Q33130, Thermo Fisher Scientific) and 50 ng of DNA used for exome library preparation. DNA libraries were constructed using the Illumina Nextera Rapid Capture Exome Library Preparation kit according to the manufacturer’s protocol (Illumina document number: 15037436). The resulting whole-genome sequencing (WGS) libraries and captured whole-exome sequencing (WES) libraries were normalized and pooled, with each pool normalized to a molarity of 4 nM. Sequencing was performed on an Illumina HiSeq4000 instrument in 50-bp single-read mode (for shallow WGS (sWGS)) or 75-bp paired-end mode (for WES). Demultiplexing was performed using Illumina’s bcl2fastq2 software using default options. Isolation of RNA from all tumour tissue samples was performed using the Qiagen miRNeasy Mini Kit (catalogue no. 217004). Tissue sections suspended in 700 μl of QIAzol were thawed and mixed by vortexing. Chloroform (140 μl) was added to each sample, vortexed and transferred to a heavy phase lock tube (Qiagen MaXtract, catalogue no. 129056). The samples were then spun at 12,000g for 15 min at 4 °C, following which the upper clear phase containing RNA was transferred to a 2-ml Eppendorf tube. Subsequent extraction was then performed using the Qiagen QIAsymphony using the manufacturer-recommended protocol. RNA quantification was performed using the Qubit Fluorometer (Invitrogen) and assessment of the RNA integrity performed using the high-sensitivity RNA assays on the Agilent 4200 TapeStation Instrument. RNA samples were normalized to a concentration of 10 ng/μl and transcriptomic libraries were prepared using the Illumina TruSeq Stranded mRNA Library Preparation kit (catalogue no. 20020595) according to the manufacturer’s protocol (Illumina document number: 1000000040498). Of each library, 5 nM was prepared and 94 samples were pooled per lane of sequencing on an Illumina HiSeq4000 system run in 75-bp paired-end mode. Demultiplexing was performed using bcl2fastq2 v.2.17 software (Illumina) using default options.
sWGS and WES pre-processing
For each exome paired FASTQ file, sequencing quality metrics were generated using the FastQC tool (version 0.11.7) (https://www.bioinformatics.babraham.ac.uk/projects/fastqc/). Alignment to the GRCh37 decoy assembly of the human genome was performed using Novoalign (version 3.2.13) in paired-end mode with the following parameters enabled: (1) base quality recalibration, (2) trimming of Nextera adaptor sequence CTGTCTCTTATA, and (3) hard clipping of trailing bases with quality ≤ 20. sWGS data were processed similarly; however, Novoalign was run in single-read mode. Binary aligned sequencing (BAM) file merging, coordinate sorting and PCR and optical duplicate marking were performed using Novosort (version 3.2.13). Local realignment around insertions and deletions was performed using the Genome Analysis Toolkit (GATK)51 programs RealignerTargetCreator and IndelRealigner. The performance of the library preparation as well as the quality of the sequencing data, target coverage metrics within exonic regions specified by the Nextera target BED file obtained from Illumina (Manifest version 1.2) were generated using Picard (version 2.17.0) CalculateHSMetrics. Median WES coverage was ×162 for tumours and ×137 for normal tissue. Median sWGS coverage was ×0.1.
Variant calling
Germline variants were identified across all tumour and normal samples using GATK HaplotypeCaller (version 4.1.4) run in GVCF mode and filtered using GATK VariantRecalibrator. Somatic variant calling was performed using Mutect2 (version 4.1.4). A panel of normals was created by running Mutect2 in tumour-only mode on all normal samples and the resulting VCF files were merged using CreateSomaticPanelOfNormals. Mutect2 was run on each tumour–normal sample pair using this panel of normals and a database of germline variants present within gnomAD to improve somatic calling. Variant filtration was performed using FilterMutectCalls using default options. Mutations that were present at an allelic fraction (AF) of less than 1%, had coverage of less than ×25 in both normal and tumour tissue exome data, were present in the gnomAD repository with a population prevalence greater than 1% and identified as lying within repetitive regions by ANNOVAR (version 599af129dbcfd4e85a2da9832c4ae59898e2f3a9) were removed. Somatic variants were annotated using Ensembl Variant Effect Predictor (version 87)52,53. The tumour mutation burden was computed as the sum of all mutations per tumour divided by the total number of bases sequenced in the genome (45.54 Mb). Breast cancer driver mutations were defined as those genes identified in previous publications54,55.
Copy number calling
Genome binning and segmentation on low-pass sWGS data were performed using the R package QDNAseq (version 1.24)56. Binning was performed across 100-kb windows and counts corrected for GC-rich regions as well as poorly mappable regions. sWGS data from normal tissues were used to correct for technical and germline artefacts. Segmentation was performed using the circular binary segmentation algorithm implemented in the R package DNAcopy (version 1.60)57. Parental copy number quantification and estimation of tumour purity and ploidy were obtained using ASCAT (version 2.5.1)58 using log ratios derived from QDNAseq and germline single-nucleotide polymorphisms obtained from HaplotypeCaller as input. As recommended by the authors, the technology parameter gamma was set to 1 for WES data.
Clonal reconstruction
The CCF for each mutation was computed using the previously derived mathematical framework16:
where VAF was the variant allele fraction for each mutation determined by exome sequencing, p was the tumour purity (computed using ASCAT), CNnormal was the germline copy number state and CNtumour was the total copy number state at the mutant locus in the tumour. Point estimates for CCF and confidence intervals were computed using a binomial distribution modelled by the binconf function from the Hmisc R package (version 4.4) and a mutation was classified as clonal if the CCF 95% confidence interval overlapped 1, with all other mutations classified as subclonal.
Mutational signatures decomposition
Signature decomposition from the bulk exome sequencing mutation data was performed using the DeconstructSigs R package (version 1.8)59, which uses the Wellcome Trust Sanger Institute Mutational Signature Framework as a reference and determines the linear combination of 30 pre-defined signatures by using a multiple logistic regression model with constraints to reconstruct the mutational profile of each tumour. Mutational signatures were solely identified in tumours with more than 10 mutations. To determine signature associations with response, each signature was log2 normalized using the exposure of signature 1 (age) as a reference. Associations between these normalized exposures and response were determined using logistic regression models.
HRD quantification
The scarHRD R package (version 0.1.1)18 was used to determine the levels of HRD present in the WES data, using the ASCAT allele-specific copy number as input. This tool inferred three components of HRD: telomeric allelic imbalance, LOH and the number of large-scale transitions, which were then summarized into an overall HRD score.
HLA typing, identification of HLA LOH and neoantigen calling
HLA typing was performed on the normal tissue sequencing data using the Polysolver tool (version 4)60, which inferred the four-digit HLA type for each sample by using a Bayesian classifier to determine genotype. LOH over the HLA class I locus was determined by using the LOHHLA tool (downloaded from https://bitbucket.org/mcgranahanlab/lohhla/src/master/ commit: 9d58c99)21, using as input ASCAT tumour purity and HLA genotyping data from PolySolver (version 4). Statistically significant HLA alleles with a copy number of less than 0.5 were assumed to be undergoing LOH. Neoantigen calling was performed by using the pVAC-tools (version 1.5.4) cancer immunotherapy suite61. Mutations identified on exome sequencing were translated into corresponding mutant proteins and a list of potential neoantigenic fragments containing the mutant protein generated by using a sliding window approach across the mutated locus, retaining epitopes of lengths 8–11 amino acids. These potentially antigenic fragments were analysed for binding affinity to the HLA class I molecules using the prediction software NetMHCPan version 362, NetMHC version 463 and PickPocket version 1.164 bundled within the Immune Epitope Database resource65. Neoantigens with a binding affinity score of less than 500 nM and that had a higher binding affinity than the corresponding wild-type sequences were retained. Further downstream filtering was done by retaining neoepitopes generated by transcripts that had an expression greater than 1 TPM.
iC10 classification
Classification of all tumours into one of the ten iC10 clusters19,66 was performed using the iC10 R package (version 1.5)20, which took cellularity-corrected copy number log ratios obtained from QDNAseq and voom-normalized gene expression counts derived from the RNA sequencing (RNA-seq) data as input. The iC10 classification of tumours that did not have RNA-seq data was determined using the copy number data only. Associations with response were visualized using the mosaic function from the vcd R package (version 1.4-7).
RNA-seq pre-processing
FASTQ files for each sample generated from multiple sequencing lanes were merged and aligned using STAR version 2.5.2b67, using an index generated from the GRCh37 decoy assembly of the human genome and a transcriptomic Gene Transfer Format (GTF) guide obtained from Ensembl Release 87. STAR was run in two-pass mode for sensitive novel junction discovery, in which the first pass performed a default mapping, and the second pass used the splice junctions detected in the first pass to perform a further round of alignment enhancement. This STAR BAM file was used for differential expression and transcript counting. For variant calling, the BAM files generated by STAR were processed as per GATK best practices guidelines: PCR and optical duplicates were marked using Picard MarkDuplicates and following this, the GATK tool SplitNCigarReads was used to split reads having N CIGAR elements in separate sequence reads. Local realignment around insertions and deletions was performed using RealignerTargetCreator and IndelRealigner, using a calibration set derived from the 1000 Genomes project68–70. Base quality recalibration across all variant sites was then performed using BaseRecalibrator. The tumour samples were sequenced to a median of 87 million reads.
RNA variant calling
Germline variants identified on exome sequencing were filtered by removing multi-allelic variants, indels, as well as mutations for which the minimum depth was less than 30× across all samples. The remaining germline variants were subsequently genotyped across all RNA samples and comparisons were done across homozygous germline variants only. The percentage median concordance across samples derived from a matched patient was 100%, whereas unrelated samples had a median concordance of 60%. Somatic variants detected on exome sequencing were genotyped in the RNA GATK BAM by using HaplotypeCaller in GENOTYPE_GIVEN_ALLELES mode. Mutations present in all samples for one patient were concatenated together, and a VCF was generated to guide HaplotypeCaller local reassembly and variant calling.
Gene and transcript abundance estimation
Gene expression estimation was performed on the STAR aligned BAM file using HTSeq (version 0.6.1p1)71 in read strand-aware union overlap resolution mode, where a read would only be assigned to a gene if it only overlapped within an exonic region of one gene, rather than multiple genes. Gene counts across all samples were merged into one counts matrix using R, and a trimmed mean of M-value (TMM) normalization performed across all samples using the edgeR R package (version 3.32.1)72 to correct for composition biases and make the transcript counts comparable across all samples73,74. The library normalized counts were then transformed into fragment per kilobase millions (FPKMs) and then scaled to a total of a million counts, changing the unit of measure to transcripts per million (TPM)75.
Differential expression
To identify sets of genes that were highly or lowly expressed given a set of experimental conditions (such as pCR versus residual disease) (Fig. 3a), differential expression was performed on the gene raw counts data obtained as described above using edgeR72,73. The output of each model was a list of differentially expressed genes. Following the generation of a ranked list of differentially expressed genes for any comparison of interest, gene set enrichment was performed using the camera statistical method in edgeR; in brief, this method performed a competitive gene set test accounting for inter-gene correlation and tested whether genes were highly ranked relative to other genes in terms of differential expression76. As input to this gene set enrichment analysis (GSEA) method, the annotated gene sets provided within the MSigDB version 6.1 were used22,77 (Fig. 3b). In addition, further enrichment over the Reactome database23 (Extended Data Fig. 5) was performed using the ReactomePA R package (version v1.34)78.
GSEA
GSVA and ssGSEA were performed using the GSVA R package (version 1.34)79 on (1) the GGI gene set24, (2) the core embryonic stem-cell-like module25 and (3) the STAT1 immune signature31. The log-transformed TMM normalized TPM counts were used as input to the GSVA package. A high GSVA score (Fig. 3f, Extended Data Fig. 8a) was defined as any score above the mean value. We computed the paclitaxel response metagene26, as the difference in expression of a mitotic metagene (geometric mean of BUB1B, CDK1, AURKB and TTK TPM expression) and a ceramide metagene (geometric mean of UGCG and CERT1 expression).
Immune microenvironment characterization
The cytolytic activity score27 was computed as the geometric mean of GZMA and PRF1 (as expressed in TPM, 0.01 offset). Immune cell enrichment was performed using (1) MCPcounter29 using voom-normalized RNA-seq counts as input, (2) enrichment over 14 cell types using 60 genes28, using the log-transformed geometric mean of the TPM expression of cell-specific genes as input, and (3) z-score scaling of cancer immunity parameters30 to classify four different immune processes (MHC molecules, immunomodulators, effector cells and suppressor cells), by generating z-score-normalized TPM gene expression for an input list of 162 genes. Heatmaps used to visualize the data were generated using the pheatmap R package (version 1.0.12) and unsupervised column hierarchical clustering based on the Euclidean distance performed. We used the TIDE algorithm (http://tide.dfci.harvard.edu)32 to derive T cell dysfunction and exclusion metrics. The input to TIDE was a log2-transformed TPM matrix of counts, which was normalized by subtracting the average log2 expression of all genes. The interplay between proliferation and immune activation across the four RCB classes (shown in Extended Data Fig. 7f) was validated by performing GGI and STAT1 enrichment using a combined microarray dataset from the ISPY-I10 (GSE25066 and GSE32603) and NCT00455533 (ref. 11) (GSE41998) trials, which were chosen for similar neoadjuvant therapy regimens, availability of core biopsy gene expression and RCB classification.
Digital pathology analysis
Whole-slide H&E images (scanned at a magnification of ×20) were analysed using CellExtractor v1.0, an open-source platform developed for high-throughput analyses of histopathological images. The code was written in Python and used the OpenCV and OpenSlide library. Initially, full-face H&E scanned images were divided into several subregions. Each subregion was processed to remove the background using an adaptive threshold method. A distance matrix was calculated for individual foreground objects to de-blend overlapping objects during the watershed segmentation process. The latter produced binary images of cell masks from which cellular features such as centroids, shape descriptors, and pixel intensities were estimated. These features were used to train a two-level support vector machine-based classifier. During the first level, spurious detections such as artefacts, dirt and pen marks were separated from genuine detections. This was followed by a second level of classification to identify cancer cells, stromal cells and lymphocytes based on a training set of objects selected by a pathologist (W.C.) of approximately 1,000 objects for each category. Finally, on the basis of these classes, descriptive statistical parameters such as cellular fractions and densities were estimated. For each detected cell, density was obtained based on counting the number of nearest neighbours approach, that is, the density within the distance to the Nth nearest neighbour calculated as follows: SigmaN (pixel−2) = N/(pi × dN2) where dN was the distance to the Nth nearest neighbour within a density-defining population. A value of N = 50 was used to estimate the density parameter13. To ensure that the estimated density was not biased towards our choice of density parameter (N = 50), we calculated the density for N in range of 40–60, with 5-step increments. The results remained the same and were therefore independent of the choice of the number of neighbours.
Validation dataset
An external dataset comprising 75 patients treated with neoadjuvant therapy recruited to the Personalised Breast Cancer Programme (PBCP; research ethics reference: 18/EE/0251) study and the control arm of the ARTemis trial (research ethics reference: 08/H1102/104, EudraCT number: 2008-002322-11) was collated. All patients provided informed consent for sample collection and all participants consented to the publication of research results. These cases were selected due to the availability of DNA, RNA and digital pathology data. Clinical and molecular details for these 75 cases are summarized in Supplementary Table 5.
Statistical testing
All statistical tests in the exploratory analysis were performed using R version 4.0.3 and associated packages. All statistical tests described in this work were two-sided. Unless otherwise specified, all statistical comparisons were performed using cases that attained pCR as a comparator. Tests involving comparisons of distributions were done using ‘wilcox.test’ unless otherwise specified. Ordinal logistic regression models used the ordered RCB variable (pCR > RCB-I > RCB-II > RCB-III) as a response variable to determine monotonic associations and were modelled using the polr function from the MASS R package (version 7.3-54). To determine features associated with response, only cases that received at least one cycle of neoadjuvant chemotherapy and one cycle of anti-HER2 therapy (if HER2+) were used in the comparisons to avoid the confounding effect of suboptimal exposure to neoadjuvant therapy on response.
Derivation of a predictive model for relapse
Dataset and model training
The TransNEO dataset was used to train the machine learning pCR classification models. Hyperparameters were optimized using fivefold cross-validation in the training set to maximize the area under the receiver operating characteristic (AUC ROC) curve. The rest of the parameters were determined by setting the hyperparameters to their optimal values and refitting to the entire training cohort. To ensure robustness, we repeated the optimization process five times with different cross-validation seeds, effectively training five alternative predictors. Together, these five predictors constituted what we call the ‘model’: model predictions for new data are obtained by averaging the scores produced by the five predictors. Once trained and frozen, models were independently validated on an external dataset composed of n = 75 patients from the PBCP and ARTemis cohorts described previously.
Predictor architecture
The machine learning framework was built on Python (version 3.7.4) using the following libraries: scikit-learn (version 0.21.2), numpy (version 1.16.4), scipy (version 1.3), pandas (version 0.24.2) within a Singularity container (version 2.4.6-dist). Each predictor was built as an ensemble of three scikit-learn pipelines; in other words, the response prediction was calculated as the average of the scores produced by the three classification pipelines. Each pipeline contained four steps: collinearity removal, k-best feature selection, scaling and classification. The first step removed all features with a mutual Pearson correlation above 0.8, retaining only the one with the highest correlation with the response variable. The second step removed all features that were not ranked within the top k according to their ANOVA F-value with respect to the binary response variable. The third step applied z-score scaling to the remaining features. The fourth step was the classification step, which consisted of a logistic regression80 in the first pipeline, a support vector classifier81 in the second pipeline, and a random forest82 in the third pipeline. All hyperparameters were optimized using a randomized 1,000-step fivefold cross-validation search to maximize the AUC ROC curve. Logistic regression was implemented with elastic net regularization and SAGA solver, with C parameters between 10−3 and 103, and L1 ratios between 0.1 and 1. The support vector classifier was allowed to have either radial basis function, sigmoid or linear kernels, with gamma parameters between 10−9 and 10−2, and C parameters between10−3 and 103. Finally, the random forests were allowed to have between 5 and 100 (or the maximum number of) estimators, maximum features between 5% and 70% of the total, and minimum samples per split between 2 and 15. The final values of the hyperparameters obtained through the optimization procedure can be found in the Supplementary Material.
Feature definitions
Models were trained on a combination of clinical, DNA, RNA, digital pathology and treatment features, as shown in Fig. 4a. Differences in treatment were captured using one-hot-encoded variables assessing whether the patient did or did not receive anthracycline or anti-HER2 treatment. A further set of variables captured whether taxane or anthracycline were given first. The complete list of features and their Spearman correlation matrix can be found in Supplementary Table 4 and Extended Data Fig. 9a, respectively. The order in which features were added in successive models was determined by how widely available they typically are. Although the information required for treatment variables is normally accessible, they are highly correlated with HER2 status, and are therefore included mainly as a cautionary control mechanism. For the sake of the simplicity of the models, they were the last features to be added.
Data cleaning
In the training set, one patient who had clinically unevaluable tumour size was assumed to have a volume 10% larger than the largest present in the cohort. Four patients who were HER2+ who only received one cycle of trastuzumab, and two patients who were HER2− who had only received one chemotherapy cycle were removed from the training set. In the external validation datasets, missing treatment features were set to zero.
Testing
Models were applied on the test cohort and their respective ROC curves and AUCs were evaluated. In Fig. 4d, the standard deviation of the AUCs obtained in the training cross-validation (included as an optimistic performance estimation) was compared to the nominal test AUCs and the standard deviation of the AUCs obtained from 100 bootstrap replicas of the test datasets. In addition, 95% confidence intervals on each test AUC were obtained using the DeLong test83 (Extended Data Fig. 9e). Adding digital pathology introduced a slight degradation of the performance due to the significant difference in the lymphocytic density observed in the training versus the external validation cohorts (Extended Data Fig. 9f). Precision-recall curves, average precision scores and areas under the precision-recall curve were obtained using standard sklearn implementations (Extended Data Fig. 9g).
Feature importance
Feature importances were determined for each algorithm (random forest, support vector classifier and logistic regression) after refitting on the full training cohorts. For consistency, we used an algorithm-agnostic methodology based on dropping each of the input features. We quantified the resulting change in AUC by means of a z-score, where zi represents the z-score significance of the ith feature, and σ is the standard deviation of all the AUC changes. In Fig. 4b, we show the average z-score significances averaged across the three algorithms. In Extended Data Fig. 9b, we calculate signed z-score significances by removing the absolute value from the definition. The sign indicates whether the feature was adding value to the prediction (negative sign) or harming it (positive sign). In addition, the full list of features selected after the collinearity reduction and univariable selection steps for all the different models, as well as the logistic regression coefficients, can be found in the Supplementary Material.
Reporting summary
Further information on research design is available in the Nature Research Reporting Summary linked to this paper.
Online content
Any methods, additional references, Nature Research reporting summaries, source data, extended data, supplementary information, acknowledgements, peer review information; details of author contributions and competing interests; and statements of data and code availability are available at 10.1038/s41586-021-04278-5.
Supplementary information
This file contains Supplementary Methods and Supplementary Tables 1 – 6.
This file contains Supplementary Tables 1 – 6. See below for Supplementary Table legends Supplementary Table 1 Clinical metadata of 168 cases recruited to the TransNEO study. Supplementary Table 2 Mutations identified within the WES data. Supplementary Table 3 Tumour proliferation and immune metrics extracted from the RNA-seq data. Supplementary Table 4 Complete list of features used to train the models, their computation methods, and mean, minimum, and maximum values in the training dataset. Supplementary Table 5 Clinical, molecular, and digital pathology metadata of validation cohort. Supplementary Table 6 Ranked list of biological features including signed importance z-scores.
Acknowledgements
S.-J.S. was supported by a Wellcome Trust PhD Clinical Training Fellowship (grant number 106566/Z/14/Z). M.C.-O. was supported by a Junior Research Fellowship from Trinity College, Cambridge, and a Borysiewicz Fellowship from the University of Cambridge. F.M. was supported by funding from Cancer Research UK (CRUK) (grant numbers A17197 and A19274). O.M.R. was supported by the NIHR Cambridge Biomedical Research Centre (BRC-1215-20014) and the Medical Research Council (UK; MC_UU_00002/16). C.C. was supported by funding from CRUK (grant numbers A17197, A27657 and A29580), an NIHR Senior Investigator Award (grant number NF-SI-0515-10090) and a European Research Council Advanced Award (grant number 694620). The ARTemis molecular profiling dataset was funded in part by an unrestricted academic grant from F. Hoffman La Roche (grant administered by the University of Cambridge). The Programme received infrastructure funding from the CRUK Cambridge Centre and the Mark Foundation Institute for Integrated Cancer Medicine. We are grateful for the generosity of all the patients that donated samples for analysis; all the staff at the Cambridge Breast Cancer Research Unit for facilitating the collection and processing of samples; and the CRUK Cambridge Institute Core Facilities (Genomics, Bioinformatics, Histopathology and Biorepository) for support during the execution of this project.
Extended data figures and tables
Author contributions
S.-J.S. and C.C. conceived the study, led data analysis and wrote the manuscript. Tumour processing was led by S.-J.S. with input from S.-F.C., H.A.B. and W.M. E.P. and J.T. provided histopathology expertise and calculated the RCB index. S.-J.S. created the bioinformatics analysis pipeline, performed all DNA and RNA analyses and identified univariable associations with response. W.C. and A.D. generated the digital pathology lymphocytic infiltration estimates. M.C.-O. and S.-J.S. developed and validated the machine learning models. O.M.R., P.D.P. and F.M. provided statistical advice and expertise. S.-J.D. wrote the TransNEO protocol. C.C. and J.E.A. contributed data from the Personalised Breast Cancer Programme for validation. H.M.E., J.E.A., J.D., L.Hiller, J.T., D.A.C., J.M.S.B., C.C. and L.Hayward are members of the ARTemis trial management group and contributed the data from the control arm of the trial for validation. All authors read and approved the manuscript.
Peer review information
Nature thanks Beatrice Knudsen, Hatice Osmanbeyoglu and the other, anonymous, reviewer(s) for their contribution to the peer review of this work. Peer review reports are available.
Data availability
DNA and RNA sequencing data have been deposited at the European Genome-Phenome Archive (EGA), which is hosted by the EBI and the CRG, under accession number EGAS00001004582.
Code availability
The R and Python source code used to run the analyses described in the article and to generate all figures is available at: https://github.com/cclab-brca/neoadjuvant-therapy-response-predictor.
Competing interests
C.C. is a member of the iMED External Science Panel for AstraZeneca, a member of the Scientific Advisory Board for Illumina and a recipient of research grants (administered by the University of Cambridge) from Genentech, Roche, AstraZeneca and Servier. M.C.-O. has received research funding from Lilly. All other authors declare no competing interests.
Footnotes
Publisher’s note Springer Nature remains neutral with regard to jurisdictional claims in published maps and institutional affiliations.
These authors contributed equally: Mireia Crispin-Ortuzar, Suet-Feung Chin
Extended data
is available for this paper at 10.1038/s41586-021-04278-5.
Supplementary information
The online version contains supplementary material available at 10.1038/s41586-021-04278-5.
References
- 1.Hanahan D, Weinberg RA. Hallmarks of cancer: the next generation. Cell. 2011;144:646–674. doi: 10.1016/j.cell.2011.02.013. [DOI] [PubMed] [Google Scholar]
- 2.Marusyk A, Janiszewska M, Polyak K. Intratumor heterogeneity: the Rosetta stone of therapy resistance. Cancer Cell. 2020;37:471–484. doi: 10.1016/j.ccell.2020.03.007. [DOI] [PMC free article] [PubMed] [Google Scholar]
- 3.Symmans WF, et al. Measurement of residual breast cancer burden to predict survival after neoadjuvant chemotherapy. J. Clin. Oncol. 2007;25:4414–4422. doi: 10.1200/JCO.2007.10.6823. [DOI] [PubMed] [Google Scholar]
- 4.Asselain B, et al. Long-term outcomes for neoadjuvant versus adjuvant chemotherapy in early breast cancer: meta-analysis of individual patient data from ten randomised trials. Lancet Oncol. 2018;19:27–39. doi: 10.1016/S1470-2045(17)30777-5. [DOI] [PMC free article] [PubMed] [Google Scholar]
- 5.Symmans WF, et al. Long-term prognostic risk after neoadjuvant chemotherapy associated with residual cancer burden and breast cancer subtype. J. Clin. Oncol. 2017;35:1049–1060. doi: 10.1200/JCO.2015.63.1010. [DOI] [PMC free article] [PubMed] [Google Scholar]
- 6.Candido dos Reis FJ, et al. An updated PREDICT breast cancer prognostication and treatment benefit prediction model with independent validation. Breast Cancer Res. 2017;19:58. doi: 10.1186/s13058-017-0852-3. [DOI] [PMC free article] [PubMed] [Google Scholar]
- 7.Bonnefoi H, et al. TP53 status for prediction of sensitivity to taxane versus non-taxane neoadjuvant chemotherapy in breast cancer (EORTC 10994/BIG 1-00): a randomised phase 3 trial. Lancet Oncol. 2011;12:527–539. doi: 10.1016/S1470-2045(11)70094-8. [DOI] [PMC free article] [PubMed] [Google Scholar]
- 8.Yuan H, et al. Association of PIK3CA mutation status before and after neoadjuvant chemotherapy with response to chemotherapy in women with breast cancer. Clin. Cancer Res. 2015;21:4365–4372. doi: 10.1158/1078-0432.CCR-14-3354. [DOI] [PubMed] [Google Scholar]
- 9.Callari M, et al. Subtype-specific metagene-based prediction of outcome after neoadjuvant and adjuvant treatment in breast cancer. Clin. Cancer Res. 2016;22:337–345. doi: 10.1158/1078-0432.CCR-15-0757. [DOI] [PubMed] [Google Scholar]
- 10.Hatzis C, et al. A genomic predictor of response and survival following taxane-anthracycline chemotherapy for invasive breast cancer. JAMA. 2011;305:1873–1881. doi: 10.1001/jama.2011.593. [DOI] [PMC free article] [PubMed] [Google Scholar]
- 11.Horak CE, et al. Biomarker analysis of neoadjuvant doxorubicin/cyclophosphamide followed by ixabepilone or paclitaxel in early-stage breast cancer. Clin. Cancer Res. 2013;19:1587–1595. doi: 10.1158/1078-0432.CCR-12-1359. [DOI] [PubMed] [Google Scholar]
- 12.van ’t Veer LJ, et al. Gene expression profiling predicts clinical outcome of breast cancer. Nature. 2002;415:530–536. doi: 10.1038/415530a. [DOI] [PubMed] [Google Scholar]
- 13.Ali HR, et al. Computational pathology of pre-treatment biopsies identifies lymphocyte density as a predictor of response to neoadjuvant chemotherapy in breast cancer. Breast Cancer Res. 2016;18:21. doi: 10.1186/s13058-016-0682-8. [DOI] [PMC free article] [PubMed] [Google Scholar]
- 14.Ali HR, et al. Lymphocyte density determined by computational pathology validated as a predictor of response to neoadjuvant chemotherapy in breast cancer: secondary analysis of the ARTemis trial. Ann. Oncol. 2017;28:1832–1835. doi: 10.1093/annonc/mdx266. [DOI] [PMC free article] [PubMed] [Google Scholar]
- 15.NICE. Early and locally advanced breast cancer: diagnosis and management. NICE guideline [NG101]. NICEhttps://www.nice.org.uk/guidance/ng101 (2018).
- 16.McGranahan N, et al. Clonal status of actionable driver events and the timing of mutational processes in cancer evolution. Sci. Transl. Med. 2015;7:283ra54. doi: 10.1126/scitranslmed.aaa1408. [DOI] [PMC free article] [PubMed] [Google Scholar]
- 17.Alexandrov LB, et al. Signatures of mutational processes in human cancer. Nature. 2013;500:415–421. doi: 10.1038/nature12477. [DOI] [PMC free article] [PubMed] [Google Scholar]
- 18.Sztupinszki Z, et al. Migrating the SNP array-based homologous recombination deficiency measures to next generation sequencing data of breast cancer. NPJ Breast Cancer. 2018;4:16. doi: 10.1038/s41523-018-0066-6. [DOI] [PMC free article] [PubMed] [Google Scholar]
- 19.Curtis C, et al. The genomic and transcriptomic architecture of 2,000 breast tumours reveals novel subgroups. Nature. 2012;486:346–352. doi: 10.1038/nature10983. [DOI] [PMC free article] [PubMed] [Google Scholar]
- 20.Ali HR, et al. Genome-driven integrated classification of breast cancer validated in over 7,500 samples. Genome Biol. 2014;15:431. doi: 10.1186/s13059-014-0431-1. [DOI] [PMC free article] [PubMed] [Google Scholar]
- 21.McGranahan N, et al. Allele-specific HLA loss and immune escape in lung cancer evolution. Cell. 2017;171:1259–1271.e11. doi: 10.1016/j.cell.2017.10.001. [DOI] [PMC free article] [PubMed] [Google Scholar]
- 22.Liberzon A, et al. The Molecular Signatures Database (MSigDB) hallmark gene set collection. Cell Syst. 2015;1:417–425. doi: 10.1016/j.cels.2015.12.004. [DOI] [PMC free article] [PubMed] [Google Scholar]
- 23.Fabregat A, et al. The Reactome Pathway Knowledgebase. Nucleic Acids Res. 2018;46:D649–D655. doi: 10.1093/nar/gkx1132. [DOI] [PMC free article] [PubMed] [Google Scholar]
- 24.Sotiriou C, et al. Gene expression profiling in breast cancer: understanding the molecular basis of histologic grade to improve prognosis. J. Natl Cancer Inst. 2006;98:262–272. doi: 10.1093/jnci/djj052. [DOI] [PubMed] [Google Scholar]
- 25.Wong DJ, et al. Module map of stem cell genes guides creation of epithelial cancer stem cells. Cell Stem Cell. 2008;2:333–344. doi: 10.1016/j.stem.2008.02.009. [DOI] [PMC free article] [PubMed] [Google Scholar]
- 26.Juul N, et al. Assessment of an RNA interference screen-derived mitotic and ceramide pathway metagene as a predictor of response to neoadjuvant paclitaxel for primary triple-negative breast cancer: a retrospective analysis of five clinical trials. Lancet Oncol. 2010;11:358–365. doi: 10.1016/S1470-2045(10)70018-8. [DOI] [PubMed] [Google Scholar]
- 27.Rooney MS, Shukla SA, Wu CJ, Getz G, Hacohen N. Molecular and genetic properties of tumors associated with local immune cytolytic activity. Cell. 2015;160:48–61. doi: 10.1016/j.cell.2014.12.033. [DOI] [PMC free article] [PubMed] [Google Scholar]
- 28.Danaher P, et al. Gene expression markers of tumor infiltrating leukocytes. J. Immunother. Cancer. 2017;5:18. doi: 10.1186/s40425-017-0215-8. [DOI] [PMC free article] [PubMed] [Google Scholar]
- 29.Becht E, et al. Estimating the population abundance of tissue-infiltrating immune and stromal cell populations using gene expression. Genome Biol. 2016;17:218. doi: 10.1186/s13059-016-1070-5. [DOI] [PMC free article] [PubMed] [Google Scholar]
- 30.Charoentong P, et al. Pan-cancer immunogenomic analyses reveal genotype-immunophenotype relationships and predictors of response to checkpoint blockade. Cell Rep. 2017;18:248–262. doi: 10.1016/j.celrep.2016.12.019. [DOI] [PubMed] [Google Scholar]
- 31.Desmedt C, et al. Biological processes associated with breast cancer clinical outcome depend on the molecular subtypes. Clin. Cancer Res. 2008;14:5158–5165. doi: 10.1158/1078-0432.CCR-07-4756. [DOI] [PubMed] [Google Scholar]
- 32.Jiang P, et al. Signatures of T cell dysfunction and exclusion predict cancer immunotherapy response. Nat. Med. 2018;24:1550–1558. doi: 10.1038/s41591-018-0136-1. [DOI] [PMC free article] [PubMed] [Google Scholar]
- 33.Ju C, Bibaut A, van der Laan MJ. The relative performance of ensemble methods with deep convolutional neural networks for image classification. J. Appl. Stat. 2018;45:2800–2818. doi: 10.1080/02664763.2018.1441383. [DOI] [PMC free article] [PubMed] [Google Scholar]
- 34.Earl HM, et al. Efficacy of neoadjuvant bevacizumab added to docetaxel followed by fluorouracil, epirubicin, and cyclophosphamide, for women with HER2-negative early breast cancer (ARTemis): an open-label, randomised, phase 3 trial. Lancet Oncol. 2015;16:656–666. doi: 10.1016/S1470-2045(15)70137-3. [DOI] [PubMed] [Google Scholar]
- 35.Jin X, et al. A nomogram for predicting pathological complete response in patients with human epidermal growth factor receptor 2 negative breast cancer. BMC Cancer. 2016;16:606. doi: 10.1186/s12885-016-2652-z. [DOI] [PMC free article] [PubMed] [Google Scholar]
- 36.Lee JK, et al. Prospective comparison of clinical and genomic multivariate predictors of response to neoadjuvant chemotherapy in breast cancer. Clin. Cancer Res. 2010;16:711–718. doi: 10.1158/1078-0432.CCR-09-2247. [DOI] [PMC free article] [PubMed] [Google Scholar]
- 37.Klemm F, et al. Interrogation of the microenvironmental landscape in brain tumors reveals disease-specific alterations of immune cells. Cell. 2020;181:1643–1660.e17. doi: 10.1016/j.cell.2020.05.007. [DOI] [PMC free article] [PubMed] [Google Scholar]
- 38.Ali HR, et al. Imaging mass cytometry and multiplatform genomics define the phenogenomic landscape of breast cancer. Nat. Cancer. 2020;1:163–175. doi: 10.1038/s43018-020-0026-6. [DOI] [PubMed] [Google Scholar]
- 39.Lesurf R, et al. Genomic characterization of HER2-positive breast cancer and response to neoadjuvant trastuzumab and chemotherapy-results from the ACOSOG Z1041 (Alliance) trial. Ann. Oncol. 2017;28:1070–1077. doi: 10.1093/annonc/mdx048. [DOI] [PMC free article] [PubMed] [Google Scholar]
- 40.Murugaesu N, et al. Tracking the genomic evolution of esophageal adenocarcinoma through neoadjuvant chemotherapy. Cancer Discov. 2015;5:821–831. doi: 10.1158/2159-8290.CD-15-0412. [DOI] [PMC free article] [PubMed] [Google Scholar]
- 41.Michaud M, et al. Autophagy-dependent anticancer immune responses induced by chemotherapeutic agents in mice. Science. 2011;334:1573–1577. doi: 10.1126/science.1208347. [DOI] [PubMed] [Google Scholar]
- 42.Denkert C, et al. Tumor-associated lymphocytes as an independent predictor of response to neoadjuvant chemotherapy in breast cancer. J. Clin. Oncol. 2010;28:105–113. doi: 10.1200/JCO.2009.23.7370. [DOI] [PubMed] [Google Scholar]
- 43.Loi S, Schmid P, Aktan G, Karantza V, Salgado R. Relationship between tumor infiltrating lymphocytes (TILs) and response to pembrolizumab (pembro)+chemotherapy (CT) as neoadjuvant treatment (NAT) for triple-negative breast cancer (TNBC): phase Ib KEYNOTE-173 trial. Ann. Oncol. 2019;30:iii2. [Google Scholar]
- 44.Salgado R, et al. The evaluation of tumor-infiltrating lymphocytes (TILs) in breast cancer: recommendations by an International TILs Working Group 2014. Ann. Oncol. 2015;26:259–271. doi: 10.1093/annonc/mdu450. [DOI] [PMC free article] [PubMed] [Google Scholar]
- 45.Green DR, Ferguson T, Zitvogel L, Kroemer G. Immunogenic and tolerogenic cell death. Nat. Rev. Immunol. 2009;9:353–363. doi: 10.1038/nri2545. [DOI] [PMC free article] [PubMed] [Google Scholar]
- 46.Gajewski TF, Schreiber H, Fu Y-X. Innate and adaptive immune cells in the tumor microenvironment. Nat. Immunol. 2013;14:1014–1022. doi: 10.1038/ni.2703. [DOI] [PMC free article] [PubMed] [Google Scholar]
- 47.Joyce JA, Fearon DT. T cell exclusion, immune privilege, and the tumor microenvironment. Science. 2015;348:74–80. doi: 10.1126/science.aaa6204. [DOI] [PubMed] [Google Scholar]
- 48.Cristescu R, et al. Pan-tumor genomic biomarkers for PD-1 checkpoint blockade-based immunotherapy. Science. 2018;362:eaar3593. doi: 10.1126/science.aar3593. [DOI] [PMC free article] [PubMed] [Google Scholar]
- 49.Provenzano E, et al. Standardization of pathologic evaluation and reporting of postneoadjuvant specimens in clinical trials of breast cancer: recommendations from an international working group. Mod. Pathol. 2015;28:1185–1201. doi: 10.1038/modpathol.2015.74. [DOI] [PubMed] [Google Scholar]
- 50.Royal College of Physians. Pathology reporting of breast disease in surgical excision specimens incorporating the dataset for histological reporting of breast cancer. RCPathhttps://www.rcpath.org/uploads/assets/693db661-0592-4d7e-9644357fbfa00a76/G148_BreastDataset-lowres-Jun16.pdf (2016).
- 51.McKenna A, et al. The Genome Analysis Toolkit: a MapReduce framework for analyzing next-generation DNA sequencing data. Genome Res. 2010;20:1297–1303. doi: 10.1101/gr.107524.110. [DOI] [PMC free article] [PubMed] [Google Scholar]
- 52.Aken BL, et al. Ensembl 2017. Nucleic Acids Res. 2017;45:D635–D642. doi: 10.1093/nar/gkw1104. [DOI] [PMC free article] [PubMed] [Google Scholar]
- 53.McLaren W, et al. The Ensembl Variant Effect Predictor. Genome Biol. 2016;17:122. doi: 10.1186/s13059-016-0974-4. [DOI] [PMC free article] [PubMed] [Google Scholar]
- 54.Nik-Zainal S, et al. Landscape of somatic mutations in 560 breast cancer whole-genome sequences. Nature. 2016;534:47–54. doi: 10.1038/nature17676. [DOI] [PMC free article] [PubMed] [Google Scholar]
- 55.Pereira B, et al. The somatic mutation profiles of 2,433 breast cancers refines their genomic and transcriptomic landscapes. Nat. Commun. 2016;7:11479. doi: 10.1038/ncomms11479. [DOI] [PMC free article] [PubMed] [Google Scholar]
- 56.Scheinin I, et al. DNA copy number analysis of fresh and formalin-fixed specimens by shallow whole-genome sequencing with identification and exclusion of problematic regions in the genome assembly. Genome Res. 2014;24:2022–2032. doi: 10.1101/gr.175141.114. [DOI] [PMC free article] [PubMed] [Google Scholar]
- 57.Seshan V. E. & Olshen, A. B DNAcopy: DNA copy number data analysis. R package version 1.54.0 (2018).
- 58.Van Loo P, et al. Allele-specific copy number analysis of tumors. Proc. Natl Acad. Sci. USA. 2010;107:16910–16915. doi: 10.1073/pnas.1009843107. [DOI] [PMC free article] [PubMed] [Google Scholar]
- 59.Rosenthal R, McGranahan N, Herrero J, Taylor BS, Swanton C. DeconstructSigs: delineating mutational processes in single tumors distinguishes DNA repair deficiencies and patterns of carcinoma evolution. Genome Biol. 2016;17:31. doi: 10.1186/s13059-016-0893-4. [DOI] [PMC free article] [PubMed] [Google Scholar]
- 60.Shukla SA, et al. Comprehensive analysis of cancer-associated somatic mutations in class I HLA genes. Nat. Biotechnol. 2015;33:1152–1158. doi: 10.1038/nbt.3344. [DOI] [PMC free article] [PubMed] [Google Scholar]
- 61.Hundal J, et al. pVAC-Seq: a genome-guided in silico approach to identifying tumor neoantigens. Genome Med. 2016;8:11. doi: 10.1186/s13073-016-0264-5. [DOI] [PMC free article] [PubMed] [Google Scholar]
- 62.Nielsen M, Andreatta M. NetMHCpan-3.0; improved prediction of binding to MHC class I molecules integrating information from multiple receptor and peptide length datasets. Genome Med. 2016;8:33. doi: 10.1186/s13073-016-0288-x. [DOI] [PMC free article] [PubMed] [Google Scholar]
- 63.Lundegaard C, et al. NetMHC-3.0: accurate web accessible predictions of human, mouse and monkey MHC class I affinities for peptides of length 8-11. Nucleic Acids Res. 2008;36:W509–W512. doi: 10.1093/nar/gkn202. [DOI] [PMC free article] [PubMed] [Google Scholar]
- 64.Zhang H, Lund O, Nielsen M. The PickPocket method for predicting binding specificities for receptors based on receptor pocket similarities: application to MHC-peptide binding. Bioinformatics. 2009;25:1293–1299. doi: 10.1093/bioinformatics/btp137. [DOI] [PMC free article] [PubMed] [Google Scholar]
- 65.Vita R, et al. The immune epitope database (IEDB) 3.0. Nucleic Acids Res. 2015;43:D405–D412. doi: 10.1093/nar/gku938. [DOI] [PMC free article] [PubMed] [Google Scholar]
- 66.Dawson S-J, Rueda OM, Aparicio S, Caldas C. A new genome-driven integrated classification of breast cancer and its implications. EMBO J. 2013;32:617–628. doi: 10.1038/emboj.2013.19. [DOI] [PMC free article] [PubMed] [Google Scholar]
- 67.Dobin A, et al. STAR: ultrafast universal RNA-seq aligner. Bioinformatics. 2013;29:15–21. doi: 10.1093/bioinformatics/bts635. [DOI] [PMC free article] [PubMed] [Google Scholar]
- 68.DePristo MA, et al. A framework for variation discovery and genotyping using next-generation DNA sequencing data. Nat. Genet. 2011;43:491–498. doi: 10.1038/ng.806. [DOI] [PMC free article] [PubMed] [Google Scholar]
- 69.Van der Auwera GA, et al. From FastQ data to high confidence variant calls: the Genome Analysis Toolkit best practices pipeline. Curr. Protoc. Bioinformatics. 2013;43:11.10.1–11.10.33. doi: 10.1002/0471250953.bi1110s43. [DOI] [PMC free article] [PubMed] [Google Scholar]
- 70.Mills RE, et al. Natural genetic variation caused by small insertions and deletions in the human genome. Genome Res. 2011;21:830–839. doi: 10.1101/gr.115907.110. [DOI] [PMC free article] [PubMed] [Google Scholar]
- 71.Anders S, Pyl PT, Huber W. HTSeq—a Python framework to work with high-throughput sequencing data. Bioinformatics. 2015;31:166–169. doi: 10.1093/bioinformatics/btu638. [DOI] [PMC free article] [PubMed] [Google Scholar]
- 72.Robinson MD, McCarthy DJ, Smyth GK. edgeR: a Bioconductor package for differential expression analysis of digital gene expression data. Bioinformatics. 2010;26:139–140. doi: 10.1093/bioinformatics/btp616. [DOI] [PMC free article] [PubMed] [Google Scholar]
- 73.McCarthy DJ, Chen Y, Smyth GK. Differential expression analysis of multifactor RNA-seq experiments with respect to biological variation. Nucleic Acids Res. 2012;40:4288–4297. doi: 10.1093/nar/gks042. [DOI] [PMC free article] [PubMed] [Google Scholar]
- 74.Robinson MD, Oshlack A. A scaling normalization method for differential expression analysis of RNA-seq data. Genome Biol. 2010;11:R25. doi: 10.1186/gb-2010-11-3-r25. [DOI] [PMC free article] [PubMed] [Google Scholar]
- 75.Li B, Ruotti V, Stewart RM, Thomson JA, Dewey CN. RNA-seq gene expression estimation with read mapping uncertainty. Bioinformatics. 2010;26:493–500. doi: 10.1093/bioinformatics/btp692. [DOI] [PMC free article] [PubMed] [Google Scholar]
- 76.Wu D, Smyth GK. Camera: a competitive gene set test accounting for inter-gene correlation. Nucleic Acids Res. 2012;40:e133. doi: 10.1093/nar/gks461. [DOI] [PMC free article] [PubMed] [Google Scholar]
- 77.Subramanian A, et al. Gene set enrichment analysis: a knowledge-based approach for interpreting genome-wide expression profiles. Proc. Natl Acad. Sci. USA. 2005;102:15545–15550. doi: 10.1073/pnas.0506580102. [DOI] [PMC free article] [PubMed] [Google Scholar]
- 78.Yu G, He Q-Y. ReactomePA: an R/Bioconductor package for reactome pathway analysis and visualization. Mol. Biosyst. 2016;12:477–479. doi: 10.1039/c5mb00663e. [DOI] [PubMed] [Google Scholar]
- 79.Hänzelmann S, Castelo R, Guinney J. GSVA: gene set variation analysis for microarray and RNA-seq data. BMC Bioinformatics. 2013;14:7. doi: 10.1186/1471-2105-14-7. [DOI] [PMC free article] [PubMed] [Google Scholar]
- 80.Friedman J, Hastie T, Tibshirani R. Regularization paths for generalized linear models via coordinate descent. J. Stat. Softw. 2010;33:1–22. [PMC free article] [PubMed] [Google Scholar]
- 81.Cortes C, Vapnik V. Support-vector networks. Mach. Learn. 1995;20:273–297. [Google Scholar]
- 82.Breiman L. Random Forests. Mach. Learn. 2001;45:5–32. [Google Scholar]
- 83.Kazeev, N. Fast version of DeLong’s method. Yandex Data Schoolhttps://github.com/yandexdataschool/roc_comparison (2021).
Associated Data
This section collects any data citations, data availability statements, or supplementary materials included in this article.
Supplementary Materials
This file contains Supplementary Methods and Supplementary Tables 1 – 6.
This file contains Supplementary Tables 1 – 6. See below for Supplementary Table legends Supplementary Table 1 Clinical metadata of 168 cases recruited to the TransNEO study. Supplementary Table 2 Mutations identified within the WES data. Supplementary Table 3 Tumour proliferation and immune metrics extracted from the RNA-seq data. Supplementary Table 4 Complete list of features used to train the models, their computation methods, and mean, minimum, and maximum values in the training dataset. Supplementary Table 5 Clinical, molecular, and digital pathology metadata of validation cohort. Supplementary Table 6 Ranked list of biological features including signed importance z-scores.
Data Availability Statement
DNA and RNA sequencing data have been deposited at the European Genome-Phenome Archive (EGA), which is hosted by the EBI and the CRG, under accession number EGAS00001004582.
The R and Python source code used to run the analyses described in the article and to generate all figures is available at: https://github.com/cclab-brca/neoadjuvant-therapy-response-predictor.


