

Summary
Background:
There are large and persistent disparities in life expectancy among racial/ethnic groups in the United States, but it is not well understood to what extent these patterns vary geographically on a local scale. This analysis estimated life expectancy for five racial/ethnic groups, in 3110 counties, over 20 years to describe spatialtemporal variation in life expectancy and disparities across racial/ethnic groups.
Methods:
We applied novel small area estimation models to death registration data from the National Vital Statistics System and population data from the National Center for Health Statistics in order to estimate annual sex- and age-specific mortality rates stratified by county and racial/ethnic group (non-Latino White [White], non-Latino Black [Black], non-Latino American Indian and Alaska Native [AIAN], non-Latino Asian and Pacific Islander [API], and Latino or Hispanic [Latino]) from 2000 to 2019. We adjusted these mortality rates to correct for misreporting of race and ethnicity on death certificates and then constructed abridged life tables to estimate life expectancy at birth.
Findings:
Between 2000 and 2019, the level and trend in life expectancy differed among racial/ethnic groups and among counties. Nationally, life expectancy increased for the Black (3·9 years [95% uncertainty interval 3·8–4·0] to 75·3 years [75·2–75·4]), API (2·9 years [2·7–3·0] to 85·7 years [85·3–86·0]), Latino (2·7 years [2·6–2·8] to 82·2 years [82·0–82·5]), and White (1·7 years [1·6–1·7] to 78·9 years [78·9–79·0]) populations while remaining the same for the AIAN population (0·0 years [–0·3 to 0·4] to 73·1 years [71·5–74·8]). At the national level, the negative gap in life expectancy for the Black compared to the White population decreased over this period, while the negative gap for the AIAN compared to the White population increased; in both cases, these patterns were widespread among counties. The positive gap in life expectancy for the API and Latino populations compared to the White population increased at the national level from 2000 to 2019; however, this gap declined in a sizeable minority of counties (615 of 1465 counties [42·0%]) for the Latino population and in most counties (401 of 666 counties [60·2%]) for the API population. For all racial/ethnic groups, improvements in life expectancy were more widespread across counties and larger from 2000–2010 compared to 2010–2019.
Interpretation:
Disparities in life expectancy among racial/ethnic groups are widespread and enduring. Local-level data are critical to address root causes of poor health and early death among disadvantaged groups in the United States, eliminate health disparities, and increase longevity for all.
Funding:
National Institute on Minority Health and Health Disparities; National Heart, Lung, and Blood Institute; National Cancer Institute; National Institute on Aging; National Institute of Arthritis and Musculoskeletal and Skin Diseases; Office of Disease Prevention; and Office of Behavioral and Social Science Research, National Institutes of Health (contract #75N94019C00016).
Introduction
All people deserve to live long, healthy lives.1 Decades of research underscore numerous ways in which the United States fails to achieve this vision.2–4 In particular, large disparities in health and longevity exist across a range of health metrics and along many dimensions, including race, ethnicity, socioeconomic status, and geographical location.5–8 Accurate, detailed, and timely measurement and continued surveillance of these disparities are critical for pinpointing root causes, supporting efforts to address these causes, and monitoring changes over time.
Previous studies have described persistent disparities in life expectancy among racial and ethnic groups in the USA; however, most studies have focused on disparities at the national level5,6,9–12 or in a single location,13,14 despite a growing body of evidence highlighting large and often increasing geographical disparities in life expectancy at the state,15,16 county,7,17 and sub-county levels.18,19 Moreover, most previous studies have focused exclusively on differences in life expectancy among the Black, White, and Latino populations,5,6,9,11 partly due to concerns about misclassification of racial/ethnic identity on death certificates for American Indian/Alaska Native and Asian/Pacific Islander individuals.20 This is particularly the case for research on the intersection between geographical and racial or ethnic disparities in life expectancy,21–24 where concerns about unstable estimates due to small numbers are especially salient for racial/ethnic groups with smaller populations. To our knowledge, only one study has produced country-wide, county-level estimates of life expectancy for a more expansive set of racial/ethnic groups;25 however, these estimates are available for only three years and do not account for misreporting of racial or ethnic identity on death certificates. This body of evidence demonstrates that there are important differences in trends in life expectancy and trends in disparities in life expectancy by racial/ethnic group and by location, but no study has considered how these trends vary simultaneously by racial/ethnic group and location at the county level for a comprehensive set of racial/ethnic groups.
In this study, we use novel methods to estimate life expectancy in the USA annually from 2000 to 2019, stratified by county and racial/ethnic group. We use these estimates to describe spatial and temporal patterns in life expectancy and in disparities among racial/ethnic groups. This study covers the USA at a fine geographical scale and for a 20-year period, providing a comprehensive view of disparities in life expectancy among racial/ethnic groups and by location in the decades immediately preceding the COVID-19 pandemic.
Methods
This study complies with the Guidelines for Accurate and Transparent Health Estimates Reporting (appendix section 1).26 This research received institutional review board approval from the University of Washington. Informed consent was not required because the study used deidentified data and was retrospective.
Unit of analysis
We estimated life expectancy by county, sex, and combined race and Latino ethnicity on an annual basis from 2000 to 2019. In some cases, county boundaries changed over this period. We used a previously developed mapping of counties to temporally stable geographical units for this analysis.27 This reduced the number of areas analysed from 3143 counties to 3110 counties or combined county units (appendix section 3.1). For simplicity, we refer to these 3110 areas as “counties.”
Race and Latino ethnicity were combined into a single categorisation (“race/ethnicity”) with five mutually exclusive groups: non-Latino White (White), non-Latino Black (Black), non-Latino American Indian or Alaska Native (AIAN), non-Latino Asian or Pacific Islander (API), and Latino or Hispanic, any race (Latino). These groups align with the standards for federal data collection on race and ethnicity issued by the Office of Management and Budget (OMB) in 1977.28 These standards were updated in 1997 to require that federal data collection systems provide separate Asian and Native Hawaiian/Other Pacific Islander (NHOPI) categories, and to allow individuals to identify as two or more races;29 however, this change was not implemented on death certificates in all states until 2017, and estimates of misclassification of race and ethnicity on death certificates are currently only available using the 1977 categorization.11,20. Moreover, it is not possible to entirely disaggregate the Asian and NHOPI populations in death certificate data prior to 2011, due to the use of a combined “other Asian and Pacific Islander” residual category for individuals who are Asian or NHOPI but not one of the specific ethnicities listed on death certificates (eg, Chinese, Hawaiian). While it would be preferable to use the 1997 categorisations for this analysis and produce separate estimates for the Asian and NHOPI populations, we were unable to do so due to these data limitations. The Asian population in the USA as a whole and in most counties is much larger than the NHOPI population, and studies that disaggregate these groups find significantly worse health outcomes for NHOPI compared to Asian individuals.30–32 Results for the combined API category should be interpreted cautiously, as they largely reflect outcomes among the Asian population and likely mask different outcomes and trends among the NHOPI population.
Data
We used de-identified death records from the National Vital Statistics System (NVSS) and population estimates from the National Center for Health Statistics (NCHS) for this analysis. Deaths and populations were tabulated by county, age group (0, 1–4, 5–9, …, 80–84, 85+ years of age), sex, race/ethnicity, and year (appendix sections 2.1 and 3.2). We additionally incorporated data extracted from various sources on post-secondary education, income, poverty, nativity, and population density as covariates in the statistical model (appendix sections 2.2 and 3.3). Finally, we utilised published estimates of race and ethnicity misclassification ratios, defined as the ratio of deaths among individuals of a particular racial/ethnic group as indicated by self-report to deaths among individuals of a particular racial/ethnic group as indicated on death certificates.20
Statistical analysis
We carried out the statistical analysis in three stages. First, we used small area estimation models to estimate mortality rates by county, race/ethnicity, sex, age, and year, using the race/ethnicity reported on death certificates. Models were fit in the Template Model Builder package33 in R version 3.6.1,34 and 1000 draws of the mortality rate were generated from the approximated posterior distribution after fitting the models. We validated the small area estimation models using an established empirical model validation framework.27,35 Further details on model specification, model validation, and model performance are provided in the appendix (section 2.3–2.4).
Second, we used race/ethnicity misclassification ratios to adjust draws of the mortality rate derived from the small area model. Extracted race/ethnicity misclassification ratios were combined across different stratifications (age/sex, census region, and co-ethnic density), and 1000 draws were generated for each combined misclassification ratio using the reported standard errors and assuming each component misclassification ratio was log-Normally distributed and independent. Draws of the unadjusted mortality rate and the misclassification ratios were multiplied to generate adjusted mortality rate draws (appendix section 2.5).
Third, in order to guarantee internal consistency, and to ensure that adjustment for misclassification did not change the overall level of mortality estimated for a given county, we performed a two-part post-hoc calibration on each of the 1000 draws, scaling county-level mortality to match state-level mortality from the Global Burden of Disease 2020 Study,36 then scaling adjusted county-race/ethnicity-level mortality to match scaled county-level mortality. After calibration, we constructed abridged period life tables using standard demographic techniques37 and the method proposed by Horiuchi and Coale for estimating life expectancy in the terminal age group,38 and extracted life expectancy at birth for each county, year, sex, and race/ethnicity and for each draw (appendix section 2.6). Final point estimates were derived from the mean of these draws, and 95% uncertainty intervals (UIs) were derived from their 2·5th and 97·5th percentiles. We generated estimates for males and females combined and at aggregate geographical levels (ie, state and national) by population-weighting the age-specific mortality rates prior to generating life tables. When comparing any pair of life expectancy estimates, we describe the difference as statistically significant when the posterior probability that the difference is non-zero exceeded 95%, akin to a two-tailed test with alpha = 0·05.
We mask modelled life expectancy estimates in every year for county-race/ethnicities with an average annual population of less than 1000 as model performance declined notably below this threshold, and in any particular year where the width of the uncertainty interval was greater than ten years (appendix section 3.4). It is common practice to suppress estimates associated with uncertainty above some specified threshold, though the exact threshold varies by application and is inherently arbitrary.11,19
Role of the funding source
This study was funded by the National Institute on Minority Health and Health Disparities; National Heart, Lung, and Blood Institute; National Cancer Institute; National Institute on Aging; National Institute of Arthritis and Musculoskeletal and Skin Diseases; Office of Disease Prevention; and Office of Behavioral and Social Science Research, National Institutes of Health. Co-authors employed by the National Institutes of Health contributed to data interpretation and revising drafts of this report. Otherwise, the funders had no role in study design, data collection, data analysis, or the initial writing of the report. The corresponding author had full access to the data in the study and final responsibility for the decision to submit for publication.
Results
Between 2000 and 2019, overall life expectancy in the USA increased by 2·3 years (95% UI 2·2–2·3), from 76·8 (76·8–76·8) to 79·1 (79·0–79·1) (figure 1). However, this estimate obscures important differences among racial/ethnic groups. Life expectancy increased most over this period for the Latino population (2·7 years [2·6–2·8], from 79·5 [79·3–79·8] to 82·2 [82·0–82·5]), the API population (2·9 years [2·7–3·0], from 82·8 [82·4–83·2] to 85·7 [85·3–86·0]), and the Black population (3·9 years [3·8–4·0], from 71·4 [71·3–71·5] to 75·3 [75·2–75·4]). At the same time, the increase in life expectancy for the White population was more moderate (1·7 years [1·6–1·7], from 77·3 [77·2–77·3] to 78·9 [78·9–79·0]), and there was no change in life expectancy for the AIAN population (0·0 years [–0·3 to 0·4], from 73·1 [71·6–74·7] to 73·1 [71·5–74·8]). There were also notable differences over time: for racial/ethnic groups where life expectancy increased from 2000 to 2019, the bulk of these gains accumulated prior to 2010. From 2010 to 2019, the API, Latino, Black, and White populations experienced only small improvements in life expectancy (by 0·8 [0·6–0·9], 0·3 [0·3–0·4], 0·5 [0·4–0·6], and 0·1 years [0·1–0·2], respectively).
Figure 1: National life expectancy by racial/ethnic group, 2000–2019.
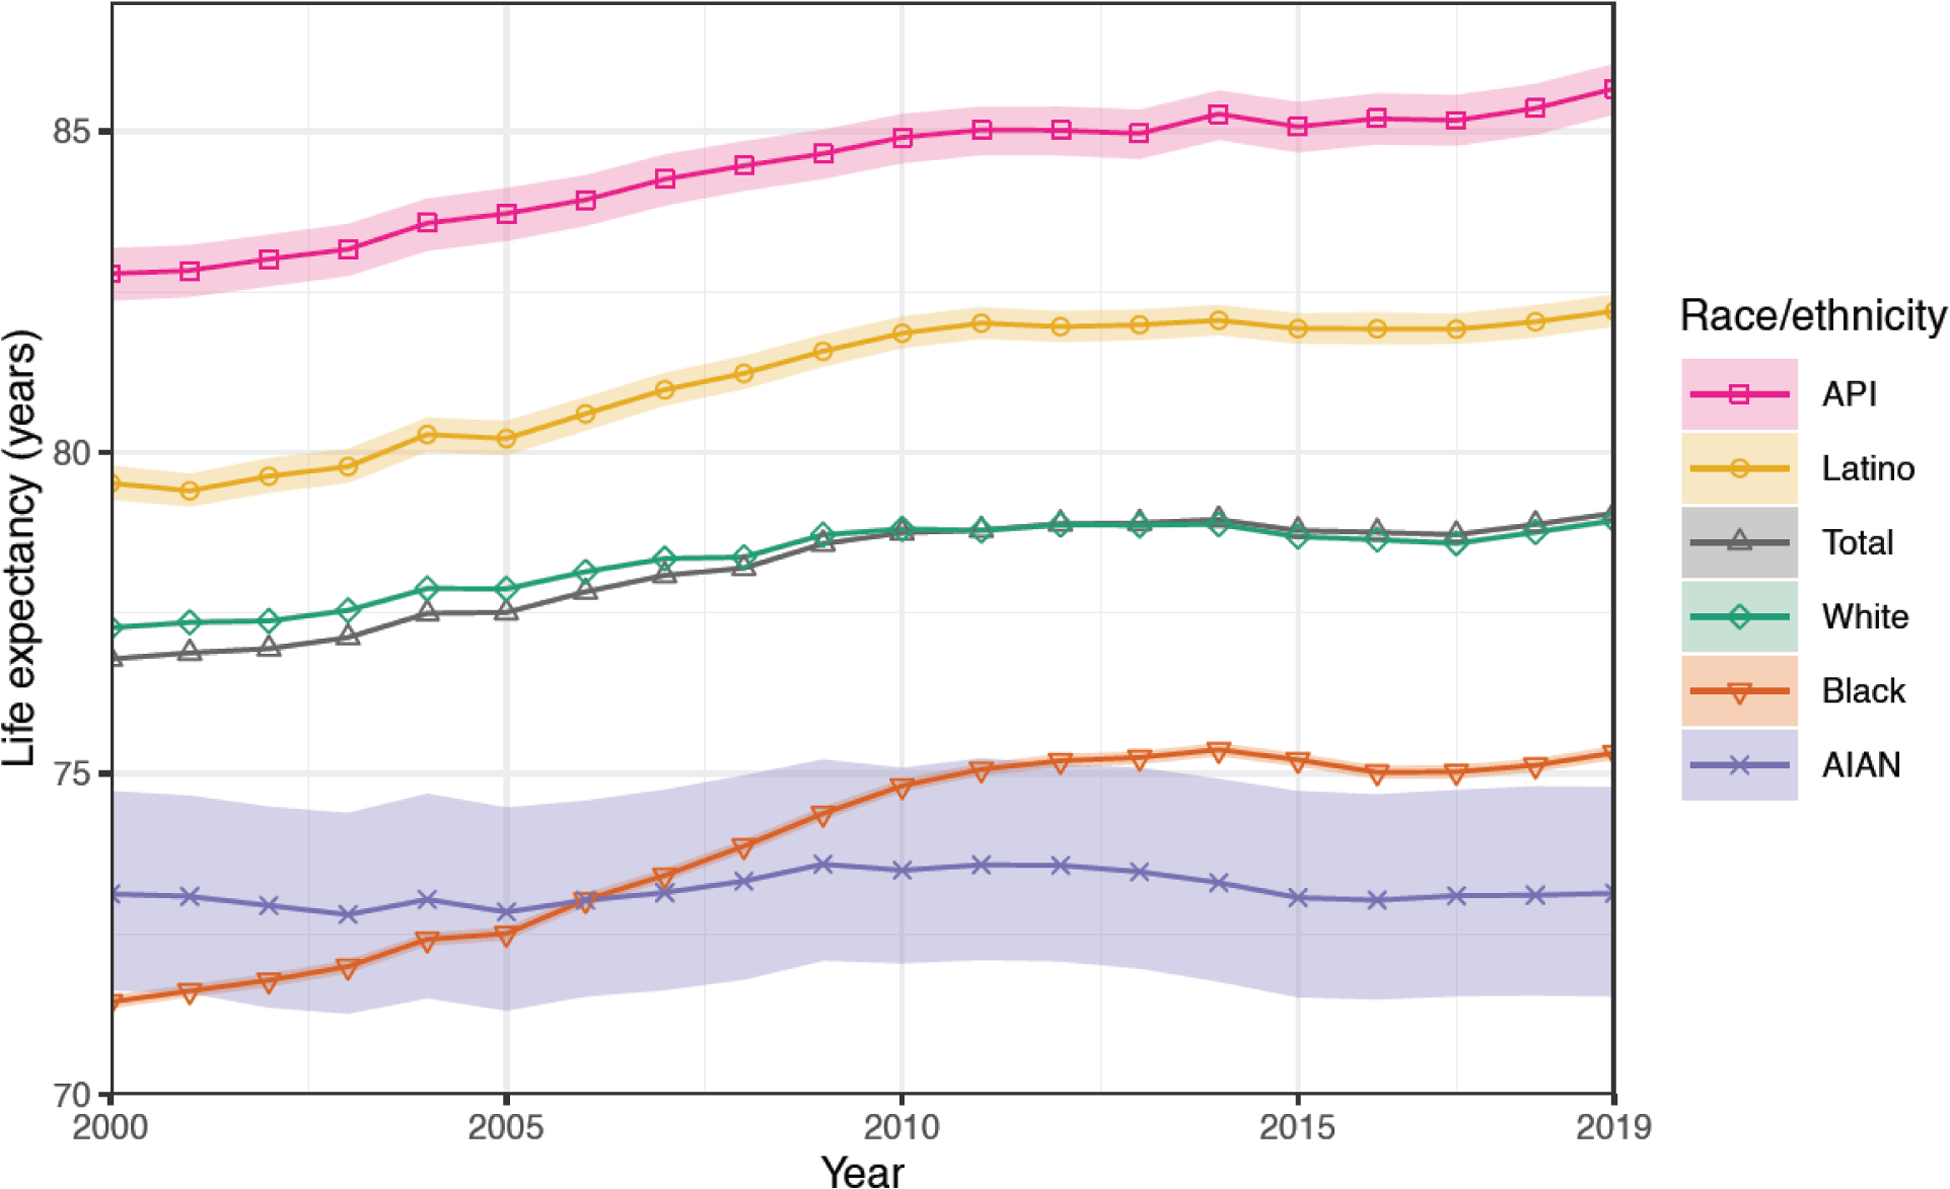
National life expectancy at birth by year and racial/ethnic group for 2000–2019. Solid lines indicate the mean estimates, and shaded areas indicate 95% uncertainty intervals.
The overall gap in life expectancy between the group with the lowest life expectancy and that with the highest increased from 11·3 years (95% UI 10·9–11·8) between the Black and API populations in 2000 to 12·5 years (10·8–14·1) between the AIAN and API populations in 2019. Compared to life expectancy for the White population—the majority group in the USA—life expectancy advantage increased among the API (by 1·2 years [1·1–1·4] from 5·5 [5·1–5·9] to 6·7 [6·3–7·1]) and Latino (by 1·0 years [0·9–1·1] from 2·3 [2·0–2·5] to 3·3 [3·0–3·5]) populations, while life expectancy disadvantage among the Black population decreased (by 2·2 years [2·1–2·3], from 5·8 [5·7–5·9] to 3·6 [3·5–3·7]). In all cases, this was driven by the relatively more moderate gains in life expectancy over this period by the White population compared to the API, Latino, and Black populations. In contrast, the life expectancy disadvantage experienced by the AIAN population compared to the White population increased over this period by 1·7 years (1·3–2·0), from 4·1 (2·6–5·7) to 5·8 (4·1–7·4).
Life expectancy in 2019 varied considerably at the county level, both overall and within and among different racial/ethnic groups (figure 2; results for 2000 and 2010 are shown in appendix section 5.1–5.2). For all racial/ethnic groups combined, estimated life expectancy in 2019 ranged from 64·5 to 91·7 years (median: 77·5; interquartile range [IQR]: 75·6–79·0) among counties with unmasked estimates. This range was 67·4 to 91·9 (median: 77·6; IQR: 75·8–79·1) for the White population, 66·5 to 88·8 (median: 74·3; IQR: 72·7–76·6) for the Black population, 58·6 to 93·3 (median: 73·3; IQR: 69·3–78·5) for the AIAN population, 78·5 to 92·7 (median: 85·6; IQR: 84·1–86·9) for the API population, and 71·3 to 94·9 (median: 83·9; IQR: 81·2–86·3) for the Latino population. Gaps in life expectancy across racial/ethnic groups relative to the White population were in the same direction as observed at the national level in most counties; however, the magnitude of these gaps varied substantially (figure 3; results for 2000 and 2010 are shown in appendix section 5.3–5.4). Estimated life expectancy was lower for the Black population compared to the White population in 1287 of 1480 counties (87·0%; statistically significant in 67·9%); among these counties, this gap in estimated life expectancy ranged from −15·5 to 7·9 years (median: −2·4; IQR: −3·7 to −1·1). For the AIAN population, estimated life expectancy was lower compared to the White population in 314 of 418 counties (75·1%; statistically significant in 57·9%); among these counties, the range of this gap in estimated life expectancy was −21·7 to 13·9 years (median: −5·3; IQR: −9·0 to 0·0). Life expectancy estimates were higher for the API compared to the White population in 656 of 666 counties (98·5%; statistically significant in 96·5%); this gap ranged from – 1·3 to 14·9 years (median: 6·4; IQR: 5·0–7·9) among these counties. For the Latino population, estimated life expectancy was higher compared to the White population in 1356 of 1468 counties (92·4%; statistically significant in 84·5%); the gap in estimated life expectancy ranged from −12·3 to 16·4 years (median: 5·4; IQR: 2·8–8·7 years) among these counties. Life expectancy was positively correlated across counties for all pairs of racial/ethnic groups in 2019, but the strength of this correlation was relatively weak (Pearson correlation coefficient <0.4) except for the Black and White populations (Pearson correlation coefficient = 0.69 in the 1480 counties with unmasked estimates) and the API and White populations (Pearson correlation coefficient = 0.43 in the 666 counties with unmasked estimates).
Figure 2: County life expectancy by racial/ethnic group, 2019.
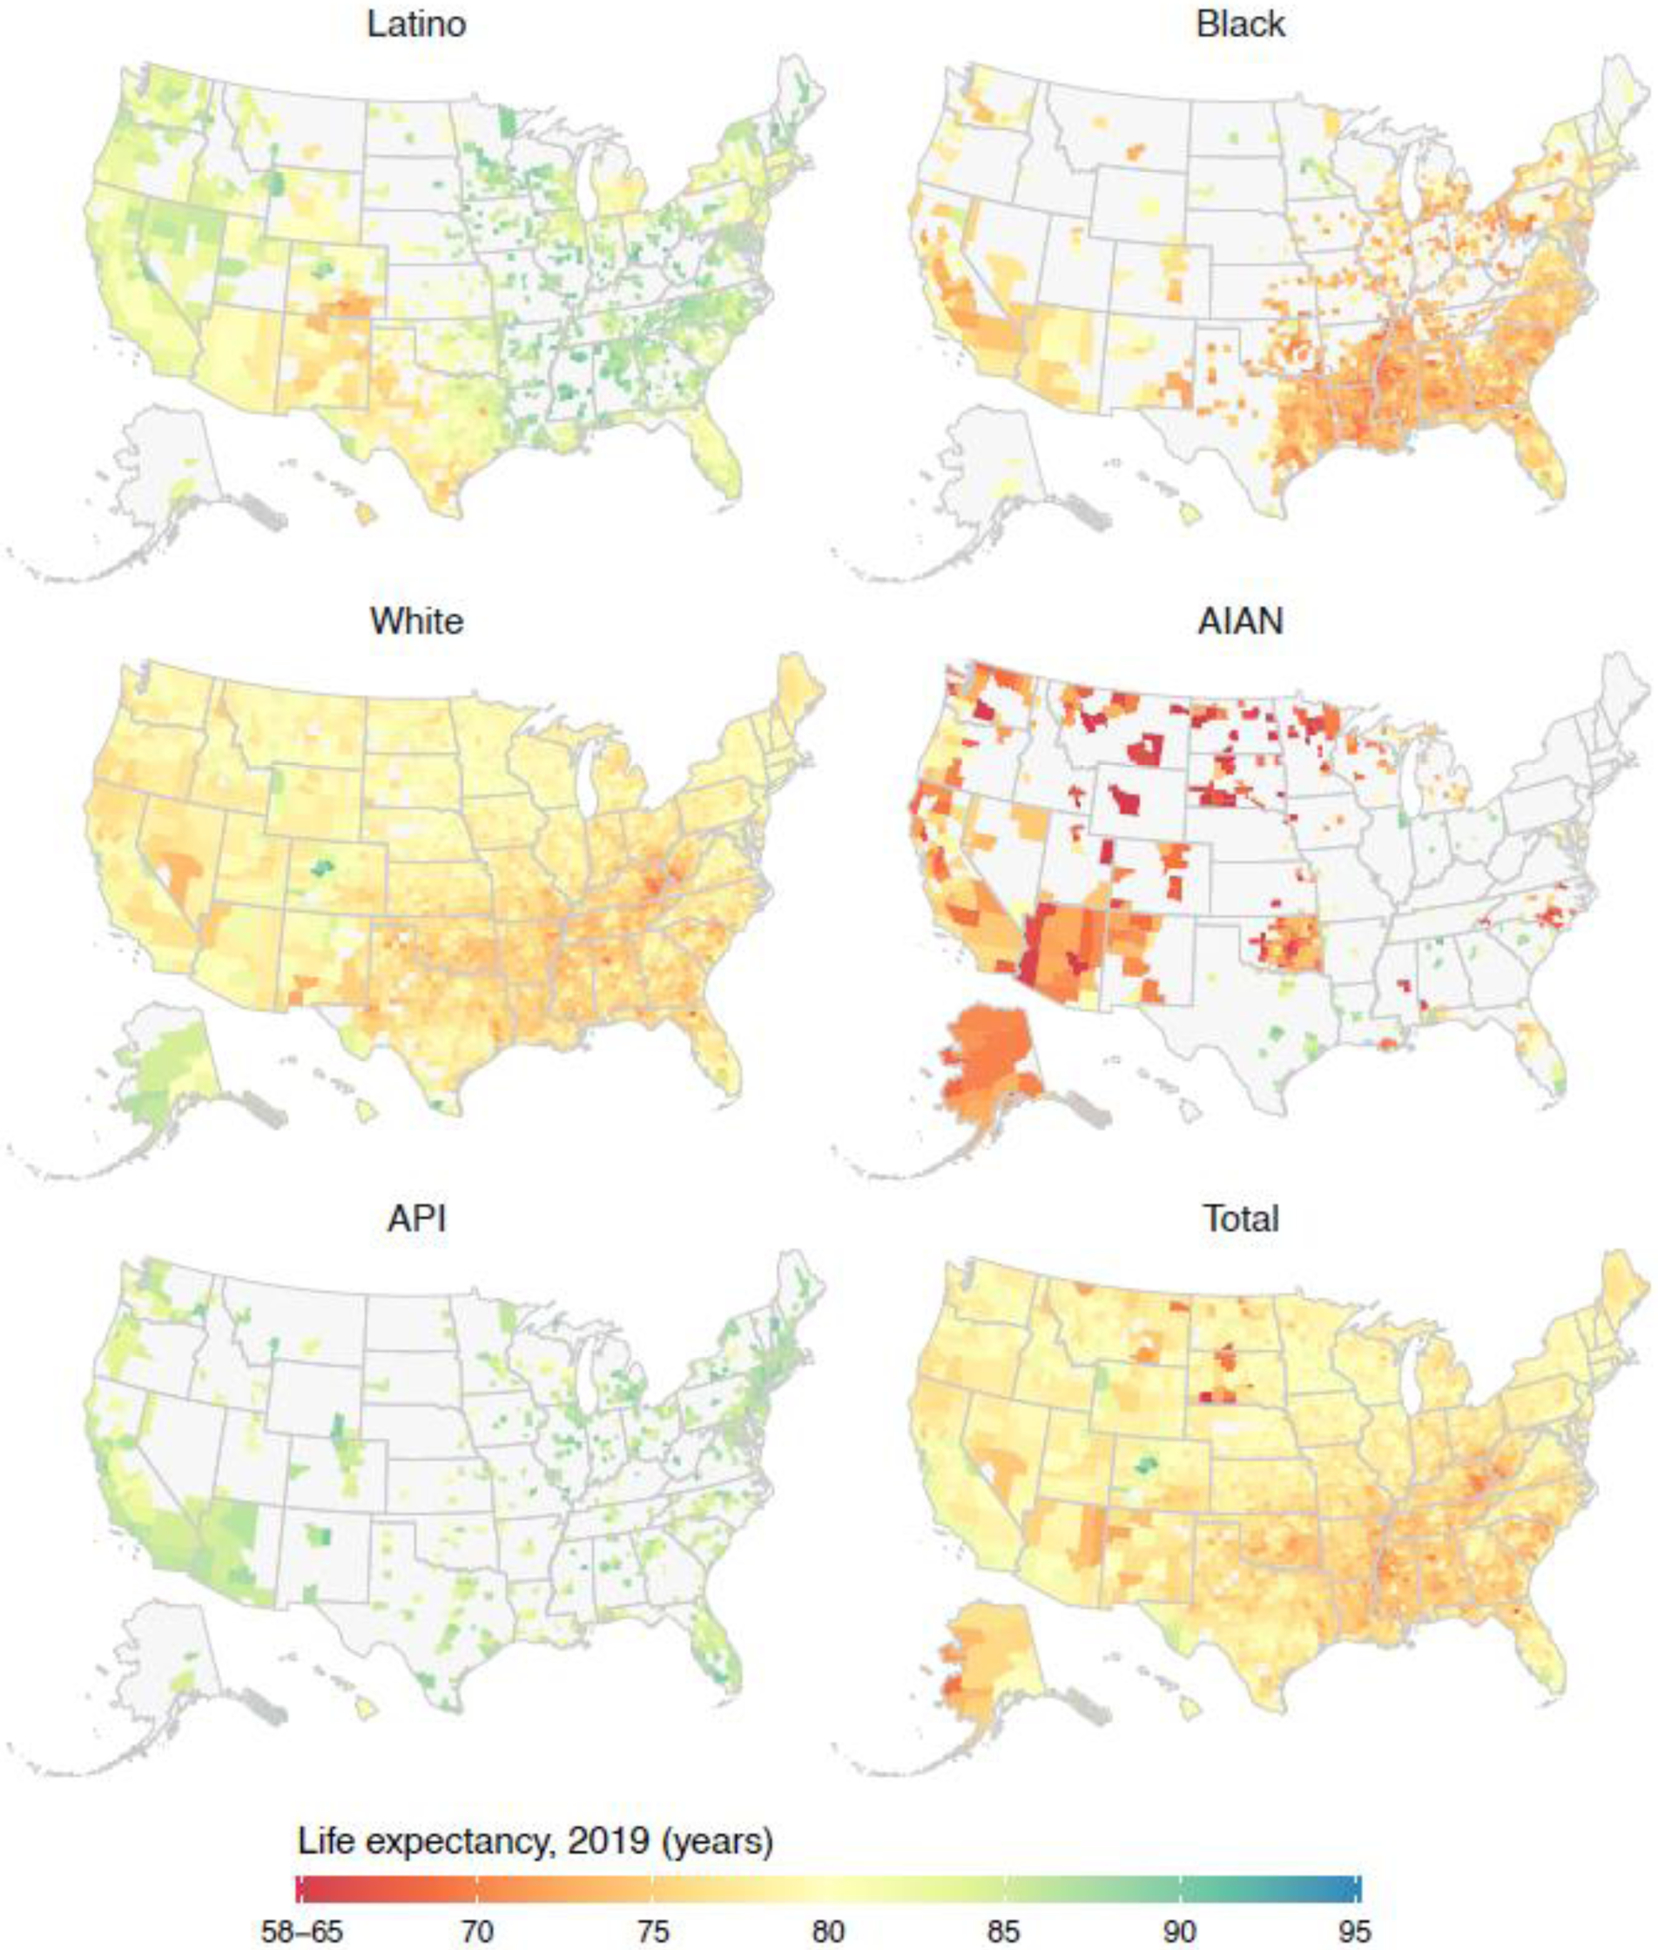
County life expectancy at birth by racial/ethnic group in 2019. The colour scale is truncated at 65 and 95 years, as indicated by the ranges in the legend. Estimates of life expectancy in county-racial/ethnic group combinations with an average annual population less than 1000 people and/or estimates with an uncertainty interval width greater than ten years are masked and depicted here in grey.
Figure 3: Differences in county life expectancy among racial/ethnic groups compared to the White population, 2019.
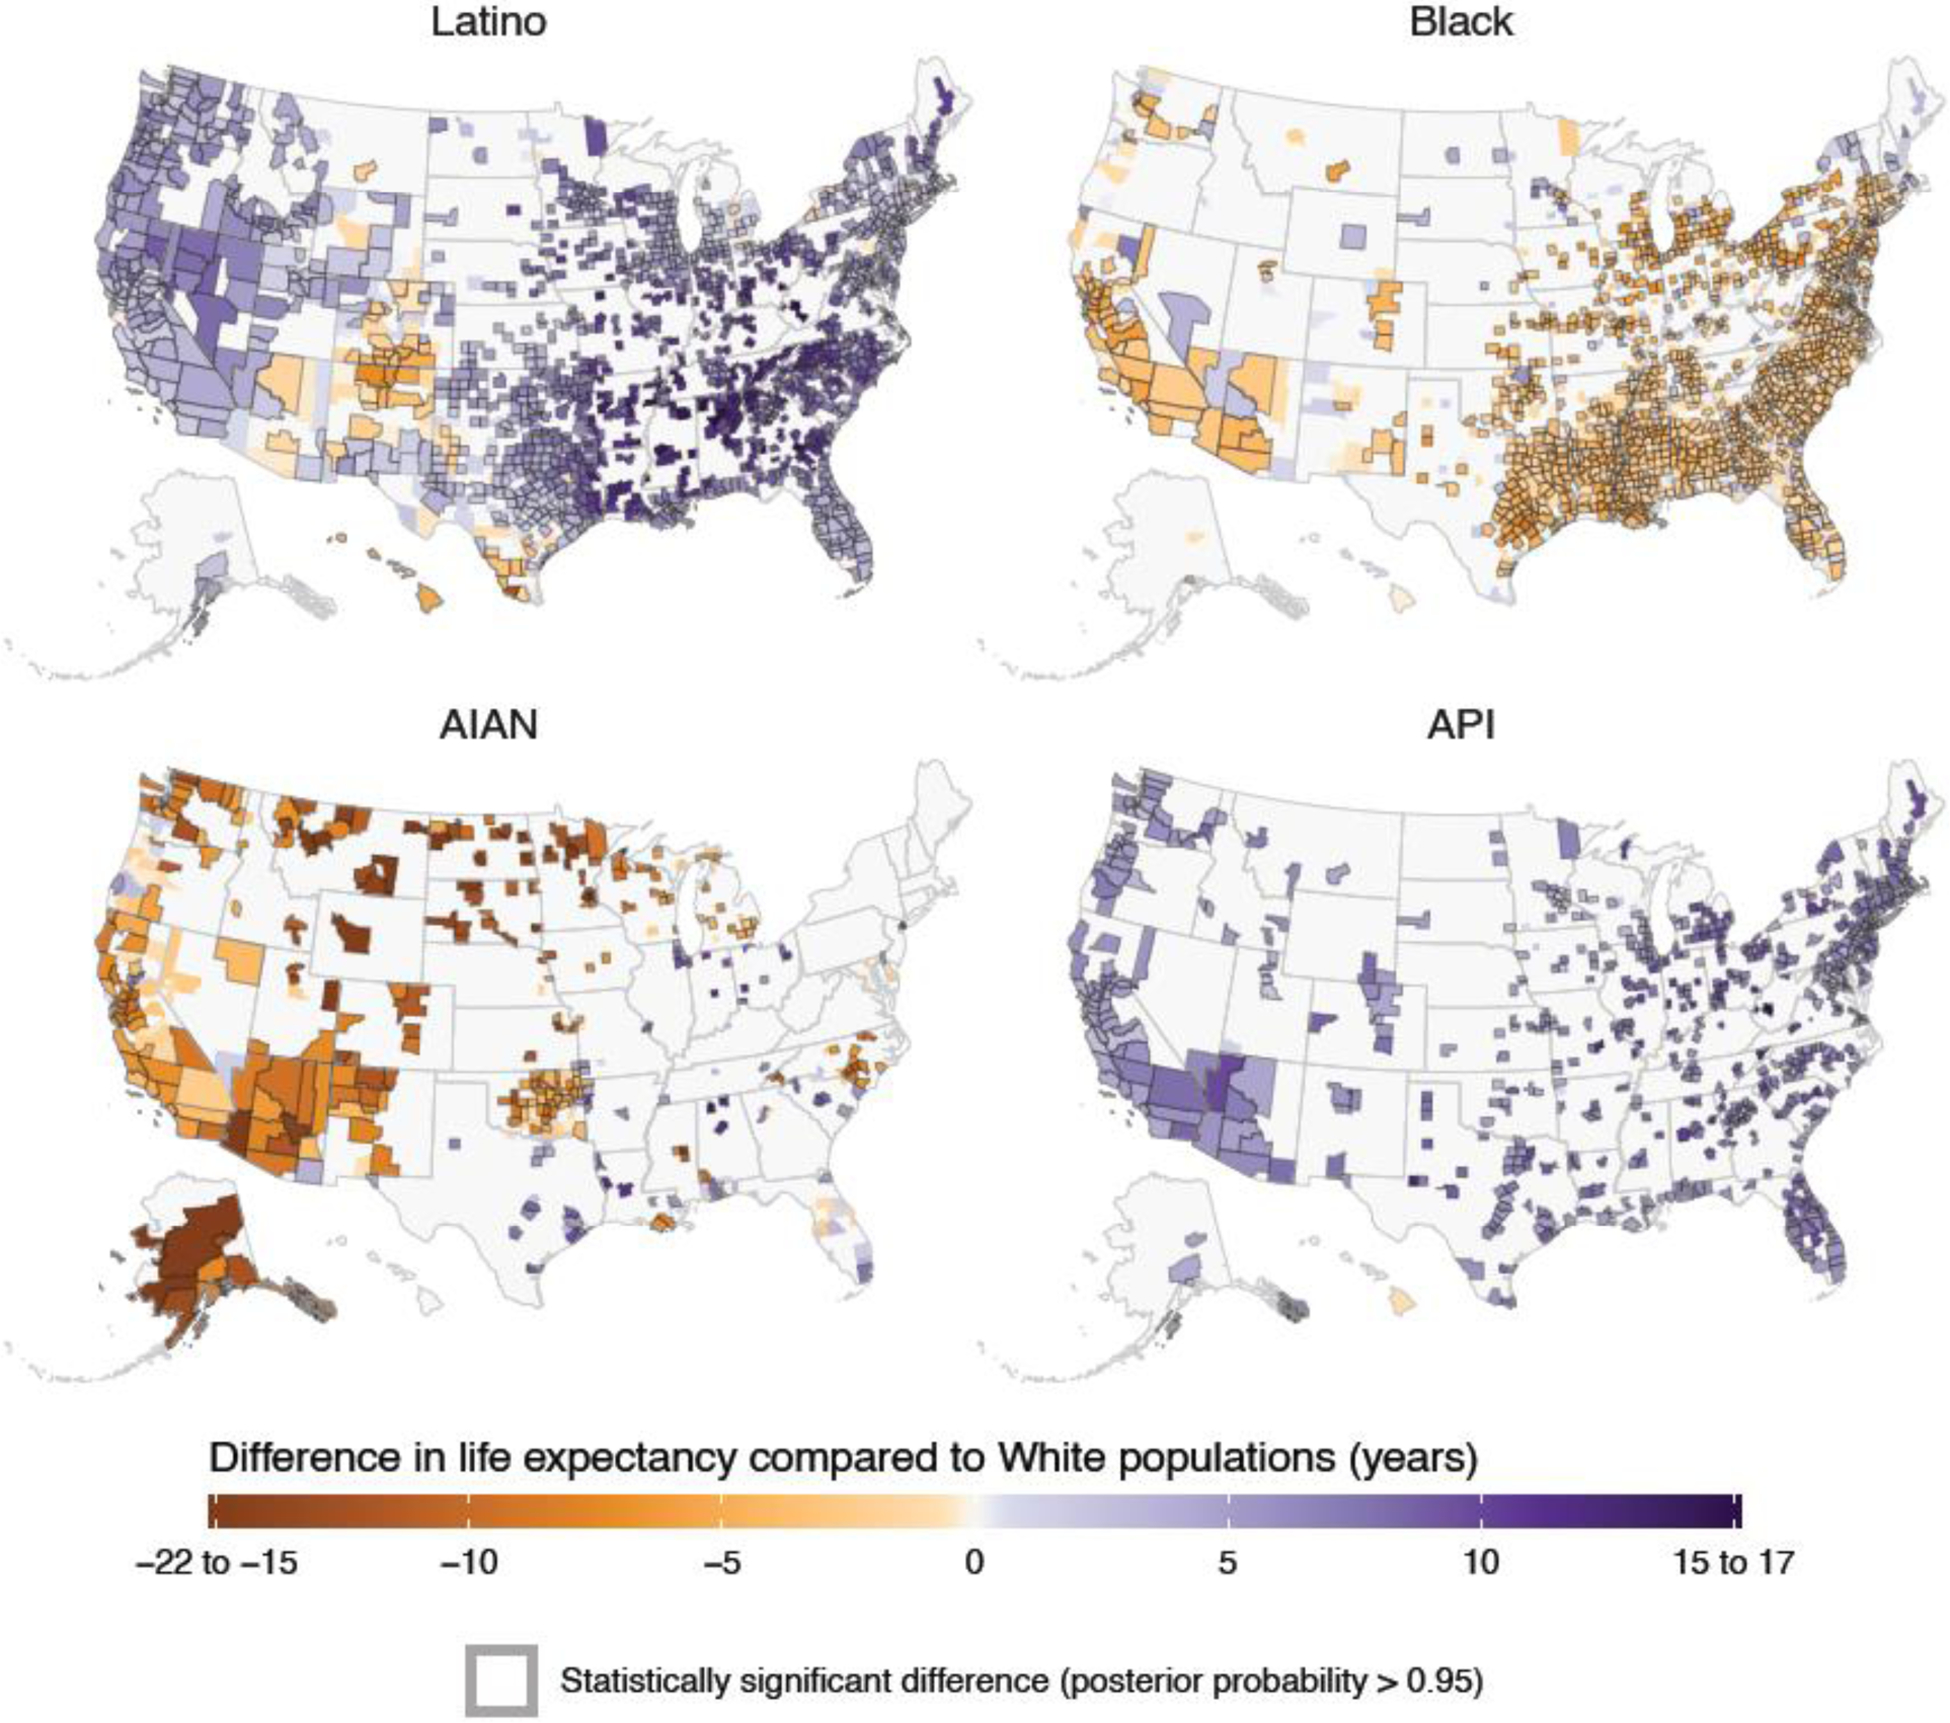
Absolute difference in county life expectancy at birth by racial/ethnic group in 2019, relative to life expectancy for the White population in the same county. The colour scale is truncated at −15 and 15 years, as indicated by the ranges in the legend. Grey boundaries around a county indicate an estimated difference in life expectancy that is statistically significant. Estimates of life expectancy in county-racial/ethnic group combinations with an average annual population less than 1000 people and/or estimates with an uncertainty interval width greater than ten years are masked and depicted here in grey.
Most counties experienced an increase in life expectancy from 2000 to 2019 (2711 of 3079 [88·0%; statistically significant in 57·0%]) (figure 4; results for 2000–2010 and 2010–2019 are shown in appendix section 5.5–5.6). Similar to what was observed at the national level, most of these gains accumulated from 2000 to 2010, with smaller gains and in many cases regression from 2010 to 2019: 2999 of 3079 counties (97·4%; 79·4% statistically significant) experienced an increase in estimated life expectancy from 2000 to 2010, while only 1234 of 3079 (40·1%; statistically significant in 10·7%) experienced an increase from 2010 to 2019, and 59·9% (statistically significant in 18·0%) experienced a decrease from 2010 to 2019. This overall trend of more widespread and larger increases in 2000–2010 compared to 2010–2019 was observed in each racial/ethnic group, but there were substantial differences within and among groups in the overall change estimated from 2000 to 2019. Nearly all counties with unmasked estimates experienced an increase in life expectancy for the Black population over this period (1442 of 1481 [97·4%, statistically significant for 71·2%]), with estimated changes ranging from −3·7 to 9·0 years (median: 2·6; IQR: 1·6–3·5). Smaller majorities of counties also saw an increase in estimated life expectancy for the API (566 of 667 [84·9%, statistically significant for 40·0%]), White (2486 of 3049 [81·5%, statistically significant for 49·5%]), and Latino populations (1131 of 1474 [76·7%, statistically significant for 35·1%]), with estimated changes ranging from −3·2 to 6·3 years (median: 1·2; IQR: 0·4–2·1) for the API population, −5·2 to 8·0 years (median: 0·9; IQR: 0·2–1·6]) for the White population, and – 5·1 to 7·3 years (median: 1·4; IQR: 0·1–2·6 years) for the Latino population. In contrast, estimated life expectancy declined in most counties for the AIAN population (222 of 359 [61·8%, statistically significant for 22·8%]), with estimated changes ranging from −8·2 to 20·5 years (median: −1·0; IQR: −2·9 to 1·0).
Figure 4: Change in county life expectancy by racial/ethnic group, 2000–2019.
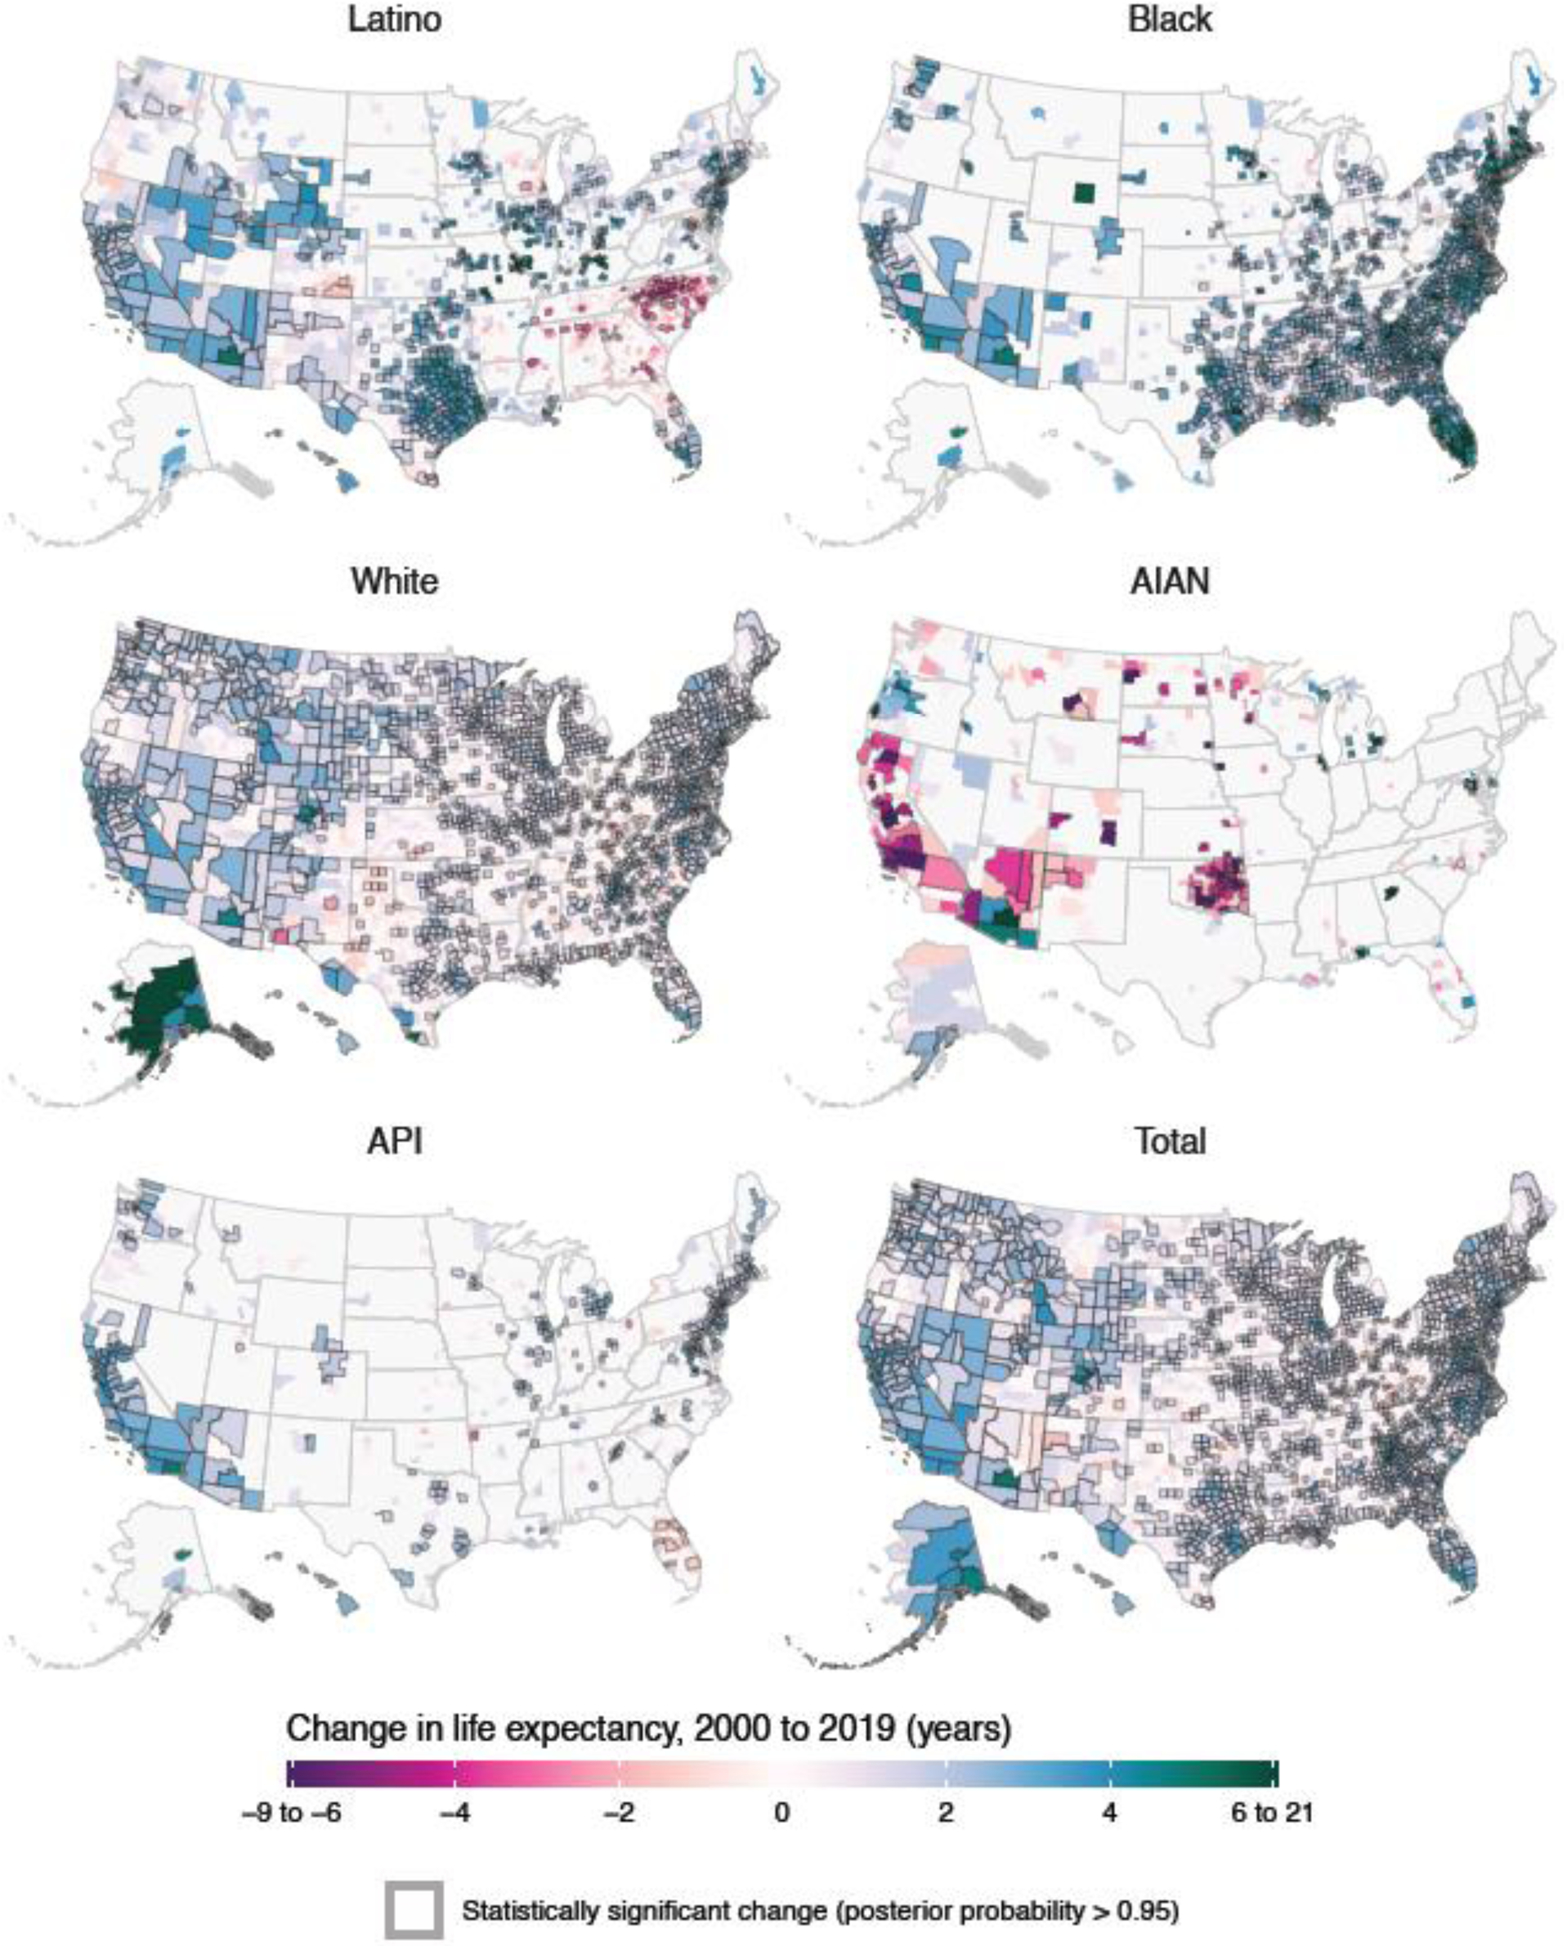
Absolute change in county life expectancy at birth from 2000 to 2019 by racial/ethnic group. The colour scale is truncated at an absolute difference of −6 and 6 years, as indicated by the ranges in the legend. Grey boundaries around a county indicate an estimated change in life expectancy that is statistically significant. Estimates of life expectancy in county-racial/ethnic group combinations with an average annual population less than 1000 people and/or estimates with an uncertainty interval width greater than ten years are masked and depicted here in grey.
Because of these differential trends, gaps in life expectancy between racial/ethnic groups increased in some groups and in some locations while decreasing in others (figures 5–6, appendix section 5.7–5.10). At the county level, increases in estimated life expectancy were more widespread and in most cases larger for the Black compared to the White population. These larger gains translated to a decrease in estimated life expectancy disadvantage for the Black compared to the White population in most counties (1159 of 1479 [78·4%; statistically significant in 30·8%]), and in a smaller number of counties (124 [8·4%; statistically significant in 0·7%]) resulted in a change in the estimated direction of this gap from negative to positive. Essentially the reverse of this trend was observed for the AIAN population, among whom decreases in estimated life expectancy were more widespread and generally larger compared to the White population. Over this period, we estimated an increase in life expectancy disadvantage for the AIAN compared to the White population in most counties (204 of 348 [58·6%; statistically significant in 21·3%]) and a reversal from life expectancy advantage to disadvantage in an additional 53 counties (15·2%; statistically significant in 0·6%). A very different pattern was observed for the gap in life expectancy between the API and White populations. In both 2000 and 2019, life expectancy among the API population was higher than among the White population in nearly all counties; however, over this period, this life expectancy advantage for the API population compared to the White population declined in most counties (401 of 666 [60·2%; statistically significant in 14·7%]), despite an overall increase at the national level. We similarly estimated that life expectancy among the Latino population exceeded that among the White population in large majorities of counties in both 2000 and 2019; however, over this period, the life expectancy advantage for the Latino population compared to the White population declined in many counties (615 of 1465 [42·0%; statistically significant in 12·4%]).
Figure 5: Change in county life expectancy by racial/ethnic group compared to the White population, 2000–2019.
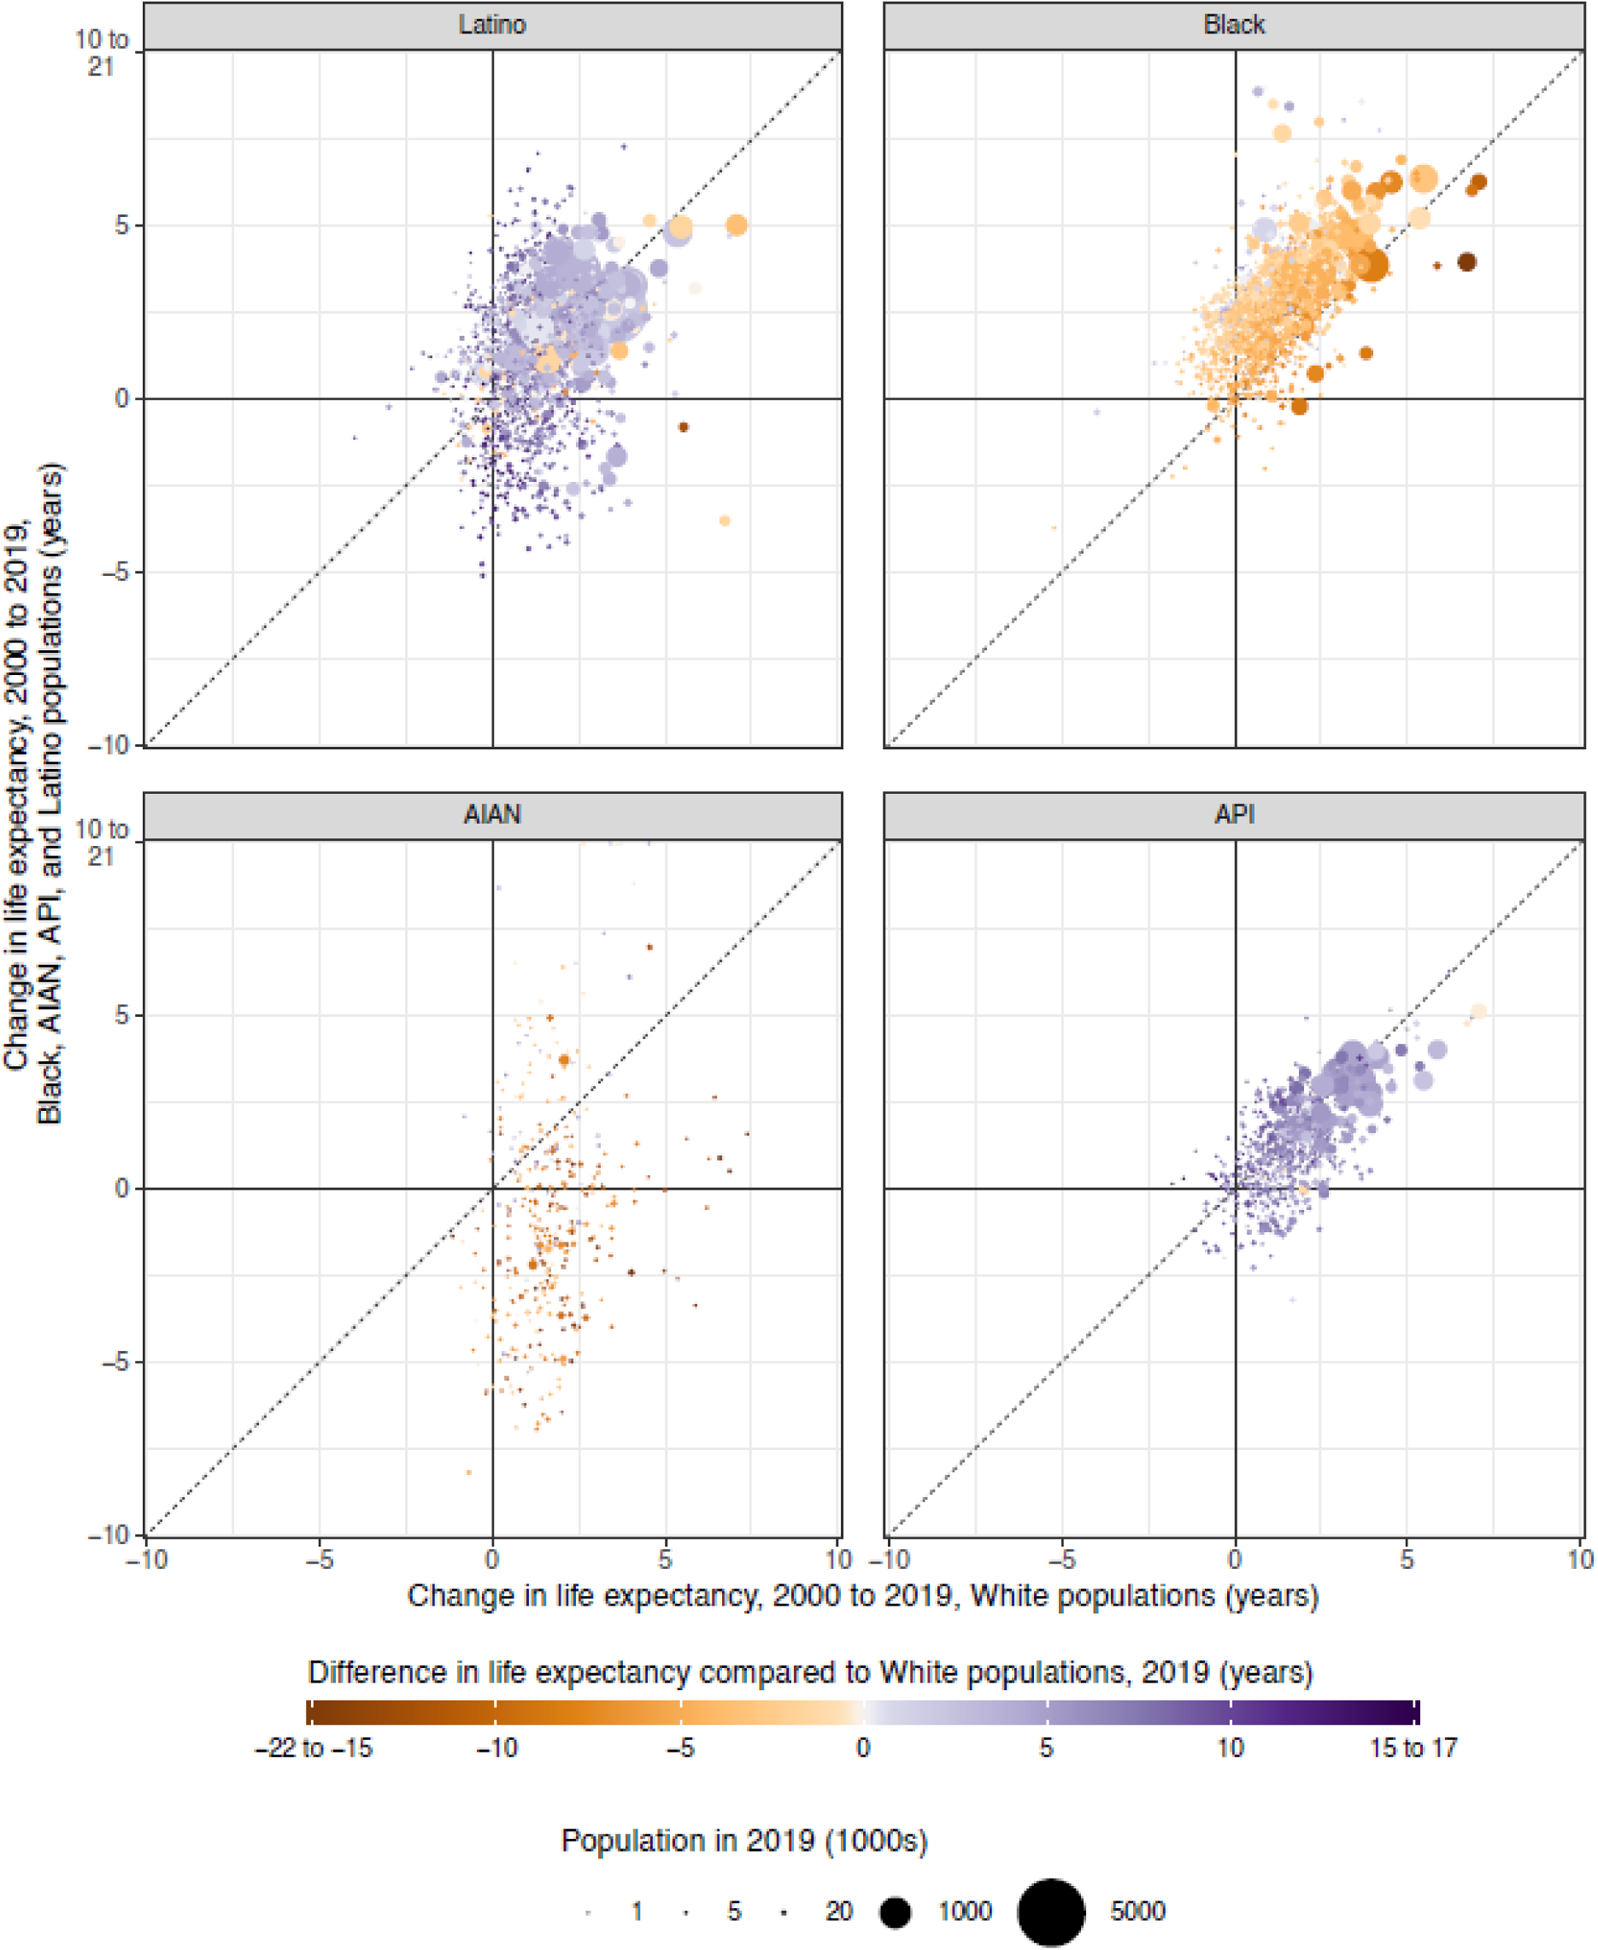
Absolute change in county life expectancy at birth from 2000 to 2019 for each racial/ethnic group compared to this same change for the White population in the same county. Each point corresponds to a county. The colour of each point indicates the difference in life expectancy in this county in 2019 between the racial/ethnic group specified in the panel title and the White population, and the size of the point indicates the population in this county in 2019 for the racial/ethnic group specified. The axes are truncated at −10 and 10 years, as indicated by the axis labels, and the colour scale is truncated at – 15 and 15 years, as indicated by the ranges in the legend. Estimates of life expectancy in county-racial/ethnic group combinations with an average annual population less than 1000 people and/or estimates with an uncertainty interval width greater than ten years are not displayed.
Figure 6: Change in differences in county life expectancy among racial/ethnic groups compared to the White population, 2000–2019.
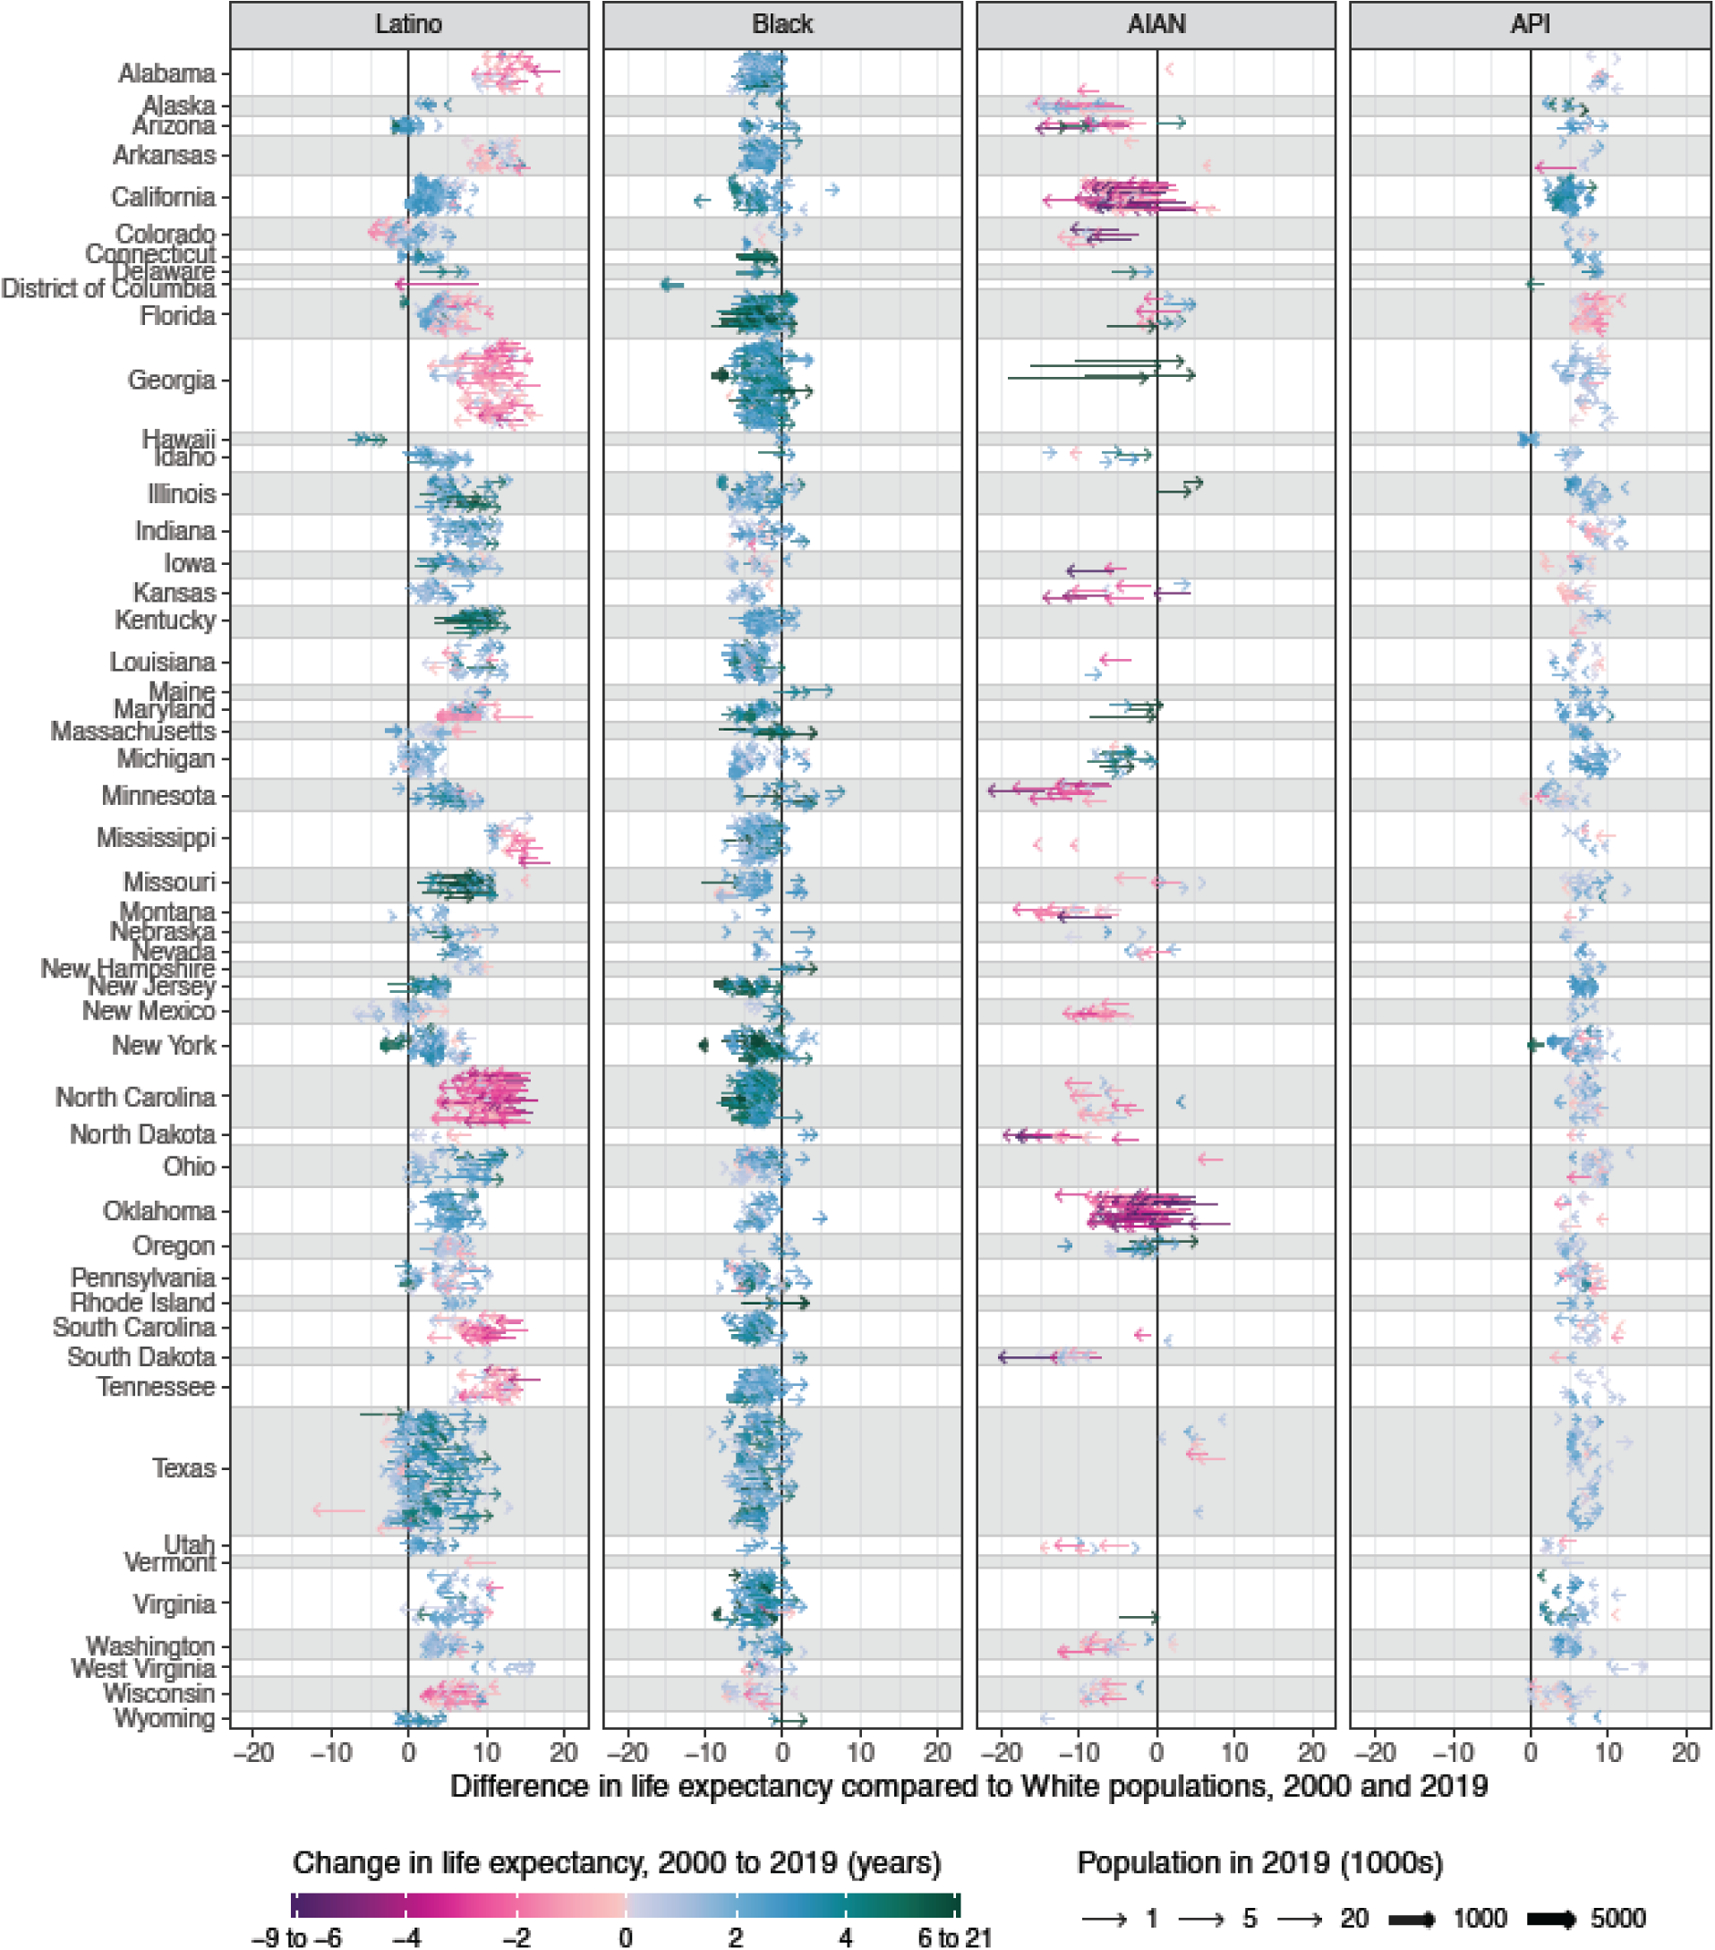
Absolute difference in county life expectancy at birth by racial/ethnic group in 2000 and 2019, relative to life expectancy for the White population in the same county. Each arrow corresponds to a county, and the arrow starts at the difference in life expectancy between the racial/ethnic group specified in the panel title and the White population in that county in 2000 and ends at the same quantity in 2019. The colour of each arrow indicates the change in life expectancy over this period in a given county for the specified racial/ethnic group, and the size of the arrow indicates the population of this racial/ethnic group in 2019. The colour scale is truncated at an absolute difference of −6 and 6 years, as indicated by the ranges in the legend. Estimates of life expectancy in county-racial/ethnic group combinations with an average annual population less than 1000 people and/or estimates with an uncertainty interval width greater than ten years are not displayed.
Discussion
In this study, we present estimated trends in life expectancy and disparities by county and racial/ethnic group from 2000 to 2019. These estimates provide the most comprehensive view to date of spatial-temporal patterns in life expectancy and disparities among racial/ethnic groups, including, for the first time at the county level, estimates for the AIAN and API populations, and estimates corrected for misclassification of racial/ethnic identity on death certificates. Our results highlight considerable variation in life expectancy among racial/ethnic groups, locations, and over time, and expose both positive and negative trends. These findings underscore the pressing need for local-level, detailed data to support efforts to address and eliminate racial/ethnic health disparities; and provide an opportunity to better understand the root causes of these disparities. The estimates provided here can serve as a tool for tailoring action and tracking progress towards a more equitable future. This analysis also highlights important data limitations in the USA that warrant urgent attention.
The results of this analysis provide a unique opportunity to examine changes over time in gaps in life expectancy among racial/ethnic groups, as well as the extent to which these temporal changes differed by geographical location. Consistent with other studies,9,11,24 our analysis found that the gap in life expectancy between Black and White Americans narrowed at the national level between 2000 and 2019. This analysis finds broadly similar trends in most counties: larger increases in life expectancy for the Black population, smaller increases or decreases in life expectancy for the White population, and narrowing gaps in life expectancy as a result. While this narrowing gap is a welcome trend, the fact that most of this progress occurred in the first decade of the 21st century and that this trend is due in part to stagnation and/or reversals of gains in life expectancy for the White population are reasons for pause.
This analysis identifies alarming trends in life expectancy for the AIAN population. Even in the context of relatively lacklustre trends in life expectancy among the White population, the already large gap between the AIAN and White populations grew from 2000 to 2019, both nationally and in most counties. Life expectancy among the AIAN population is under-studied, in part because of the challenges presented by misclassification of racial identity on death certificates. Nonetheless, our results are broadly consistent with previous studies focusing on life expectancy at the national level12 or among the AIAN population living in Contact Health Service Delivery Areas for the Indian Health Service,10,39 which find lower life expectancy for the AIAN population compared to the Black, White, and Latino populations,10,12 and a growing gap in life expectancy between the AIAN and White populations over time.39
The results of this analysis paint a more positive picture for the Latino and API populations at the national level, but not in all counties. Throughout the period considered, these groups had the highest life expectancies both nationally and in nearly all counties. However, life expectancy declined for the Latino population in approximately one in four counties with unmasked estimates, and similarly declined for the API population in approximately one in seven counties. Thus, while these population groups maintained longer life expectancy compared to the White population over this period, the size of this advantage declined for the Latino population in a sizeable minority of counties, and for the API population in a majority of counties with unmasked estimates. The life expectancy advantage of the Latino population compared to the White population has been extensively studied at the national level.6,40,41 These studies have found that lower mortality rates among Latino compared to non-Latino populations are largely restricted to foreign-born individuals and USA-born White individuals, with similar racial disparities observed within the USA-born Latino population as in the non-Latino population.6 Various explanations for the lower mortality rates among foreign-born Latino individuals have been proposed, including positive emigration selection (ie, healthier individuals are more likely to emigrate)42,43 and differential risk profiles (eg, lower smoking rates among immigrants).44 Notably, only a small part of this difference is thought to be explained by individuals in poor health returning to their country of origin prior to death and thus being excluded by USA mortality statistics.45 By comparison, life expectancy trends among the API population are under-studied, although previous research also finds higher life expectancy for the API population compared to other groups.46 We note again that estimates for the API population very likely mask important differences in life expectancy between Asian and NHOPI populations, and that part of the variation we observe in life expectancy across counties for the API population may be related to differences in the composition of this combined group—for example, we observe that counties where NHOPI individuals make up a larger part of the API population typically have lower life expectancy estimates for the API group as a whole (appendix section 5.11).
The magnitude and ubiquity of differences in life expectancy among racial/ethnic groups shown here demand explanation. There is extensive evidence that racism is a cause of poor health and increased risk of death among marginalised groups in the USA, particularly the Black and AIAN populations.3,4,47 Previous research has highlighted the effects of racism on socioeconomic disadvantage and inequitable access to life-conserving resources as critical pathways connecting racism and negative health outcomes,48 and there is evidence supporting additional mechanisms linking racism to health outcomes, including residential segregation,49 mass incarceration,50 chronic stress,51,52 and discriminatory/lower-quality health care.53 On the basis of this evidence, we believe it is reasonable to conclude that the persistent and geographically widespread gaps in life expectancy observed between the Black and AIAN populations and the White population in this study reflect the impact of systemic racism. Despite the abundance of evidence demonstrating a causal relationship between racism and negative health impacts, however, this relationship is complicated, and the precise role that racism and efforts to combat racism play in explaining differences in the degree of disparities in life expectancy for different racial/ethnic groups, different locations, and over time is less well understood. There is a pressing need to better understand the nuances of these relationships, and to design and implement solutions that result in improved and more equitable health outcomes. Operationalising and collecting measures of different forms of structural racism will be critical for these efforts to succeed.54,55
The results of this study also highlight stark geographical disparities in life expectancy overall and within each racial/ethnic group. Previous research on county-level variation in longevity has identified several potential driving factors, including county-level differences in income, educational attainment, and other markers of socioeconomic status; exposure to environmental risks; prevalence of health risks such as smoking, obesity, hypertension, and diabetes; differences in the built environment; the proportion of the population that is foreign-born; access to/quality of health care; and health promotion efforts at the local level.7,17,23,56–59 These factors likely influence county-level differences in life expectancy between and within each racial/ethnic group. Additionally, internal migration60 and changes to self-identification of race/ethnicity over time61,62 could affect the patterns of life expectancy observed in this study. Further research examining the differences in life expectancy among counties, particularly by race/ethnicity, may shed light on these potential pathways and mechanisms. Those counties in which reversals over time in the direction of life expectancy gaps between the White population and other racial/ethnic groups were observed present a unique opportunity to examine absolute levels of health in these communities over time and factors that could explain these reversals.
This analysis covers the two decades preceding the COVID-19 pandemic, and the trends described here provide context for the changes to mortality and disparities that have occurred since the beginning of the pandemic. Provisional estimates for 2020 show substantial declines in life expectancy overall and for the Black, Latino, and White populations in the USA.63 These declines were larger for the Latino and Black populations (3.0- and 2.9-year decline, respectively, from 2019 to 2020) compared to the White population (1.2-year decline), resulting in an increase in life expectancy disadvantage for the Black compared to the White population that effectively erases much of the decline in this gap observed over the period of this study, and a decrease in life expectancy advantage for the Latino population.63 National life expectancy estimates for 2020 are not yet available for other racial/ethnic groups, but other studies have found higher rates of COVID-19 mortality64 and of excess all-cause mortality65 among AIAN and NHOPI populations, in addition to among Black and Latino populations, compared to the White population. While life expectancy increased overall and the magnitude of disparity between the Black and White populations declined in many communities from 2000 to 2019, the considerably less impressive gains from 2010 to 2019 compared to the previous decade were already cause for concern. The dramatic decrease in life expectancy and increase in disparity among racial/ethnic groups in 2020 underscores that further progress in improving life expectancy and reducing disparities is by no means assured.
Despite the urgent need to track racial and ethnic inequalities in longevity in the USA, studying this topic is inherently difficult due to misclassification of racial and ethnic identity on death certificates. We sought to mitigate the effect of this misclassification by adjusting our estimates using previously published misclassification ratios;20 however, this adjustment is necessarily somewhat crude and assumes the applicability of misclassification ratios calculated at the national level to county-level mortality rates, the invariance of these ratios over time, the sampling distribution of the misclassification ratio estimates, and the independence of differences in misclassification by age and sex, census region, and co-ethnic density. Violation of these assumptions may lead to errors in the resulting estimates. This is unlikely to significantly affect estimates for the White and Black populations but could lead to more substantial errors in estimates for the Latino, API, and AIAN population. Developing locally tuned corrections for racial/ethnic group misclassification is an important area for future research, but fully addressing this challenge requires eliminating these errors in the first place by ensuring that the race and ethnicity recorded on an individual’s death certificate accurately reflect their self-identification in life.66,67
This analysis is subject to several additional limitations. First, the deaths, population, and covariates data are subject to error. Second, we use a small area estimation model that has been shown to perform well for county-race/ethnicities with populations as small as 1000 people, however our validation framework leverages data in county-race/ethnicities with large populations as a “gold standard,” and consequently the White population is over-represented, as are more urban counties generally, limiting the generalizability of the validation results. Third, this small area model smooths over space, time, age group, and racial/ethnic group, and the effect of this smoothing is most substantial for small populations. While this smoothing is useful for increasing the amount of information available for each location and group, and thus generally allows us to produce more reliable estimates, there may be particular cases where this smoothing is inappropriate and leads to errors. Fourth, the estimates presented in this study are associated with uncertainty, as indicated by the 95% uncertainty intervals, which is typically greater for county-race/ethnicities with smaller populations, racial/ethnic groups with smaller populations overall, and in cases where the additional uncertainty introduced by the misclassification adjustment is greater. Consequently, the estimates for the White population are typically the most certain, while estimates for other racial/ethnic groups and particularly the AIAN population are subject to a much higher degree of uncertainty and are more frequently masked. Similarly, uncertainty tends to be higher, and masking more substantial, in rural as compared to more urban counties. Ideally, reliable estimates would be presented for each racial/ethnic group in all counties where some members of that group live, but this is not currently possible given the high degree of uncertainty in many areas. Fifth, we are unable to account for several sources of uncertainty, including uncertainty due to potential measurement errors in the deaths, population, and covariates data, and uncertainty due to model misspecification. Sixth, this study considers five racial/ethnic groups, despite the considerable heterogeneity within each of these groups. Due to data availability constraints, this includes a combined API group, which masks known differences in health between Asian and NHOPI populations. Studies that report separately for the NHOPI population generally show worse health outcomes for this group compared to the Asian population31,32—for example, a study in Hawaii found that life expectancy in 2000 was substantially lower among Samoan and Hawaiian individuals (72.8 and 74.3 years, respectively) than among Filipino, Korean, Japanese, and Chinese individuals (80.9, 81.4, 82.8, and 86.1 years, respectively)30—and the figure in appendix section 5.11 further underscores the limitations of using a combined API group. Further research is needed to disaggregate this group in order to better understand and ultimately address disparities affecting NHOPI populations. Additionally, only “primary” race was considered, despite a growing population of individuals in the USA who identify as more than one race: individuals reporting two or more races were 10.2% of the total USA population in the 2020 census, a 276% increase compared to the 2010 census, with part of this increase likely due to methodological changes in the census.68 Finally, the period life expectancy estimates presented here are a cross-sectional measure of population health, reflecting the mortality patterns in the population residing in a county at a given point in time. These estimates should be interpreted cautiously in this light, particularly for counties with highly dynamic populations due to in- or out-migration, the presence of large colleges and universities, or the presence of correctional facilities.
Identifying and precisely describing disparities in life expectancy among racial/ethnic groups and localities is a critical step towards promoting equity and improving longevity for all people in the USA. In future work, we plan to consider how mortality from specific causes varies among racial/ethnic groups and counties, and how this contributes to the overall disparities that we describe here in all-cause mortality and life expectancy, in hopes that this will provide further information useful for informing efforts to reduce these disparities. We also note that life expectancy is solely a function of mortality, and therefore disparities in health overall—including both mortality and morbidity—are very likely larger than disparities in life expectancy. Consequently, another future direction for this work will be to consider disparities in healthy life expectancy. Health inequalities of all kinds have been especially apparent during the COVID-19 pandemic, which has had a disproportionate impact on marginalized racial/ethnic groups63–65 due to the underlying social, structural, and environmental factors that have historically driven and continue to drive disparities across a broad range of health outcomes and measures. Addressing inequities in social and structural determinants of health to reduce and ultimately eliminate disparities and achieve health equity is critical.
Supplementary Material
Research in context.
Evidence before this study
Persistent differences in longevity among racial and ethnic groups in the United States have long been recognised. Black and American Indian/Alaska Native people have shorter life expectancy compared to their White counterparts, while Asian and Latino populations have longer life expectancy. Systemic racism has been identified as a root cause of shorter life expectancies among the Black and American Indian/Alaska Native populations compared to the White population in the USA.
Nationally, the difference in life expectancy between the Black and White populations declined over the first two decades of the 21st century, while the difference in life expectancy between the Latino and non-Latino White populations increased over the same period. In both cases, this trend resulted from larger gains among the Black and Latino populations compared to the White population. Trends in life expectancy for both the Black and White populations, and consequently trends in disparities between these two groups, varied substantially among states in the USA.
Added value of this study
We estimated life expectancy at birth by year, county, and racial/ethnic group (non-Latino White [White], non-Latino Black [Black], non-Latino American Indian/Alaska Native [AIAN], non-Latino Asian/Pacific Islander [API], and Latino) in the USA from 2000 to 2019. This is the first country-wide time-series analysis of life expectancy at the county level to include estimates for the AIAN and API populations, and the first at the county level to incorporate corrections for misreporting of racial/ethnic identity on death certificates. Consequently, we can examine trends in life expectancy and trends in disparities among racial/ethnic groups in unprecedented spatial detail and for a broader set of racial/ethnic groups than has previously been studied. These data are also made available to enable further investigation beyond the scope of this study.
Implications of all the available evidence
Between 2000 and 2019, life expectancy increased more for Black Americans than any other racial/ethnic group. Over this same period, the API and Latino populations experienced larger than average increases in life expectancy, while life expectancy increased more moderately among the White population and remained the same among the AIAN population. For all racial/ethnic groups, improvements in life expectancy were more widespread across counties and generally larger from 2000–2010 compared to 2010–2019. Varying trends in life expectancy among racial/ethnic groups over time have led to changes in the magnitude, but generally not in the direction, of gaps in life expectancy. Life expectancy was lower among the Black population than among the White population in all years and in most counties; however, the magnitude of this gap nationally declined over this period, reflecting narrowing gaps throughout the country in a large majority of counties, as well as a small number of counties where life expectancy among Black individuals now exceeds that among White individuals. Life expectancy was also lower for the AIAN population compared to the White population in all years and most counties, but the magnitude of this gap increased nationally from 2000 to 2019, reflecting increasing gaps in most counties. The API and Latino populations experienced longer life expectancy compared to the White population throughout the study period and in nearly all counties. For both groups, the magnitude of this advantage increased over time at the national level, but decreased for the Latino population in a sizeable minority of counties and decreased for the API population in a majority of counties.
These results highlight important differences among racial/ethnic groups, locations, and time periods in trends in life expectancy and life expectancy disparities in the USA, including both positive and negative trends. It is critical to combat systemic racism and to eliminate racial/ethnic health disparities. Detailed, local estimates of life expectancy by racial/ethnic group provide an opportunity to better understand the drivers of racial/ethnic disparities such as structural racism and social determinants of health. Estimates provided here can be used to tailor action to meet the needs of specific communities and to track progress towards a more equitable future.
Acknowledgements
This study was funded by the National Institute on Minority Health and Health Disparities; National Heart, Lung, and Blood Institute; National Cancer Institute; National Institute on Aging; National Institute of Arthritis and Musculoskeletal and Skin Diseases; Office of Disease Prevention; and Office of Behavioral and Social Science Research, National Institutes of Health (contract #75N94019C00016).
Footnotes
Publisher's Disclaimer: This is a PDF file of an unedited manuscript that has been accepted for publication. As a service to our customers we are providing this early version of the manuscript. The manuscript will undergo copyediting, typesetting, and review of the resulting proof before it is published in its final form. Please note that during the production process errors may be discovered which could affect the content, and all legal disclaimers that apply to the journal pertain.
Declaration of Interests
The authors of this manuscript have no competing interests to declare.
The contents and views in this manuscript are those of the authors and should not be construed to represent the views of the National Institutes of Health.
Contributor Information
GBD US Health Disparities Collaborators:
Laura Dwyer-Lindgren, Parkes Kendrick, Yekaterina O. Kelly, Dillon O. Sylte, Chris Schmidt, Brigette F. Blacker, Farah Daoud, Amal A. Abdi, Mathew Baumann, Farah Mouhanna, Ethan Kahn, Simon I. Hay, George A. Mensah, Anna M. Nápoles, Eliseo J. Pérez-Stable, Meredith Shiels, Neal Freedman, Elizabeth Arias, Stephanie A George, David M. Murray, John W.R. Phillips, Michael L. Spittel, Christopher J.L. Murray, and Ali H. Mokdad
Data Sharing
Estimates of life expectancy by county, racial/ethnic group, year, age, and sex are available for download from the Global Health Data Exchange (link available upon publication) and via a user-friendly data visualization (link available upon publication). Information about the underlying data sources is available in sections 3.2 and 3.3 in the appendix. Code used for this analysis is available on GitHub (link available upon publication).
References
- 1.Preamble to the constitution of WHO as adopted by the International Health Conference, New York, 19 June - 22 July 1946; signed on 22 July 1946 by the representatives of 61 States (Official Records of WHO, no. 2, p. 100) and entered into force on 7 April 1948 https://www.who.int/about/who-we-are/constitution (accessed Dec 22, 2020).
- 2.National Academies of Sciences, Engineering, and Medicine. The state of health disparities in the United States. In: Communities in Action: Pathways to Health Equity. Washington, DC: National Academies Press, 2017. https://www.ncbi.nlm.nih.gov/books/NBK425844/ (accessed April 16, 2021). [PubMed] [Google Scholar]
- 3.Bailey ZD, Krieger N, Agénor M, Graves J, Linos N, Bassett MT. Structural racism and health inequities in the USA: evidence and interventions. The Lancet 2017; 389: 1453–63. [DOI] [PubMed] [Google Scholar]
- 4.Williams DR, Lawrence JA, Davis BA. Racism and health: evidence and needed research. Annu Rev Public Health 2019; 40: 105–25. [DOI] [PMC free article] [PubMed] [Google Scholar]
- 5.Harper S, Lynch J, Burris S, Davey Smith G. Trends in the black-white life expectancy gap in the United States, 1983–2003. JAMA 2007; 297: 1224–32. [DOI] [PubMed] [Google Scholar]
- 6.Arias E, Johnson NJ, Vera BT. Racial disparities in mortality in the adult Hispanic population. SSM - Popul Health 2020; 11: 100583. [DOI] [PMC free article] [PubMed] [Google Scholar]
- 7.Dwyer-Lindgren L, Bertozzi-Villa A, Stubbs RW, et al. Inequalities in life expectancy among US counties, 1980 to 2014: temporal trends and key drivers. JAMA Intern Med 2017; 177: 1003–11. [DOI] [PMC free article] [PubMed] [Google Scholar]
- 8.Murray CJL, Kulkarni SC, Michaud C, et al. Eight Americas: investigating mortality disparities across races, counties, and race-counties in the United States. PLOS Med 2006; 3: 1513–24. [DOI] [PMC free article] [PubMed] [Google Scholar]
- 9.Harper S, Rushani D, Kaufman JS. Trends in the black-white life expectancy gap, 2003–2008. JAMA 2012; 307: 2257–9. [DOI] [PubMed] [Google Scholar]
- 10.Arias E, Xu J, Jim MA. Period life tables for the non-Hispanic American Indian and Alaska Native population, 2007–2009. Am J Public Health 2014; 104: S312–9. [DOI] [PMC free article] [PubMed] [Google Scholar]
- 11.Kochanek KD, Murphy SL, Xu J, Arias E. Deaths: final data for 2017. Natl Vital Stat Rep 2019; 68. https://www.cdc.gov/nchs/data/nvsr/nvsr68/nvsr68_09-508.pdf (accessed Dec 23, 2019). [PubMed] [Google Scholar]
- 12.Arias E, Xu J, Curtin S, Bastian B, Tejada-Vera B. Mortality profile of the non-Hispanic American Indian or Alaska Native population, 2019. Natl Vital Stat Rep 2021; 70. DOI: 10.15620/cdc:110370. [DOI] [PubMed] [Google Scholar]
- 13.Clarke CA, Miller T, Chang ET, Yin D, Cockburn M, Gomez SL. Racial and social class gradients in life expectancy in contemporary California. Soc Sci Med 2010; 70: 1373–80. [DOI] [PMC free article] [PubMed] [Google Scholar]
- 14.Roberts M, Reither EN, Lim S. Contributors to the black-white life expectancy gap in Washington D.C. Sci Rep 2020; 10: 13416. [DOI] [PMC free article] [PubMed] [Google Scholar]
- 15.Mokdad AH, Ballestros K, Echko M, et al. The state of US health, 1990–2016: burden of diseases, injuries, and risk factors among US states. JAMA 2018; 319: 1444–72. [DOI] [PMC free article] [PubMed] [Google Scholar]
- 16.University of California, Berkeley. United States mortality database. https://usa.mortality.org/ (accessed Dec 26, 2019).
- 17.Chetty R, Stepner M, Abraham S, et al. The association between income and life expectancy in the United States, 2001–2014. JAMA 2016; 315: 1750–66. [DOI] [PMC free article] [PubMed] [Google Scholar]
- 18.Dwyer-Lindgren L, Stubbs RW, Bertozzi-Villa A, et al. Variation in life expectancy and mortality by cause among neighbourhoods in King County, WA, USA, 1990–2014: a census tract-level analysis for the Global Burden of Disease Study 2015. Lancet Public Health 2017; 2: e400–10. [DOI] [PubMed] [Google Scholar]
- 19.Arias E, Escobedo L, Kennedy J, Fu C, Cisewski J. U.S. small-area life expectancy estimates project: methodology and results summary Hyattsville, Maryland: National Center for Health Statistics, 2018. [PubMed] [Google Scholar]
- 20.Arias E, Heron M, Hakes J. The validity of race and Hispanic-origin reporting on death certificates in the United States: an update. Vital Health Stat 2016; 2. https://www.cdc.gov/nchs/data/series/sr_02/sr02_172.pdf. [PubMed] [Google Scholar]
- 21.Murray C, Michaud C, McKenna M, Marks J. U.S. patterns of mortality by county and race: 1965–1994 Cambridge, MA; Atlanta, Ga.: Harvard Center for Population and Development Studies; National Center for Chronic Disease Prevention and Health Promotion, 1998. [Google Scholar]
- 22.Kulkarni SC, Levin-Rector A, Ezzati M, Murray CJ. Falling behind: life expectancy in US counties from 2000 to 2007 in an international context. Popul Health Metr 2011; 9: 16. [DOI] [PMC free article] [PubMed] [Google Scholar]
- 23.Cullen MR, Cummins C, Fuchs VR. Geographic and racial variation in premature mortality in the U.S.: analyzing the disparities. PLOS ONE 2012; 7: e32930. [DOI] [PMC free article] [PubMed] [Google Scholar]
- 24.Harper S, MacLehose RF, Kaufman JS. Trends in the black-white life expectancy gap among US states, 1990–2009. Health Aff (Millwood) 2014; 33: 1375–82. [DOI] [PubMed] [Google Scholar]
- 25.University of Wisconsin Population Health Institute. County health rankings & roadmaps: life expectancy. Cty. Health Rank. Roadmaps 2020. https://www.countyhealthrankings.org/explore-health-rankings/measures-data-sources/county-health-rankings-model/health-outcomes/length-of-life/life-expectancy (accessed Dec 13, 2020).
- 26.Stevens GA, Alkema L, Black RE, et al. Guidelines for accurate and transparent health estimates reporting: the GATHER statement. The Lancet 2016; 388: e19–23. [DOI] [PubMed] [Google Scholar]
- 27.Dwyer-Lindgren L, Bertozzi-Villa A, Stubbs RW, et al. US county-level trends in mortality rates for major causes of death, 1980–2014. JAMA 2016; 316: 2385–401. [DOI] [PMC free article] [PubMed] [Google Scholar]
- 28.Office of Management and Budget. Race and ethnic standards for federal statistics and administrative reporting. Statistical Policy Directive 15. Washington, DC, 1977. https://wonder.cdc.gov/wonder/help/populations/bridged-race/directive15.html (accessed Dec 13, 2020). [PubMed] [Google Scholar]
- 29.Office of Management and Budget. Revisions to the standards for the classification of federal data on race and ethnicity. Fed Regist 1997; 62: 58782–90. [Google Scholar]
- 30.Park CB, Braun KL, Horiuchi BY, Tottori C, Onaka AT. Longevity disparities in multiethnic Hawaii: an analysis of 2000 life tables. Public Health Rep 2009; 124: 579–84. [DOI] [PMC free article] [PubMed] [Google Scholar]
- 31.Braun KL, Kim BJ, Ka’opua LS, Mokuau N, Browne CV. Native Hawaiian and Pacific Islander elders: what gerontologists should know. The Gerontologist 2015; 55: 912–9. [DOI] [PMC free article] [PubMed] [Google Scholar]
- 32.Quint JJ. Disaggregating data to measure racial disparities in COVID-19 outcomes and guide community response — Hawaii, March 1, 2020–February 28, 2021. Morb Mortal Wkly Rep 2021; 70: 1268–73. [DOI] [PMC free article] [PubMed] [Google Scholar]
- 33.Kristensen K, Nielsen A, Berg CW, Skaug H, Bell B. TMB: automatic differentiation and Laplace approximation. J Stat Softw 2016; 70: 1–21. [Google Scholar]
- 34.R Core Team. R: A language and environment for statistical computing. Vienna, Austria: R Foundation for Statistical Computing, 2019. https://www.R-project.org/. [Google Scholar]
- 35.Srebotnjak T, Mokdad AH, Murray CJ. A novel framework for validating and applying standardized small area measurement strategies. Popul Health Metr 2010; 8: 26. [DOI] [PMC free article] [PubMed] [Google Scholar]
- 36.GBD 2020 Demographics Collaborators. Global age-sex-specific fertility, mortality, and population estimates in 204 countries and territories, 1950–2020: a comprehensive demographic analysis for the Global Burden of Disease Study 2020. Prep. [DOI] [PMC free article] [PubMed] [Google Scholar]
- 37.Preston SH, Heuveline P, Guillot M. Demography: measuring and modeling population processes. Malden, MA: Blackwell Publishers, 2001. [Google Scholar]
- 38.Horiuchi S, Coale AJ. A simple equation for estimating the expectation of life at old ages. Popul Stud 1982; 36: 317–26. [DOI] [PubMed] [Google Scholar]
- 39.Harper S The widening life expectancy gap between American Indian and Alaska Natives and White Americans. 2017. https://paa.confex.com/paa/2017/meetingapp.cgi/Home/0 (accessed Dec 13, 2020).
- 40.Ruiz JM, Steffen P, Smith TB. Hispanic mortality paradox: a systematic review and meta-analysis of the longitudinal literature. Am J Public Health 2013; 103: e52–60. [DOI] [PMC free article] [PubMed] [Google Scholar]
- 41.Arias E, Kochanek KD, Anderson RA. How does cause of death contribute to the Hispanic mortality advantage in the United States? Hyattsville, MD: National Center for Health Statistics, 2015. [PubMed] [Google Scholar]
- 42.Riosmena F, Wong R, Palloni A. Migration selection, protection, and acculturation in health: a binational perspective on older adults. Demography 2013; 50: 1039–64. [DOI] [PMC free article] [PubMed] [Google Scholar]
- 43.Riosmena F, Kuhn R, Jochem WC. Explaining the immigrant health advantage: self-selection and protection in health-related factors among five major national-origin immigrant groups in the United States. Demography 2017; 54: 175–200. [DOI] [PMC free article] [PubMed] [Google Scholar]
- 44.Fenelon A, Blue L. Widening life expectancy advantage of Hispanics in the United States: 1990–2010. J Immigr Minor Health 2015; 17: 1130–7. [DOI] [PMC free article] [PubMed] [Google Scholar]
- 45.Turra CM, Elo IT. The impact of salmon bias on the Hispanic mortality advantage: new evidence from social security data. Popul Res Policy Rev 2008; 27: 515. [DOI] [PMC free article] [PubMed] [Google Scholar]
- 46.Acciai F, Noah AJ, Firebaugh G. Pinpointing the sources of the Asian mortality advantage in the USA. J Epidemiol Community Health 2015; 69: 1006–11. [DOI] [PMC free article] [PubMed] [Google Scholar]
- 47.Williams DR, Lawrence JA, Davis BA, Vu C. Understanding how discrimination can affect health. Health Serv Res 2019; 54: 1374–88. [DOI] [PMC free article] [PubMed] [Google Scholar]
- 48.Phelan JC, Link BG. Is racism a fundamental cause of inequalities in health? Annu Rev Sociol 2015; 41: 311–30. [Google Scholar]
- 49.Williams DR, Collins C. Racial residential segregation: a fundamental cause of racial disparities in health. Public Health Rep 2001; 116: 404–16. [DOI] [PMC free article] [PubMed] [Google Scholar]
- 50.Wildeman C, Wang EA. Mass incarceration, public health, and widening inequality in the USA. The Lancet 2017; 389: 1464–74. [DOI] [PubMed] [Google Scholar]
- 51.Geronimus AT, Bound J, Ro A. Residential mobility across local areas in the United States and the geographic distribution of the healthy population. Demography 2014; 51: 777–809. [DOI] [PMC free article] [PubMed] [Google Scholar]
- 52.Berger M, Sarnyai Z. ‘More than skin deep’: stress neurobiology and mental health consequences of racial discrimination. Stress 2015; 18: 1–10. [DOI] [PubMed] [Google Scholar]
- 53.Howell EA. Reducing disparities in severe maternal morbidity and mortality. Clin Obstet Gynecol 2018; 61: 387–99. [DOI] [PMC free article] [PubMed] [Google Scholar]
- 54.O’Brien R, Neman T, Seltzer N, Evans L, Venkataramani A. Structural racism, economic opportunity and racial health disparities: evidence from U.S. counties. SSM - Popul Health 2020; 11: 100564. [DOI] [PMC free article] [PubMed] [Google Scholar]
- 55.Alson JG, Robinson WR, Pittman L, Doll KM. Incorporating measures of structural racism into population studies of reproductive health in the United States: a narrative review. Health Equity 2021; 5: 49–58. [DOI] [PMC free article] [PubMed] [Google Scholar]
- 56.Arora A, Spatz E, Herrin J, et al. Population well-being measures help explain geographic disparities in life expectancy at the county level. Health Aff (Millwood) 2016; 35: 2075–82. [DOI] [PMC free article] [PubMed] [Google Scholar]
- 57.Grembowski D, Bekemeier B, Conrad D, Kreuter W. Are local health department expenditures related to racial disparities in mortality? Soc Sci Med 2010; 71: 2057–65. [DOI] [PubMed] [Google Scholar]
- 58.McCullough JM, Leider JP. Government spending in health and nonhealth sectors associated with improvement in county health rankings. Health Aff (Millwood) 2016; 35: 2037–43. [DOI] [PubMed] [Google Scholar]
- 59.Frederick C, Hammersmith A, Gilderbloom JH. Putting ‘place’ in its place: comparing place-based factors in interurban analyses of life expectancy in the United States. Soc Sci Med 2019; 232: 148–55. [DOI] [PubMed] [Google Scholar]
- 60.Dowd JB, Hamoudi A. Is life expectancy really falling for groups of low socio-economic status? Lagged selection bias and artefactual trends in mortality. Int J Epidemiol 2014; 43: 983–8. [DOI] [PubMed] [Google Scholar]
- 61.Liebler CA, Bhaskar R, Porter SR. Joining, leaving, and staying in the American Indian/Alaska Native race category between 2000 and 2010. Demography 2016; 53: 507–40. [DOI] [PMC free article] [PubMed] [Google Scholar]
- 62.Liebler CA, Porter SR, Fernandez LE, Noon JM, Ennis SR. America’s churning races: race and ethnicity response changes between census 2000 and the 2010 census. Demography 2017; 54: 259–84. [DOI] [PMC free article] [PubMed] [Google Scholar]
- 63.Arias E, Betzaida T-V, Ahmad F, Kochanek K. Provisional life expectancy estimates for 2020. Hyattsville, MD: National Center for Health Statistics, 2021. DOI: 10.15620/cdc:107201. [DOI] [Google Scholar]
- 64.Ahmad FB, Cisewski JA, Miniño A, Anderson RN. Provisional mortality data — United States, 2020. Morb Mortal Wkly Rep 2021; 70: 519–22. [DOI] [PMC free article] [PubMed] [Google Scholar]
- 65.Rossen LM. Disparities in excess mortality associated with COVID-19 — United States, 2020. Morb Mortal Wkly Rep 2021; 70: 1114–9. [DOI] [PMC free article] [PubMed] [Google Scholar]
- 66.Urban Indian Health Institute. Best practices for American Indian and Alaska Native data collection. 2020. https://www.uihi.org/resources/best-practices-for-american-indian-and-alaska-native-data-collection/ (accessed Jan 20, 2021).
- 67.Association of Public Health Laboratories, Association of State and Territorial Health Officials, Council of State and Territorial Epidemiologists, Healthcare Information and Management Systems Society, National Association for Public Health Statistics and Information Systems. Data: elemental to health. https://cdn.ymaws.com/www.cste.org/resource/resmgr/pdfs/pdfs2/DE2H-OnePager.pdf (accessed April 15, 2021).
- 68.Jones N, Marks R, Ramirez R, Ríos-Vargas M. Improved race and ethnicity measures reveal U.S. population is much more multiracial. U. S. Census Bur 2021. https://www.census.gov/library/stories/2021/08/improved-race-ethnicity-measures-reveal-united-states-population-much-more-multiracial.html (accessed Sept 28, 2021). [Google Scholar]
Associated Data
This section collects any data citations, data availability statements, or supplementary materials included in this article.
Supplementary Materials
Data Availability Statement
Estimates of life expectancy by county, racial/ethnic group, year, age, and sex are available for download from the Global Health Data Exchange (link available upon publication) and via a user-friendly data visualization (link available upon publication). Information about the underlying data sources is available in sections 3.2 and 3.3 in the appendix. Code used for this analysis is available on GitHub (link available upon publication).