Abstract
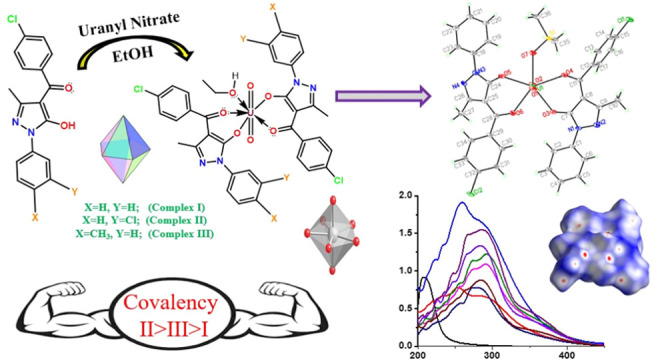
Three uranyl acylpyrazolone complexes [UO2(PCBPMP)2(CH3CH2OH)] (complex I), [UO2(PCBMCPMP)2(CH3CH2OH)] (complex II), and [UO2(PCBPTMP)2(CH3CH2OH)] (complex III) were synthesized from σ-donating acypyrazolone ligands to analyze their sequence of covalent characteristics, reactivity, and redox properties (PCBPMP: p-chlorobenzoyl 1-phenyl 3-methyl 5-pyrazolone; PCBMCPMP: p-chlorobenzoyl 1-(m-chlorophenyl) 3-methyl 5-pyrazolone; PCBPTMP: p-chlorobenzoyl 1-(p-tolyl) 3-methyl 5-pyrazolone). An examination of the structure, pentagonal bipyramidal geometry, and composition of these complexes was conducted mainly through their single-crystal X-ray diffraction (XRD) data, 1H nuclear magnetic resonance (NMR) δ-values, plots of thermogravimetric-differential thermal analysis (TG-DTA), significant Fourier transform infrared (FTIR) vibrations, gravimetric estimation, and molar conductivity values. The covalency order was found to be complex II > III > I, which mainly depends on values of stretching frequencies, average bond lengths of axial uranyl bonds, values of average bond lengths on the pentagonal equatorial plane, solvent coordination on the fifth site of a pentagonal plane, and the type of aryl group on the nitrogen of the pyrazolone ring. This was confirmed by FTIR spectroscopy and single-crystal spectral characterization. To verify experimental results by comparison with theoretical results, density functional theory (DFT) calculations were carried out, which further gives evidence for the covalency order through theoretical frequencies and the gap of highest occupied molecular orbital (HOMO)–lowest unoccupied molecular orbital (LUMO) energies. Theoretical bond properties were also examined by the identification of global index parameters. Intermolecular noncovalent surface interactions were studied by the Hirshfeld surface analysis. The irreversible redox behavior of uranyl species was identified through electrochemical cyclic voltammetry-differential pulse voltammetry (CV-DPV) plot analysis.
1. Introduction
The application of actinides in the fields of nuclear weapons, defense operations, and energy production has been increasing in the last few decades.1−3 As a part of their application in the nuclear fuel cycle and weapon synthesis, uranium and plutonium speciation is necessary to understand their migration methods.4 Uranium and Thorium are the most important of the many elements of the actinide series as enduring elements to understand their properties by building complexes. In the field of coordination chemistry, solvent extraction is a crucial method among the current techniques for the separation of actinide series.5,6 Because of the various ionic and covalent characteristics, the ion-exchange approach is also a feasible and powerful method for their separation.7
Despite many exceptional separation methods being available, it is very difficult and dangerous to explore all details of actinides in addition to being expensive. In such a situation, studying a less-expensive element as a representative of a few elements is significant. Although the chemistry of uranium is different from that of other actinides, the 238U isotope of uranium is easily available at reasonable prices and superior to other minor actinides such as americium and curium at present. Redox variability is a vital concept in separation and corrosion science because uranium can exist in different oxidation states.8 Moreover, due to a simple synthesis method and the instantaneous crystal-forming capacity of uranium complexes, they are preferably studied among the actinides series by most of the viable approaches mentioned. In terms of efficacy, there are numerous advantages of uranium such as its lower chemotoxicity and radiotoxicity,9 redox flow in drift batteries,10 NMR transfer indicators,11 better catalytic activity,12−15 etc. For uranium complexes to exhibit such a wide range of features, their capacity to bind and the variety of oxidation states in which they can exist are primarily responsible. Numerous uranium complexes with oxidation levels ranging from +3 to +6 have been studied; of these, complexes with the +6 oxidation state, particularly those containing the hexavalent uranyl (UO22+) ion, often have the highest stability.16 The hard acid UO22+ typically forms stable complexes with ligands that include hard base donor atoms, according to the HSAB theory.16 Only anaerobic bacterial reduction or synthetic uranyl ion reduction may produce U(V)O2+ and U(IV), which are used in redox research studies.17,18
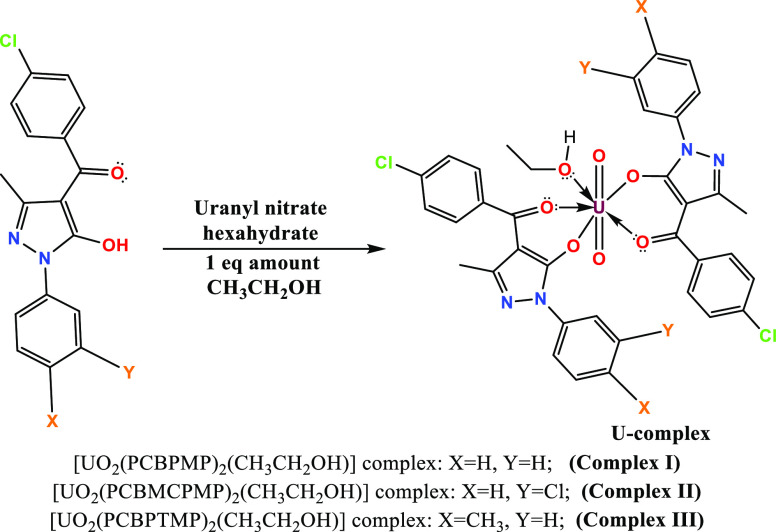
In the past few decades, uranyl acylpyrazolone complexes have emerged as a result of research on numerous stable complexes with UO22+, offering extensive choices for growth.19−21 The idea of using covalency between metal–ligand closures as a foundation for each of the aforementioned qualities in this area of study is original as well as fundamental, priceless, and instructive of complexes of uranium-acylpyrazolones. This study details the synthesis of three uranyl complexes with acyl pyrazolone ligands taking into account the aforementioned aims. The following are the main goals of this study: (i) the synthesis of three UO22+ complexes derived from PCBPMP, PCBMCPMP, and PCBPTMP ligands; (ii) use of the most comprehensive characterization techniques to offer all bonding-related information; (iii) understand the nature and binding capacity of acylpyrazolones; and (iv) understanding and comparing the covalency sequence using single-crystal, infrared, and DFT spectral data (Figure 1).
Figure 1.
Synthetic route of uranyl complexes.
2. Experimental Section
2.1. Materials and Methods
Ligands were synthesized and examined using the tools specified in previous studies published by our laboratory.22,23 Uranyl nitrate was obtained from SULAB chemicals, Gujarat. Gravimetric techniques were used to determine the uranium concentration in U3O8.2424 For the purpose of recrystallization, AR-grade solvents were purchased from CDH – Central Drug House (P) Ltd.
2.2. Synthesis of Uranium Complexes
Three ligands, PCBPMP, PCBMCPMP, and PCBPTMP, were prepared following the method reported in a previous study.23 The preparation of the three uranium complexes I, II, and III was carried out following a process similar to that described in our most recent paper.25
2.2.1. Synthesis of the [UO2(PCBPMP)2(CH3CH2OH)] Complex
Complex I was prepared using the PCBPMP ligand (2 mmol, 0.625 g) and uranyl nitrate hexahydrate (1 mmol, 0.500 g). Then, it was recrystallized in DMSO by the slow evaporation technique at room temperature (∼32 °C), in which a DMSO molecule replaced ethanol. Yield (%): 82.68% (complex obtained: 0.772 g); M.P.: ∼190 °C; molecular formula: C36H30Cl2N4O7U; formula wt: 938.2 g mol–1; % metal (achieve): U, 24.56 (25.33)%. FTIR (KBr, cm–1): 1577 (C=O, pyrazolone), 1400 (C=O, p-chlorobenzoyl), 1557 (ring C=N), 920 (U=O, asym.), 833 (U=O, sym.). 1H NMR δ-ppm (400 MHz, DMSO-d6): 4.310 (m, 2H, OCH2(CH3CH2OH)), 7.0–8.5 (m, Ar-HPCBPMP), 2.085 (s, 3H, Pyz-CH3), 1.982 (s, 3H, Pyz-CH3), 1.055 (t, 3H, CH3(CH3CH2OH)).
2.2.2. Synthesis of the [UO2(PCBMCPMP)2(CH3CH2OH)] Complex
Using the PCBMCPMP ligand (2 mmol, 0.695 g) in the abovementioned complex I preparation, [UO2(PCBMCPMP)2(CH3CH2OH)] (complex II) was synthesized similarly, but by recrystallizing in DMF, a pale-yellow-colored, prism-shaped single crystal was produced. Yield (%): 86% (complex obtained: 0.864 g); M.P.: ∼162 °C; molecular formula: C36H28Cl4N4O7U; formula wt: 1008.47 g mol–1; % metal (achieve): U, 23.56 (23.60)%. FTIR (KBr, cm–1): 1591 (C=O, pyrazolone), 1471 (C=O, p-chlorobenzoyl), 1557 (ring C=N), 923 (U=O, asym.), 778 (U=O, sym.). 1H NMR δ-ppm (400 MHz, DMSO-d6): 4.410 (m, 2H, OCH2(CH3CH2OH)), 7.0–8.5 (m, Ar-HPCBMCPMP), 1.993 (s, 3H, Pyz-CH3), 1.958 (s, 3H, Pyz-CH3), 1.054 (t, 3H, CH3(CH3CH2OH)).
2.2.3. Synthesis of the [UO2(PCBPTMP)2(CH3CH2OH)] Complex
Using the PCBPTMP ligand, [UO2(PCBPTMP)2(CH3CH2OH)] (complex III) was synthesized in a manner similar to that described before. By recrystallizing the compound in DMSO, a pale-yellow, prism-shaped single crystal was produced. Yield (%): 84% (complex obtained: 0.809 g); M.P.: ∼165 °C; molecular formula: C38H34Cl2N4O7U; formula wt: 967.64 g mol–1; % metal (achieve): U, 24.12 (24.60)%. FTIR (KBr, cm–1): 1591 (C=O, pyrazolone), 1436 (C=O, p-chlorobenzoyl), 1558 (ring C=N), 912 (U=O, asym.), 823 (U=O, sym.). 1H NMR δ-ppm (400 MHz, DMSO-d6): 4.418 (m, 2H, OCH2(CH3CH2OH)), 7.5–8.5 (m, Ar-HPCBMCPMP), 2.503 (s, 3H, p-tolyl CH3) 2.083 (s, 3H, Pyz-CH3), 1.051 (t, 3H, CH3(CH3CH2OH)).
2.3. X-ray Crystallographic Examination
All three uranyl complexes were subjected to X-ray crystallographic analysis utilizing graphite monochromatized Mo–K (=0.71073) radiation. According to the information in our previously published studies, the detection and refining have been completed.26 SHELXT software was used to process the diffraction data.27 The crystallographic software SHELXL-2018/3 was used to carry out the computation.28
2.4. Physical Measurements
Similar techniques, models, equipment, or tools were utilized to analyze the data of the produced compounds using FTIR, 1H NMR, CV-DPV, and TG-DTA as described in previous articles published by our laboratory.23,26 CV-DPV was executed with 0.1 M tetra-butylammonium perchlorate (TBAP). Nitric acid breakdown of the complexes was used to volumetrically and gravimetrically measure uranium as U3O8.
2.5. Computational Measurements
On all three complexes, geometrical optimizations and DFT computations were carried out using the B3LYP29−32 approach and Gaussian 16 program.30,32 Processing of the input files was performed using Gaussview 6.0.33,34 All of the components in the three complexes were chosen using the SDD basis set. Using the aforementioned method, calculations were carried out to analyze the molecular structure, Mulliken charge, vibrational analysis, etc.
3. Results and Discussion
Uranyl acylpyrazolone complexes are extremely stable at room temperature, and uranyl binds to ligands covalently. The following section also illustrates the covalency sequence in addition to crystal formations.
3.1. FTIR Studies
Proof of the binding of one CH3CH2OH is provided by the FTIR band of υO–H, which is seen near 3400 cm–1. This is because all three complexes were prepared using 100% ethanol as a solvent. The major observations can be identified by comparing the FTIR spectra of the ligands with those of their corresponding complexes.23 As seen in Table 1, the υC=O of pyrazolone and the p-chloro benzoyl group decrease significantly during complexation. The υC=O of pyrazolone decreases from 1620 cm–1 in PCBPMP to 1577 cm–1 in [UO2(PCBPMP)2(CH3CH2OH)], 1625 cm–1 in PCBMCPMP to 1591 cm–1 in [UO2(PCBMCPMP)2(CH3CH2OH)], and 1625 cm–1 in PCBPTMP to 1591 cm–1 in [UO2(PCBPTMP)2(CH3CH2OH)]. A similar kind of decrease was observed in the p-chloro benzoyl carbonyl frequency (see Table 1). This is due to the fact that during complexation, the charge on the O-atom shifts toward metal ions, weakening the C=O bond. For the aforementioned three complexes, asymmetric stretching frequencies of uranyl were found at 920, 863, and 912 cm–1, respectively, while matching symmetric stretching bands were observed at 833, 778, and 823 cm–1. In the present three complexes, both asymmetric and symmetric vibrations show a frequency order of complex I > complex III > complex II, suggesting that the bond strength for uranyl follows a similar order. The relative effect of the U–O bond strength of the pentagonal plane in reverse order created due to these uranyl bonds is responsible for the covalency order of II > III > I for complexes. Thus, asymmetric and symmetric uranyl stretching frequencies are an important concept in identifying the covalency order in uranyl complexes.35,36Figures S1–S3 show the FTIR spectra.
Table 1. FTIR Values of Uranyl Complexes (in cm–1).
| code | v(C=O)a | v(C=O)b | cyclic v(C=N) | v(C=C) | C–H in plane deformation | vas (U=O) | vs (U=O) |
|---|---|---|---|---|---|---|---|
| PCBPMP | 1620 | 1587 | 1556 | 1357 | 1032 | ||
| [UO2(PCBPMP)2(CH3CH2OH)] | 1577 | 1400 | 1557 | 1380 | 1013 | 920 | 833 |
| PCBMCPMP | 1625 | 1590 | 1516 | 1347 | 1083 | ||
| [UO2(PCBMCPMP)2(CH3CH2OH)] | 1591 | 1471 | 1557 | 1373 | 1089 | 863 | 778 |
| PCBPTMP | 1625 | 1598 | 1551 | 1352 | 1089 | ||
| [UO2(PCBPTMP)2(CH3CH2OH)] | 1591 | 1436 | 1558 | 1379 | 1089 | 912 | 823 |
Pyrazolone.
p-chlorobenzoyl.
3.2. 1H NMR Spectroscopic Study
1H NMR spectra of all representative uranyl complexes were recorded in DMSO-d6, and the spectra of their phenyl and methyl protons exhibit sharp lines because uranyl ions have a slower relaxation time than other ions.37 In all complexes, one multiplet for the OCH2 group and a triplet for CH3 were observed in the ranges of δ 4.0–4.5 ppm and δ 1.05–1.06 ppm, respectively. The existence of the CH3CH2OH group is confirmed by the sum of all peaks. The [UO2(PCBPTMP)2(CH3CH2OH)] complex shows an additional singlet peak of the CH3 of p-tolyl at δ 2.503 ppm. In all of the complexes, there are several multiplets that correlate to aromatic protons in the 6.8–8.6 ppm range. In the 1H NMR spectra, the pyrazolone CH3 is seen as two independent lines in their complexes and exhibits sharp singlets in free ligands, indicating the arrangement of two ligands in an antisymmetrical and dissimilar milieu, as previously explained.20,37 The corresponding information in Figures S4–S6 includes PMR spectra for each complex.
3.3. Thermogravimetric Analysis
Thermogravimetric analysis data can be used to investigate the three-step breakdown. The ethanol moiety is removed from the fifth coordination in complex I as a part of the first step, which is followed by solvent loss up to 150 °C. The DTG curve showed a considerable shift of 68.8 g/min at 129.6 °C. The second step entails removing the PCBPMP ligand at temperatures between 300 and 700 °C. A steep peak in the DTA curve marks the beginning of the second step, and a large change of 218.8 g/min was recorded at 407.8 °C (see the DTG curve). The final phase encompasses the transformation of the metal component into uranium oxide (U3O8). Thermogravimetric curves for all three complexes are given in Figures S7–S9. TGA curves of complexes II and III show a similar pattern; their maximum change of decomposition during the second step in the DTG curve varies in the 400–500 °C temperature range.
3.4. Molar Conductivity of Complexes
For complexes I, II, and III, the molar conductivity ΛM values were found to be 8, 11, and 7 cm2 mol–1 Ω–1, respectively. Such modest values offer additional proof of nonelectrolytic activity and the lack of charged ions on the coordination sphere’s counterpart.38
3.5. Single-Crystal X-ray Diffraction
The outcomes and data from X-ray experiments are given. The 8-coordination environment of uranyl nitrate underwent a unit-cell and geometrical change to a 7-coordination environment for all three complexes. Every complex eventually develops a monoclinic system with different space groups. The labeled thermal ellipsoid plot for all three complexes is presented in Figure 2a–c, respectively. Table 2 provides all structural data with refinement settings for comparison.
Figure 2.
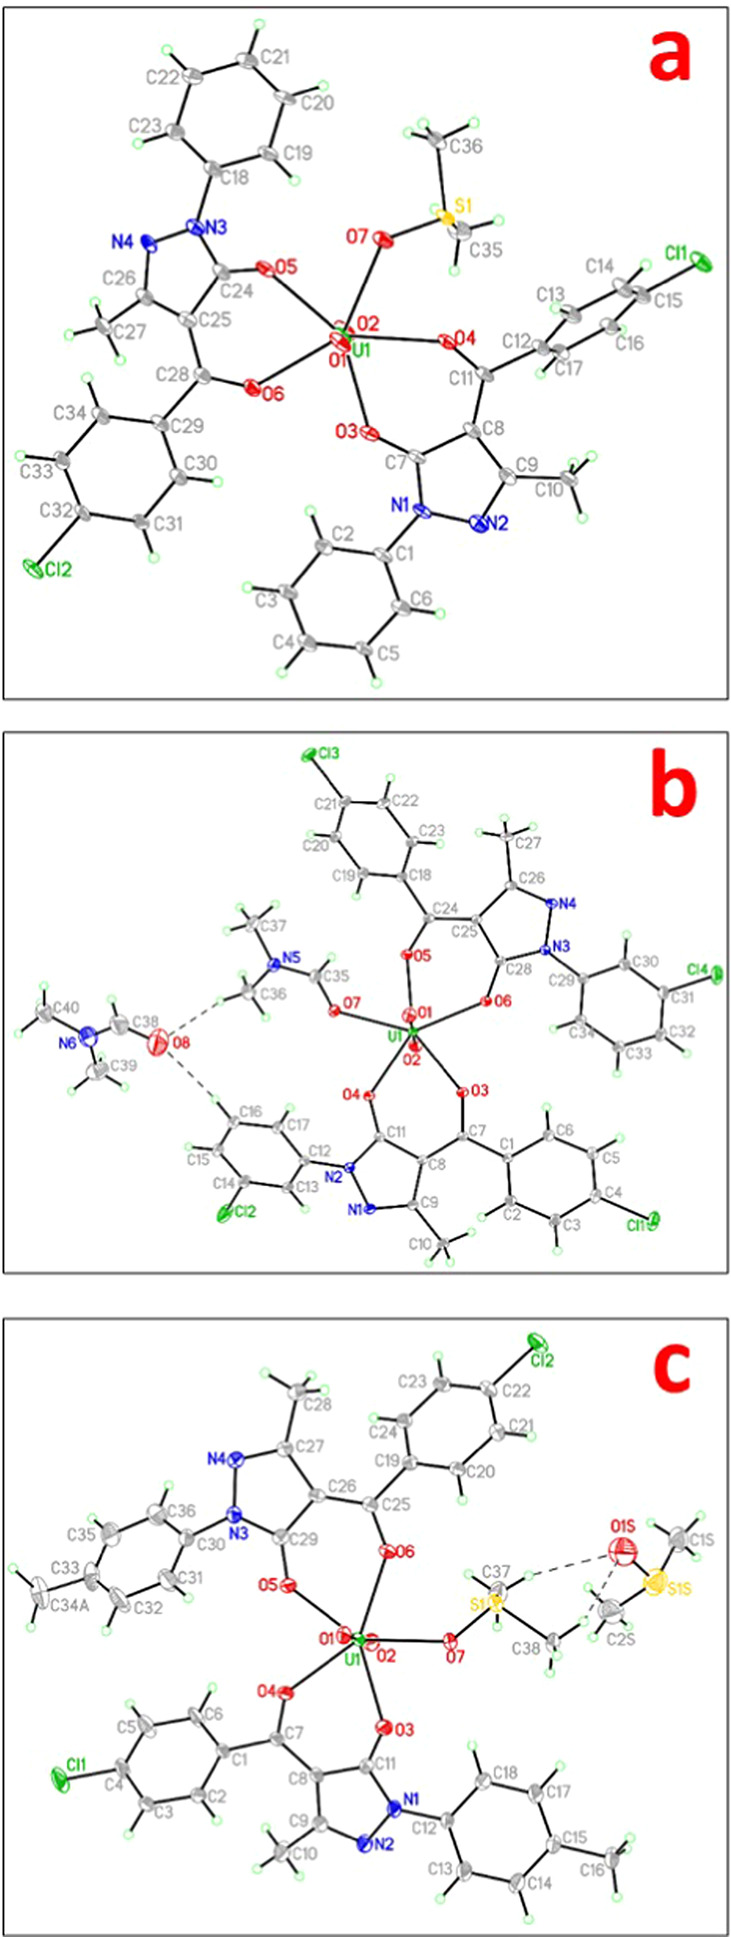
Thermal ellipsoid plot of complexes (a) I, (b) II, and (c) III with 40% probability.
Table 2. Structural Data of the Three Complexes with Refinement Parameters.
| code | complex I | complex II | complex III |
|---|---|---|---|
| empirical formula | C36H30Cl2N4O7SU | C40H36Cl4N6O8U | C40H40Cl2N4O8S2U |
| formula weight | 971.63 | 1108.58 | 1077.81 |
| temperature (K) | 100(2) | 105(2) | 105(2) |
| wavelength (Å) | 0.71073 | 0.71073 | 0.71073 |
| crystal system | monoclinic | monoclinic | monoclinic |
| space group | P21/n | C2/c | C2/c |
| unit-cell dimensions | a = 8.248(2) Å, b = 15.054(4) Å, c = 28.262(8) Å, α = 90°, β = 95.583(10)°, γ = 90° | a = 34.985(2) Å, b = 8.2450(4) Å, c = 32.1155(18) Å, α = 90°, β = 117.950(2)°, γ = 90° | a = 31.1775(9) Å, b = 17.7230(6) Å, c = 17.1850(5) Å, α = 90°, β = 119.040(2)°, γ = 90° |
| volume (Å3) | 3492.5(16) | 8183.2(8) | 8301.9(5) |
| Z | 4 | 8 | 8 |
| density (calculated) (mg/m3) | 1.848 | 1.800 | 1.725 |
| absorption coefficient (mm–1) | 4.916 | 4.289 | 4.196 |
| F(000) | 1888 | 4336 | 4240 |
| θ range for data collection (deg) | 2.516–25.297 | 2.337–36.401 | 2.168–28.282 |
| index ranges | ? ≤ h ≤ ?, ? ≤ k ≤ ?, ? ≤ l ≤ ? | –58 ≤ h ≤ 58, –13 ≤ k ≤ 13, –53 ≤ l ≤ 53 | –41 ≤ h ≤ 41, –23 ≤ k ≤ 20, –22 ≤ l ≤ 22 |
| reflection collected | 6325 | 383 858 | 54 559 |
| independent reflections | 6325 | 19 866 [Rint = 0.0677] | 10 307 [Rint = 0.1125] |
| completeness to θ = 25.242° (%) | 100.0 | 99.7 | 100.0 |
| refinement method | full-matrix least-squares on F2 | full-matrix least-squares on F2 | full-matrix least-squares on F2 |
| data/restraints/parameters | 6325/450/465 | 19 866/691/586 | 10 307/158/573 |
| goodness-of-fit on F2 | 1.147 | 1.126 | 1.046 |
| final R indices [I > 2σ(I)] | R1 = 0.0755, wR2 = 0.1531 | R1 = 0.0281, wR2 = 0.0660 | R1 = 0.0450, wR2 = 0.0987 |
| R indices (all data) | R1 = 0.0893, wR2 = 0.1593 | R1 = 0.0334, wR2 = 0.0678 | R1 = 0.0776, wR2 = 0.1133 |
| extinction coefficient | n/a | n/a | n/a |
| largest diff. in peak and hole (e·Å–3) | 1.645 and −2.12 | 2.446 and −2.137 | 2.572 and −1.345 |
The composite crystal of complex I was formed by uranyl connecting two anti-parallel PCBPMP ligands with one DMSO molecule acting as the solvent with a monoclinic P21/n group. According to Table 3, two O-donors (O3 and O4), two O-donors (O5 and O6), and the O-atom (O7) of DMSO are all employed in a distorted pentagonal bipyramidal geometry. The difference in angle between the axial and equatorial O-atoms serves as another indicator of distortion. The divergence from the ideal 72° of a regular pentagon is due to the interaction between two ligands and their bending toward the O-atom of DMSO. Therefore, for O(3)–U(1)–O(4), O(7)–U(1)–O(4), O(5)–U(1)–O(7), O(5)–U(1)–O(6), and O(3)–U(1)–O(6), respectively, the resulting bond angles are 71.3, 70.4, 72.1, 71.2, and 75.1°. Bond lengths were discovered to be 1.762(7), 1.756(7), 2.337(8), 2.366(8), 2.393(7), 2.411(8), and 2.416(7) Å for U(1)–O(1), U(1)–O(2), U(1)–O(5), U(1)–O(3), U(1)–O(7), U(1)–O(4), and U(1)–O(6), respectively.
Table 3. Selected Bond Lengths and Bond Angles for Complexes I–III.
| atoms | bond lengths | atoms | bond lengths | atoms | bond angles | atoms | bond angles |
|---|---|---|---|---|---|---|---|
| Complex I | |||||||
| U(1)–O(2) | 1.756(7) | O(3)–C(7) | 1.280(14) | O(2)–U(1)–O(1) | 178.8(4) | O(3)–U(1)–O(4) | 71.3(3) |
| U(1)–O(1) | 1.762(7) | O(4)–C(11) | 1.266(14) | O(2)–U(1)–O(5) | 91.8(4) | O(7)–U(1)–O(4) | 70.4(3) |
| U(1)–O(5) | 2.337(8) | O(5)–C(24) | 1.252(14) | O(1)–U(1)–O(5) | 89.3(3) | O(2)–U(1)–O(6) | 90.0(3) |
| U(1)–O(3) | 2.366(8) | O(6)–C(28) | 1.262(13) | O(2)–U(1)–O(3) | 88.0(3) | O(1)–U(1)–O(6) | 90.1(3) |
| U(1)–O(7) | 2.393(7) | N(1)–C(7) | 1.346(14) | O(1)–U(1)–O(3) | 90.9(3) | O(5)–U(1)–O(6) | 71.2(3) |
| U(1)–O(4) | 2.411(8) | N(1)–C(1) | 1.394(14) | O(5)–U(1)–O(3) | 146.4(3) | O(3)–U(1)–O(6) | 75.1(3) |
| U(1)–O(6) | 2.416(7) | N(1)–N(2) | 1.418(13) | O(2)–U(1)–O(7) | 88.0(3) | O(7)–U(1)–O(6) | 143.2(3) |
| Cl(1)–C(15) | 1.734(11) | N(2)–C(9) | 1.322(14) | O(1)–U(1)–O(7) | 92.6(3) | O(4)–U(1)–O(6) | 146.4(3) |
| Cl(2)–C(32) | 1.756(11) | N(3)–C(24) | 1.357(15) | O(5)–U(1)–O(7) | 72.1(3) | C(7)–O(3)–U(1) | 132.4(6) |
| O(3)–C(7) | 1.280(14) | N(3)–N(4) | 1.405(13) | O(3)–U(1)–O(7) | 141.4(3) | C(11)–O(4)–U(1) | 136.5(7) |
| O(4)–C(11) | 1.266(14) | N(3)–C(18) | 1.450(14) | O(2)–U(1)–O(4) | 90.7(3) | C(24)–O(5)–U(1) | 126.1(8) |
| O(5)–C(24) | 1.252(14) | N(4)–C(26) | 1.294(15) | O(1)–U(1)–O(4) | 88.6(3) | C(28)–O(6)–U(1) | 135.9(7) |
| O(6)–C(28) | 1.262(13) | S(1)–O(7) | 1.533(8) | O(5)–U(1)–O(4) | 142.3(2) | O(6)–C(28)–C(25) | 121.8(10) |
| Complex II | |||||||
| U(1)–O(1) | 1.7722(15) | O(5)–C(24) | 1.275(2) | O(1)–U(1)–O(2) | 179.11(8) | O(6)–U(1)–O(5) | 71.82(5) |
| U(1)–O(2) | 1.7746(15) | O(6)–C(28) | 1.275(2) | O(1)–U(1)–O(4) | 89.82(7) | O(3)–U(1)–O(5) | 145.99(5) |
| U(1)–O(4) | 2.3312(14) | N(1)–C(9) | 1.315(2) | O(2)–U(1)–O(4) | 90.25(6) | O(1)–U(1)–O(7) | 88.95(7) |
| U(1)–O(6) | 2.3477(14) | N(1)–N(2) | 1.397(2) | O(1)–U(1)–O(6) | 89.05(6) | O(2)–U(1)–O(7) | 90.24(7) |
| U(1)–O(3) | 2.3666(14) | N(2)–C(11) | 1.360(2) | O(2)–U(1)–O(6) | 91.38(6) | O(4)–U(1)–O(7) | 72.54(5) |
| U(1)–O(5) | 2.3833(13) | N(2)–C(12) | 1.414(2) | O(4)–U(1)–O(6) | 145.51(5) | O(6)–U(1)–O(7) | 141.88(5) |
| U(1)–O(7) | 2.4300(15) | N(3)–C(28) | 1.357(2) | O(1)–U(1)–O(3) | 90.84(7) | O(3)–U(1)–O(7) | 143.89(5) |
| Cl(1)–C(4) | 1.7384(19) | N(3)–N(4) | 1.397(2) | O(2)–U(1)–O(3) | 90.02(7) | O(5)–U(1)–O(7) | 70.06(5) |
| Cl(2)–C(14) | 1.726(2) | N(3)–C(29) | 1.415(2) | O(4)–U(1)–O(3) | 71.35(5) | C(7)–O(3)–U(1) | 140.06(13) |
| Cl(3)–C(21) | 1.7309(18) | N(4)–C(26) | 1.316(2) | O(6)–U(1)–O(3) | 74.20(5) | C(11)–O(4)–U(1) | 128.03(12) |
| Cl(4)–C(31) | 1.736(2) | O(7)–C(35) | 1.243(2) | O(1)–U(1)–O(5) | 87.23(6) | C(24)–O(5)–U(1) | 136.44(12) |
| O(3)–C(7) | 1.272(2) | O(8)–C(38) | 1.233(3) | O(2)–U(1)–O(5) | 92.17(6) | C(28)–O(6)–U(1) | 132.14(12) |
| O(4)–C(11) | 1.277(2) | C(38)–N(6) | 1.306(3) | O(4)–U(1)–O(5) | 142.53(5) | O(6)–C(28)–C(25) | 130.59(17) |
| Complex III | |||||||
| U(1)–O(2) | 1.759(4) | N(1)–C(11) | 1.351(7) | O(2)–U(1)–O(1) | 178.62(18) | O(5)–U(1)–O(4) | 71.93(13) |
| U(1)–O(1) | 1.763(4) | N(1)–N(2) | 1.396(6) | O(2)–U(1)–O(3) | 92.16(18) | O(6)–U(1)–O(4) | 143.42(14) |
| U(1)–O(3) | 2.347(4) | N(1)–C(12) | 1.416(7) | O(1)–U(1)–O(3) | 89.15(17) | O(2)–U(1)–O(7) | 90.76(18) |
| U(1)–O(5) | 2.348(4) | N(2)–C(9) | 1.306(7) | O(2)–U(1)–O(5) | 89.85(17) | O(1)–U(1)–O(7) | 90.05(16) |
| U(1)–O(6) | 2.375(4) | N(3)–C(29) | 1.343(7) | O(1)–U(1)–O(5) | 88.85(16) | O(3)–U(1)–O(7) | 71.41(13) |
| U(1)–O(4) | 2.385(4) | N(3)–N(4) | 1.405(7) | O(3)–U(1)–O(5) | 143.66(13) | O(5)–U(1)–O(7) | 144.86(13) |
| U(1)–O(7) | 2.385(4) | N(3)–C(30) | 1.419(7) | O(2)–U(1)–O(6) | 89.00(17) | O(6)–U(1)–O(7) | 73.34(13) |
| Cl(1)–C(4) | 1.733(6) | N(4)–C(27) | 1.305(7) | O(1)–U(1)–O(6) | 90.17(17) | O(4)–U(1)–O(7) | 143.21(14) |
| Cl(2)–C(22) | 1.732(6) | S(1S)–O(1S) | 1.527(5) | O(3)–U(1)–O(6) | 144.74(13) | O(3)–C(11)–N(1) | 124.0(5) |
| O(3)–C(11) | 1.276(7) | S(1T)–O(1T) | 1.527(5) | O(5)–U(1)–O(6) | 71.55(13) | O(3)–C(11)–C(8) | 129.3(5) |
| O(4)–C(7) | 1.264(7) | S(1T)–C(1T) | 1.746(7) | O(2)–U(1)–O(4) | 88.92(19) | O(5)–C(29)–N(3) | 123.2(5) |
| O(5)–C(29) | 1.272(7) | S(1)–C(38) | 1.767(6) | O(1)–U(1)–O(4) | 91.10(18) | O(5)–C(29)–C(26) | 130.2(5) |
| O(6)–C(25) | 1.281(7) | S(1S)–C(2S) | 1.766(6) | O(3)–U(1)–O(4) | 71.83(13) | O(7)–S(1)–C(37) | 106.6(3) |
The monoclinic structure of the crystal of complex II was achieved through uranyl bonding between two PCBMCPMP ligands in an anti-manner and DMF acting as the solvent with a C2/c space group. By breaking the linearity of the uranyl bond with an O(1)–U(1)–O(2) bond angle of 179.11°, a distorted pentagonal bipyramidal arrangement is achieved, which is directly confirmed through bond angles of 74.20, 71.82, 70.06, 72.54, and 71.35° for O(6)–U(1)–O(3), O(6)–U(1)–O(5), O(5)–U(1)–O(7), O(4)–U(1)–O(7), and O(4)–U(1)–O(3), respectively. Bond lengths were determined to be 1.7722(15), 1.7746(15), 2.3312(14), 2.3477(14), 2.3666(14), 2.3833(13), and 2.4300(15) Å, respectively, for the bonds U(1)–O(1), U(1)–O(2), U(1)–O(4), U(1)–O(6), U(1)–O(3), U(1)–O(5), and U(1)–O(7).
The unit-cell characteristics of the monoclinic crystal structure of complex III were compatible with the C2/c space group and were arranged similarly, with two PCBPTMP ligands in the anti-manner and DMSO serving as the solvent. The bond angle of O(1)–U(1)–O(2) is 178.62° for the axial uranyl bond. Similar to complexes I and II, the uranium center found in complex III possesses a distorted pentagonal bipyramid geometry, with equatorial bond angles of 73.34, 71.55, 71.93, 71.83, and 71.41° for O(6)–U(1)–O(7), O(5)–U(1)–O(6), O(5)–U(1)–O(4), O(3)–U(1)–O(4), and O(3)–U(1)–O(7), respectively. Bond lengths were discovered to be 1.759(4), 1.763(4), 2.347(4), 2.348(4), 2.375(4), 2.385(4), and 2.385(4) Å, respectively, for U(1)–O(2), U(1)–O(1), U(1)–O(3), U(1)–O(5), U(1)–O(6), U(1)–O(4), and U(1)–O(7).
The covalency order for complexes I–III was found to be impacted by values of stretching frequencies, average bond lengths of axial uranyl bonds, values of average bond lengths on the pentagonal equatorial plane, solvent coordination on the fifth site of a pentagonal plane, and the type of aryl group on the nitrogen of pyrazolone ring. In contrast to complexes I and III, complex II has a higher covalency due to the m-chlorophenyl group and the longest bond length of 2.4300(15) Å for U(1)–O(7). The further decrease in covalency moving from complex III to complex II can be explained by the same reason. Another notable result of the solvent molecules was shown in complex II, which had a longer U(1)–O(7) bond than the other two complexes. This resulted in a decrease in the alternative U–O overall bond order and increased covalent nature.
It was established that the U–O bond lengths of the acyl O-atoms are slightly longer than those of the pyrazolone O-atoms, as already known for uranyl acylpyrazolone complexes.21,39
3.6. DFT Computational Analysis
The pentagonal bipyramidal geometry is totally confirmed by DFT calculations. As frontier orbitals are crucial for determining the energy and chemical behavior,26,40 they were first investigated. For the related complexes I, II, and III, the structures were all optimized with electronic energy values of −107, −123.7, and −109.1 keV, respectively.
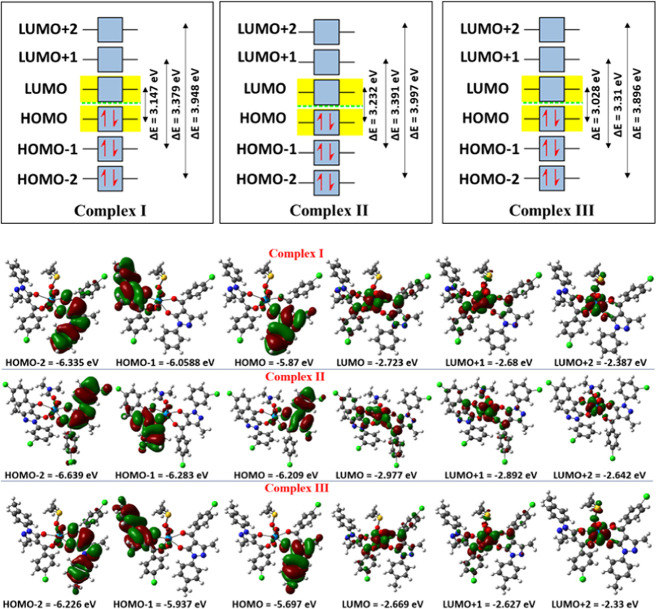
According to Figure 3, the majority of HOMOs are concentrated around the ligand at HOMO – 2, HOMO – 1, and HOMO, with energies of −6.335, −6.0588, and −5.87 eV for complex I, −6.639, −6.283, and −6.209 eV for complex II, and −6.226, −5.937, and −5.697 eV for complex III, respectively. Similarly, the majority of LUMOs are found in the vicinity of the metal center at LUMO, LUMO + 1, and LUMO + 2, with energies of −2.723, −2.68, and −2.387 eV for complex I, −2.977, −2.892, and −2.642 eV for complex II, and −2.669, −2.627, and −2.33 eV for complex III, respectively. ΔEHOMO–LUMO, ΔEHOMO – 1–LUMO – 1, and ΔEHOMO – 2–LUMO – 2 values are 3.147, 3.379, and 3.948 eV for complex I, 3.232, 3.391, and 3.997 eV for complex II, and 3.028, 3.31, and 3.896 eV for complex III, respectively, which can be used to describe the chemical stability. The diamagnetic performance of the complexes is explained by the existence of paired electrons in all HOMOs. Also, evidence for the higher stability of complex II can be directly observed through the higher ΔE values compared with those of other complexes as the energy required to promote the electron is higher in complex II. As shown in Table 4, global metrics provide a broader understanding of the features of complexes.
Figure 3.
HOMO–LUMO frontier orbitals with an energy diagram.
Table 4. Global Parameters for Complexes I–III (in eV).
| properties of complex | mathematical formula | complex I | complex II | complex III |
|---|---|---|---|---|
| EHOMO | EHOMO | –5.87 | –6.209 | –5.697 |
| ELUMO | ELUMO | –2.723 | –2.977 | –2.669 |
| ΔE | ΔE = ELUMO – EHOMO | 3.147 | 3.232 | 3.028 |
| ionization potential (IP) | IP = −EHOMO | 5.87 | 6.209 | 5.697 |
| chemical potential (μ) |  |
–4.2965 | –4.593 | –4.183 |
| electron affinity (EA) | EA = −ELUMO | 2.723 | 2.977 | 2.669 |
| electronegativity (EN) |  |
4.2965 | 4.593 | 4.183 |
| global hardness (η) |  |
1.5735 | 1.616 | 1.514 |
| softness (S) |  |
0.3177 | 0.3094 | 0.3302 |
| electrophilicity index (ω) |  |
5.8659 | 6.5271 | 5.7785 |
Theoretical vibrations can be used to examine the gradient of covalent nature based on frequency values. Crucial theoretical vibrations compared with actual FTIR spectral values are shown in Table 5. As earlier explained, the relative influence of the asymmetric and symmetric vibrations of uranyl confirms the covalency order, with complex II having higher covalent characteristics than other complexes, and complexes I and III having quite comparable covalent characteristics. Figures S10–S12 show the theoretical FTIR spectra.
Table 5. Comparing Theoretical and Actual Vibrational Data for Complexes I–III.
| complex
I |
complex
II |
complex
III |
||||
|---|---|---|---|---|---|---|
| type of frequency (in cm–1 units) | theoretical | practical | theoretical | practical | theoretical | practical |
| vs(C=O) pyrazolone | 1583 | 1577 | 1603 | 1591 | 1600 | 1591 |
| v(C=N) | 1559 | 1557 | 1563 | 1557 | 1559 | 1558 |
| C–H bending | 1527 | 1521 | 1537 | 1524 | 1533 | 1525 |
| v(C=O) acyl group | 1404 | 1400 | 1482 | 1471 | 1429 | 1436 |
| v(C=C) phenyl ring | 1380 | 1380 | 1371 | 1373 | 1367 | 1379 |
| C–H in plane deformation | 1097 | 1089 | 1096 | 1089 | 1094 | 1089 |
| vas(U=O) | 917 | 920 | 884 | 863 | 916 | 912 |
| vs(U=O) | 841 | 833 | 840 | 778 | 829 | 823 |
Table 6 provides significant theoretical bond lengths and angles, which agree with the detected values for further examination. The theoretically idealized geometries of the three complexes are presented in Figure 4.
Table 6. Comparative Bond Lengths (Å) and Bond Angles (deg) of Complexes I–III.
| atoms numbering as in Figure 2 | practical bond lengths | theoretical bond lengths | atoms numbering as in Figure 2 | practical bond angles | theoretical bond angles |
|---|---|---|---|---|---|
| Complex I | |||||
| U(1)–O(1) | 1.762(7) | 1.81052 | O(2)–U(1)–O(1) | 178.8(4) | 177.56383 |
| U(1)–O(5) | 2.337(8) | 2.37473 | O(1)–U(1)–O(7) | 92.6(3) | 86.18490 |
| U(1)–O(6) | 2.416(7) | 2.40007 | O(2)–U(1)–O(3) | 88.0(3) | 91.38749 |
| U(1)–O(2) | 1.756(7) | 1.79245 | O(5)–U(1)–O(7) | 72.1(3) | 72.62033 |
| U(1)–O(3) | 2.366(8) | 2.35395 | O(5)–U(1)–O(6) | 71.2(3) | 69.60423 |
| U(1)–O(4) | 2.411(8) | 2.40833 | O(3)–U(1)–O(6) | 75.1(3) | 75.40828 |
| U(1)–O(7) | 2.393(7) | 2.37527 | O(3)–U(1)–O(4) | 71.3(3) | 70.10830 |
| O(7)–U(1)–O(4) | 70.4(3) | 72.60965 | |||
| Complex II | |||||
| U(1)–O(1) | 1.7722(15) | 1.79267 | O(1)–U(1)–O(2) | 179.11(8) | 178.03015 |
| U(1)–O(5) | 2.3833(13) | 2.43056 | O(1)–U(1)–O(7) | 88.95(7) | 92.46929 |
| U(1)–O(6) | 2.3477(14) | 2.43472 | O(2)–U(1)–O(7) | 90.24(7) | 86.15223 |
| U(1)–O(2) | 1.7746(15) | 2.36230 | O(5)–U(1)–O(7) | 70.06(5) | 70.08910 |
| U(1)–O(3) | 2.3666(14) | 1.79469 | O(6)–U(1)–O(5) | 71.82(5) | 70.26160 |
| U(1)–O(4) | 2.3312(14) | 2.37222 | O(6)–U(1)–O(3) | 74.20(5) | 77.21527 |
| U(1)–O(7) | 2.4300(15) | 2.36815 | O(4)–U(1)–O(3) | 71.35(5) | 70.38770 |
| O(4)–U(1)–O(7) | 72.54(5) | 72.63012 | |||
| Complex III | |||||
| U(1)–O(1) | 1.763(4) | 1.81085 | O(2)–U(1)–O(1) | 178.62(18) | 177.48009 |
| U(1)–O(7) | 2.385(4) | 2.37591 | O(1)–U(1)–O(7) | 90.05(16) | 86.12653 |
| U(1)–O(3) | 2.347(4) | 2.37660 | O(2)–U(1)–O(7) | 90.76(18) | 91.35968 |
| U(1)–O(4) | 2.385(4) | 2.39776 | O(3)–U(1)–O(7) | 71.41(13) | 72.57717 |
| U(1)–O(2) | 1.759(4) | 1.79277 | O(3)–U(1)–O(4) | 71.83(13) | 69.60588 |
| U(1)–O(5) | 2.348(4) | 2.35173 | O(5)–U(1)–O(4) | 71.93(13) | 75.33490 |
| O(5)–C(6) | 2.375(4) | 2.40816 | O(5)–U(1)–O(6) | 71.55(13) | 70.13616 |
| O(6)–U(1)–O(7) | 73.34(13) | 72.68836 | |||
Figure 4.
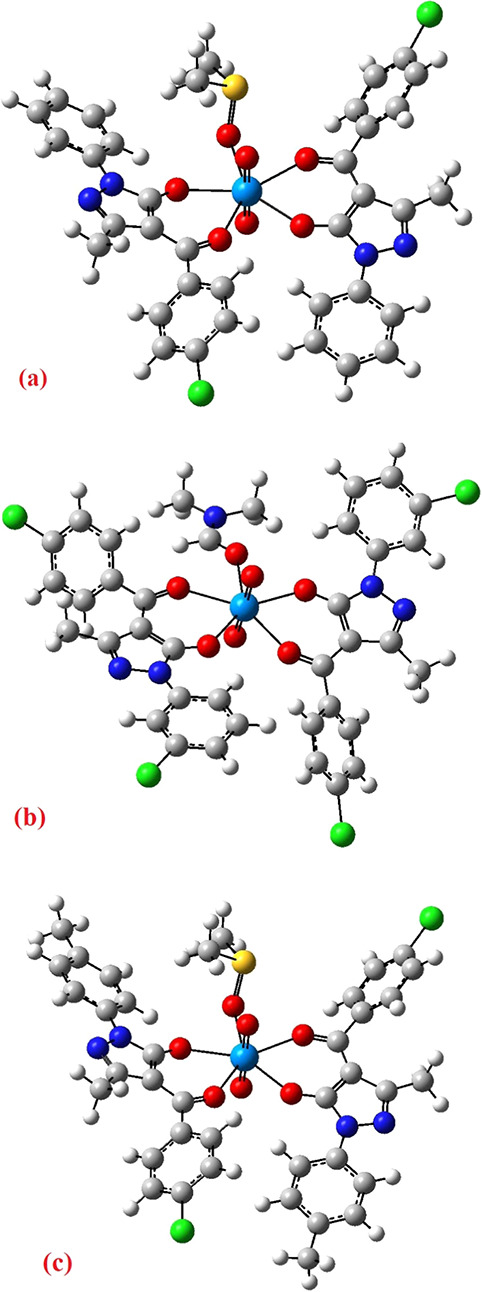
DFT-optimized geometries with atom labeling for complexes (a) I, (b) II, and (c) III.
3.7. Hirshfeld Surface Area Analysis
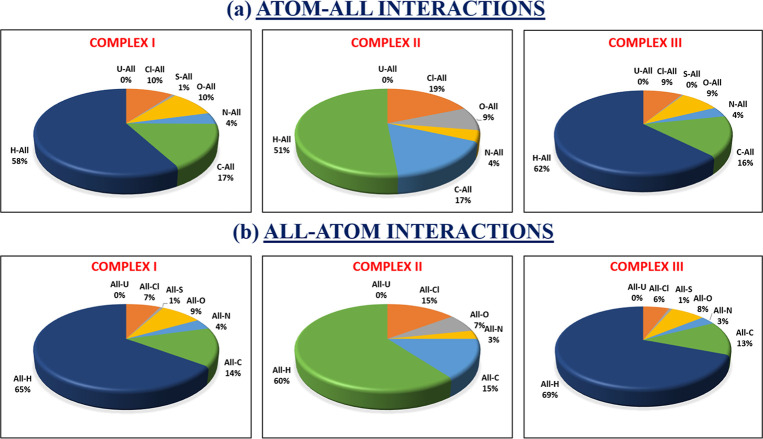
Using crystal explorer 17.5 program, the donor–acceptor interaction sites and intermolecular contacts can be visualized for all three complexes (see Figures 5–77). The absence of huge and brilliant red spots indicates the absence of H-bonds. However, as shown in Figures 5–7, the red markings on the dnorm surface are weaker due to greater proximity with neighboring moieties or shorter distance between halogen bonds.41,42 Along with shorter noncovalent bonds, the red-blue region in dnorm and the curved portion of the graph present around the aromatic rings indicate stacking, which increases the stability of the crystal lattice.43 The packing probability of complexes can be estimated using percentage statistics for atom–all and all–atom contacts. There are no U-all, U–U, or all-U connections in any of the three complexes, proving that uranium has no secondary interactions with the atoms of molecules surrounding it. All three complexes have considerable H-interactions, i.e., H-all interactions for complexes I–III are 58, 51, and 62%, and All-H interactions for complexes I–III are 65, 60, and 69%, respectively, as demonstrated in Figure 8. Figures S13–S15 display 2D FP plots corresponding to all such interactions.
Figure 5.
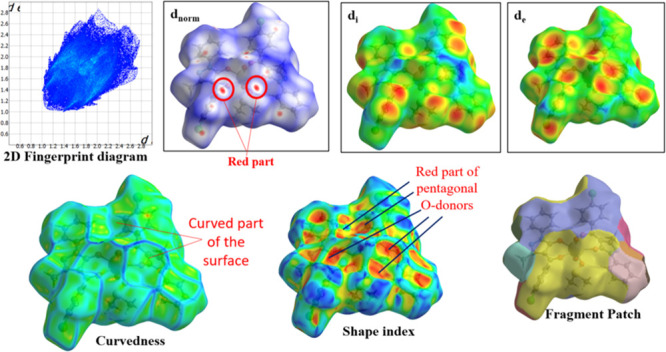
Molecular HS of complex I.
Figure 7.
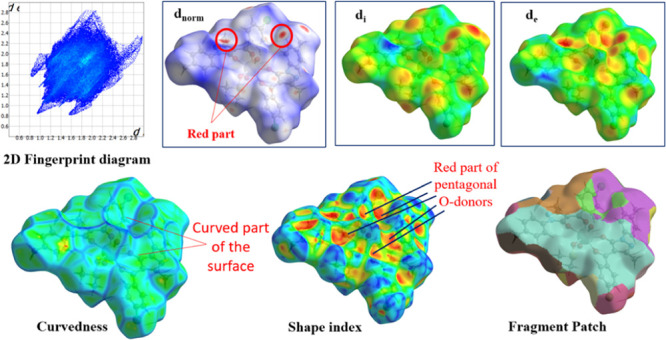
Molecular HS of complex III.
Figure 8.
Percentage of interactions involving (a) atoms inside the HS and all atoms in the area around the pointed nuclei, and (b) atoms outside the HS and the atoms inside the pointed nuclei.
Figure 6.
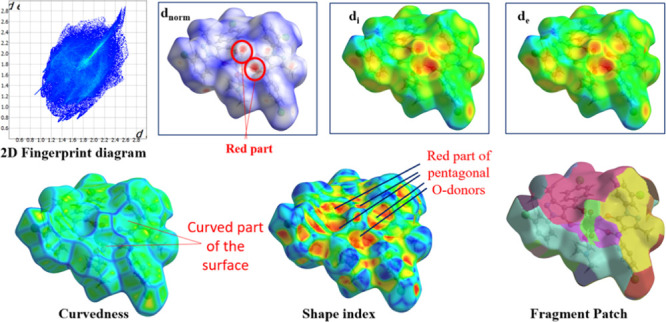
Molecular HS of complex II.
3.8. Electrochemical Analysis
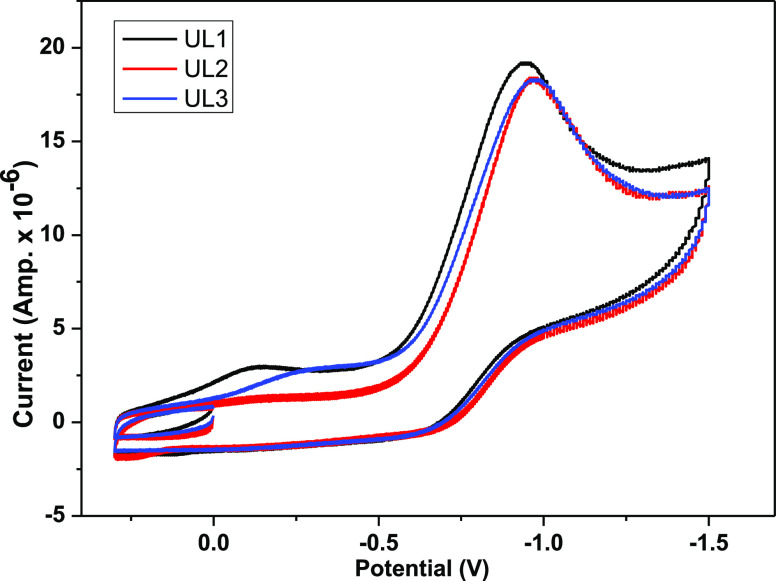
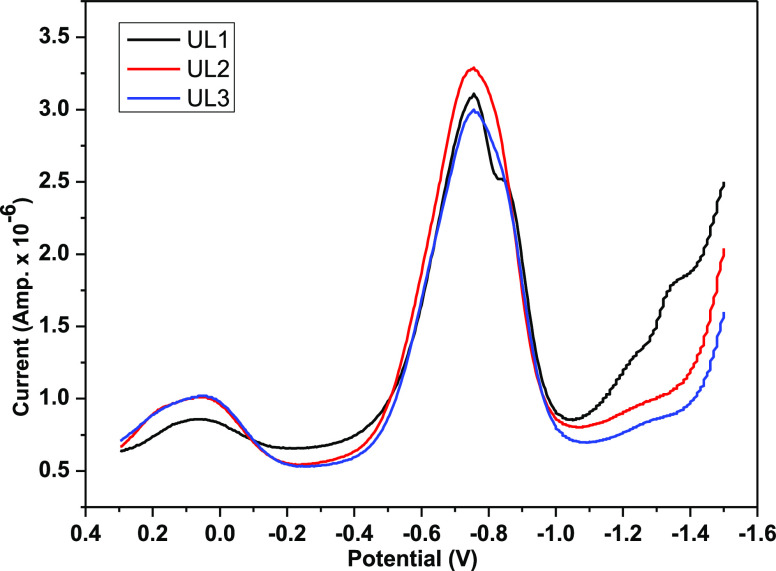
Cyclic voltammetry was carried out, and the corresponding cyclic voltammogram is shown in Figure 9. As a result of the uranyl ion being reduced (UO22+ + e– → UO2+), complex I has a cathodic potential EPc of −0.94 V and an anodic potential EAc of roughly −0.78 V as a result of the reverse reaction (UO2+ → UO22+ + e–).18,26,44,45 An irreversible redox reaction is suggested by the E value, which approaches −0.16 V. Similarly, complex II has EPc, EAc, and ΔE values of −0.972, −0.822, and −0.15 V, respectively. Complex III has EPc, EAc, and ΔE values of −0.968, −0.797, and −0.171 V, respectively. The reduction DPV diagram shown in Figure 10 corresponds to the increased sharp change.
Figure 9.
Cyclic voltammograms of complexes I–III in DMSO at 25 °C.
Figure 10.
DPV plots of complexes I–III in DMSO at 25 °C.
4. Conclusions
To investigate the sequence of covalent characteristics, crystal structure, and redox properties of the three uranyl acylpyrazolone complexes, [UO2(PCBPMP)2(CH3CH2OH)] (complex I), [UO2(PCBMCPMP)2(CH3CH2OH)] (complex II), and [UO2(PCBPTMP)2(CH3CH2OH)] (complex III) were synthesized in the current study. Two σ-donating acypyrazolones and one solvent occupied an equatorial pentagonal plane with a stable pentagonal bipyramidal geometry. The characterization data of these complexes are largely used to examine their structure, geometry, and composition. Using FTIR and single-crystal spectral characterization techniques, values of stretching frequencies, average bond lengths of axial uranyl bonds, values of average bond lengths on the pentagonal equatorial plane, solvent coordination on the fifth site of a pentagonal plane, and the type of aryl group on the nitrogen of the pyrazolone ring can be used to understand the impact on the covalency order in complexes. Single crystals of complexes I and III were obtained in DMSO, whereas that of complex II was obtained in DMF solvent. All of them have monoclinic crystal systems, but complex I has a different space group and Z value compared with complexes II and III. Theoretical global metrics provide a broader understanding of the features of the complexes. Computational DFT calculations show outstanding consistency with all experimental values. The sequence of covalency in decreasing order of complexes II > III > I was confirmed through FTIR, XRD, and DFT data. The donor–acceptor interaction sites and intermolecular contacts were analyzed from Hirshfeld plots. Complexes were being reduced irreversibly, according to CV-DPV analysis. The uranyl acypyrazolone series can be best understood using the data mentioned above, and by understanding the sequence of covalent characteristics of these complexes, it is possible to investigate a variety of chemical properties and applications.
Acknowledgments
The authors thank The Head of the Department, Department of Chemistry, Maharaja Sayajirao University of Baroda, for offering the necessary centers and providing the facilities necessary to carry out this work. The authors are grateful to the Department of Inorganic & Structural Chemistry, Howard University, USA, for supporting X-ray single-crystal analysis.
Glossary
Abbreviations
- HSAB
hard–soft acid–base
- PCBPMP
p-chlorobenzoyl 1-phenyl 3-methyl 5-pyrazolone
- PCBPTMP
p-chlorobenzoyl 1-(p-tolyl) 3-methyl 5-pyrazolone
- PCBMCPMP
p-chlorobenzoyl 1-(m-chlorophenyl) 3-methyl 5-pyrazolone
Supporting Information Available
The Supporting Information is available free of charge at https://pubs.acs.org/doi/10.1021/acsomega.2c03923.
FTIR spectrum of complex I, II, and III; 1H NMR spectrum of complex I, II, and III; TG-DTA plot of complex I, II, and III; FTIR spectrum of complex I, II, and III through computational analysis; two dimensional fingerprint plots for atom-all and all-atom interactions in complex I, II, and III (PDF)
ul1 (complex-I) (CIF)
tm-ul2 (complex-II) (CIF)
tm5-ul3 (complex-III) (CIF)
Accession Codes
Crystallographic information for the structural study has been submitted to the Cambridge Crystallographic Data Center under CCDC No. 2169240–2169242. The Cambridge Crystallographic Data center, 12 Union Road, Cambridge CB2 1EZ (UK), can be reached by fax at +44(1223)336-033 or email at deposit@ccdc.cam.ac.uk for free access to these data.
The authors declare no competing financial interest.
Supplementary Material
References
- Konings R. J. M.; Beneš O.; Griveau J. C.. The Actinides Elements: Properties and Characteristics. In Comprehensive Nuclear Materials, Elsevier Ltd., 2012; Vol. 2, pp 1–20. [Google Scholar]
- Ewing R. C. Safe management of actinides in the nuclear fuel cycle: Role of mineralogy. C. R. Geosci. 2011, 343, 219–229. 10.1016/j.crte.2010.09.003. [DOI] [Google Scholar]
- Capelli E.; Konings R. J. M.. Halides of the Actinides and Fission Products Relevant for Molten Salt Reactors. In Comprehensive Nuclear Materials, 2nd ed.; Elsevier Ltd., 2020; pp 256–283. [Google Scholar]
- Romanchuk A. Y.; Vlasova I. E.; Kalmykov S. N. Speciation of Uranium and Plutonium From Nuclear Legacy Sites to the Environment: A Mini Review. Front. Chem. 2020, 8, 630. 10.3389/fchem.2020.00630. [DOI] [PMC free article] [PubMed] [Google Scholar]
- Danesi P. R.; Chtarlzia R.; Rickert P.; Horwitz E. P. Separation of Actinides and Lanthanides from Acidic Nuclear Wastes by Supported Liquid Membranes. Solvent Extr. Ion Exch. 1985, 3, 111–147. 10.1080/07366298508918505. [DOI] [Google Scholar]
- Lumetta G. J.; Braley J. C.; Sinkov S. I.; Carter J. C.. Separating the Minor Actinides Through Advances in Selective Coordination Chemistry, Pacific Northwest National Laboratory: Richland, WA, 2012.
- Usuda S. Rapid Ion-Exchangeseparations Of Actinides. J. Radioanal. Nucl. Chem. 1988, 123, 619–631. 10.1007/BF02034922. [DOI] [Google Scholar]
- White F. D.; Marsh M. L.. Recent Advances in Chemistry of Transuranium Elements in Non-Aqueous Media. In Handbook on the Physics and Chemistry of Rare Earths, Elsevier B.V., 2019; Vol. 55, pp 123–158. [Google Scholar]
- Rump A.; Eder S.; Lamkowski A.; Hermann C.; Abend M.; Port M. A Quantitative Comparison of the Chemo- and Radiotoxicity of Uranium at Different Enrichment Grades. Toxicol. Lett. 2019, 313, 159–168. 10.1016/j.toxlet.2019.07.004. [DOI] [PubMed] [Google Scholar]
- Yamamura T.; Shiokawa Y.; Yamana H.; Moriyama H. Electrochemical Investigation of Uranium B-Diketonates for All-Uranium Redox Flow Battery. Electrochim. Acta 2002, 48, 43–50. 10.1016/S0013-4686(02)00546-7. [DOI] [Google Scholar]
- Mullane K. C.; Hrobárik P.; Cheisson T.; Manor B. C.; Carroll P. J.; Schelter E. J. 13 C NMR Shifts as an Indicator of U-C Bond Covalency in Uranium(VI) Acetylide Complexes: An Experimental and Computational Study. Inorg. Chem. 2019, 58, 4152–4163. 10.1021/acs.inorgchem.8b03175. [DOI] [PubMed] [Google Scholar]
- Thuéry P.; Harrowfield J. Cavity Formation in Uranyl Ion Complexes with Kemp’s Tricarboxylate: Grooved Diperiodic Nets and Polynuclear Cages. Inorg. Chem. 2021, 60, 1683–1697. 10.1021/acs.inorgchem.0c03205. [DOI] [PubMed] [Google Scholar]
- Monsigny L.; Thuéry P.; Berthet J. C.; Cantat T. Breaking C-O Bonds with Uranium: Uranyl Complexes as Selective Catalysts in the Hydrosilylation of Aldehydes. ACS Catal. 2019, 9, 9025–9033. 10.1021/acscatal.9b01408. [DOI] [Google Scholar]
- Ye G.; Roques J.; Solari P. L.; den Auwer C.; Jeanson A.; Brandel J.; Charbonnière L. J.; Wu W.; Simoni É. Structural and Thermodynamics Studies on Polyaminophosphonate Ligands for Uranyl Decorporation. Inorg. Chem. 2021, 60, 2149–2159. 10.1021/acs.inorgchem.0c02145. [DOI] [PubMed] [Google Scholar]
- Mei L.; Wu Q. Y.; Wu S.; Geng J. S.; Liu Y. L.; Hu K. Q.; Liu Y. C.; Zhang Z. H.; Liang Y. Y.; Chai Z. F.; Burns P. C.; Shi W. Q. High-Temperature Synthesis of a Uranyl Peroxo Complex Facilitated by Hydrothermally in Situ Formed Organic Peroxide. Inorg. Chem. 2021, 60, 2133–2137. 10.1021/acs.inorgchem.0c03661. [DOI] [PubMed] [Google Scholar]
- Hamilton J. G. The Metabolism of the Fission Products and the Heaviest Elements. Radiology 1947, 49, 325–343. 10.1148/49.3.325. [DOI] [PubMed] [Google Scholar]
- Carter K. P.; Smith K. F.; Tratnjek T.; Deblonde G. J. P.; Moreau L. M.; Rees J. A.; Booth C. H.; Abergel R. J. Controlling the Reduction of Chelated Uranyl to Stable Tetravalent Uranium Coordination Complexes in Aqueous Solution. Inorg. Chem. 2021, 60, 973–981. 10.1021/acs.inorgchem.0c03088. [DOI] [PubMed] [Google Scholar]
- Nocton G.; Horeglad P.; Vetere V.; Pécaut J.; Dubois L.; Maldivi P.; Edelstein N. M.; Mazzanti M. Synthesis, Structure, and Bonding of Stable Complexes of Pentavalent Uranyl. J. Am. Chem. Soc. 2010, 132, 495–508. 10.1021/ja9037164. [DOI] [PubMed] [Google Scholar]
- Marchetti F.; Pettinari R.; Pettinari C. Recent Advances in Acylpyrazolone Metal Complexes and Their Potential Applications. Coord. Chem. Rev. 2015, 303, 1–31. 10.1016/j.ccr.2015.05.003. [DOI] [Google Scholar]
- Marchetti F.; Pettinari C.; Pettinari R. Acylpyrazolone Ligands: Synthesis, Structures, Metal Coordination Chemistry and Applications. Coord. Chem. Rev. 2005, 249, 2909–2945. 10.1016/j.ccr.2005.03.013. [DOI] [Google Scholar]
- Marchetti F.; Pettinari C.; di Nicola C.; Tombesi A.; Pettinari R. Coordination Chemistry of Pyrazolone-Based Ligands and Applications of Their Metal Complexes. Coord. Chem. Rev. 2019, 15, 213069 10.1016/j.ccr.2019.213069. [DOI] [Google Scholar]
- Shaikh I.; Jadeja R. N.; Patel R.; Mevada V.; Gupta V. K. 4-Acylhydrazone-5-Pyrazolones and their Zinc(II) Metal Complexes: Synthesis, Characterization, Crystal Feature and Antimalarial Activity. J. Mol. Struct. 2021, 1232, 130051 10.1016/j.molstruc.2021.130051. [DOI] [Google Scholar]
- Shaikh I.; Jadeja R. N.; Patel R. Three Mixed Ligand Mononuclear Zn(II) Complexes of 4-Acyl Pyrazolones: Synthesis, Characterization, Crystal Study and Anti-Malarial Activity. Polyhedron 2020, 183, 114528 10.1016/j.poly.2020.114528. [DOI] [Google Scholar]
- Vogel A. I.; Jeffery G. H.. Vogel’s Textbook of Quantitative Chemical Analysis, Longman Scientific & Technical, 1989. [Google Scholar]
- Travadi M.; Jadeja R. N.; Butcher R. J. Synthesis, Covalency Parameters, Energy Calculations and Crystal Features of Acylpyrazolone Derived Pentavalent Uranyl Complex along with DFT and Hirshfeld Analysis. Polyhedron 2022, 223, 115956 10.1016/j.poly.2022.115956. [DOI] [Google Scholar]
- Patel A. K.; Jadeja R. N.; Roy H.; Patel R. N.; Patel S. K.; Butcher R. J. Pseudo-Tetrahedral Copper(II) Complex Derived from N’-[(2E,3Z)-4-Hydroxy-4-Phenylbut-3-En-2-Ylidene]Acetohydrazide: Synthesis, Molecular Structure, Quantum Chemical Investigations, Antioxidant and Antiproliferative Properties. J. Mol. Struct. 2019, 1185, 341–350. 10.1016/j.molstruc.2019.03.004. [DOI] [Google Scholar]
- Sheldrick G. M. SHELXT - Integrated Space-Group and Crystal-Structure Determination. Acta Crystallogr., Sect. A 2015, 71, 3–8. 10.1107/S2053273314026370. [DOI] [PMC free article] [PubMed] [Google Scholar]
- Sheldrick G. M. Crystal Structure Refinement with SHELXL. Acta Crystallogr., Sect. C 2015, 71, 3–8. 10.1107/S2053229614024218. [DOI] [PMC free article] [PubMed] [Google Scholar]
- Wadt W. R.; Hay P. J. Ab Initio Effective Core Potentials for Molecular Calculations. Potentials for Main Group Elements Na to Bi. J. Chem. Phys. 1985, 82, 284–298. 10.1063/1.448800. [DOI] [Google Scholar]
- Frisch M. J.; Trucks G. W.; Schlegel H. B.; Scuseria G. E.; Robb M. A.; Cheeseman J. R.; Scalmani G.; Barone V.; Mennucci B.; Petersson G. A.; Nakatsuji H.; Caricato M.; Li X.; Hratchian H. P.; Izmaylov A. F.; Bloino J.; Zheng G.; Sonnenberg J. L.; Hada M.; Ehara M.; Toyota K.; Fukuda R.; Hasegawa J.; Ishida M.; Nakajima T.; Honda Y.; Kitao O.; Nakai H.; Vreven T.; Montgomery J. A. Jr.; Peralta J. E.; Ogliaro F.; Bearpark M.; Heyd J. J.; Brothers E.; Kudin K. N.; Staroverov V. N.; Kobayashi R.; Normand J.; Raghavachari K.; Rendell A.; Burant J. C.; Iyengar S. S.; Tomasi J.; Cossi M.; Rega N.; Millam J. M.; Klene M.; Knox J. E.; Cross J. B.; Bakken V.; Adamo C.; Jaramillo J.; Gomperts R.; Stratmann R. E.; Yazyev O.; Austin A. J.; Cammi R.; Pomelli C.; Ochterski J. W.; Martin R. L.; Morokuma K.; Zakrzewski V. G.; Voth G. A.; Salvador P.; Dannenberg J. J.; Dapprich S.; Daniels A. D.; Farkas Ö.; Foresman J. B.. Gaussian 09, revision E.01; Gaussian, Inc.: Wallingford, CT, 2013.
- Hay P. J.; Wadt W. R. Ab Initio Effective Core Potentials for Molecular Calculations. Potentials for the Transition Metal Atoms Sc to Hg. J. Chem. Phys. 1985, 82, 270–283. 10.1063/1.448799. [DOI] [Google Scholar]
- Koenderink J. J.; van Doorn A. J. Surface Shape and Curvature Scales. Image Vis. Comput. 1992, 10, 557–564. 10.1016/0262-8856(92)90076-F. [DOI] [Google Scholar]
- Petersson G. A.; Ai-Laham M. A. A Complete Basis Set Model Chemistry. II. Open-Shell Systems and the Total Energies of the First-Row Atoms. J. Chem. Phys. 1991, 94, 6081–6090. 10.1063/1.460447. [DOI] [Google Scholar]
- Dolg M.; Wedig U.; Stoll H.; Preuss H. Energy-Adjusted Ab Initio Pseudopotentials for the First Row Transition Elements. J. Chem. Phys. 1987, 86, 866–872. 10.1063/1.452288. [DOI] [Google Scholar]
- Niklas J. E.; Hunter K. M.; Gorden A. E. V. Bonding Interactions in Uranyl α-Diimine Complexes: A Spectroscopic and Electrochemical Study of the Impacts of Ligand Electronics and Extended Conjugation. Inorg. Chem. 2019, 58, 15088–15100. 10.1021/acs.inorgchem.9b01695. [DOI] [PubMed] [Google Scholar]
- McGlynn S. P.; Smith J. K.; Neely W. C. Electronic Structure, Spectra, and Magnetic Properties of Oxycations. III. Ligation Effects on the Infrared Spectrum of the Uranyl Ion. J. Chem. Phys. 1961, 35, 105–116. 10.1063/1.1731876. [DOI] [Google Scholar]
- Nagar M. S.; Ruikar P. B.; Subramanian M. S. Complexes of Tetravalent Plutonium, Uranium and Thorium with Acylpyrazolones. Inorg. Chim. Acta 1988, 141, 309–312. 10.1016/s0020-1693(00)83925-0. [DOI] [Google Scholar]
- Geary W. J. The use of conductivity measurements in organic solvents for the characterisation of coordination compounds. Coord. Chem. Rev. 1971, 7, 81–122. 10.1016/S0010-8545(00)80009-0. [DOI] [Google Scholar]
- Sinha S. P. Spectroscopic investigations of some neodymium complexes. Spectrochim. Acta 1966, 22, 57–62. 10.1016/0371-1951(66)80008-5. [DOI] [Google Scholar]
- Ryan R. R.; Jarvinen G. D. Bis(4-Benzoyl-2,4-Dihydro-5-Methyl-2-Phenyl-3H-Pyrazol-3-Onato-O,O’)-(Dimethyl Sulfoxide-O) Dioxouranium(VI). Acta Crystallogr., Sect. C 1987, 43, 1295–1298. 10.1107/S0108270187092114. [DOI] [Google Scholar]
- Shoba D.; Periandy S.; Karabacak M.; Ramalingam S. Vibrational Spectroscopy (FT-IR and FT-Raman) Investigation, and Hybrid Computational (HF and DFT) Analysis on the Structure of 2,3-Naphthalenediol. Spectrochim. Acta, Part A 2011, 83, 540–552. 10.1016/j.saa.2011.09.002. [DOI] [PubMed] [Google Scholar]
- Patel M. K.; Patel U. H.; Gandhi S. A.; Barot V. M.; Jayswal J. Solvent Effect on Neutral Co (II) Complexes of Paeonol Derivative −Qualitative and Quantitative Studies from Energy Frame Work and Hirshfeld Surface Analysis. J. Mol. Struct. 2019, 1196, 119–131. 10.1016/j.molstruc.2019.06.050. [DOI] [Google Scholar]
- Novikov A. P.; Volkov M. A.; Safonov A. V.; Grigoriev M. S. Synthesis, Crystal Structure, and Hirshfeld Surface Analysis of Hexachloroplatinate and Tetraclorouranylate of 3-Carboxypyridinium—Halogen Bonds and π-Interactions vs. Hydrogen Bonds. Crystals 2022, 12, 271. 10.3390/cryst12020271. [DOI] [Google Scholar]
- Pandya J. H.; Travadi M.; Jadeja R. N.; Patel R. N.; Gupta V. K. Synthesis, Crystal Feature and Spectral Characterization of Paeonol Derived Schiff Base Ligands and Their Cu(II) Complexes with Antimicrobial Activity. J. Indian Chem. Soc. 2022, 99, 100403 10.1016/j.jics.2022.100403. [DOI] [Google Scholar]
- Mizuguchi K.; Park Y. Y.; Tomiyasu H.; Ikeda Y. Electrochemical and Spectroelectrochemical Studies on Uranyl Carbonato and Aqua Complexes. J. Nucl. Sci. Technol. 1993, 30, 542–548. 10.1080/18811248.1993.9734516. [DOI] [Google Scholar]
Associated Data
This section collects any data citations, data availability statements, or supplementary materials included in this article.


