

Abstract
Despite the role of epidermal growth factor receptor (EGFR) signaling in head and neck squamous cell carcinoma (HNSCC) development and progression, clinical trials involving EGFR tyrosine kinase inhibitors (TKIs) have yielded poor results in HNSCC patients. Mechanisms of acquired resistance to the EGFR TKI erlotinib was investigated by developing erlotinib-resistant HNSCC cell lines and comparing their gene expression profiles with their parental erlotinib-sensitive HNSCC cell lines using microarray analyses and subsequent pathway and network analyses. Erlotinib-resistant HNSCC cells displayed a significant upregulation in immune response and inflammatory pathways compared to parental cells. Interleukin-6 (IL-6) was one of thirteen genes that was significantly differentially expressed in all erlotinib-resistant HNSCC cell lines, which was validated using RT-PCR and ELISA. Blockade of IL-6 signaling using the IL-6 receptor antagonist tocilizumab, was able to overcome erlotinib-resistance in erlotinib-resistant SQ20B tumors in vivo. Overall, erlotinib-resistant HNSCC cells display elevated IL-6 expression levels compared to erlotinib-sensitive HNSCC cells and blockade of the IL-6 signaling pathway may be an effective strategy to overcome resistance to erlotinib and possibly other EGFR TKIs for HNSCC therapy.
Keywords: HNSCC, EGFR, erlotinib, resistance, IL-6, tocilizumab
1. Introduction
Despite the high expression of EGFR in the majority of HNSCC tumors (Bei et al., 2004), EGFR-based chemotherapy has limited results in HNSCC patients (Rexer et al., 2009; Vermorken et al., 2007). Response rates to the EGFR antibody inhibitor cetuximab as a single agent are low (13%) and of limited duration (2-3 months (Vermorken et al., 2007)). Additionally, low response rates (4-11%) have been observed in clinical trials with HNSCC patients treated with EGFR TKIs such as gefitinib and erlotinib (Cohen et al., 2005; Soulieres et al., 2004). Numerous mechanisms have been proposed to be responsible for poor response rates and the development of resistance to EGFR inhibitors which include alternate signaling pathways, mutations, and epithelial-to-mesenchymal transition (EMT). However, targeting these mechanisms have not yet led to improvements in response rates to EGFR inhibitors in clinical trials (Argiris et al., 2013; de Souza et al., 2012; Miller et al., 2012; Ross et al., 2010).
Previous studies in our lab have found that erlotinib induced a time-dependent increase in expression and secretion of IL-6 in HNSCC cells (Fletcher et al., 2013). IL-6 is a cytokine associated with inflammation, innate immune responses and activation of pro-survival pathways (Kamimura et al., 2003). We further demonstrated that IL-6 rescued HNSCC cells from erlotinib-induced cytotoxicity and blockade of IL-6 signaling increased the anti-tumor efficacy of erlotinib in HNSCC cells in vivo (Fletcher et al., 2013). Based on these findings, we proposed that upregulation of IL-6 expression/signaling may be associated with acquired erlotinib-resistance in HNSCC cells.
Here we show and validate that IL-6 expression and secretion is significantly upregulated in erlotinib-resistant HNSCC cells compared to their erlotinib-sensitive parental cell lines by using gene expression profiling, RT-PCR and ELISA. We also show that blockade of IL-6 signaling overcame erlotinib-resistance in a mouse xenograft model of HNSCC suggesting that IL-6 inhibitors may be a promising strategy to overcome acquired resistance to erlotinib and possibly other EGFR inhibitors in HNSCC therapy.
2. Materials and Methods
2.1. Cell lines and cell culture
Three HNSCC cell lines FaDu, Cal-27, and SCC-25 were obtained from the American Type Culture Collection (ATCC, Manassas, VA). SQ20B cells (Weichselbaum et al., 1986) were a gift from Dr. Anjali Gupta (Department of Radiation Oncology, The University of Iowa). All HNSCC cell lines are EGFR positive and are sensitive to EGFR inhibitors. All cell lines were authenticated by the ATCC for viability (before freezing and after thawing), growth, morphology and isoenzymology. Cells were stored according to the supplier's instructions and used over a course of no more than 3 months after resuscitation of frozen aliquots. FaDu, Cal-27, and SQ20B were cultured in Dulbecco's Modified Eagle's Medium (DMEM) containing 4 mM L-glutamine, 1 mM sodium pyruvate, 1.5 g/L sodium bicarbonate and 4.5 g/L glucose with 10% Fetal Bovine Serum (FBS; Hyclone, Logan, UT). SCC-25 cells were cultured in a 1:1 mixture of Dulbecco's modified Eagle's medium and Ham's F12 medium containing 1.2 g/L sodium bicarbonate, 2.5 mM L-glutamine, 15 mM HEPES, 0.5 mM sodium pyruvate, 4.5 g/L glucose, and 400 ng/mL hydrocortisone with 10% FBS. Cell cultures were maintained in a humidified atmosphere at 37° C and 5% CO2.
2.2. Drugs
Erlotinib (Tarceva for in vivo experiments; Cayman chemical, MI, USA for in vitro experiments), and tocilizumab (Actemra/RoActemra) were obtained from the inpatient pharmacy at the University of Iowa Hospitals and Clinics. Human immunoglobulin G (IgG) and dimethyl sulfoxide (DMSO) were used as controls and were obtained from Sigma-Aldrich. Erlotinib was dissolved in DMSO for in vitro experiments or suspended in water for in vivo experiments. IgG and Tocilizumab was diluted in PBS for both in vitro and in vivo experiments. Diluted drugs were added directly to cell culture media in order to achieve the specified drug concentrations.
2.3. Establishment of erlotinib-resistant HNSCC cell lines
The four HNSCC cell lines were cultured in their relevant culture medium supplemented with gradually increasing concentrations of erlotinib, starting at 5 μM. As the cells demonstrated growth advantage (i.e. proliferating) in erlotinib-containing medium, the concentration of the drug was increased by 5 μM until the final concentration of 20 μM was achieved. These cells were then cultured continuously at 20 μM for an additional 2 weeks. Viability of resistant cells was assessed and compared to that of their sensitive counterparts after treating them with varying concentrations of erlotinib to confirm the resistance to erlotinib (Figure 1). All the HNSCC cell lines took between 12-16 weeks to develop resistance to erlotinib.
Figure 1. Validation of erlotinib resistance in HNSCC cells.

Erlotinib-resistant and sensitive FaDu (A), SQ20B (B), Cal-27 (C), and SCC-25 (D) cells were treated with either DMSO or 1, 2.5, 5 and 10 μM erlotinib for 48 hours before assessing cell viability. Values were normalized to respective vehicle controls (con). Bars represent the mean of n=3 experiments. Error bars represent ± standard error of the mean. *p<0.05 versus respective con; ψp<0.0001 versus sensitive.
2.4. Cell viability assay
HNSCC cells were seeded in 96-well plate (2 × 10³ cells/well) and incubated overnight under standard cell culture conditions (i.e. 95% relative humidity, 37° C, and 5% CO2) before treating them with indicated drugs for 48 hours. Cell viability was measured by incubating with Prestoblue™ cell viability reagent (Invitrogen, USA) for 20 minutes at 37° C according to the manufacturer's protocol.
2.5. RNA isolation and gene expression profiling
Total RNA from erlotinib-resistant and sensitive HNSCC cell lines were extracted using the manufacturer's protocol RNeasy mini kit (Qiagen): DNA microarray sample processing. RNA sample preparation for hybridization and the subsequent hybridization to the Illumina beadchips were performed at the University of Iowa DNA Facility using the manufacturer's recommended protocol. Briefly, 100 nanograms total RNA was converted to amplified biotin-cRNA using the Ambion TotalPrep RNA Amplification Kit for Illumina Expression BeadChip (Ambion, Inc., Austin, TX, Cat. #AMIL1791) according to the manufacturer's recommended protocol. 750 ng of this product were mixed with Illumina hybridization buffer, placed onto Illumina HumanHT-12v4 BeadChips (Part No. BD-103-0204), and incubated at 58° C for 17h, with rocking, in an Illumina Hybridization Oven. Following hybridization, the arrays were washed, blocked, then stained with streptavidin-Cy3 (Amersham/GE Healthcare, Piscataway, NJ) according to the Illumina Whole-Genome Gene Expression Direct Hybridization Assay protocol. Beadchips were scanned with the Illumina iScan System (ID #N054) and data were collected using the GenomeStudio software v2011.1 (GEO accession #GSE62061). Downstream pathway, network and process analyses of the resultant gene expression data for all cell lines (n=3 experiments per cell line) was carried out using MetacoreTM (GeneGo) using a threshold of +1.3 and a p-value of 0.05. Enrichment analysis of the resultant gene expression profiles was performed by mapping gene IDs from the resultant dataset onto gene IDs in built-in functional ontologies which include cellular/molecular process networks, disease biomarker networks, canonical pathway maps and metabolic networks.
2.6. Quantitative reverse transcription polymerase chain reaction (q RT-PCR)
HNSCC cells were seeded in 60 mm dishes (2 × 10⁵ cells/dish) and supernatants were collected and saved for secreted protein analysis. Cells were washed twice with PBS before isolating total RNA using RNeasy Plus mini kit (QIAGEN) as per manufacturer's protocol. 500 ng of isolated RNA was then reverse transcribed to cDNA using iScript cDNA synthesis kit (Bio-Rad) and a thermocycler under the following conditions: 5 minutes at 25° C, 30 minutes at 42° C, and 5 minutes at 85° C. The resultant cDNA samples were used to perform quantitative (i.e. real time) PCR analysis in a 96-well optical plate with each well containing 6 μL of cDNA, 7.5 μL of SyBr Green Universal SuperMix (Bio-Rad), and 1.5 μL oligonucleotide primers (forward and reverse; 4 μM) for a total reaction volume of 15 μL) on an ABI PRISM Sequence Detection System (model 7000, Applied Bio systems) with the following protocol: 95°C for 15 seconds (denaturing) and 60°C for 60 seconds (annealing) repeated for 40 cycles. Oligonucleotide primers were obtained from Integrated DNA Technologies (IDT; Coralville, IA) and described in Supplementary Table 1. Relative gene expression was determined by the comparative 2̂ (-ΔΔCT) method. Briefly, cycle threshold (CT) values of IL6 were normalized to that of GAPDH for each sample (in duplicate) and then fold changes were determined by comparing the normalized CT values of erlotinib-sensitive with erlotinib-resistant HNSCC cells. Each assay was performed in triplicate (i.e. on three separate occasions) and the results were presented as mean ± standard error of the mean.
2.7. IL-6 ELISA
Collected supernatants (as mentioned above) were centrifuged at 14,000 × g for 15 min at 4° C to remove cellular debris. Concentrations of secreted IL-6 in the supernatants of indicated experimental conditions were detected using Human Quantikine ELISA kits (R & D Systems, Minneapolis, MN) as per manufacturer's protocol. IL-6 concentrations were normalized to cell number.
2.8. Western blot analysis
Cell lysates were standardized for protein content, resolved on 4% to 12% SDS polyacrylamide gels, and blotted onto nitrocellulose membranes. Membranes were probed with rabbit anti-STAT3, anti-pSTAT3 (Tyr705) and anti-β-actin (Cell Signaling) antibodies. Antibody binding was detected by using an ECL Chemiluminescence Kit (Amersham).
2.9. Tumor cell implantation
Male and female athymic nu/nu mice (4-6 weeks old) were purchased from Harlan Laboratories (Indianapolis, IN). Mice were housed in a pathogen-free barrier room in the Animal Care Facility at the University of Iowa and handled using aseptic procedures. All procedures were approved by the IACUC committee of the University of Iowa and conformed to the guidelines established by the NIH. Mice were allowed at least 3 days to acclimate prior to beginning experimentation, and food and water were made freely available. Tumor cells were inoculated into nude mice by subcutaneous injection of 0.1 mL aliquots of saline containing 1×10⁶ erlotinib-resistant SQ20B cells into the right flank using 26-gauge needles (BD PrecisionGlide™ Needles, BD, New Jersey).
2.10. Tumor measurements
Mice started drug treatment at an average tumor volume of 0.03 cm3. Mice were evaluated daily and tumor measurements taken three times per week using Vernier calipers. Tumor volumes were calculated using the formula for an oblong sphere: volume = (width2 × length), where the length was the longest dimension, and width was the dimension perpendicular to length.
2.11. In vivo drugs administration
Mice were divided into 4 groups (n = 7-8 mice/group). Control group: 100 μL of ultrapure water orally 5 times per week + 100 μL of IgG intraperitoneal injection 3 times per week. Erlotinib group: 100 μL of erlotinib (12.5 mg/kg) administered orally 5 times per week. Tocilizumab group: 100 μL tocilizumab (1 mg/kg) intraperitoneal injection 3 times per week. Erlotinib + tocilizumab group: received erlotinib and tocilizumab as mentioned above. Treatment period was 3 weeks. Mice were euthanized via CO2 gas asphyxiation when tumor diameter exceeded 15 mm in any dimension.
2.12. Statistical analysis
One-way ANOVA with false discovery rate (FDR) multiple test corrections were performed to detect the differentially expressed genes between erlotinib-sensitive and erlotinib-resistant HNSCC cells. Functional analysis such as process, pathway and network analysis of microarray data was carried out using MetaCore™ GeneGo software. Fold change of 2 and FDR p-value was chosen as significance criteria for microarray data analysis. Threshold values of +1.3 and p-value of 0.05 was used as significance criteria for downstream process, pathway and network analyses. Differences between 3 or more means were determined by one-way ANOVA with Tukey post-tests. Two-way ANOVA with Bonferroni post-test was used to determine differences and interactions between (a) cell lines and treatment groups in the in vitro experiments. Linear mixed effects regression models were used to estimate and compare the group-specific change in tumor growth curves. Differences in survival curves were determined by Mantel-Cox test. All significance tests were carried out at 5% level of significance using GraphPad Prism version 5 for windows (GraphPad Software, San Diego, CA).
3. Results
3.1. Validation of erlotinib resistance
Erlotinib resistance in our HNSCC cells was validated by treating both erlotinib-sensitive (ES) and erlotinib-resistant (ER) HNSCC cell lines with increasing doses of erlotinib (i.e. 1 – 10 μM) before measuring cell viability. All 4 ES cell lines showed a dose-dependent decrease in cell viability when treated with erlotinib (Figure 1). Additionally, all 4 ER cell lines showed a significant decrease in sensitivity to 5 and 10 μM erlotinib when compared to their ES counterparts (Figure 1). FaDu and SCC-25 ER cells also exhibited significantly higher cell viabilities as compared with their ES counterparts at 2.5 μM erlotinib (Figure 1A,D) and SQ20B ER cells demonstrated resistance at all doses tested (Figure 1B). The calculated EC50 values for the ES vs ER cell lines were: 2 μM vs 269 μM (SQ20B), 4 μM vs 114 μM (Cal-27), 8 μM vs 73 μM (SCC-25) and 6 μM vs 77692 μM (FaDu) respectively.
3.2. Hierarchical cluster analysis
Hierarchical clustering of gene expression data was performed basing on the list of differentially expressed genes in all the 24 samples (3 replicates/samples per group; total groups = 8 (sensitive = 4 and resistant = 4)) in order to study the global pattern of relative gene expression among all the samples. All the three replicates of each group were closely clustered to each other suggesting that there were no outliers within each group (Supplementary Figure 1). ER FaDu, SQ20B, and Cal-27 groups clustered with their respective ES groups to form 3 different minor clusters (Supplementary Figure 1). These three clusters together (FaDu, SQ20B, and Cal-27) formed a major cluster with ER SCC-25 which in turn clustered with ES SCC-25 (Supplementary Figure 1). Overall, these results show distinct gene expression patterns that distinguish not only resistant samples from those of sensitive samples within each HNSCC cell line but also each cell line from one another (Supplementary Figure 1). The results of principal component analysis (PCA) also showed a good reproducibility (without any outliers) among biological replicates within each group (Supplementary Figure 2). PCA showed not only the relatively close association of each ER HNSCC group with its own ES counterpart, but also clear distinctions among different HNSCC cell lines/groups (Supplementary Figure 2). Therefore the results of the PCA agree with that of hierarchical clustering.
3.3. Enrichment analysis
The majority of pathways significantly upregulated by erlotinib-resistance were related to immune response in FaDu, Cal-27 and SQ20B cell lines (Figure 2). Alternative complement, Antiviral actions of interferons, IFNα/β signaling, IL-1 signaling, HSP60 and HSP70/TLR signaling, and lectin-induced complement pathways were upregulated in ER FaDu cells (Figure 2A), HSP60 and HSP70/TLR signaling, Alternative complement, IL-17 signaling, IL-10 signaling, Oncostatin M signaling, MIF signaling, TLR2/TLR4 signaling and CD40 signaling pathways were upregulated in ER Cal-27 cells (Figure 2B), and Alternative complement, Classical complement, Lectin-induced complement, IL-17 and IL-10 signaling pathways were upregulated in SQ20B cells (Figure 2C). Only 3 of the 10 upregulated pathways were related to immune response in ER SCC-25 cells which were Antiviral actions of interferons, IFNα/β signaling and IL-1 signaling (Figure 2D). The other pathways affected by erlotinib resistance included ‘cell cycle regulation’, PFR, FAS and epithelial-to-mesenchymal transition (Figure 2). Process analyses revealed a similar pattern in ER HNSCC cell lines as observed in the pathway analyses (Figure 3) in which the majority of the upregulated processes were related to pro-inflammatory immune response pathways in ER FaDu, Cal-27 and SQ20B cells (Figure 3A-C). These pathways included complement, interferon, IL-10 and JAK-STAT signaling (Figure 3A-C). Again, SCC-25 was an outlier, where only 1 of the 10 was related to inflammation, which was described as interferon signaling (Figure 3D). Altogether, the pathway and process analyses suggest that immune response pathways (especially pro-inflammatory immune response pathways) may be associated with erlotinib-resistance.
Figure 2. Pathway analyses of erlotinib-resistant HNSCC cells.
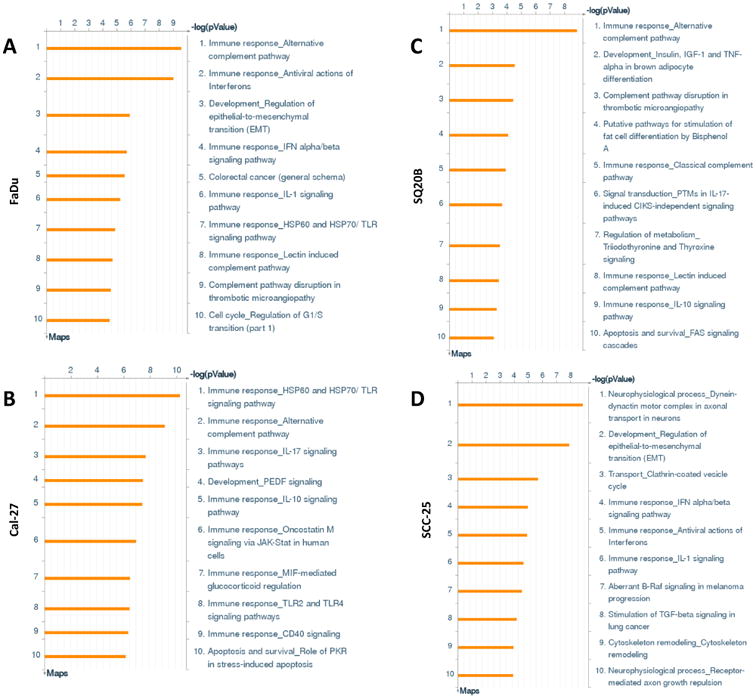
Shown are the top ten upregulated pathways from differentially regulated transcripts comparing microarray data from erlotinib-resistant FaDu, Cal-27, SCC-25 and SQ20B HNSCC cells versus their respective erlotinib-sensitive cells.
Figure 3. Process networks of erlotinib-resistant HNSCC cells.
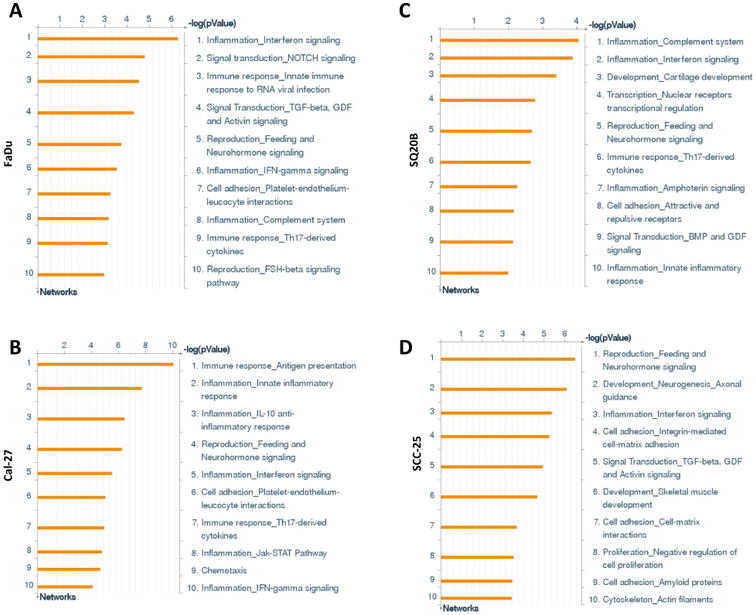
Shown are the top ten upregulated cellular/molecular processes from differentially regulated transcripts comparing microarray data from erlotinib-resistant FaDu, Cal-27, SCC-25 and SQ20B HNSCC cells versus their respective erlotinib-sensitive cells.
3.4. Network analysis
The top three networks were identified for each ER HNSCC cell line compared to its ES counterpart using the GeneGo tool (Table 1) that identified functional relationships between gene products based on known interactions in the scientific literature. All of the ER vs ES cell line comparisons identified a pro-inflammatory network in the top 3 networks identified (Table 1). The TRAF6, NF-kB, IKK-gamma, RIPK1, TAK1(MAP3K7) network was identified in both ER FaDu and SQ20B cells (p = 8.9e-28; zScore = 11.51, Figure 4A,C, Table 1). The processes in this network were regulation of I-kappaB kinase/NF-kappaB signaling, toll-like receptor 4 signaling pathway, toll-like receptor signaling pathway, positive regulation of I-kappaB kinase/NF-kappaB signaling, and positive regulation of NF-kappaB transcription factor activity (Figure 4A,C, Table 1). The NF-kB, TLR4, I-kB, IL-1 beta, TIRAP (Mal) network was identified in ER Cal-27 cells with processes identified as MyD88-dependent toll-like receptor signaling pathway, toll-like receptor signaling pathway, positive regulation of defense response, toll-like receptor TLR6:TLR2 signaling pathway, and toll-like receptor TLR1:TLR2 signaling pathway (Figure 4B, Table 1). The network for ER SCC-25 cells was ESR1 (nuclear), TPL2(MAP3K8), IL-6, PKC-delta, HMGB1 with processes identified as toll-like receptor TLR6:TLR2 signaling pathway, toll-like receptor TLR1:TLR2 signaling pathway, toll-like receptor 2 signaling pathway, positive regulation of defense response, and positive regulation of response to stimulus (Figure 4D, Table 1). The pro-inflammatory networks for all ER cell lines showed activation of NFkB (which serves as an intramodular hub) resulting in increased pro-inflammatory cytokine production via MyD88-dependent TLR signaling (Figure 4). Taken together, the results of the gene expression data analyses strongly suggest the association of pro-inflammatory pathways with erlotinib-resistance in HNSCC cells.
Table 1. Top three networks identified in erlotinib-resistant HNSCC cell lines.
| Network Rank | ||||
|---|---|---|---|---|
| #1 | #2 | #3 | ||
| FaDu Cal-27 | Network | Beta-catenin, Tcf(Lef), TCF7L2 (TCF4), Lef-1, Axin | CREB1, G-protein alpha-s, CREM (activators), NF-AT1(NFATC2), PKA-reg (cAMP-dependent) | TRAF6, NF-kB, IKK-gamma, RIPK1, TAK1(MAP3K7) |
| GO Processes | canonical Wnt signaling pathway, Wnt signaling pathway, regulation of cell differentiation, regulation of developmental process epithelium development | glucose metabolic process, hexose metabolic process, monosaccharide metabolic process, response to oxygen-containing compound, response to endogenous stimulus | regulation of I-kappaB kinase/NF-kappaB signaling, toll-like receptor 4 signaling pathway, toll-like receptor signaling pathway, positive regulation of I-kappaB kinase/NF-kappaB signaling, positive regulation of NF-kappaB transcription factor activity | |
| p-Value | 1.19E-29 | 1.370E-18 | 8.850E-28 | |
| zScore | 11.62 | 9.46 | 11.51 | |
| gScore | 152.87 | 35.71 | 26.51 | |
| Network | Androgen receptor, WNT, Frizzled, p21, LRP5 | NF-kB, TLR4, I-kB, IL-1 beta, TIRAP (Mal) | SARS2, SEZ6L2, ANTXR2, TCP1-zeta-2, ACSL5 | |
| GO Processes | positive regulation of macromolecule metabolic process, regulation of cell cycle, positive regulation of metabolic process, Wnt signaling pathway, organ development | MyD88-dependent toll-like receptor signaling pathway, toll-like receptor signaling pathway, positive regulation of defense response, toll-like receptor TLR6:TLR2 signaling pathway, toll-like receptor TLR1:TLR2 signaling pathway | G-protein coupled purinergic nucleotide receptor signaling pathway, purinergic nucleotide receptor signaling pathway, G-protein coupled purinergic receptor signaling pathway, purinergic receptor signaling pathway, regulation of inhibitory postsynaptic membrane potential | |
| p-Value | 6.81E-09 | 1.02E-11 | 5.12E-48 | |
| zScore | 9.35 | 11.75 | 32.64 | |
| gScore | 221.85 | 151.75 | 32.64 | |
| SQ20B | Network | Beta-catenin, Tcf(Lef), TCF7L2 (TCF4), Lef-1, Axin | CREB1, G-protein alpha-s, CREM (activators), NF-AT1(NFATC2), PKA-reg (cAMP-dependent) | TRAF6, NF-kB, IKK-gamma, RIPK1, TAK1(MAP3K7) |
| GO Processes | canonical Wnt signaling pathway, Wnt signaling pathway, regulation of cell differentiation, regulation of developmental process, epithelium development | glucose metabolic process, hexose metabolic process, monosaccharide metabolic process, response to oxygen-containing compound, response to endogenous stimulus | regulation of I-kappaB kinase/NF-kappaB signaling, toll-like receptor 4 signaling pathway, toll-like receptor signaling pathway, positive regulation of I-kappaB kinase/NF-kappaB signaling, positive regulation of NF-kappaB transcription factor activity | |
| p-Value | 1.190E-29 | 1.370E-18 | 8.850E-28 | |
| zScore | 11.62 | 9.46 | 11.51 | |
| gScore | 152.87 | 35.71 | 26.51 | |
| SCC-25 | Network | ESR1 (nuclear), TPL2(MAP3K8), IL-6, PKC-delta, HMGB1 | GLCCI1, MBLAC2, NSL1, KPR2, Cathepsin F | IFT52, FLJ32115, SDOS, DGCR2, C1orf74 |
| GO Processes | toll-like receptor TLR6:TLR2 signaling pathway, toll-like receptor TLR1:TLR2 signaling pathway, toll-like receptor 2 signaling pathway, positive regulation of defense response, positive regulation of response to stimulus | succinate metabolic process, glycine decarboxylation via glycine cleavage system, single-organism metabolic process, succinyl-CoA metabolic process, glycine catabolic process | cellular glucuronidation, uronic acid metabolic process, glucuronate metabolic process, flavonoid glucuronidation, flavonoid biosynthetic process | |
| p-Value | 8.33E-05 | 6.83E-37 | 8.97E-36 | |
| zScore | 5.87 | 29.51 | 28.54 | |
| gScore | 649.62 | 29.51 | 28.54 |
Figure 4. Network analyses of erlotinib-resistant HNSCC cells.
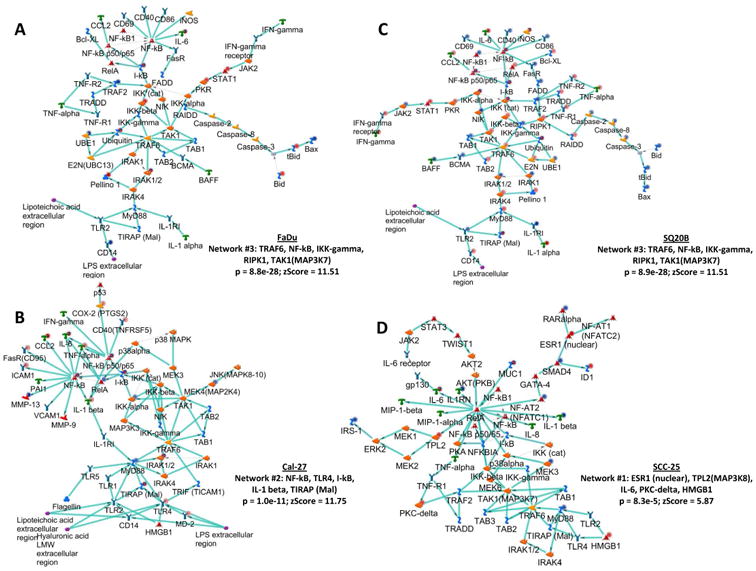
Shown are the top upregulated pro-inflammatory networks from differentially regulated transcripts comparing microarray data from erlotinib-resistant FaDu, Cal-27, SCC-25 and SQ20B HNSCC cells versus their respective erlotinib-sensitive cells. Up regulated genes are marked with red circles; down regulated with blue circles. The ‘checkerboard’ color indicates mixed expression for the gene between cell lines.
3.5. Differential gene expression in erlotinib-resistant vs sensitive HNSCC cell lines
The gene expression analysis identified 827, 2170, 792, and 502 differentially expressed genes in ER FaDu, SQ20B, Cal-27, and SCC-25 cells respectively when compared with their respective ES cell lines (Figure 5). In order to identify a common set of differentially expressed genes in all the 4 cell lines, we generated a venn diagram which showed that 13 genes were significantly differentially expressed in all 4 ER cell lines compared to their ES counterparts. These genes were LCN2, CFB, CYP1B1, MUC1, SASH1, IL-6, TIMP2, H19, ULBP1, SLC1A4, PCK2, FGFBP1 and SFN (Table 2). Gene descriptions and corresponding fold changes in all the 4 ER vs ES HNSCC cells are shown in Table 2. LCN2, CFB, CYP1B1, MUC1, SASH1, IL-6 and TIMP1 were upregulated in all of the 4 ER cell lines vs ES cells (Table 2). The other 6 genes were down regulated in at one or more of the ER cell lines (Table 2). Gene expression for all genes (except MUC1) was successfully validated by RT-PCR (Figure 6). MUC1 expression was undetected. Genes known to be associated with different inflammatory or immune responses such as LCN2, CFB, MUC1, IL6, and TIMP2 were present in this list (Table 2). The expression of IL6 which encodes a pro-inflammatory cytokine interleukin-6 (IL-6), was shown to be upregulated by at least 2-fold in all 4 ER cell lines vs their respective ES counterparts (Table 2). Since IL-6 has been shown previously to be associated with erlotinib-resistance in NSCLC, we further investigated if these findings could be extended to HNSCC cells.
Figure 5. Differentially expressed genes in erlotinib-resistant HNSCC cells.
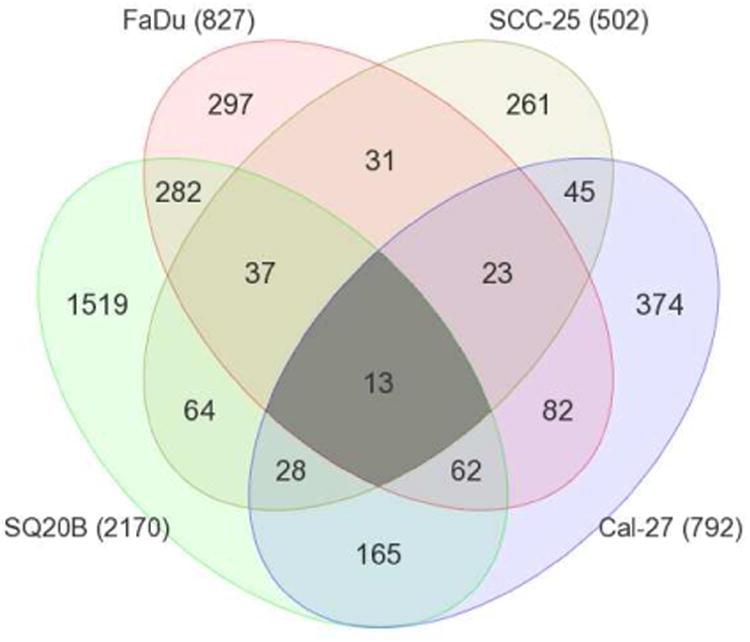
Venn diagram shows the number and overlap of differentially expressed genes in erlotinib-resistant FaDu, SQ20B, Cal-27, and SCC-25 HNSCC cells compared to their parental erlotinib sensitive cells. Numbers in parentheses represent the total number of differentially expressed genes in the indicated erlotinib-resistant HNSCC cells.
Table 2. Differentially expressed genes in erlotinib-resistant HNSCC cells compared to erlotinib-sensitive HNSCC cells.
| Gene symbol | Gene description | Fold Change (ER vs ES)* | |||
|---|---|---|---|---|---|
|
| |||||
| FaDu | SQ20B | Cal-27 | SCC-25 | ||
| LCN2 | Neutrophil gelatinase associated lipocalin | 34.1954 | 4.7502 | 5.27695 | 2.24133 |
| CFB | Complement factor B | 20.7817 | 6.6424 | 7.00509 | 2.07181 |
| CYP1B1 | Cytochrome P4501B1 | 19.0664 | 6.14312 | 3.05695 | 4.98498 |
| MUC1 | Mucin 1 | 6.81529 | 2.09463 | 2.1252 | 3.9803 |
| SASH1 | SAM and SH3 domain containing protein 1 | 6.44004 | 4.81275 | 3.18798 | 2.6359 |
| IL6 | Interleukin 6 | 4.92215 | 6.08678 | 4.82705 | 2.26208 |
| TIMP2 | Tissue inhibitor of metalloproteinase 2 | 3.95348 | 2.95491 | 2.06882 | 2.35323 |
| H19 | Long non-coding RNA | 3.76061 | -3.39578 | -3.1987 | 2.96592 |
| ULBP1 | NKG2Dligand 1 | 2.48632 | 6.95989 | 3.08112 | -2.09594 |
| SLC1A4 | Neutral amino acid transporter A | 2.46418 | 4.21706 | 3.87978 | -2.30851 |
| PCK2 | Phosphoenolpyruvate carboxykinase 2 | 2.21638 | 3.07228 | 4.80155 | -2.2808 |
| FGFBP1 | Fibroblast growth factor binding protein 1 | -2.93184 | -11.636 | -2.32586 | -2.75626 |
| SFN | Stratifin | -3.51717 | -2.51662 | -3.28222 | -2.08091 |
ES: erlotinib-sensitive
ER: erlotinib-resistant
Figure 6. Validation of differentially expressed genes.

Expression of differentially regulated genes in erlotinib-resistant versus erlotinib-sensitive FaDu (A), SQ20B (B), Cal-27 (C), and SCC-25 (D) HNSCC cells were analyzed by quantitative RT-PCR and GAPDH was used as an endogenous control. Dotted horizontal line indicates a fold change of 2.
3.6. Combined inhibition of IL-6 and EGFR signaling to overcome erlotinib resistance
IL-6 protein expression was increased by an average of ∼ 1.86-fold in ER FaDu and SQ20B, 1.75-fold in ER Cal-27, and 23.9-fold in ER SCC-25 cells compared to respective parental cell lines (Figure 7A).In order to examine IL-6 signaling we measured a downstream target of IL-6 signaling such as phosphorylated (pSTAT3) and total STAT3 (STAT3). ER-SQ20B, Cal-27 and SCC-25 cells showed dramatically decreased levels of pSTAT3 and increased levels of STAT3 (Figure 7B). There was no change in FaDu cells (Figure 7B). Given the confirmation of upregulation of IL-6 expression and secretion in ER HNSCC cells, we analyzed if blockade of the IL-6 signaling pathway would overcome erlotinib-resistance in vitro and in vivo. To carry this out, we blocked signaling from the IL-6 receptor (IL-6R) by using tocilizumab (Actemra) which is a humanized monoclonal antibody against IL-6R. Tocilizumab binds to both membrane bound and soluble IL-6R and prevents the binding of IL-6 to its receptor thus blocking IL-6 signaling (Shinriki et al., 2009). The four ER HNSCC cell lines were treated with tocilizumab with or without erlotinib in vitro for 48 hours before cell viability was assessed. We found that tocilizumab was not able to sensitize any of the erlotinib-resistant HNSCC cells to erlotinib in vitro (Figure 7C). However, ER SQ20B xenograft tumors grown in mice treated with 1 mg/mouse tocilizumab i.p. in combination with 12 mg/kg/mouse erlotinib p.o. 5 days a week for 3 weeks demonstrated significantly reduced tumor growth when compared with those treated with erlotinib or tocilizumab alone (Figure 8A-E). No differences were observed in tumor growth rate of males (n=5) vs females (n=5) in the treatment groups over the course of the experiment (Figure 8A-D). Mice treated with tocilizumab in combination with erlotinib had significantly longer median survival times (33 days) as compared with those treated with erlotinib (23 days), tocilizumab (24.5 days) and IgG (21.5 days) (Figure 8F). Altogether, these data suggest that blockade of IL-6 signaling (using tocilizumab) may overcome erlotinib-resistance for the treatment of HSNCC.
Figure 7. Role of IL-6 in erlotinib resistance.
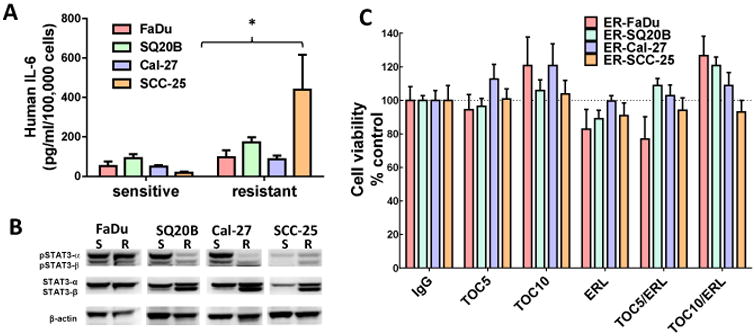
(A) IL-6 protein secretion in cell culture supernatants was analyzed by ELISA and the concentrations were normalized by cell number. (B) Cell lysates were analyzed for phosphorylated STAT3 (pSTAT3α and pSTAT3β) and total STAT3 (STAT3α and STAT3β) expression by western blot. Beta-actin (β-actin) was used as a loading control. (C) Erlotinib-resistant FaDu, SQ20B, Cal-27, and SCC-25 cells were treated with 5 μM or 10 μM tocilizumab (TOC) in the absence and presence of 5 μM erlotinib (ERL) for 48 hours before assessing cell viability. IgG was used as a control. All values were normalized to IgG. Bars represent n=3 experiments. Error bars represent ± standard error of the mean (SEM). *p<0.05 versus respective sensitive control.
Figure 8. Effect of tocilizumab on erlotinib resistance in vivo.

Erlotinib-resistant SQ20B tumor bearing mice (n = 10 per treatment group) were treated as described in the methods section. Tumor volumes were plotted against treatment day. IgG: immunoglobulin G (A), TOC: tocilizumab (B), ERL: erlotinib (C), TOC/ERL: tocilizumab in combination with erlotinib (D). Solid lines and dashed lines represent male (n=5) and female (n=5) mice respectively. Bar graph shows average tumor volumes for each treatment group at treatment day 15 (E). Error bars represent ± standard error of the mean (SEM). *p<0.05. (F) Kaplan-Meier plot of survival data.
4. Discussion
Increased levels of IL-6 have long been associated with tumor progression and poor survival outcomes in various malignancies (Guo et al., 2012). IL-6 engages with IL-6R/gp130 complex to trigger several signal cascades involving activation of janus kinase (JAK) tyrosine kinase family members, that lead to the activation of signal transducers and activators of transcription 3 (Stat3) (Kamimura et al., 2003; Mihara et al., 2012). Activated Stat3 translocates to nucleus to drive the transcription of genes involved in cell survival and proliferation (Kamimura et al., 2003; Mihara et al., 2012).
Previous work in our laboratory has shown that EGFR inhibitors including erlotinib induced IL-6 expression and secretion in HNSCC cells, which played a critical role in reducing the anti-tumor efficacy of erlotinib (Fletcher et al., 2013). We further found that blockade of IL-6 signaling could increase HNSCC cell sensitivity to erlotinib in vivo (Fletcher et al., 2013). These observations led us to the logical hypothesis that IL-6 contributes to erlotinib resistance in HNSCC cells and was thus the focus of these studies.
Microarray analyses of 4 ER HNSCC cell lines and their ES parental cell lines revealed a significant upregulation in immune and inflammatory pathways and processes (Figure 2-3). Although the inflammatory profile was different for each cell line (Figure 2-3), NFkB-mediated proinflammatory cytokine expression via TLR activation appeared to be a common theme among all the ER cell lines according to the network analyses (Figure 4) and these pathways are well known to induce IL-6 expression.
Of the many genes (∼35,000) that were probed in the microarray analysis, remarkably only 13 genes were differentially expressed in all 4 ER HNSCC cell lines (Figure 5, Table 2). LCN2 (NGAL) which was expressed up to 3 - 200-fold more in all ER HNSCC cells compared to ES cells (Figure 6), has been shown in one prior report to be associated with erlotinib-resistance in NSCLC cells (Krysan et al, 2013). IL-6 was also upregulated in all ER HNSCC cell lines and this observation was validated by RT-PCR and ELISA (Figure 7A). Given that a major target of IL-6 signaling is the phosphorylation of STAT3, we determined if pSTAT3 levels were increased in ER HNSCC cells compared to ES cells. Surprisingly we observed the opposite result where pSTAT3 levels were dramatically decreased in ER cells while unphosphorylated STAT3 was increased (Figure 7B). However, these results support prior studies by Yang et al, 2007 showing that sustained IL-6 signaling paradoxically results in an accumulation of unphosphorylated STAT3 and not pSTAT3. Therefore it stands to reason that increased IL-6 expression and sustained IL-6 signaling in our ER HNSCC cell lines should lead to increased unphosphorylated STAT3 expression compared to ES HNSCC cells (Figure 7B).
To determine if IL-6 pathway blockade could overcome erlotinib resistance in vivo, we used an erlotinib resistant SQ20B xenograft model to test the effect of tocilizumab in combination with erlotinib. We chose the SQ20B cell line because of our laboratory's prior success with this cell line (Fletcher et al., 2013) and because of the significant drug resistance at every erlotinib dose tested (Figure 1B). We found that tocilizumab effectively overcame erlotinib resistance demonstrated by a decrease in tumor growth (Figure 8) and an increase in median survival in tocilizumab+erlotinib treated mice compared to the other treatment groups (Figure 8F). Tumor response to tocilizumab as a single agent was quite varied in which 5 tumors did not respond to treatment whereas the other 5 tumors responded remarkably well with tumor growth rates similar to that of the tumors treated with tocilizumab+erlotinib (Figure 8B,D). The reason for this is unclear but we can speculate that the responding tumors may have been more ‘addicted’ to IL-6 signaling and thus highly susceptible to IL-6 blockade. Notably, tocilizumab was unable to overcome erlotinib resistance in vitro but was able to in vivo. This observation raises the question of the role of the tumor microenvironment in tumor responses. Perhaps infiltration of certain immune cells (e.g. tumor associated macrophages) played a role in tumor responses to tocilizumab and/or erlotinib but this remains to be elucidated. Nevertheless, these results in ER HNSCC cells together with our prior data showing the efficacy of this drug combination in ES HNSCC cells indicate tocilizumab and other IL-6 pathway antagonists are promising agents to use in combined modality treatments with EGFR inhibitors.
Our findings support prior observations in lung cancer models that have investigated how IL-6 expression relates to resistance to EGFR inhibitors. A TGFβ/IL-6 axis was identified as a mechanism that conferred resistance to erlotinib in lung cancer cells and administration of a neutralizing IL-6 antibody was able to overcome erlotinib resistance (Yao et al., 2010). Recently, metformin was found to sensitize erlotinib-resistant lung cancer cells by a mechanism believed to be through downregulation of IL-6 (Li et al., 2014). Additionally, activation of Axl, which is a receptor tyrosine kinase, was revealed to be involved in erlotinib-resistance in one HNSCC cell line and increased Axl activation was associated with elevated pro-inflammatory cytokine signaling which included IL-6 (Giles et al., 2013).
Altogether, this work and prior supporting observations highlight the importance of IL-6 and its role in cancer therapy. With regards to HNSCC, increases in IL-6 expression correlate with poor prognosis in HNSCC patients, and patients resistant to chemotherapy have shown significantly higher serum IL-6 levels than those who did respond (Duffy et al., 2008; Heimdal et al., 2008; Riedel et al., 2005). Increased IL-6 expression and secretion may be a viable reason why erlotinib has failed in clinical trials thus far for HNSCC treatment and IL-6 inhibitors should be strongly considered to increase response of erlotinib and perhaps other EGFR inhibitors for the treatment of HNSCC.
Supplementary Material
Supplementary Figure 1. Heat map of differential gene expression. Heat map displays the results of differential gene expression profiles in erlotinib-resistant FaDu, SQ20B, Cal-27, and SCC-25 HNSCC cells versus their respective sensitive cells. Each row represents each sample tested and each column represents a single probe. Higher, lower relative gene expression are represented as red and blue respectively. Grey indicates no change.
Supplementary Figure 2. Principal Component Analysis. Three-dimensional scatter plot displays the results of a principal component analysis of erlotinib-resistant (ER) vs erlotinib-sensitive (ES) FaDu, SQ20B, Cal-27, and SCC-25 HNSCC cells in triplicates.
Highlights.
Inflammatory pathways and processes were upregulated in erlotinib-resistant HNSCC cells.
Networks involving MyD88-dependent TLR signaling were identified in erlotinib-resistant HNSCC cells.
IL-6 expression and secretion was increased in erlotinib-resistant HNSCC cells.
Blockade of IL-6 signaling overcame erlotinib resistance.
Acknowledgments
Authors thank the microarray personnel of the Genomics Division at the Iowa Institute of Human Genetics ([IIHG], University of Iowa) and Dr. Thomas Bair of the Bioinformatics division at IIHG for help with the data analysis. The authors also thank Dr. Allan Shepard for providing the NOX4wt and NOX4dn adenoviral vectors.
Grant Support: This work was supported by National Institutes of Health (NIH) grants K01CA134941 and R01DE024550, and ACS IRG-77-004-34 from the American Cancer Society, administered through the Holden Comprehensive Cancer Center at the University of Iowa.
Abbreviations
- HNSCC
Head and Neck Squamous Cell Carcinoma
- EGFR
Epidermal Growth Factor Receptor
- IL-6
Interleukin-6
- RT-PCR
Reverse Transcription – Polymerase Chain Reaction
- ELISA
Enzyme Linked Immunosorbent Assay
- IL-6R
Interleukin-6 Receptor
- NFkB
nuclear factor kappa-light-chain-enhancer of activated B cells
- MyD88
Myeloid differentiation primary response gene (88)
- AP-1
Activator protein-1
- TLR
Toll-like Receptor
- RAGE
Receptor for Advanced Glycation Endproducts
Footnotes
The authors have no conflict of interest.
Publisher's Disclaimer: This is a PDF file of an unedited manuscript that has been accepted for publication. As a service to our customers we are providing this early version of the manuscript. The manuscript will undergo copyediting, typesetting, and review of the resulting proof before it is published in its final citable form. Please note that during the production process errors may be discovered which could affect the content, and all legal disclaimers that apply to the journal pertain.
Contributor Information
Aditya Stanam, Email: aditya-stanam@uiowa.edu.
Laurie Love-Homan, Email: laurie-love-homan@uiowa.edu.
Tisha S. Joseph, Email: tisha.joseph@lincoln.edu.
Madelyn Espinosa-Cotton, Email: madelyn-espinosa-cotton@uiowa.edu.
References
- Argiris A, Kotsakis AP, Hoang T, Worden FP, Savvides P, Gibson MK, Gyanchandani R, Blumenschein GR, Jr, Chen HX, Grandis JR, Harari PM, Kies MS, Kim S. Cetuximab and bevacizumab: preclinical data and phase II trial in recurrent or metastatic squamous cell carcinoma of the head and neck. Ann Oncol. 2013;24:220–225. doi: 10.1093/annonc/mds245. [DOI] [PMC free article] [PubMed] [Google Scholar]
- Bei R, Budillon A, Masuelli L, Cereda V, Vitolo D, Di Gennaro E, Ripavecchia V, Palumbo C, Ionna F, Losito S, Modesti A, Kraus MH, Muraro R. Frequent overexpression of multiple ErbB receptors by head and neck squamous cell carcinoma contrasts with rare antibody immunity in patients. J Pathol. 2004;204:317–325. doi: 10.1002/path.1642. [DOI] [PubMed] [Google Scholar]
- Cohen EE, Kane MA, List MA, Brockstein BE, Mehrotra B, Huo D, Mauer AM, Pierce C, Dekker A, Vokes EE. Phase II trial of gefitinib 250 mg daily in patients with recurrent and/or metastatic squamous cell carcinoma of the head and neck. Clin Cancer Res. 2005;11:8418–8424. doi: 10.1158/1078-0432.CCR-05-1247. [DOI] [PubMed] [Google Scholar]
- de Souza JA, Davis DW, Zhang Y, Khattri A, Seiwert TY, Aktolga S, Wong SJ, Kozloff MF, Nattam S, Lingen MW, Kunnavakkam R, Stenson KM, Blair EA, Bozeman J, Dancey JE, Vokes EE, Cohen EE. A phase II study of lapatinib in recurrent/metastatic squamous cell carcinoma of the head and neck. Clin Cancer Res. 2012;18:2336–2343. doi: 10.1158/1078-0432.CCR-11-2825. [DOI] [PMC free article] [PubMed] [Google Scholar]
- Duffy SA, Taylor JM, Terrell JE, Islam M, Li Y, Fowler KE, Wolf GT, Teknos TN. Interleukin-6 predicts recurrence and survival among head and neck cancer patients. Cancer. 2008;113:750–757. doi: 10.1002/cncr.23615. [DOI] [PubMed] [Google Scholar]
- Fletcher EV, Love-Homan L, Sobhakumari A, Feddersen CR, Koch AT, Goel A, Simons AL. EGFR inhibition induces proinflammatory cytokines via NOX4 in HNSCC. Mol Cancer Res. 2013;11:1574–1584. doi: 10.1158/1541-7786.MCR-13-0187. [DOI] [PMC free article] [PubMed] [Google Scholar]
- Giles KM, Kalinowski FC, Candy PA, Epis MR, Zhang PM, Redfern AD, Stuart LM, Goodall GJ, Leedman PJ. Axl mediates acquired resistance of head and neck cancer cells to the epidermal growth factor receptor inhibitor erlotinib. Mol Cancer Ther. 2013;12:2541–2558. doi: 10.1158/1535-7163.MCT-13-0170. [DOI] [PubMed] [Google Scholar]
- Guo Y, Xu F, Lu T, Duan Z, Zhang Z. Interleukin-6 signaling pathway in targeted therapy for cancer. Cancer Treat Rev. 2012;38:904–910. doi: 10.1016/j.ctrv.2012.04.007. [DOI] [PubMed] [Google Scholar]
- Heimdal JH, Kross K, Klementsen B, Olofsson J, Aarstad HJ. Stimulated monocyte IL-6 secretion predicts survival of patients with head and neck squamous cell carcinoma. BMC Cancer. 2008;8:34. doi: 10.1186/1471-2407-8-34. [DOI] [PMC free article] [PubMed] [Google Scholar]
- Kamimura D, Ishihara K, Hirano T. IL-6 signal transduction and its physiological roles: the signal orchestration model. Rev Physiol Biochem Pharmacol. 2003;149:1–38. doi: 10.1007/s10254-003-0012-2. [DOI] [PubMed] [Google Scholar]
- Krysan K, Cui X, Gardner BK, Reckamp KL, Wang X, Hong L, Walser TC, Rodriguez NL, Pagano PC, Garon EB, Brothers JF, ll, Elashoff D, Lee JM, Spira AE, Sharma S, Fishbein MC, Dubinett SM. Elevated neutrophil gelatinase-associated lipocalin contributes to erlotinib resistance in non-small cell lung cancer. American Journal of Translational Research. 2013;5:481–96. [PMC free article] [PubMed] [Google Scholar]
- Li L, Han R, Xiao H, Lin C, Wang Y, Liu H, Li K, Chen H, Sun F, Yang Z, Jiang J, He Y. Metformin sensitizes EGFR-TKI-resistant human lung cancer cells in vitro and in vivo through inhibition of IL-6 signaling and EMT reversal. Clin Cancer Res. 2014;20:2714–2726. doi: 10.1158/1078-0432.CCR-13-2613. [DOI] [PubMed] [Google Scholar]
- Mihara M, Hashizume M, Yoshida H, Suzuki M, Shiina M. IL-6/IL-6 receptor system and its role in physiological and pathological conditions. Clin Sci (Lond) 2012;122:143–159. doi: 10.1042/CS20110340. [DOI] [PubMed] [Google Scholar]
- Miller VA, Hirsh V, Cadranel J, Chen YM, Park K, Kim SW, Zhou C, Su WC, Wang M, Sun Y, Heo DS, Crino L, Tan EH, Chao TY, Shahidi M, Cong XJ, Lorence RM, Yang JC. Afatinib versus placebo for patients with advanced, metastatic non-small-cell lung cancer after failure of erlotinib, gefitinib, or both, and one or two lines of chemotherapy (LUX-Lung 1): a phase 2b/3 randomised trial. Lancet Oncol. 2012;13:528–538. doi: 10.1016/S1470-2045(12)70087-6. [DOI] [PubMed] [Google Scholar]
- Rexer BN, Engelman JA, Arteaga CL. Overcoming resistance to tyrosine kinase inhibitors: lessons learned from cancer cells treated with EGFR antagonists. Cell Cycle. 2009;8:18–22. doi: 10.4161/cc.8.1.7324. [DOI] [PMC free article] [PubMed] [Google Scholar]
- Riedel F, Zaiss I, Herzog D, Gotte K, Naim R, Hormann K. Serum levels of interleukin-6 in patients with primary head and neck squamous cell carcinoma. Anticancer Res. 2005;25:2761–2765. [PubMed] [Google Scholar]
- Ross HJ, Blumenschein GR, Jr, Aisner J, Damjanov N, Dowlati A, Garst J, Rigas JR, Smylie M, Hassani H, Allen KE, Leopold L, Zaks TZ, Shepherd FA. Randomized phase II multicenter trial of two schedules of lapatinib as first- or second-line monotherapy in patients with advanced or metastatic non-small cell lung cancer. Clin Cancer Res. 2010;16:1938–1949. doi: 10.1158/1078-0432.CCR-08-3328. [DOI] [PubMed] [Google Scholar]
- Shinriki S, Jono H, Ota K, Ueda M, Kudo M, Ota T, Oike Y, Endo M, Ibusuki M, Hiraki A, Nakayama H, Yoshitake Y, Shinohara M, Ando Y. Humanized anti-interleukin-6 receptor antibody suppresses tumor angiogenesis and in vivo growth of human oral squamous cell carcinoma. Clin Cancer Res. 2009;15:5426–5434. doi: 10.1158/1078-0432.CCR-09-0287. [DOI] [PubMed] [Google Scholar]
- Soulieres D, Senzer NN, Vokes EE, Hidalgo M, Agarwala SS, Siu LL. Multicenter phase II study of erlotinib, an oral epidermal growth factor receptor tyrosine kinase inhibitor, in patients with recurrent or metastatic squamous cell cancer of the head and neck. J Clin Oncol. 2004;22:77–85. doi: 10.1200/JCO.2004.06.075. [DOI] [PubMed] [Google Scholar]
- Vermorken JB, Trigo J, Hitt R, Koralewski P, Diaz-Rubio E, Rolland F, Knecht R, Amellal N, Schueler A, Baselga J. Open-label, uncontrolled, multicenter phase II study to evaluate the efficacy and toxicity of cetuximab as a single agent in patients with recurrent and/or metastatic squamous cell carcinoma of the head and neck who failed to respond to platinum-based therapy. J Clin Oncol. 2007;25:2171–2177. doi: 10.1200/JCO.2006.06.7447. [DOI] [PubMed] [Google Scholar]
- Weichselbaum RR, Dahlberg W, Beckett M, Karrison T, Miller D, Clark J, Ervin TJ. Radiation-resistant and repair-proficient human tumor cells may be associated with radiotherapy failure in head- and neck-cancer patients. Proc Natl Acad Sci U S A. 1986;83:2684–2688. doi: 10.1073/pnas.83.8.2684. [DOI] [PMC free article] [PubMed] [Google Scholar]
- Yang J, Liao X, Agarwal MK, Barnes L, Auron PE, Stark GR. Unphosphorylated STAT3 accumulates in response to IL-6 and activates transcription by binding to NFκB. Genes and Development. 2007;21:1396–1408. doi: 10.1101/gad.1553707. [DOI] [PMC free article] [PubMed] [Google Scholar]
- Yao Z, Fenoglio S, Gao DC, Camiolo M, Stiles B, Lindsted T, Schlederer M, Johns C, Altorki N, Mittal V, Kenner L, Sordella R. TGF-beta IL-6 axis mediates selective and adaptive mechanisms of resistance to molecular targeted therapy in lung cancer. Proc Natl Acad Sci U S A. 2010;107:15535–15540. doi: 10.1073/pnas.1009472107. [DOI] [PMC free article] [PubMed] [Google Scholar]
Associated Data
This section collects any data citations, data availability statements, or supplementary materials included in this article.
Supplementary Materials
Supplementary Figure 1. Heat map of differential gene expression. Heat map displays the results of differential gene expression profiles in erlotinib-resistant FaDu, SQ20B, Cal-27, and SCC-25 HNSCC cells versus their respective sensitive cells. Each row represents each sample tested and each column represents a single probe. Higher, lower relative gene expression are represented as red and blue respectively. Grey indicates no change.
Supplementary Figure 2. Principal Component Analysis. Three-dimensional scatter plot displays the results of a principal component analysis of erlotinib-resistant (ER) vs erlotinib-sensitive (ES) FaDu, SQ20B, Cal-27, and SCC-25 HNSCC cells in triplicates.