Abstract
Follicular lymphoma (FL) course is highly variable, making its clinical management challenging. In this incurable and recurring pathology, the interval between relapses tends to decrease while aggressiveness increases, sometimes resulting in the transformation to higher‐grade lymphoma. These evolutions are particularly difficult to anticipate, resulting from complex clonal evolutions where multiple subclones compete and thrive due to their capacity to proliferate and resist therapies. Here, to apprehend further these processes, we used a high‐throughput RNA sequencing approach to address simultaneously the B‐cell immunoglobulin repertoires and T‐cell immunoglobulin repertoires repertoires of lymphoma cells and their lymphoid microenvironment in a large cohort of 131 FL1/2‐3A patients. Our data confirm the existence of a high degree of intra‐clonal heterogeneity in this pathology, resulting from ongoing somatic hyper‐mutation and class switch recombination. Through the evaluation of the Simpson ecological‐diversity index, we show that the contribution of the cancerous cells increases during the course of the disease to the detriment of the reactive compartment, a phenomenon accompanied by a concomitant decrease in the diversity of the tumoral population. Clonal evolution in FL thus contrasts with many tumors, where clonal heterogeneity steadily increases over time and participates in treatment evasion. In this pathology, the selection of lymphoma subclones with proliferative advantages progressively outweighs clonal diversification, ultimately leading in extreme cases to transformation to high‐grade lymphoma resulting from the rapid emergence of homogeneous subpopulations.
INTRODUCTION
Follicular lymphoma (FL) is the most common indolent non‐Hodgkin lymphoma (NHL), representing 20%–25% of all diagnoses. 1 This neoplasm often responds to immuno‐chemotherapy regimens but its clinical course is highly heterogeneous. While most FLs are indolent at presentation, approximately 50% of patients undergo recurrent relapses and many eventually develop resistance to therapies. 2 Some high‐risk patients also experience early progression or transformation to high‐grade lymphoma, two events associated with a particularly poor outcome. 2 Unfortunately, if different risk stratification scores have been proposed, none is used in the clinics to anticipate these evolutions and to adapt clinical management. 3 , 4 , 5 , 6
Many observations suggest that the clinical heterogeneity of FL results from the complexity of its clonal evolution dynamic. 7 , 8 , 9 , 10 , 11 In this disease, the earliest step of pathogenesis typically consists in the acquisition of a t(14;18)(q32;q21) translocation which places the transcription of the anti‐apoptotic BCL2 oncogene under the control of the regulatory regions of the IGH@ locus. 12 This translocation occurs at a very early stage of B‐cell differentiation, due to errors of the V(D)J recombination process during the pro to pre‐B transition. 13 However, it is not sufficient for overt FL development, this genetic abnormality being also present in rare B‐cells in the blood of healthy adults. 14 Additional oncogenic abnormalities are thus needed for overt FL development, many of which would occur after repeated cycles of AID‐mediated mutagenesis during iterative recruitment, probably over years or even decades, of t(14;18) positive B‐cells within the germinal centers (GCs) of secondary lymphoid organs. 1 , 15 , 16 , 17
Importantly, many concordant studies have shown that FL relapses often do not develop from the dominant populations of tumoral cells detected in biopsies at diagnosis, but instead from an elusive pool of prelymphoma cells that would be committed to transformation (CPCs). 7 , 8 , 9 , 10 , 11 Furthermore, recent studies have revealed an unanticipated degree of sites‐to‐sites subclonal heterogeneity, 18 , 19 pointing to a clonal diversification dynamic that may participate in treatment failures. However, our understanding of the evolution of the lymphoma cells within the context of their tumoral microenvironment is still limited.
Here, to address further this question, we used a combination of high‐throughput RNA sequencing targeting simultaneously the B‐ and T‐cells immunoglobulin (Ig) repertoires (BCR and TCR), gene expression profiling, and genomic DNA sequencing. By integrating our data from an ecological point of view, we show that the ratio between the tumoral and the reactive B‐ and T‐cell compartments tends to increase over time. Interestingly, our data also reveal that the clonal populations of FL cells tend to become more homogeneous at progressions, contrasting with many tumors that follow divergent clonal evolution pathways driven by a high degree of genetic instability. 20
MATERIALS AND METHODS
Patients
A total of 217 biopsies, obtained from 190 individuals (181 patients with NHLs and nine healthy individuals with reactive lymph node hyperplasia) were analyzed in this study (Figure S1 and Table S1). One hundred and fifty‐seven biopsies were obtained from 131 FL1‐2 to FL3A patients, and 51 from 50 patients diagnosed with a different NHL (four FL3B, three composite FL3B/DLBCL, 31 DLBCLs, six lymphocytic lymphomas, and six mantle cell lymphomas [MCL]). All diagnoses were established by expert pathologists from the Lymphopath network according to the 2016 World Health Organization criteria. When available, hematoxylin/eosin slides and their corresponding CD20 and CD5 immunochemistry staining were reviewed to evaluate the percentage of tumor infiltration, defined as the extent of the tumoral area, excluding residual normal reactive GCs, necrotic zones, and surrounding normal tissues. Written consents were obtained from all patients and the study was authorized by our institutional review board (IRB, Centre Henri Becquerel, No. 2005B).
Nucleic acid extractions
Total RNA samples were extracted from FFPE biopsies using the Maxwell 16 system (Promega) or, when available, from frozen tissues using the RNA NOW kit (Biogentex) according to manufacturer's instructions, and stored in nuclease‐free water at −80°C. Genomic DNA samples were extracted from FFPE biopsies using the QIAamp DNA FFPE Tissue Kit (Qiagen) according to the manufacturer's instructions or, when available, from frozen tissues following a standard extraction procedure using proteinase K followed by salt and ethanol precipitation and stored at −20°C in 10 mM Tris‐Cl and 1 mM EDTA (pH 8) buffer.
High‐throughput BCR and TCR RNA sequencing
Sequencing libraries for RNA sequencing were prepared using a Template Switching 5′ RACE Protocol kit (New England Biolabs). Total RNA (0.5–1 µg) was used as the template. The sequence of the nucleotide primers is provided in Table S2. Thirteen primers were used at the reverse transcription/template‐switching step. The second step consisted of a multiplex PCR amplification (eight cycles), using TSO and Nested primers with additional tails. P5, P7, and index sequences were incorporated during the second PCR amplification step (30 cycles). Single‐end 300 bp read sequencing was performed on a MiSeq or NexSeq. 550Dx system using Illumina V2 chemistry.
Gene expression and genomic mutation analysis
The levels of expression of T‐cell markers were evaluated using a method that combines RT‐MLPA and high‐throughput sequencing as previously described. 21 DNA variant analysis was performed as previously described, using a targeted next‐generation sequencing panel (genes listed in Table S3). 22 , 23 , 24
Bioinformatics and statistical analysis
B‐ and T‐cell rearrangements were investigated using the IgBlast 1.15.0 alignment tool. 25 Correlations between histological subtypes and diagnosis and relapses were evaluated using two‐sided and one‐sided Wilcoxon rank‐sum tests with the python SciPy 1.7.1 library. Levenstein distances were calculated using the python‐Levensthtein 0.16.0 library. All graphs were generated using the Python Matplotlib 3.4.3 and Seaborn 0.11.2 libraries.
Data sharing statement
The sequencing data are publicly available on the NCBI website under the reference PRJNA1065388.
RESULTS
Analysis of the global Ig/TCR repertoire in FL biopsies by RNA sequencing
To address the B‐ and T‐cell repertoires of FL cells and their lymphoid microenvironment, we analyzed 217 biopsies obtained from 181 lymphoma patients and nine healthy individuals by high‐throughput RNA sequencing targeting the variable regions of the B‐ and T‐cell receptor genes (BCR and TCR). As indicated in Table S1 (column Pathology) and Figure S1, a majority of samples corresponded to FLs grade 1–2 to 3A at diagnosis. Other biopsies were obtained at relapses and others, including high‐grade B‐cell lymphomas, MCL, small lymphocytic lymphoma (SLL), and reactive lymph nodes, were included as controls. At least 1.500 on‐target sequencing reads aligning on the different genes of the BCR and TCR were generated for each biopsy, with an average of 106.955 reads (min = 1.759, max = 920.968) (Table S1, OT_Reads column). On average, 58.001 reads (min = 1.046, max = 496.626) corresponding to VDJ or VJ rearrangements and coding in frame CDR3 amino‐acids sequences were identified using the IgBlast alignment tool (Table S1, IgBlast_Reads column). The distributions of these sequences, expressed from the heavy chains genes of the IGH locus, from the IGκ and IGλ loci, or the four TCR loci are specified in Table S1 (BCR_Seq_(Global)_%, IgH_Seq_(Global)_%, IgL_Seq_(Global)_%, and TCR_Seq_(Global)_% columns) and clonotype frequencies for each sample are presented in Figure S2. Representative results are also presented as donut charts in Figure 1A–C.
Figure 1.
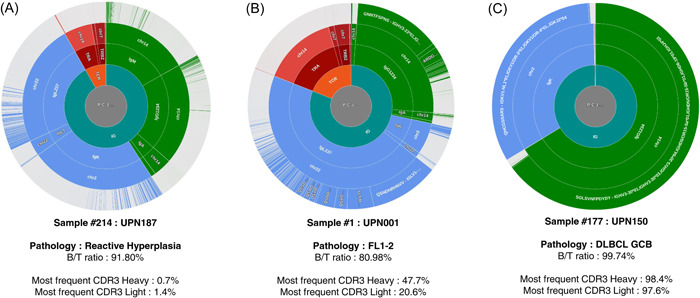
Immunoglobulin and T‐cell immunoglobulin repertoires (TCR) repertoire in representative samples. Immunoglobulin (Ig) and TCR sequences are clustered according to the amino acid sequences of the CDR3s. From the inside to the outside are indicated: the B‐cell immunoglobulin repertoires (BCR) or TCR origins (green: BCR, red: TCR), the genetic origins (green: Ig heavy chains, blue: Ig light chains, red: TCR), the chromosomal origins, and the clusters of identical CDR3 sequences. The three presented samples correspond to (A) polyclonal follicular hyperplasia, (B) follicular lymphoma, and (C) diffuse large B cell lymphoma. The ratio of B/T sequences and the percentage of sequences corresponding to the dominant CDR3s are indicated. All other samples are provided in Figure S2.
Main characteristics of the tumoral IgH and IgL rearrangements
To address the subclonal heterogeneity of FL cells, we restricted our analysis to the tumoral compartment. To define a clonality threshold, nine reactive hyperplasia were first analyzed (Table S1, UPN182–190). As expected, in the absence of any tumoral populations, the sequencing reads coding the most frequent CDR3 from the heavy (IgH) and light (IgL) BCR chains represented only a small minority of the data (mean = 1.82% and 2.12%, respectively, Figure 2A,B and Table S1, IgH_CDR3[aa]_% and IgL_CDR3[aa]_% columns). Based on these percentages, we defined a cut‐off value that corresponds to the upper outlier of the distribution of these frequencies (q75 + 1.5IQR = 6.04%). By applying this threshold to the tumoral samples, we identified a significant pool of sequences coding identical productive CDR3 motifs in a large majority of FL biopsies (146/150 and 137/150 FL1‐2 to FL3A, for the IgH and IgL chains, respectively) as well as in a large majority of DLBCL, MCL, and SLL samples. As expected, somatic mutations on the V segments of the heavy and light chain rearrangements were present in a large majority of cases, in agreement with the post‐GC origin of these tumors (Figure 3B). The main characteristics of these rearrangements, including the amino acid sequences of the dominant CDR3 motives, the identities of the V, D, and J segments, and the V mutation status are detailed in Figure 3 and in Table S1 (IgH_CDR3[aa]_Seq to IgL_CDR3_J columns).
Figure 2.
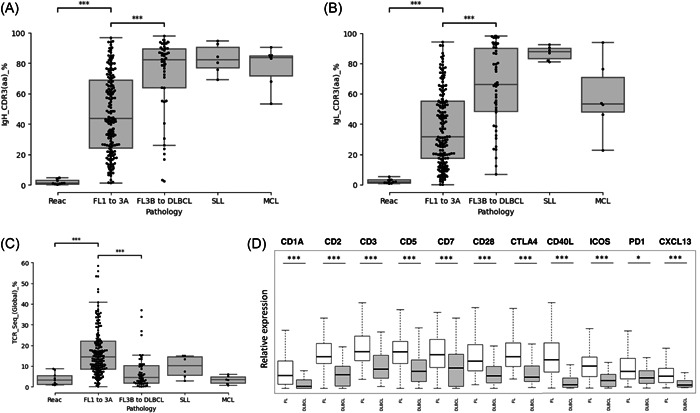
Tumoral infiltration in B‐cell lymphoma biopsy at diagnosis and contribution of the T‐cell microenvironment. Contributions of the dominant CDR3 sequences in amino acids for immunoglobulin (Ig) heavy (A) and the light (B) chains of the B‐cell immunoglobulin repertoires (BCR) in reactive follicular hyperplasia, FL1‐2 to 3A, FL3B to DLBCL, small lymphocytic lymphoma (SLL), and mantle cells lymphomas (MCL) samples. (C) Contribution of sequencing reads coding productive T‐cell immunoglobulin repertoires (TCR) rearrangements in reactive follicular hyperplasia, FL1‐2 to 3A, FL3B to DLBCL, SLL, and MCL samples. (D) Expression of T and T follicular helper markers in follicular lymphoma and in diffuse large B‐cell lymphoma. *p < 0.05 and ***p < 10−3 (Wilcoxon test).
Figure 3.
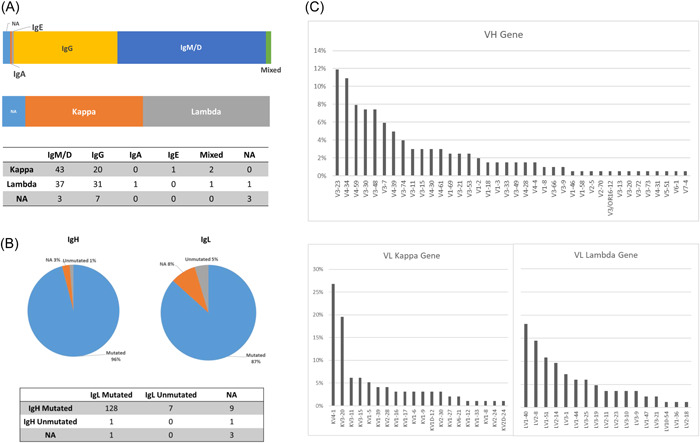
Characteristics of the heavy and light chains of the B‐cell immunoglobulin repertoires (BCR) in follicular lymphoma (FL). (A) Distributions of the isotypes of the BCR heavy and light chains in FL. (B) IgHV and IgLV mutational status according to the closest germline in FLs (cutoff value: 98%). (C) IgVH and IgVL segment usage in FLs.
Class switch recombination (CSR) participates significantly in clonal diversification in FL
Contrasting with the clonality testing methods that use genomic DNA as a template, RNA‐Seq also informs on the isotype of the heavy chain of the BCR. In the 146 FL biopsies that express a productive Ig heavy chain, 56.8% expressed a majority (>90%) of IgM/D sequences (83 cases), 39.7% expressed a majority of IgG sequences (58 cases), one (#81) expressed a majority of IgA sequences, and one (#148) expressed a majority of IgE sequences (Figure 3A). By comparison, all MCLs (6/6) expressed exclusively IgM and IgD chains, while higher‐grade lymphoma and SLLs expressed various isotypes (Table S1). The last three FLs co‐expressed different isotypes in variable proportions. One (Sample #66) expressed a majority of IgG sequences (84.8%) together with IgA sequences (14.7%), one (Sample #140) expressed a majority of IgA sequences (72.4%) together with IgG sequences (26.3%), and one (Sample #5) expressed a majority of IgG sequences (66.8%) together with IgM/D sequences (33.1%). For this patient (UPN003), we could analyze a second biopsy at relapse, eight years after diagnosis (Sample #6). At this point of time, no histological transformation was reported and the two biopsies shared identical IgH‐ and IgL‐dominant CDR3 sequences, confirming their clonal origin. However, the second tumor expressed almost exclusively IgM and IgD sequences, unambiguously demonstrating that the dominant population at relapse had not evolved from the dominant IgG subclone present at diagnosis. Interestingly, in two‐thirds of IgM/D positive cases (56/83; 67.5%), we also detected few sequencing reads coding the dominant CDR3 with secondary isotypes (IgG, IgA, or IgE), suggesting the persistence of an ongoing CSR process in these tumors (Table S1, IgH_CDR3_IgM_% to IgH_CDR3_IgE_% columns). More unexpectedly, we also detected few IgM and IgD reads in IgG and IgA positive cases (19/59; 32.2%), suggesting the persistence of earlier precursors. Together, these observations confirm that, besides SHM, CSR participates significantly in clonal diversification in FLs.
Identification of two pre and post‐GC populations of reactive B‐cells, and an important contingent of reactive T‐cells in FL biopsies
We next focused on the Ig and TCR repertoire of the reactive microenvironment. While the median degree of tumoral infiltration is not statistically different in FL and higher‐grade lymphomas in our cohort (Figure S3A), the percentages of sequencing reads corresponding to the dominant IgH and IgL CDR3s are significantly lower in FLs (Figure 2A,B), indicating the presence of larger contingents of reactive B‐cells (means = 52.1% vs. 76.4% for the IgH chains; p < 10−3, and 40.7% vs. 67.0% for the IgL chains; p < 10−3). This observation is consistent with the hypothesis that nonmalignant immune‐related cells of different origins, including reactive B‐cells, most often persist within FL neoplastic follicles, contributing to the tumoral microenvironment. To address the characteristics of these sequences, we considered the distributions of the CDR3 lengths, the genomic origins (μ, δ, α, γ, or ε for the Heavy chain, and κ vs. λ for the light chain), and the percentages of homology relative to the closest IgV germline sequences (Figure 4B,D, representative sample). To very few exceptions, the lengths of the CDR3 sequences that did not correspond to the lymphoma clone were highly variable, confirming the absence of clonality. In approximately two‐thirds of FL cases (91/150), a majority of these sequences corresponded to secondary isotypes (IgG > IgA > IgE) (Table S1, IgH_Reac_%MD and IgH_Reac_%GAE columns). A majority also harbored somatic mutations (Figure 4C,E, representative sample), indicating a post‐GC origin. In some cases (for example samples #12, #23, #29, or #41), we could also detect a very significant pool of polyclonal un‐mutated IgM sequences, suggesting the existence of a population of reactive pre‐GC naïve B‐cells in these tumors (Table S1, IgH).
Figure 4.
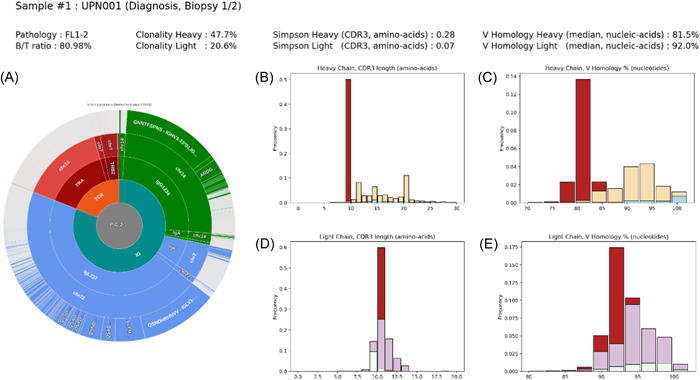
Immunoglobulin repertoires of follicular lymphoma (FL) and reactive B‐cells. (A) Clustering of Ig and T‐cell immunoglobulin repertoires (TCR) CDR3 sequences in a representative FL sample (UPN001). (B, D) Distribution of the lengths of the immunoglobulin heavy (IgH) (B) and immunoglobulin light (IgL) (D) CDR3 sequences. (C, E) Distributions of the percentages of homology of the IgHV and igLV sequences to their closest germlines. Red: dominant CDR3 sequences. Yellow: IgG/A and E reactive sequences. Blue: IgM reactive sequences. Purple: reactive Kappa light chain sequences. White: reactive Lambda light chain sequences.
As shown in Figure 2C, the percentage of sequences coding in frame TCR rearrangements was higher in FL biopsies than in higher‐grade B‐cell lymphoma, in agreement with the expected higher degree of T‐cell infiltration in these tumors (mean = 17.1% vs. 7.5%; p < 10−3). 26 To address further this observation, we evaluated the expression of T‐cell markers by mRNA expression profiling starting from the same RNA samples. As shown in Figure 2D, the CD1A, CD2, CD3, CD5, CD7, CD28, and CTLA4 genes, together with CXCL13, ICOS, CD40L, and PD1 markers were all over‐expressed, in agreement with the dependency of FL cells toward infiltrating T follicular helper cells for survival. 1 , 27 , 28 , 29
Clonal heterogeneity is higher in FLs than in higher‐grade NHLs
To evaluate the heterogeneity of the tumoral and the reactive compartments, we next used Simpson's entropy index, which allows a quantitative evaluation of the diversity of ecological populations. 30 , 31 This index fluctuates based on the quantities and proportional abundances of distinct types within a data set, specifically referring here to the various CDR3 sequences. A wholly polyclonal (diverse) population, characterized by distinct CDR3 sequences, would yield a Simpson index close to 0. Conversely, a fully clonal (uniform) population, where all CDR3 sequences are identical, would result in a Simpson index approaching 1.
First, to assess the modifications of the DNA that result from ongoing SHM, which does not necessarily translate into modifications of the amino acid residues, we considered the nucleic acid sequences of the CDR3 motifs. All sequencing reads coding related CDR3 sequences were considered as issued from the tumoral population (identical length and sequence similarity, evaluated using the Levenshtein distance, superior to 80%). We observed that the global Simpson indexes, calculated independently for the IgH and IgL chains by considering all tumoral and reactive sequences, are significantly lower in FLs than in higher‐grade lymphomas (Figure 5A,B and Table S1, IgH_[Global]_CDR3[an]_Simps and IgL_[Global]_CDR3[an]_Simps columns). The global B‐cell populations are thus more heterogeneous in FL, in agreement with the presence of larger contingents of polyclonal reactive B‐cells. We next addressed the diversity of the tumoral populations itself by restricting the analysis to the sequences related to the dominant CDR3s. As shown in Figure 5C,D, the Simpson indexes calculated independently for the IgH and IgL chains are also both significantly lower in FL than in higher‐grade lymphomas (Table S1, IgH_CDR3[an]_Simps. and IgL_CDR3[an]_Simps. columns). The populations of lymphoma cells are thus more heterogeneous in FLs than in higher‐grade lymphoma, indicating a higher degree of ongoing clonal diversification.
Figure 5.
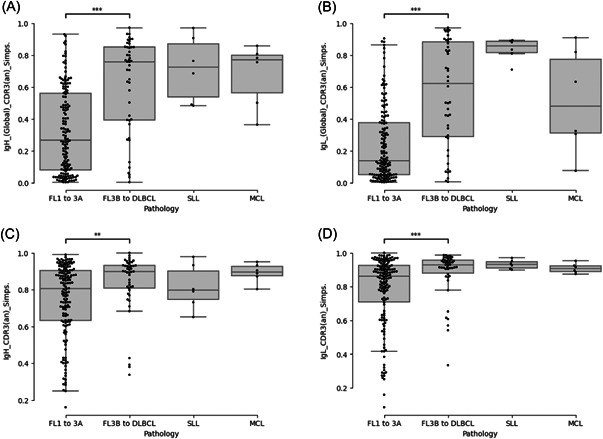
Evaluation of the clonal heterogeneity in follicular lymphoma. The heterogeneity of the global B‐cell population (A, B) and of the tumoral clone (C, D) were evaluated by calculating the Simpson's index for the heavy (A, C) and light (B, D) chains of the B‐cell immunoglobulin repertoires (BCR) in reactive follicular hyperplasia, FL1‐2 to 3A, FL3B to DLBCL, small lymphocytic lymphoma (SLL), and mantle cells lymphomas (MCL) samples. ***p < 10−3 and **p < 10−2 (Wilcoxon test).
The contribution of the reactive lymphoid compartments decreases while the homogeneity of the tumoral population increases at progressions
We next addressed the evolution of the tumoral and reactive compartments for 21 patients for whom we could compare a biopsy obtained at diagnosis with tumoral samples obtained at relapse, with or without histological transformation (Table S1, UPN001 to UPN021, samples #1 to #48, and Figure S1). In almost all cases, sequences related to the dominant IgH and IgL CDR3s at diagnosis were detected at relapses, with the exception of UPN017 (absence of related IgL reads between diagnosis and relapse) and UPN008 (absence of related IgH and IgL reads). As shown in Figure 6A, this analysis revealed that the overall contributions of the T‐cell compartments decreased significantly at progression in these tumors. Interestingly, this analysis also revealed that the concomitant increase of the contribution of the global B‐cell compartment (Figure 6B) is associated with a reduction of its heterogeneity, evaluated independently using the Simpson index on the heavy and light chain loci of the BCR (Figure 6C,D). At least two independent factors participate in this observation. First, the contribution of the tumoral compartment significantly increases over time (Figure 6E,F). This phenomenon is correlated with a decrease in the contribution of the nontumoral post‐GC B‐cells compartment (IgG, IgA, or IgE positive), while the contribution of the IgM/D compartment increases (Figure 6G,H). These two observations probably reflect the action of anti‐CD20 therapies on normal mature B‐cells. In a few extreme cases, for example, UPN#006, we observed that the reactive B compartment at relapse comprised almost exclusively unmutated IgM/D positive B‐cells (Table S1, IgH_Reac_IgM/D_% column). Second, with few exceptions, our results indicate that the diversity of the lymphoma cells decreases significantly during the course of the disease, suggesting that a clonal selection pressure progressively outclasses clonal diversification (Figure 6I,J).
Figure 6.
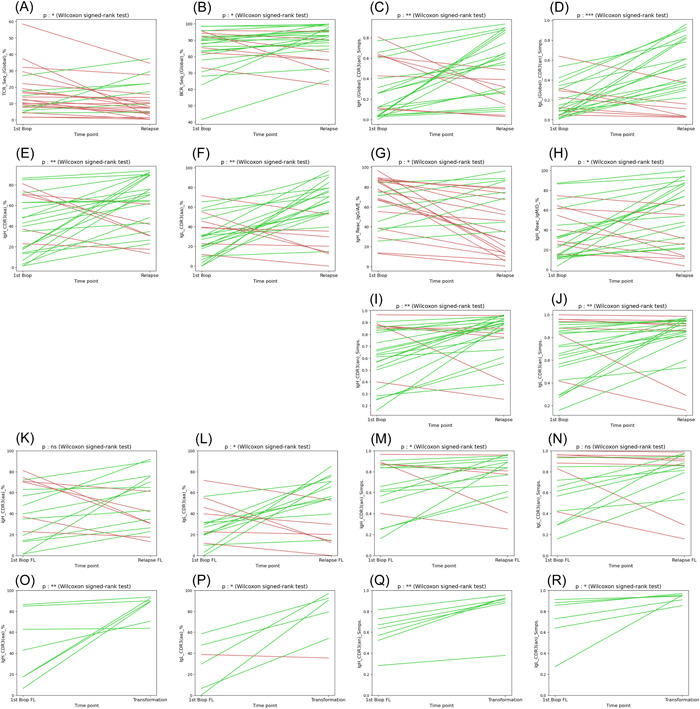
Evolution of the heterogeneity of the tumoral and reactive B‐ and T‐cell compartments during follicular lymphoma (FL) progression. The evolution of several parameters between diagnosis and relapse samples is pictured. A green line was drawn when the parameter increases and a red line when it decreases. (A) Evolution of the percentages of T‐cell immunoglobulin repertoires (TCR) sequences in serial FL biopsies. (B) Evolution of the global percentages of B‐cell immunoglobulin repertoires (BCR) (immunoglobulin heavy [IgH] and immunoglobulin light [IgL]) sequences from both the tumoral and the reactive compartments. (C, D) Evolution of the heterogeneity of the global B‐cell population evaluated by the calculation of the Simpson's index for the IgH (C) and IgL (D) sequences. (E, F) Evolution of the percentages of clonal CDR3 sequences for the IgH (E) and IgL (F) loci. (G, H) Evolution of the contribution of sequences coding secondary (IgG, IgA, and IgE: G) and primary (IgM and IGD: H) isotypes. (I, J) Evolution of the heterogeneity of the clonal population evaluated by the calculation of the Simpson's index for the IgH (I) and IgL (J) loci. (K, L) Evolution of the percentages of clonal CDR3 sequences for the IgH (K) and IgL (L) loci restricted to relapse events (FL to FL). (M, N) Evolution of the heterogeneity of the clonal population evaluated by the calculation of the Simpson's index for the IgH (M) and IgL (N) loci restricted to relapse events (FL to FL). (O, P) Evolution of the percentages of clonal CDR3 sequences for the IgH (O) and IgL (P) loci restricted to transformations into high‐grade lymphoma events (FL to DLBCL). (Q, R) Evolution of the heterogeneity of the clonal population evaluated by the calculation of the Simpson's index for the IgH (Q) and IgL (R) loci restricted to transformations into high‐grade lymphoma events (FL to DLBCL). ***p < 10−3, **p < 10−2 and *p < 5.10−2 (Wilcoxon signed‐rank test).
To address further this point, we conducted separate analyses of the progressions (FL1‐2 to FL1‐2 or FL3A) and the transformations. We observed a significant correlation between transformations and an augmentation of the contribution of the tumoral compartment, evident on both the heavy and light Ig chains (Figure 6O,P). Furthermore, we observed a significant rise in the Simpson indexes computed independently for these two loci (Figure 6Q,R), suggesting a reduction of the ongoing clonal diversification. In contrast, progressions from FL to FL appear to result from highly heterogeneous modes of evolutionary changes (Figure 6K–L).
Direct and indirect clonal evolutions addressed through the sequences of the CDR3 and of recurrently mutated genes
Finally, we analyzed the evolution of FL subclones between diagnosis and relapse by comparing the evolutions of IgH and IgL CDR3s sequences and the somatic alterations affecting 18 recurrently mutated genes. For each patient, we identified the 10 dominant subclones and compared their contributions at diagnosis and relapse (Figures 7 and S4). In agreement with previous studies, this analysis confirmed the complex dynamic of clonal evolution in this pathology. In some cases, for example, UPN004 (Figure 7A–C), our data were consistent with a linear evolution scenario. In this case, the dominant IgH and IgL CDR3 sequences were identical at diagnosis and relapse, and the two biopsies shared mutations in the KMT2D, STAT6, TNFRSF14, EZH2, EP300, SOCS1, CARD11, and BCL2 genes. For this patient, the only difference consisted in the gain of an additional BCL2 mutation that revealed the emergence of a different subclone at relapse. In other cases, for example, UPN014 (Figure 7D–F), our data revealed that the relapses were due to the emergence of minor subpopulations. For this patient, the dominant IgH CDR3 was absent at relapse, while two subpopulations already present at diagnosis emerged. No differences were noted for the IgL chain, but the somatic mutations revealed the loss of CARD11 and BCL2 mutations at relapse and the presence of an additional BCL2 mutation. Finally, some cases, like UPN013 (Figure 7G,H), revealed branched clonal evolutions. In this case, for which we could analyze three iterative FL1‐2 biopsies, our data revealed a first divergent evolution between diagnosis and first relapse, marked by the emergence of different dominant CDR3s, the appearance of new mutations (TNFRSF14, BCL2, KMT2D, and FOXO1), and the disappearance of others (KMT2D and BCL2). The analysis of the third biopsy revealed a second divergent evolution, marked by the emergence of divergent IgH and IgL CDR3 motives, the absence of two TNFRSF14 and KMT2D mutations detected at first relapse, and the presence of new BCL2 mutations. Remarkably, the only genomic alterations that were retained throughout the whole history of this tumor were KMT2D and CREBBP mutations, considered early oncogenic events in this pathology. 32 , 33
Figure 7.
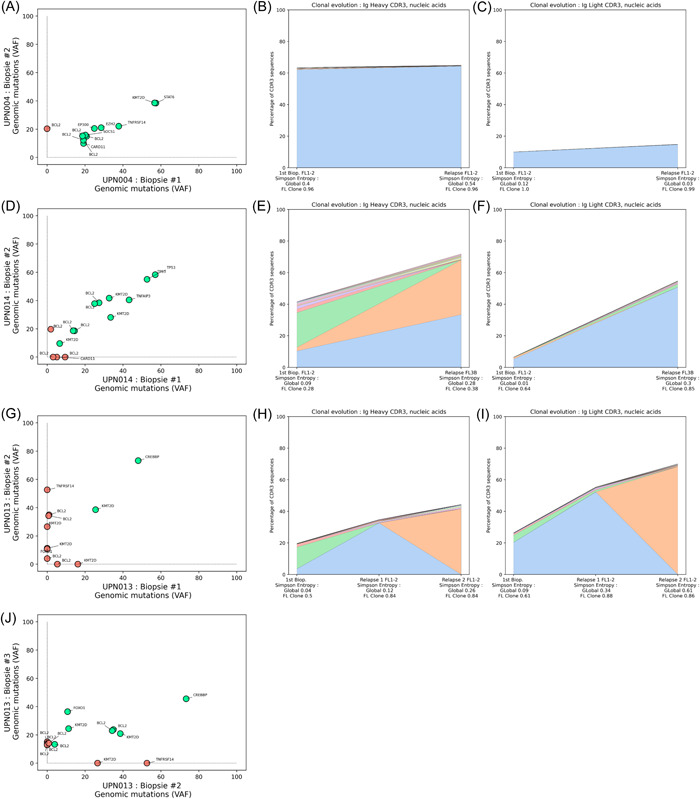
Evolution of contributions of the major follicular lymphoma (FL) subclones and genetic mutation patterns during FL progression. Three representative cases are presented, and all cases with paired samples are available in Figure S4. The variant allele frequencies of the detected somatic mutations identified in genomic DNA were plotted at diagnosis and relapse to assess the evolution of the FL population (A, D, G, and J), with a green circle for concordant mutation between diagnosis and relapse, and a red circle for discordant mutations. The evolutions of the dominant FL subclones were evaluated in parallel through the analysis of the Ig CDR3 sequences, representing the contribution of the 10 most frequent sequences for the IgH (B, E, and H) and IgL (C, F, and I) loci.
DISCUSSION
In this study, we addressed the BCR and TCR repertoires of the tumoral and reactive B‐ and T‐cell compartments in a large cohort of FLs by means of high‐throughput RNA sequencing and tracked their evolutions between diagnosis and relapses. The simplicity of the sequencing protocol we applied and its applicability to archival material allowed us to analyze a very large number of samples and to obtain an unprecedented picture of the evolution of immunoglobulin repertoires of the tumoral and the reactive lymphoid compartments in this pathology.
The characterization of the isotype of the Ig heavy chains in these tumors indicates that, contrasting with the current assumption, 15 , 17 a very significant proportion of FLs (more than 40% in our series) express a secondary isotype. The observation that many of these lymphomas simultaneously express different isotypes also reveals that CSR often remains active and participates in clonal diversification. 34 This result suggests that CSR, which is suspected to be responsible for the acquisition of recurrent chromosomal translocations in higher grade B‐cell lymphoma, could also play a significant role in FL progressions. 34 , 35
In this context, the detection of IgM and IgD sequencing reads sharing the dominant CDR3 in IgG‐positive tumors is also intriguing. In light of recent studies that documented an important site‐to‐site genetic heterogeneity in this disease, 18 , 19 it is possible to hypothesize that earlier FL cells that have not undergone CSR may proliferate at different anatomic sites and be recruited in tumoral lymph nodes. Further analysis of these cells may provide important information on the nature of the elusive contingent of CPC which is suspected to be implicated in recurrent relapses.
Regarding the evolution of the tumoral populations, our data are in complete agreement with the numerous studies that have documented the complexity of FL clonal dynamics. They again point to a high degree of genetic diversity, and provide further examples to illustrate the linear and divergent evolution pathways responsible for clinical progressions. 7 , 8 Furthermore, our data provide new information on the evolution dynamics of these tumors by demonstrating, through the quantitative evaluation of their heterogeneity at diagnosis and relapse, that the diversity of both the tumoral and reactive lymphoid compartments tends to decrease over time, sometimes even in the absence of any evidences of histological transformation.
Regarding the evolution of the lymphoid microenvironment, the high degree of T‐cell infiltration we observed at diagnosis as compared to higher‐grade lymphomas is consistent with the daily observations made by pathologists and with the documented dependency of FL cells toward infiltrating T‐cells for survival. Furthermore, the propensity of this compartment to decrease over time suggests that FL cells progressively become independent from T‐cell interactions, which may impact future therapeutic strategies targeting the interactions between FL cells and their microenvironment. 28 , 36 , 37 In line with this observation, the fact that the contribution of the reactive B‐cells is highly variable in the early phases of the disease and decreases over time, probably due to the impact of anti‐CD20 therapies, further suggests that the dependence of the tumoral population from its microenvironment decrease during the course of the disease.
Of note, one limit of the approach we used is that it does not inform on the actual size of the different populations of lymphoid cells, but reflects only the level of expressions of the Ig mRNA molecules they express. Also, as our analysis was performed on bulk nucleic acid samples extracted from crude biopsies obtained in the clinics for pathological diagnosis purposes, without any further step of tumoral cell selection, the data we generated are certainly biased by the presence of variable proportions of reactive lymphoid cells at various stages of differentiation. It is thus not possible to establish whether the reactive B‐cell we detected resides within residual reactive follicles, within inter‐follicular areas, or the tumoral follicles themselves. Nevertheless, as a majority of the Ig mRNA, we detected harbor IgV somatic mutations and code secondary isotypes, they probably are of post‐GC origin. They may thus correspond to infiltrating plasmacytic cells, which are, however, not frequent in this pathology, or to a population of post‐GC B‐cells that may be recruited within these tumors.
Together, our data also shed new light on the different clinical phases of FL initiation and progression. The higher clonal diversity we observed at diagnosis suggests the existence of an early clinical stage when most tumors are relatively indolent. This period may correspond to an episode of ongoing clonal diversification, where the proliferative capacity of the multiplicity of FL subclones that are generated is still low. According to recent studies that have documented an important clonal heterogeneity between different anatomic sites of FLs, it is probable that this diversification occurs independently at multiple locations, raising the risk to see the emergence of more aggressive subclones. 19 , 38 This scenario may explain the efficiency of anti‐CD20 therapies in adjunction to chemotherapy regimens, as the control of this low proliferative population appears essential to restrain the disease. However, in many patients, the current treatment strategies are obviously not sufficient to eradicate these cells.
In conclusion, our findings are in agreement with prior studies that have illustrated the diverse clonal evolution pathways characterizing the progression of FL. Moreover, our data suggest that the subclones that emerge at relapses are preferentially selected based on their proliferative capacities and that this selection becomes more pronounced as the imbalance between proliferation and diversification increases. Importantly, our results also confirm that these phenomena can culminate in the abrupt emergence of a homogeneous population of highly proliferative lymphoma cells in case of histologic transformation. 39
AUTHOR CONTRIBUTIONS
Victor Bobée, Mathieu Viennot, and Philippe Ruminy designed and performed the experiments, analyzed and interpreted the data, and wrote the manuscript. Elodie Bohers, Vinciane Rainville, Victor Michel, and Marie‐Delphine Lanic performed experiments and participated in the interpretation of the data. Pierre‐Julien Viailly, Vincent Sater, and Philippe Ruminy analyzed the data and developed the bioinformatics pipelines. Liana Veresezan and Fanny Drieux performed histological reviews. Vincent Camus, Hervé Tilly, and Fabrice Jardin coordinated the study and supervised the analysis.
CONFLICT OF INTEREST STATEMENT
The authors declare no conflict of interest.
FUNDING
This work was supported by a grant from the French Ligue contre le cancer association (Seine Maritime & Eure).
Supporting information
Supporting information.
Supporting information.
Supporting information.
Supporting information.
Supporting information.
Supporting information.
Supporting information.
ACKNOWLEDGMENTS
We thank the Centre de Ressource Biologiques (CRB) of the Centre Henri Becquerel for providing biopsy sample materials. We also gratefully thank Pr Karin Tarte and Dr Sarah Huet for their careful evaluation of our manuscript.
DATA AVAILABILITY STATEMENT
The data that support the findings of this study are openly available in NCBI at https://www.ncbi.nlm.nih.gov/sra/PRJNA1065388, reference number PRJNA1065388.
REFERENCES
- 1. Carbone A, Roulland S, Gloghini A, et al. Follicular lymphoma. Nat Rev Dis Primers. 2019;5(1):83. [DOI] [PubMed] [Google Scholar]
- 2. Bachy E, Seymour JF, Feugier P, et al. Sustained progression‐free survival benefit of rituximab maintenance in patients with follicular lymphoma: long‐term results of the PRIMA study. J Clin Oncol. 2019;37(31):2815‐2824. [DOI] [PMC free article] [PubMed] [Google Scholar]
- 3. Pastore A, Jurinovic V, Kridel R, et al. Integration of gene mutations in risk prognostication for patients receiving first‐line immunochemotherapy for follicular lymphoma: a retrospective analysis of a prospective clinical trial and validation in a population‐based registry. Lancet Oncol. 2015;16(9):1111‐1122. [DOI] [PubMed] [Google Scholar]
- 4. Huet S, Tesson B, Jais J‐P, et al. A gene‐expression profiling score for prediction of outcome in patients with follicular lymphoma: a retrospective training and validation analysis in three international cohorts. Lancet Oncol. 2018;19(4):549‐561. [DOI] [PMC free article] [PubMed] [Google Scholar]
- 5. Silva A, Bassim S, Sarkozy C, et al. Convergence of risk prediction models in follicular lymphoma. Haematologica. 2019;104(6):e252‐e255. [DOI] [PMC free article] [PubMed] [Google Scholar]
- 6. Kridel R, Sehn LH, Gascoyne RD. Can histologic transformation of follicular lymphoma be predicted and prevented? Blood. 2017;130(3):258‐266. [DOI] [PubMed] [Google Scholar]
- 7. Ruminy P, Jardin F, Picquenot J‐M, et al. Sμ mutation patterns suggest different progression pathways in follicular lymphoma: early direct or late from FL progenitor cells. Blood. 2008;112(5):1951‐1959. [DOI] [PubMed] [Google Scholar]
- 8. Carlotti E, Wrench D, Matthews J, et al. Transformation of follicular lymphoma to diffuse large B‐cell lymphoma may occur by divergent evolution from a common progenitor cell or by direct evolution from the follicular lymphoma clone. Blood. 2009;113(15):3553‐3557. [DOI] [PubMed] [Google Scholar]
- 9. Wartenberg M, Vasil P, Bueschenfelde CM, et al. Somatic hypermutation analysis in follicular lymphoma provides evidence suggesting bidirectional cell migration between lymph node and bone marrow during disease progression and relapse. Haematologica. 2013;98(9):1433‐1441. [DOI] [PMC free article] [PubMed] [Google Scholar]
- 10. Okosun J, Bödör C, Wang J, et al. Integrated genomic analysis identifies recurrent mutations and evolution patterns driving the initiation and progression of follicular lymphoma. Nat Genet. 2014;46(2):176‐181. [DOI] [PMC free article] [PubMed] [Google Scholar]
- 11. Pasqualucci L, Khiabanian H, Fangazio M, et al. Genetics of follicular lymphoma transformation. Cell Rep. 2014;6(1):130‐140. [DOI] [PMC free article] [PubMed] [Google Scholar]
- 12. Bakhshi A, Jensen JP, Goldman P, et al. Cloning the chromosomal breakpoint of t(14;18) human lymphomas: clustering around JH on chromosome 14 and near a transcriptional unit on 18. Cell. 1985;41(3):899‐906. [DOI] [PubMed] [Google Scholar]
- 13. Küppers R, Klein U, Hansmann ML, Rajewsky K. Cellular origin of human B‐cell lymphomas. N Engl J Med. 1999;341(20):1520‐1529. [DOI] [PubMed] [Google Scholar]
- 14. Limpens J, Stad R, Vos C, et al. Lymphoma‐associated translocation t(14;18) in blood B cells of normal individuals. Blood. 1995;85(9):2528‐2536. [PubMed] [Google Scholar]
- 15. Roulland S, Navarro J‐M, Grenot P, et al. Follicular lymphoma‐like B cells in healthy individuals: a novel intermediate step in early lymphomagenesis. J Exp Med. 2006;203(11):2425‐2431. [DOI] [PMC free article] [PubMed] [Google Scholar]
- 16. Sungalee S, Mamessier E, Morgado E, et al. Germinal center reentries of BCL2‐overexpressing B cells drive follicular lymphoma progression. J Clin Invest. 2014;124(12):5337‐5351. [DOI] [PMC free article] [PubMed] [Google Scholar]
- 17. Milpied P, Gandhi AK, Cartron G, et al. Follicular lymphoma dynamics. Adv Immunol. 2021;150:43‐103. [DOI] [PubMed] [Google Scholar]
- 18. Araf S, Wang J, Korfi K, et al. Genomic profiling reveals spatial intra‐tumor heterogeneity in follicular lymphoma. Leukemia. 2018;32(5):1261‐1265. [DOI] [PMC free article] [PubMed] [Google Scholar]
- 19. Haebe S, Shree T, Sathe A, et al. Single‐cell analysis can define distinct evolution of tumor sites in follicular lymphoma. Blood. 2021;137(21):2869‐2880. [DOI] [PMC free article] [PubMed] [Google Scholar]
- 20. Turajlic S, Sottoriva A, Graham T, Swanton C. Resolving genetic heterogeneity in cancer. Nat Rev Genet. 2019;20(7):404‐416. [DOI] [PubMed] [Google Scholar]
- 21. Bobée V, Drieux F, Marchand V, et al. Combining gene expression profiling and machine learning to diagnose B‐cell non‐Hodgkin lymphoma. Blood Cancer J. 2020;10(5):59. [DOI] [PMC free article] [PubMed] [Google Scholar]
- 22. Bohers E, Viailly PJ, Dubois S, et al. Somatic mutations of cell‐free circulating DNA detected by next‐generation sequencing reflect the genetic changes in both germinal center B‐cell‐like and activated B‐cell‐like diffuse large B‐cell lymphomas at the time of diagnosis. Haematologica. 2015;100(7):e280‐e284. [DOI] [PMC free article] [PubMed] [Google Scholar]
- 23. Dubois S, Viailly P‐J, Mareschal S, et al. Next‐generation sequencing in diffuse large B‐cell lymphoma highlights molecular divergence and therapeutic opportunities: a LYSA study. Clin Cancer Res. 2016;22(12):2919‐2928. [DOI] [PubMed] [Google Scholar]
- 24. Dubois S, Viailly P‐J, Bohers E, et al. Biological and clinical relevance of associated genomic alterations in MYD88 L265P and non‐L265P‐mutated diffuse large B‐cell lymphoma: analysis of 361 cases. Clin Cancer Res. 2017;23(9):2232‐2244. [DOI] [PubMed] [Google Scholar]
- 25. Ye J, Ma N, Madden TL, Ostell JM. IgBLAST: an immunoglobulin variable domain sequence analysis tool. Nucleic Acids Res. 2013;41:W34‐W40. [DOI] [PMC free article] [PubMed] [Google Scholar]
- 26. Swerdlow SH. Mature B‐cell neoplasms. WHO Classif. Tumours Haematop. Lymphoid Tissues Revis. IARC, Lyon 2017; 2017:215‐342. [Google Scholar]
- 27. Amé‐Thomas P, Hoeller S, Artchounin C, et al. CD10 delineates a subset of human IL‐4 producing follicular helper T cells involved in the survival of follicular lymphoma B cells. Blood. 2015;125(15):2381‐2385. [DOI] [PMC free article] [PubMed] [Google Scholar]
- 28. Mintz MA, Cyster JG. T follicular helper cells in germinal center B cell selection and lymphomagenesis. Immunol Rev. 2020;296(1):48‐61. [DOI] [PMC free article] [PubMed] [Google Scholar]
- 29. Pangault C, Amé‐Thomas P, Ruminy P, et al. Follicular lymphoma cell niche: identification of a preeminent IL‐4‐dependent T(FH)‐B cell axis. Leukemia. 2010;24(12):2080‐2089. [DOI] [PMC free article] [PubMed] [Google Scholar]
- 30. Maley CC, Aktipis A, Graham TA, et al. Classifying the evolutionary and ecological features of neoplasms. Nat Rev Cancer. 2017;17(10):605‐619. [DOI] [PMC free article] [PubMed] [Google Scholar]
- 31. Simpson EH. Measurement of diversity. Nature. 1949;163:688. [Google Scholar]
- 32. Green MR, Gentles AJ, Nair RV, et al. Hierarchy in somatic mutations arising during genomic evolution and progression of follicular lymphoma. Blood. 2013;121(9):1604‐1611. [DOI] [PMC free article] [PubMed] [Google Scholar]
- 33. Haebe S, Keay W, Alig S, et al. The molecular ontogeny of follicular lymphoma: gene mutations succeeding the BCL2 translocation define common precursor cells. Br J Haematol. 2022;196(6):1381‐1387. [DOI] [PubMed] [Google Scholar]
- 34. Ye X, Ren W, Liu D, et al. Genome‐wide mutational signatures revealed distinct developmental paths for human B cell lymphomas. J Exp Med. 2021;218(2):e20200573. [DOI] [PMC free article] [PubMed] [Google Scholar]
- 35. Hardianti MS, Tatsumi E, Syampurnawati M, et al. Activation‐induced cytidine deaminase expression in follicular lymphoma: association between AID expression and ongoing mutation in FL. Leukemia. 2004;18(4):826‐831. [DOI] [PubMed] [Google Scholar]
- 36. Mourcin F, Verdière L, Roulois D, et al. Follicular lymphoma triggers phenotypic and functional remodeling of the human lymphoid stromal cell landscape. Immunity. 2021;54(8):1788‐1806. [DOI] [PubMed] [Google Scholar]
- 37. Ménard C, Rossille D, Dulong J, et al. Lenalidomide triggers T‐cell effector functions in vivo in patients with follicular lymphoma. Blood Adv. 2021;5(8):2063‐2074. [DOI] [PMC free article] [PubMed] [Google Scholar]
- 38. Oeschger S, Bräuninger A, Küppers R, Hansmann M‐L. Tumor cell dissemination in follicular lymphoma. Blood. 2002;99(6):2192‐2198. [DOI] [PubMed] [Google Scholar]
- 39. Kridel R, Chan FC, Mottok A, et al. Histological transformation and progression in follicular lymphoma: a clonal evolution study. PLoS Med. 2016;13(12):e1002197. [DOI] [PMC free article] [PubMed] [Google Scholar]
Associated Data
This section collects any data citations, data availability statements, or supplementary materials included in this article.
Supplementary Materials
Supporting information.
Supporting information.
Supporting information.
Supporting information.
Supporting information.
Supporting information.
Supporting information.
Data Availability Statement
The data that support the findings of this study are openly available in NCBI at https://www.ncbi.nlm.nih.gov/sra/PRJNA1065388, reference number PRJNA1065388.


