Abstract
Proteins fold through a variety of mechanisms. For a given protein, folding routes largely depend on the protein's stability and its native-state geometry, because the landscape is funneled. These ideas are corroborated for cytochrome c by using a coarse-grained topology-based model with a perfect funnel landscape that includes explicit modeling of the heme. The results show the importance of the heme as a nucleation site and explain the observed hydrogen exchange patterns of cytochrome c within the context of energy landscape theory.
Keywords: foldon, heme cofactor, contact density, nucleation
When examined carefully, proteins are found to fold by many different detailed mechanisms (1, 2). These mechanisms, however, all arise from a common set of principles governing the folding energy landscape. Energy landscape theory and the principle of minimal frustration have been able to explain how many different folding mechanisms can be understood as arising by tuning just a few parameters that characterize the energy landscape (3–6). Evolution, by requiring robust folding, has generally led to funneled energy landscapes with a small degree of ruggedness. Although ruggedness caused by nonnative contacts can lead to specific folding intermediates, even completely funneled energy landscapes exhibit fluctuations in the entropy cost for following different folding routes, so, typically, only a small selection of the possible folding routes in a funnel is realized. Consistent with these concepts, calculations based on perfectly funneled surfaces, introduced originally in the context of lattice models (7), have been used to predict the dominant folding routes of many naturally occurring proteins (8–15). In the past, the folding of cytochrome c has been considered by some to be a challenge to the funnel landscape paradigm (16–20) because hydrogen exchange experiments have suggested a particular order of fragment folding. Numerous studies like those cited earlier have shown, however, that there is no intrinsic contradiction between having a funneled landscape and there being a small set of kinetically dominant folding routes. Although landscape ruggedness is quantitatively relevant, perfectly funneled landscapes have correctly predicted the main routes in many cases. Indeed, here we will show that a perfectly funneled landscape for cytochrome c does in fact predict the same order of events for this protein, as has been suggested by hydrogen exchange experiments. A key feature of cytochrome c folding is the presence of a large cofactor, which our calculations show exerts a strong effect on the mechanism. Cofactors may play such a key role in many folding mechanisms (21).
In detail, our calculations are based on simulations of the associative memory Hamiltonian used in many previous studies for both structure prediction (22) and kinetic analysis (23). By using only a single “memory” protein conforming to the native x-ray structure, we ensure a perfect funnel. Nonadditivity of the forces used in the calculation accounts for the cooperative effects of three body interactions. Nonadditive effects arise from averaging over solvent and side-chain reorientation degrees of freedom. Analytical theory (24) and simulation studies, both on- and off-lattice (25–27), show that nonadditivity increases the magnitude of folding free-energy barriers. The larger cooperative effects of a nonadditive solvent averaged potential improves the accuracy of predicted protein folding rates and mechanisms, as clearly pointed out by Plotkin and coworkers (28). The goal of this study is to add the structural details of the heme cofactor to these simple protein topology-based models, which usually omit cofactors. A previous study on cytochrome c considered a Cα Gō model without heme (29). Cárdenas and Elber (30) have included the heme in their all-atom model. Their elegant calculation used alternative dynamics based on a stochastic difference equation to calculate approximate long time trajectories. The pattern of these trajectories agreed with many of the experimental observations on the cytochrome system. Our study, however, utilizes a more simplified model that is completely funneled to ascertain whether the basic physical principles that have been found to guide folding of other proteins also apply to cytochrome c. The present model also allows extensive sampling that is not possible by using all-atom molecular dynamics simulations, so that rather precise free energies can be computed, allowing a clean quantitative picture of the ordering of processes to be deduced.
Methods
In the present model, the heme is represented by using four pseudoatoms oriented in a square planar geometry. The interactions between the pseudoatoms of the heme are created to ensure that the heme has a realistic size and shape by using six harmonic constraints of the form k(r – ro)2 between each pair of atoms. Pseudo covalent bonds are included with harmonic constraints to fix the heme to the backbone. The scaling constants of the harmonic potentials, as well as all other potentials, have arbitrary units ε. The unit of energy is defined in terms of the native-state energy excluding backbone contributions, Enat, such that ε = |Enat/4N|, where N is the number of residues. Each residue in the main chain is represented by three atoms, Cα,Cβ, and oxygen Ox, where backbone geometry is maintained by using shake (31). The single-memory associative memory Hamiltonian is composed by using the specific geometric contacts of the native structure, which operate between atoms with rij < 8 Å for protein–protein interactions and rij < 12 Å for protein–heme interactions. These contacts loosely can be called the “topology” of the protein. Contact potentials are represented by Gaussian well potentials similar to the protein–protein contacts described in earlier studies (25):
 |
The indices i and j run over all of the Cα and Cβ atoms for protein–protein interactions and all heme and Cα atoms for the protein–heme interactions. The value of γij is uniformly set to 0.290, which results in a homogeneous contact potential, and rij is the distance between atoms i and j. The contact variance σij is equal to |i – j|0.3 for protein–protein interactions and |12|0.3 for protein–heme interactions. The interaction energies are scaled to account for nonadditivity as in the study of Eastwood and Wolynes (25). The scaling factor a is given to maintain the unit of energy as described earlier:  . The energy per residue is given by Ei = Σjεij. Nonadditivity comes about because of the cross terms in the expression
  . There are no cross terms for the p = 1 case, which corresponds to a purely additive potential. The cross terms for the p = 2 case allow for three body interactions, and, in general, there are (p + 1) body interactions accounted for in the energy function. Nonadditivity was added by setting p = 1.3 so that ≈35% of the total energy is due to three body interactions. In our investigation, the simulations of apo and holo cytochrome c were carried out at the folding temperature Tf of the holo protein by using the weighted histogram analysis method (32). Isosurface plots were created to monitor the formation of structure along the reaction coordinate. An isosurface plot is analogous to a four-dimensional contour plot. The probability for the backbone atoms to exist over regions of Cartesian space is calculated after an alignment procedure. A cutoff for these probabilities is chosen to visualize a surface under which the backbone atoms exist with a probability greater than the specified cutoff. To compute these probabilities, the structures in a given Q ensemble were aligned by means of a rms deviation (rmsd) minimization procedure by using the program profit (33).¶ Alignment of unfolded structures is difficult, however. If structure has formed in two foldons that are separated by a large distance, two alignments with similar rmsd can be made. Each of these alignments would show that only one foldon has structure; structure in the other foldon would be disregarded. The protein was cut into six segments of ≈18 residues to avoid alignment difficulties. The segments were then aligned onto the native structure. The probabilities were calculated by dividing Cartesian space into 1-Å2 cubes. The probability cutoff of 0.10 was chosen such that the formation of structure can be visualized for each plot. For simulations, this procedure mimics the variational approach that predicts free-energy profiles by using residue level Debye–Waller factors as local order parameters (34, 35).
Results
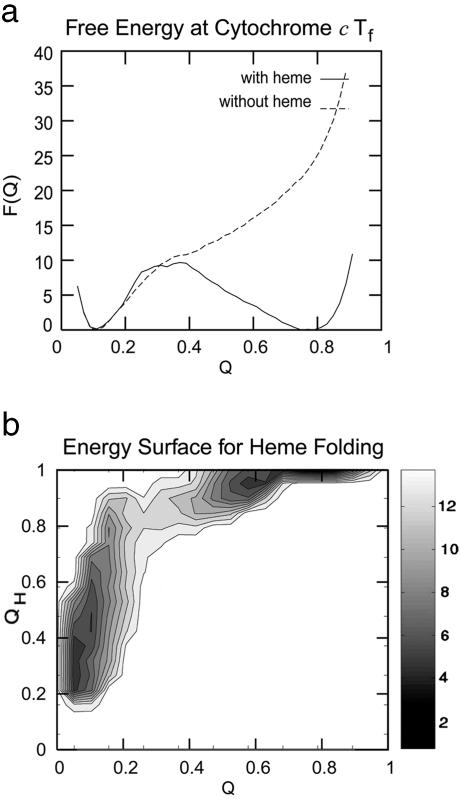
To analyze the dominant folding routes, we compute several different free-energy profiles for many different order parameters. We first compute the average free energy as a function of the overall approximate reaction coordinate Q, which describes the percentage of native contacts using the proximity of the α-carbons. This order parameter correlates with the associative memory Hamiltonian energy and the depth of the funnel. The free-energy diagram for holo and apo forms (Fig. 1a) shows the very significant effect of the heme to side-chain interactions, which enhances the protein's stability. These profiles give a free-energy barrier for the present nonadditive model comparable to the experimental estimate of 9 kT (36). The dynamic role of the heme can be elucidated by using a free-energy surface that monitors, in addition to Q, another reaction coordinate, QH, which is analogous to Q but is restricted to protein–heme contacts (Fig. 1b). The free-energy plot shows that native heme interactions form early in the folding process. Forming of these contacts coincides with collapse of the polypeptide in this model; they are mostly formed by the time the transition state at Q ≈ 0.3 is reached. QH is already ≈0.8 at this point. The surface strongly suggests that the heme acts as a nucleation site for collapse. Because collapse occurs before a very large fraction of the native contacts are formed, we see that many nonnative contacts could be accommodated in the collapsed state.
Fig. 1.
Diagrams showing the strong effect of the heme on the mechanism. (a) Free-energy plot as a function of the reaction coordinate Q. (b) Calculated free-energy surface for which the order parameter QH describes the fraction of native contacts between the protein chain and the heme.
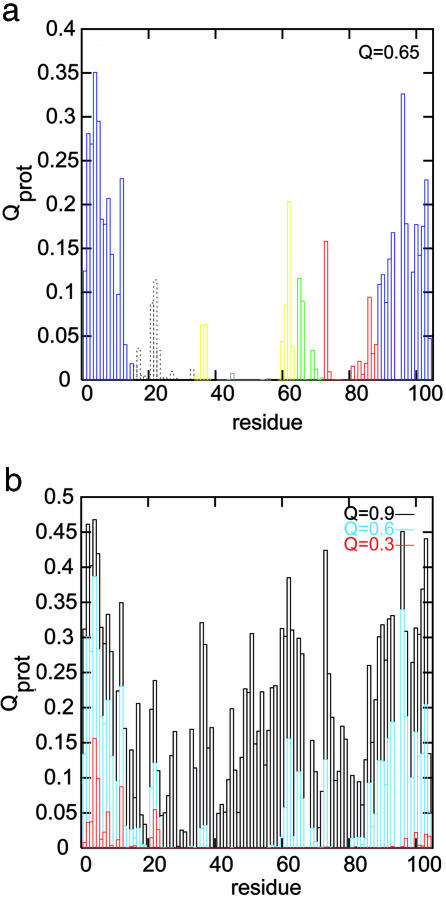
On a minimally rugged landscape like the one simulated, once a critical number of contacts are made in the transition state ensemble, the folding can proceed further downhill, resulting in two-state folding. However, nonnative interactions and solvent effects not present in this topology-based model can stabilize intermediates, as is observed in some experiments (36–38). Distinct intermediates are not present in a thermodynamic sense in the current single-memory associative memory Hamiltonian, resulting in two-state thermodynamics. Yet the sequence of structural consolidation that is seen as the protein descends in the funnel can be probed. The pattern is made evident by calculating protection factors, Qprot, for each residue. Qprot(i) is the product of the contact probabilities for a particular Cα(i) with all Cα(j) whose native contact distance is <10 Å. Thus, Qprot measures the fraction of the time that a residue is protected assuming it must form contacts with all of its neighbors to be unavailable for exchange. Fig. 2a shows protection factors from a Q = 0.65 ensemble that qualitatively agree with an acid-denatured intermediate observed by hydrogen exchange (19). Although certain solvent conditions can alter the free-energy profile so that these intermediate Q ensembles are stable, the order of events is correctly predicted by the topology-based model. Although some experiments show intermediate formation due to collapse in low-guanidine conditions, no such intermediates are to be found under higher guanidine (39). The solvent condition changes are difficult to address with a simple single-memory energy function. Nonetheless, we shall see that the order in which contacts form is consistent with the order of folding inferred from the hydrogen exchange experiments.
Fig. 2.
Residue protection factors. (a) Calculated protection factors for the ensemble at Q = 0.65, which qualitatively agrees with an acid-denatured intermediate observed by hydrogen exchange (19). Coloring represents independent folding units. Dashed lines correspond to the ambiguous white region. (b) Protection factors for various ensembles at different Q values.
Englander and colleagues' (17) study on cytochrome c using hydrogen exchange has been argued to imply a stepwise, sequential stabilization of submolecular protein units. The term foldon was originally introduced to describe kinetically competent, quasi-independent folding units (40) and has been adopted in Englander's analysis of his data. Foldons sometimes coincide with exons. It has been argued that exon-encoded foldon structures may have evolved to fold independently (41). In this view, modern proteins evolved largely through the shuffling of the exons within the organism's genome rather than through point mutations. In the picture of cytochrome c folding derived by Englander's hydrogen exchange studies, the residues are grouped into five folding units with distinct stabilities. These foldons are referred to by color and fold in the following order: blue, green, yellow, red, and gray (nested yellow in Englander's study). Evidence for a sequential pathway for organizing these units was suggested by the observation that a destabilizing mutation (Glu62Gly) in one of the early unfolding units also destabilizes every subsequent unfolding unit by a similar energy.
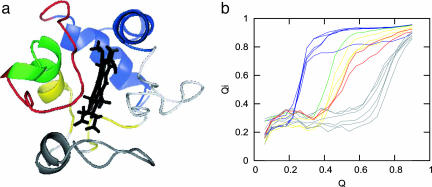
Our simulation results clearly show a natural division of the protein into three distinct units: blue, green/red/yellow (GRY), and gray. Free-energy surfaces show that the three units fold in the same order as was suggested by hydrogen exchange (Fig. 3). Contact maps show that native contacts first form at the N and C termini and then proceed to the middle of the sequence as each foldon forms structure (Fig. 4). The heme has an important stabilizing effect on each of the foldons (Fig. 5). The folding of the blue unit appears to be strongly dependent on heme contacts. Little structure forms in the blue unit before the heme contacts are made. Interestingly, the process of forming the blue foldon exhibits a small intermediate that involves mispacking of the N- and C-terminal helices (Fig. 5). The intermediate may be either on or off pathway. The GRY and gray foldons do not exhibit the same type of intermediate. Their folding is less strongly affected by the heme contacts. Apparently, the heme nucleates collapse but is not sufficient to drive the entire folding process. The sequential course of folding can be probed in the simulation by monitoring local structure measures of formation Qi, the fraction of contacts formed wholly within specified parts of the chain. These residue-specific order parameters are analogous to Q but measure the degree of folding within a given sequence boundary (3 ≤ |i – j| ≤ 12). Changing the choice of boundary by a few residues does not significantly affect the folding sequence that we observe. Three distinct units are found to fold in a stepwise manner, on average, as seen in Fig. 6b. Analysis of local structure formation shows that the folding sequence is correctly predicted, even within the GRY folding unit.
Fig. 3.
Calculated free-energy surfaces showing folding pathways for the blue (a), GRY (b), and gray (c) foldons.
Fig. 4.
Contact maps for cytochrome c. Maps show data at Q = 0.3, 0.6, and 0.9 for Cα–Cα native contacts <8 Å. Lighter shading represents a high probability of contact.
Fig. 5.
Calculated free-energy surfaces showing the effect of heme on the blue, GRY, and gray foldons.
Fig. 6.
Sequential folding of foldons. (a) Structure of cytochrome c colored by the midpoint of the Qi transition. Blue corresponds to Qi < 0.4, green is 0.4 < Qi < 0.5, yellow and red are 0.5 < Qi < 0.6, and gray is Qi > 0.6. White residues do not undergo a clear sigmoidal transition because of an apparent three-state transition. (b) The average Qi shows the residue-specific folding transition for residues: blue (i = 94, 95, 96, 98, and 99), green (i = 68), yellow (i = 59, 60, and 64), red (i = 74 and 75), and gray (i = 42, 43, 46, 53, 54, and 55).
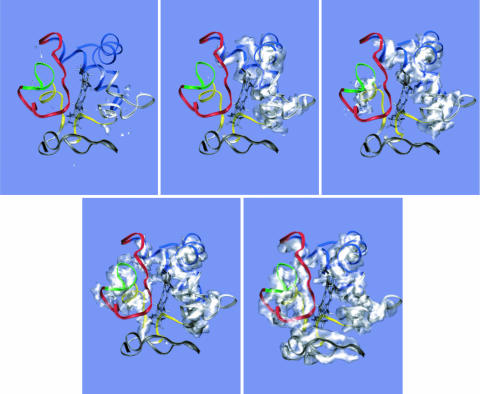
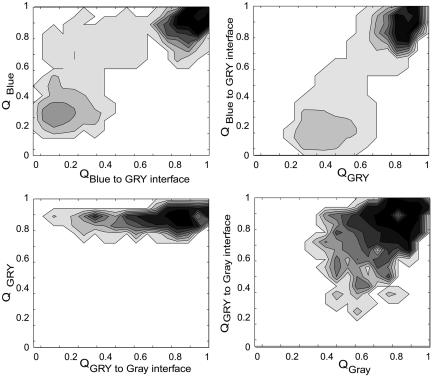
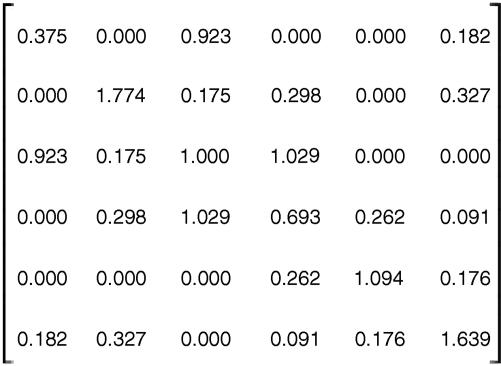
The interface between the different foldons controls the observed sequential steps. Essentially, a transient capillarity interface forms during folding (6, 42). The growth of the folded protein order can be visualized by using three-dimensional isosurface plots (Fig. 7). This isosurface plot is a surface under which there is a >10% probability for the backbone atoms to be found over regions of Cartesian space after an alignment procedure. This procedure is described in detail in Methods. The isosurface shows that the N- and C-terminal helices are structured early in the folding process and together act as a nucleation interface. The interface then propagates along the protein that already covers the heme. The same pattern can be seen by calculating free-energy surface plots (Fig. 8). These plots show how the formation of structure within each foldon creates a folding interface for further protein organization. Each interface promotes nucleation of the adjacent foldon, which forms another interface, and so on. The free-energy surface for the blue foldon interface shows that the blue foldon helps create a structured nucleus for the rest of the protein. The blue folding unit appears to be very cooperative. The nature of this mechanism can be further illustrated by monitoring interfoldon contact density matrices (Fig. 9). After collapse, the blue foldon has a high probability to fold because it has the highest contact density in the native x-ray structure (M2,2). The heme and the blue foldon then can cooperatively fold the green foldon once its interface is formed (M3,1 + M3,2). With the green foldon in place, there is now sufficient interfoldon interaction to fold the remaining red/yellow foldon (M4,2 + M4,3) and, finally, the gray foldon (M5,4). The white region from residues 16–37 is rather ambiguous, because two subsequent transitions occur due to shared protein interfaces with the blue foldon and the heme (M6,1 + M6,2) as well as with the gray and yellow foldons (M6,4 + M6,5). No free-energy values for any residues in this region were quoted in the experimental study using native-state hydrogen exchange, possibly due to this apparent three-state nature of the transition. Interestingly, the white and green regions appear to be more sensitive to increased nonadditivity due to more cooperative, three-body interactions. Although the general sequential nature of the folding remains, the model predicts that white and green regions fold earlier in more cooperative conditions (i.e., when larger nonadditivity is used). These profiles suggest that the mechanism deduced from the simulation can be tested by introducing mutations on the interface between different foldons. With the mutated interfaces, it is possible that the folding events will be rearranged.
Fig. 7.
Isosurfaces under which the backbone atoms exists with >0.10 probability after an alignment procedure. (See Methods for details.) The plots show surfaces for ensembles at Q = 0.2, 0.3, 0.5, 0.6, and 0.8 (from Upper Left to Lower Right).
Fig. 8.
The free-energy surfaces demonstrate how foldon interfaces nucleate the folding of adjacent foldons.
Fig. 9.
Interfoldon contact density matrix of the native state. Mi,j = (contacts between i and j < 8 Å)/(Ni + Nj), where i and j are the following regions of cytochrome c from left to right or top to bottom: heme, blue, GRY, gray, and white.
The present perfect funnel model captures many of the essential features of the folding process that are seen for cytochrome c. The results show that collapse and folding are highly correlated in the completely minimally frustrated model. The effect of nonnative contacts, specifically heme misligation, is well known in this system and must be the object of further computational study. The geometry of heme interactions is important for the collapse of the polypeptide, but the overall topology of all of the atoms dominates the energy landscape and thus defines the dominant folding routes. The slower steps of folding appear to be caused by topological frustration (43) due to orienting the N- and C-terminal helices with respect to the heme cofactor. After this step, folding proceeds largely downhill in a nucleation-growth process involving folding and binding of subsequent structural units. The agreement between the results of this simulation and experiment validates the principle of minimal frustration for heme-containing proteins. The agreement of theory with observation suggests that proteins with cofactors still have funneled landscapes. Experimental results that suggest sequential assembly in cytochrome c are indeed quite consistent with the modern energy landscape theory of protein folding.
Author contributions: P.G.W. designed research; P.W., C.Z., and P.G.W. performed research; and P.W., C.Z., and P.G.W. wrote the paper.
Abbreviation: GRY, green/red/yellow.
Footnotes
The profit fitting was performed by using the McLachlan algorithm.
References
- 1.Fersht, A. (1999) Structure and Mechanism in Protein Science: A Guide to Enzyme Catalysis and Protein Folding (Freeman, New York).
- 2.Gianni, S., Guydosh, N. R., Khan, F., Caldas, T. D., Mayor, U., White, G. W. N., DeMarco, M. L., Daggett, V. & Fersht, A. R. (2003) Proc. Natl. Acad. Sci. USA 100, 13286–13291. [DOI] [PMC free article] [PubMed] [Google Scholar]
- 3.Bryngelson, J. D., Onuchic, J. N., Socci, N. D. & Wolynes, P. G. (1995) Proteins 21, 167–195. [DOI] [PubMed] [Google Scholar]
- 4.Socci, N. D., Onuchic, J. N. & Wolynes, P. G. (1998) Proteins 32, 136–158. [PubMed] [Google Scholar]
- 5.Hardin, C., Eastwood, M., Luthey-Schulten, Z. & Wolynes, P. G. (2000) Proc. Natl. Acad. Sci. USA 97, 14235–14240. [DOI] [PMC free article] [PubMed] [Google Scholar]
- 6.Wolynes, P. G. (1997) Proc. Natl. Acad. Sci. USA 94, 6170–6175. [DOI] [PMC free article] [PubMed] [Google Scholar]
- 7.Ueda, Y., Taketomi, H. & Go, N. (1978) Biopolymers 17, 1531–1548. [Google Scholar]
- 8.Shoemaker, B. A., Wang, J. & Wolynes, P. G. (1999) J. Mol. Biol. 287, 675–694. [DOI] [PubMed] [Google Scholar]
- 9.Clementi, C., Jennings, P. A. & Onuchic, J. N. (2000) Proc. Natl. Acad. Sci. USA 97, 5871–5876. [DOI] [PMC free article] [PubMed] [Google Scholar]
- 10.Alm, E. & Baker, D. (1999) Proc. Natl. Acad. Sci. USA 96, 11305–11310. [DOI] [PMC free article] [PubMed] [Google Scholar]
- 11.Munoz, V. & Eaton, W. A. (1999) Proc. Natl. Acad. Sci. USA 96, 11311–11316. [DOI] [PMC free article] [PubMed] [Google Scholar]
- 12.Clementi, C., Nymeyer, H. & Onuchic, J. N. (2000) J. Mol. Biol. 298, 937–953. [DOI] [PubMed] [Google Scholar]
- 13.Clementi, C., Jennings, P. A. & Onuchic, J. N. (2001) J. Mol. Biol. 311, 879–890. [DOI] [PubMed] [Google Scholar]
- 14.Galzitskaya, O. V. & Finkelstein, A. V. (1999) Proc. Natl. Acad. Sci. USA 96, 11299–11304. [DOI] [PMC free article] [PubMed] [Google Scholar]
- 15.Koga, N. & Takada, S. (2001) J. Mol. Biol. 313, 171–180. [DOI] [PubMed] [Google Scholar]
- 16.Bai, Y., Sosnick, T. R., Mayne, L. & Englander, S. W. (1995) Science 269, 192–197. [DOI] [PMC free article] [PubMed] [Google Scholar]
- 17.Maity, H., Maity, M. & Englander, S. W. (2004) J. Mol. Biol. 343, 223–233. [DOI] [PubMed] [Google Scholar]
- 18.Rumbley, J., Hoang, L., Mayne, L. & Englander, S. W. (2001) Proc. Natl. Acad. Sci. USA 98, 105–112. [DOI] [PMC free article] [PubMed] [Google Scholar]
- 19.Jeng, M. F. & Englander, S. W. (1991) J. Mol. Biol. 221, 1045–1061. [DOI] [PubMed] [Google Scholar]
- 20.Maity, H., Maity, M., Krishna, M. M. G., Mayne, L. & Englander, S. W. (2005) Proc. Natl. Acad. Sci. USA 102, 4741–4746. [DOI] [PMC free article] [PubMed] [Google Scholar]
- 21.Wittung-Stafshede, P. (2002) Acc. Chem. Res. 35, 201–208. [DOI] [PubMed] [Google Scholar]
- 22.Friedrichs, M. S. & Wolynes, P. G. (1989) Science 246, 371–373. [DOI] [PubMed] [Google Scholar]
- 23.Sasai, M. & Wolynes, P. G. (1992) Phys. Rev. A 46, 7979–7997. [DOI] [PubMed] [Google Scholar]
- 24.Plotkin, S. S., Wang, J. & Wolynes, P. G. (1997) J. Chem. Phys. 106, 2932–2948. [Google Scholar]
- 25.Eastwood, M. P. & Wolynes, P. G. (2001) J. Chem. Phys. 114, 4702–4716. [Google Scholar]
- 26.Kolinski, A., Galazka, W. & Skolnick, J. (1996) Proteins 26, 271–287. [DOI] [PubMed] [Google Scholar]
- 27.Kaya, H. & Chan, H. S. (2005) Proteins 58, 31–44. [DOI] [PubMed] [Google Scholar]
- 28.Ejtehadi, M. R., Avall, S. P. & Plotkin, S. S. (2004) Proc. Natl. Acad. Sci. USA 101, 15088–15093. [DOI] [PMC free article] [PubMed] [Google Scholar]
- 29.Erman, B. (2001) Biophys. J. 81, 3534–3544. [DOI] [PMC free article] [PubMed] [Google Scholar]
- 30.Cárdenas, A. E. & Elber, R. (2003) Proteins 51, 245–257. [DOI] [PubMed] [Google Scholar]
- 31.Ryckaert, J., Ciccotti, G. & Berendsen, H. (1977) J. Comp. Phys. 23, 327–341. [Google Scholar]
- 32.Kumar, S., Rosenberg, J. M., Bouzida, D., Swendsen, R. H. & Kollman, P. A. (1992) J. Comput. Chem. 13, 1011–1021. [Google Scholar]
- 33.McLachlan, A. D. (1982) Acta Crystallogr. A 38, 871–873. [Google Scholar]
- 34.Portman, J. J., Takada, S. & Wolynes, P. G. (2001) J. Chem. Phys 114, 5069–5081. [Google Scholar]
- 35.Shen, T., Hofmann, C. P., Oliveberg, M. & Wolynes, P. G. (2005) Biochemistry 44, 6433–6439. [DOI] [PubMed] [Google Scholar]
- 36.Hagen, S. J. & Eaton, W. A. (2000) J. Mol. Biol. 297, 781–789. [DOI] [PubMed] [Google Scholar]
- 37.Lyubovitsky, J. G., Gray, H. B. & Winkler, J. R. (2002) J. Am. Chem. Soc. 124, 14840–14841. [DOI] [PubMed] [Google Scholar]
- 38.Zhong, S., Rousseau, D. L. & Yeh, S. (2004) J. Am. Chem. Soc. 126, 13934–13935. [DOI] [PubMed] [Google Scholar]
- 39.Krantz, B. A., Mayne, L., Rumbley, J., Englander, S. W. & Sosnick, T. R. (2002) J. Mol. Biol. 324, 359–371. [DOI] [PubMed] [Google Scholar]
- 40.Panchenko, A. R., Luthey-Schulten, Z. & Wolynes, P. G. (1996) Proc. Natl. Acad. Sci. USA 93, 2008–2013. [DOI] [PMC free article] [PubMed] [Google Scholar]
- 41.Go, M. (1985) Adv. Biophys. 19, 91–131. [DOI] [PubMed] [Google Scholar]
- 42.Shoemaker, B. A. & Wolynes, P. G. (1999) J. Mol. Biol. 287, 657–674. [DOI] [PubMed] [Google Scholar]
- 43.Shea, J. E. & Onuchic, J. N. (1999) Proc. Natl. Acad. Sci. USA 96, 12512–12517. [DOI] [PMC free article] [PubMed] [Google Scholar]


