

Abstract
The ability to investigate the transcription of thousands of genes concurrently by using DNA microarrays offers both major scientific opportunities and significant analytical challenges. Here we describe gabriel, a rule-based system of computer programs designed to apply domain-specific and procedural knowledge systematically and uniformly for the analysis and interpretation of data from DNA microarrays. gabriel's problem-solving rules direct stereotypical tasks, whereas domain-specific knowledge pertains to gene functions and relationships or to experimental conditions. Additionally, gabriel can learn novel rules through genetic algorithms, which define patterns that best match the data being analyzed and can identify groupings in gene expression profiles preordered by chromosomal position or by a nonsupervised algorithm such as hierarchical clustering. gabriel subsystems explain the logic that underlies conclusions and provide a graphical interface and interactive platform for the acquisition of new knowledge. The present report compares gabriel's output with published findings in which expert knowledge has been applied post hoc to microarray groupings generated by hierarchical clustering.
Keywords: gabriel‖machine learning
Although DNA microarrays now enable the expression of thousands of genes to be assessed simultaneously at the transcription level, the interpretation of microarray data remains a significant challenge. Analysis of microarrays has used both unsupervised methods that group genes showing quantitative similarities in expression (see reviews in refs. 1–3) and approaches that exploit machine knowledge in a supervised manner during the course of gene grouping (e.g., refs. 4–8). While unsupervised methods such as hierarchical clustering, K-means clustering, and the generation of self-organizing maps are entirely statistical, the assignment of biological relevance to the resulting gene groupings involves the post hoc application of knowledge, and interpretation may vary widely according to the expertise and experience of individual users. Often, the parameters used to produce sensible classifications are not explicitly defined or transparent to others.
Expert knowledge can be incorporated into computer systems to accomplish defined tasks and can be formulated as rules that consist of premises and conclusions. One of the earliest rule-based systems to focus successfully on a biomedical problem was mycin, which used modules of knowledge acquired from infectious disease experts to analyze clinical and laboratory data and make recommendations to physician practitioners for the diagnosis and treatment of infections (9–11). The premises of each mycin rule contained conditions that, if satisfied, allowed a specified conclusion to be made. mycin also could explain in English how a conclusion was reached by reciting the premises on which it was based and could gain new knowledge by a rule-acquisition function. mycin rules were discrete and largely independent, allowing the program to flexibly increase its base of knowledge (9, 10, 12). The mycin inference engine emycin and its successors have since been used for a variety of diagnostic purposes (13–17).
Here we describe gabriel (Genetic Analysis By Rules Incorporating Expert Logic), a rule-based computer system designed to apply domain-specific and procedural knowledge systematically for the analysis and interpretation of data from DNA microarrays. gabriel, which has some of the key features of mycin, stores knowledge in the form of preformatted rules or as rules acquired from users through a graphical interface; it then applies this knowledge during the process of gene classification. A rule-explanation capability makes explicit and transparent to users the criteria and reasoning used by gabriel to generate groupings. The knowledge contained in gabriel rules also allows inferences to be made about the significance of changes in gene expression, the mechanisms underlying these changes, and genetic regulatory relationships. This initial description of gabriel compares the program's output with published conclusions reached by investigators that have interpreted microarray results generated by hierarchical clustering (18).
Methods and Results
Description of gabriel.
gabriel includes three components that were also integral to mycin (9, 10) (Fig. 1): a consultation system that applies rules to analyze and interpret microarray data, an explanation module that indicates the basis for conclusions (for example, by indicating why a particular gene expression profile satisfies the premises of a rule while another profile does not), and a rule acquisition module, which provides a graphical and verbal interface that allows users to build new rules or modify existing ones. The format for gabriel rules is
Figure 1.

Flow chart and outline of gabriel architecture. The principal gabriel subsystems described in the text are indicated. The consultation module accesses the rule base, which contains both domain knowledge and procedural knowledge, and applies this knowledge to the analysis of data. Core rules included in the rule base have been created by the authors using biological and statistical knowledge; the latter type of knowledge is incorporated into data-quality rules that evaluate the reliability of results and assist users in choosing appropriate parameter settings. The explanation module can indicate to a user which premises of rules were or were not satisfied by a particular gene expression profile (see text). Users can also enter new rules or modify existing ones by using graphical or textual interfaces of the rule acquisition module, and these rules can be stored in the rule base for future analyses. Additionally, the machine learning module of gabriel, which includes the GA pattern-search algorithm and a continuity/gap algorithm, can learn rules directly from the dataset and save them in the rule base.
IF Premise 1 OP Premise 2 …
THEN Conclusion A …
ELSE Conclusion B …,
where OP is a logical operator, which can be AND, OR, or NOR (i.e., neither).
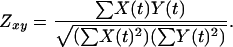
Four general types of rules currently are used by gabriel. Pattern-based rules identify genes whose expression profiles conform quantitatively and temporally to specified conditions. Proband-based rules identify genes (e.g., gene Y) whose profiles are similar in configuration to that of a specified gene or group of genes (i.e., the proband, gene X). Similarity is defined by a modified Pearson correlation coefficient formula that substitutes a zero center, for mean-center, correlation coefficient (Zxy) (19), where X(t) is the expression level of the proband gene at time t and Y(t) is the expression level of the gene being tested. The basic proband rule selects genes whose correlation coefficient, with respect to the proband(s), is greater than a user-specified or default threshold and sorts them according to extent of correlation.
 |
This mode of use of correlation coefficient allows users to identify gene expression profiles that correlate negatively with the proband's or the profiles of genes whose up- or down-regulation temporally anticipates or follows the proband's by a specified interval. Rules that execute these tasks are described in Figs. 5–9 and Tables 1–3, which are published as supporting information on the PNAS web site, www.pnas.org.
Data-quality rules examine the reliability of the dataset and assess the certainty of conclusions reached by gabriel. A signal-to-noise ratio algorithm determines whether a change in expression consequent to the event being analyzed (signal) exceeds the variation occurring in the absence of the event (noise); similar algorithms have been used previously in information systems, telecommunication systems, and medical imaging systems to analyze data quality (20–22). Another data-quality rule that uses bootstrapping statistical algorithms (23–25) randomly permutes gene expression data from different time points to further assess the effects of experimental noise and determine the chances of a conclusion being false (i.e., the false discovery rate, FDR). The output from data-quality rules may lead a user to modify threshold values, for example, to examine the effects of a threshold alteration on a FDR that is unacceptably high. Mechanism/causality rules enable gabriel to infer causality from experimentally induced perturbations (for example, a particular mutation, or whether protein synthesis, phosphorylation, proteolysis, etc., was required for an observed alteration in transcription); such analyses may involve chaining of the conclusions of one rule with premises of another.
A key component of gabriel is a machine learning system that enables the program to also learn new rules directly from data (Fig 1). Pattern-search rules learned by gabriel are designed to identify relationships in a preordered dataset or to select randomly generated patterns that match observed gene expression profiles. gabriel's continuity/gap algorithm (Fig. 6) can detect profile similarities in a dataset generated, for example, by hierarchical clustering or by the congruence of expression level with chromosomal position. This algorithm calculates the correlation coefficient between two contiguous nodes (e.g., the levels of expression for genes A and B), generates the continuity AB if the value exceeds a defined threshold, and then determines the extent of correlation between expression of each succeeding gene and the previous one—until the correlation coefficient falls below the threshold, breaking the continuity and producing a “gap.” When the number of genes in a continuity exceeds a user-defined threshold and any gaps remain shorter than a specified value, the continuity is terminated, identifying and delineating a group of genes whose expression profiles are similar. As values for continuity length, gap length, and threshold of correlation are specified by users, the criteria for selection are explicit and can be stated in a rule format. A related rule (the continuity/proband rule) averages the parameters of expression for genes within a continuity and uses this value to identify genes that may appear at other locations in a dendrogram—thus effectively allowing inclusion of a gene in multiple clusters. These rules have proved useful for learning new probands from a dataset and for identifying groups of coordinately regulated and linearly contiguous genes on bacterial chromosomes (26). Genes identified by gabriel can be members of multiple groupings (e.g., gene A can simultaneously be a member of the coordinately regulated gene group A, a regulator of gene B, and a target of gene C).
Genetic algorithms (GAs), which use the concepts of mutation, recombination, and survival of the fittest to evolve a population of patterns were invented by Holland (27). They have been used previously to automate computer programming (28), predict interactions between proteins (29, 30), analyze biomolecular sequence alignment and RNA folding (31, 32), identify structure-activity relationships (33), and reverse-engineer metabolic pathways (34). gabriel's GA (Fig. 2) evolves patterns that fit gene expression profiles generated from DNA microarrays. Parameters derived from first-generation patterns are mutated, recombined, and reproduced as components of premises that test subsequent generations of patterns for increasingly better match, as determined by the number of genes selected and the FDR of the pattern (Fig. 2). The parameters that define such patterns can then be used as templates for pattern-based analyses, and the gene expression profiles as selected can be used individually or collectively as probands. The GA capability of gabriel automatically can also explore hypothesis space in a data-driven manner, identifying patterns that previously may not have been hypothesized to exist.
Figure 2.

Flow chart representation of pattern searching by gabriel's GA. The examples show profiles of gene expression relative to a specified threshold level over a time course. The dotted areas indicate expression >0 and the crosshatched areas indicate expression <0. The rule generates a set of random profiles and identifies those that correspond to actual profiles in the dataset. The criteria for determining whether a profile will survive are its ability to select a greater number of genes that fit and to concurrently yield an FDR rate below the threshold specified by the user. Profiles satisfying these criteria are retained, and the others are discarded. In the following cycles, surviving profiles undergo random mutation and crossover to generate descendants. Each descendant profile is compared with its parent and the one selecting a larger number of genes having an acceptable FDR. Once a pattern of profiles is stable, i.e., no descendant profile is found that matches the data better than the parental profile, this pattern lineage stops evolving and is stored. Additional randomly generated profiles are searched for additional fits with the data, and the process is repeated. The GA pattern search algorithm terminates its analysis when no new matching patterns can be found in the dataset.
gabriel uses structural knowledge, procedural knowledge, and support knowledge synergistically. Structural knowledge [domain knowledge (35); ontologies (17, 36)], which is contained in the premises and conclusions of rules, defines relationships and concepts such as gene function, experimental conditions, and chromosomal position [for example, that c-fos is an immediate/early (I/E) response gene]. Procedural knowledge (problem-solving methods, strategic knowledge) defines preferred methods and abstract algorithms for achieving solutions to stereotypical tasks (for example, identifying genes whose correlation coefficient for expression with a particular proband gene is greater than a user-defined threshold). Support knowledge defines the rationale for heuristic and other relationships, indicating, for example, that the expression profile of a target gene corresponds to the profile of a regulator gene except for a time delay and helps users to understand why and when to use a specific analytical approach. Support knowledge is incorporated in the form of axiomatic premises, which may be explainable only in terms of the knowledge itself rather than by the chaining of a premise to the conclusion(s) of other rules. It is not a component of rules but may be needed to understand them.
gabriel can accept files containing microarray data and/or files containing other information such as gene lists and annotations. Additional information about gabriel is available at http://gabriel.stanford.edu.
cDNA Microarray Analysis by gabriel.
We used gabriel to analyze a dataset containing 517 genes that showed altered transcription in human foreskin fibroblasts after the addition of serum to growth-arrested cultures; this dataset, which was published by Iyer et al. (18), was downloaded from http://genome-www.stanford.edu/serum/. Our goals were to assess gabriel's ability to interpret these microarray data and to identify similarities and differences between gabriel's conclusions and those previously reported (18). The rules gabriel learned for this analysis were determined by us based on known information about the effects of serum addition on the biology of human fibroblasts (37–40), and the premises and conclusions were independent of the Iyer et al. results. We also wanted to investigate the applicability of other gabriel features, such as its continuity/gap algorithms, GAs, and data-quality rules for analysis of the dataset.
In this analysis, gabriel focused on identifying genes whose expression responds promptly to the addition of serum to growth-arrested cells. Specifically, a gabriel event-response pattern-based rule was used to find genes whose transcription in the Iyer et al. dataset was progressively elevated immediately and/or early after serum addition and then either returned to the baseline or remained high during multiple subsequent samplings. Application of this rule requires the setting of parameters that define terms such as elevated, baseline, immediately, remained, and short period, which were not explicitly defined in the Iyer et al. analysis. We designated 15 min to 1 h after serum addition as the I/E period. We considered elevation to require at least a 2-fold change (as 1 after transformed into base 2 logarithm) in gene expression at each of the time points, and baseline as a zone between the boundaries of +1 and −1 (log value). gabriel was informed of these choices through a graphical interface (Fig 3A), and using a rule-translation function, converted the I/E pattern specified in the graph into text format:
Figure 3.

gabriel analyses. (A) Graphical interface showing parameters selected by user for the I/E event response rule. Sampling times during the experiment are designated by using entry boxes and are represented on the x axis. The y axis represents the gene expression level after the base-2 logarithm transformation. Entry boxes allow users to define maximum and minimum thresholds for zones (green region) of expression at each time point; in indicates infinity. Zones defined in this interface are translated by gabriel into a textual representation of the rule. Activation of the search identifies gene expression profiles that satisfy the specified parameters. In this example, the user wants to find genes whose expression is defined to increase gradually from 0.25 h to 1 h after serum addition, reach a peak at 2 h, decrease to the baseline by 6 h, and remain there throughout the duration of the experiment. The black line within the green zone is the profile of an expressed sequence tag (AA016305) selected by this rule but not included in the I/E response gene cluster (cluster E) of Iyer et al. (18). The red line (expressed sequence tag SID381836), which was included in cluster E, falls outside the defined parameters (green zone) at the one- and two-time points and was not selected by this gabriel rule. (B) Genes identified by the rule defined by parameters shown in A. The display style follows that of Eisen et al. (41): log ratios of 0 (unchanged) are shown as black, positive ratios (up-regulation) are represented by red, and negative ratios (down-regulation) are represented by green. The intensity is increased to correspond to the experimentally determined ratios. Genes common to the I/E response cluster E in figure 2 of Iyer et al. (18) are designated by *. The FDR was calculated by random permutation rule by randomly shuffling the expression level at different time points more than 100 times and used to estimate the statistical probability (0.3 in this case) of spurious assignment of a profile to a defined pattern. (C) Genes identified by a c-fos proband-based rule. The c-fos gene was designated as proband, and 0.8 correlation coefficient over 11 time points was the specified threshold. Genes were sorted according to their correlation coefficient (the first numbers on each row) with c-fos. Including c-fos, five of the genes selected by gabriel (designated by *) were in cluster E, a seven-gene c-fos-containing hierarchical cluster chosen by Iyer et al.
IF the gene expression level
at 15 min is higher than −1.0
AND at 30 min is higher than 0.0
AND at 1 h is higher than 1.0
AND at 2 h is higher than 0.0
AND at 4 h is higher than −1.0 and lower than 2.0
AND at 6 h is higher than −1.0 and lower than 1.0
AND at 8 h is higher than −1.0 and lower than 1.0
AND at 12 h is higher than −1.0 and lower than 1.0
AND at 16 h is higher than −1.0 and lower than 1.0
AND at 20 h is higher than −1.0 and lower than 1.0
AND at 24 h is higher than −1.0 and lower than 1.0
THEN conclude that this gene demonstrates the expression characteristics of an I/E response gene.
Application of this rule to the Iyer et al. (18) dataset selected 10 genes whose expression profiles conformed to the indicated pattern (Fig. 3B). Six of these were in common with Iyer et al.'s cluster E, which the authors identified by inspection of a dendrogram generated by hierarchical clustering (41). Among the four genes that fulfilled the specified gabriel criteria but were not present in cluster E, three (those encoding junB, CPBP, and ribosomal protein S5) had been assigned by Iyer et al. to a cluster (cluster J), whose elevated expression after serum addition continued for a more-extended period; one, whose expression rose during I/E and decreased below the baseline after 6 h, had been assigned to cluster C.
Expressed sequence tag 381836, which Iyer et al. had included in cluster E, was not selected by gabriel's I/E rule. We applied the rule explanation function to learn why and were advised that the expression level for this gene at the 6-h and 12-h time points did not exceed the minimum threshold (−1) we had specified for basal level (see Table 1). Lowering the minimum threshold for basal level from −1.0 to −1.2 produced a grouping that included expressed sequence tag 381836, but also contained two other genes not present in cluster E (dihydropyrimidinase-related protein 3 and Gem GTPase), suggesting that the unnamed parameters used by Iyer et al. to define cluster E differ from the indicated gabriel I/E rule parameters by more than simply the baseline threshold.
As noted above, gabriel calculates the FDR by random occurrence by randomly shuffling the expression levels observed at different times. This procedure statistically evaluates the possibility that an expression profile was assigned spuriously to the I/E group by the pattern-based rule (Fig. 3B; FDR = 0.3 in this instance). Further analysis indicated that one of the 10 genes selected by the I/E rule (i.e., the gene encoding ribosomal protein S5) did not pass signal-to-noise ratio scrutiny (Table 2). The reason was provided by gabriel's rule explanation function: although the ratio of two channels for S5 gene expression satisfied the I/E thresholds we specified, the absolute value of the change in expression was not statistically significant. Application of the signal-to-noise ratio algorithm to the I/E rule output decreased the FDR from 0.3 to 0.07, providing statistical evidence of the utility of the signal-to-noise ratio algorithm in maintaining data quality. Other statistical capabilities of gabriel enable the program to infer expression profiles when a data point is absent or grossly aberrant (data not shown).
Proband-Based Analysis by gabriel.
The c-fos gene, whose pattern of expression after serum addition is characteristic of the I/E response (38), was chosen as proband and used to identify similarly regulated genes in the Iyer et al. dataset. The analysis used a Pearson correlation coefficient formula modified from a “mean center” to “zero center” algorithm and a correlation coefficient of >0.8 over 11 time points. All seven genes selected were members of the group identified by the pattern-based I/E rule displayed in Fig 3A; the expression patterns and correlation coefficients relative to c-fos are shown in Fig. 3C. Expression of junB, which also was present in the I/E grouping, is known to respond immediately to serum addition (40). However, junB gene expression remains elevated for a longer period than c-fos (39, 40), and when junB was the designated proband, a set of 21 expression profiles that overlapped only partially with the junB grouping was selected (compare Fig. 3C with Fig. 7). The nonoverlapping profiles define a separate subcategory of genes induced by serum addition. gabriel explained that serum-induced expression of these genes was prolonged at too high a level to conform to the conditions specified for either the I/E rule or c-fos-proband-based selection (Table 3).
Pattern Search Analysis by gabriel.
A central goal of most microarray analyses is to detect patterns (i.e., systems in which data are discernibly organized according to the interrelationship of component parts) among gene expression profiles (i.e., sets of data that portray the features of gene expression under specified conditions). When parameters that define a pattern are not specified and no known proband provides a model for the pattern, gabriel can use its continuity/gap algorithm and GAs to create gene groupings. We applied the continuity/gap algorithm (Fig. 6) to analyze the expression profiles of 517 genes that Iyer et al. had grouped by hierarchical clustering. We required dendrogram continuities of at least four genes coregulated with a correlation coefficient of >0.5 and designated an acceptable dendrogram gap not exceeding one gene. Among 19 continuities that gabriel identified by using these parameters, five corresponded closely to clusters E, F, G, I, and J of Iyer et al. (shown for clusters E and J in Fig 4A). Iyer et al. clusters that included more than 30 genes (e.g., clusters A, B, C, D, and H) contained 2–4 gabriel-selected continuities whose beginning and end aligned well with Iyer et al. cluster boundaries, and most continuities found by gabriel corresponded precisely to dendrogram subclusters. However, when chained to the continuity-proband rule, gabriel detected additional continuities not found by Iyer et al.'s analysis of hierarchical clustering dendrograms (Fig. 8).
Figure 4.

Application of the continuity/gap and GA rules. (A) Continuities identified by continuity/gap algorithm. (Upper) Shown is a continuity that includes seven genes that had been assigned to cluster E by Iyer et al. (Lower) All components of the continuity, which contains junB, were included in cluster J by Iyer et al. Additional profiles in cluster J were not selected by this gabriel rule because they did not have a correlation coefficient higher than the threshold specified for the continuity. (B) Examples of patterns identified by GA-based pattern search rule (Fig. 2). In this application of GA pattern search rule, each pattern was required to include at least three genes and have a FDR of less than 0.2. Patterns 1 and 2 were generated randomly and found by gabriel to fit closely with expression profiles in the dataset. Pattern 1 corresponds to the I/E grouping defined by the parameters shown in Fig. 3A (i.e., serum-induced expression not sustained for an extended period). Pattern 2 corresponds to an I/E response with sustained high expression level. Age represents the number of generations that GA algorithm used to evolve the patterns. The ages of patterns 1 and 2 are 31. The FDR was estimated from the random permutation rule; in indicates infinity.
gabriel's GA (Fig. 2) can select gene expression patterns in populations of profiles that have not been preordered. GA analysis of the Iyer et al. dataset through multiple generations of pattern evolution discovered 10 patterns that showed a FDR rate lower than 0.3. Among these were a pattern having parameters nearly identical to those we specified in our search for I/E genes (Fig. 4A), and a pattern that showed serum-induced expression that remained elevated for an extended period (Fig. 4B). The ability of the gabriel GA to examine a dataset fully and without bias also produced gene groupings that were not detected by either Iyer et al.'s analysis or by our continuity/gap analysis of the Iyer et al. dendrograms (Fig. 9A). Interestingly, we found that the GA was capable of distinguishing between expression profiles having subtle differences not readily apparent by visual scanning of data (Fig. 9B).
Discussion
gabriel was designed to apply knowledge consistently and systematically to the analysis of microarray data. The knowledge it contains can select gene expression profiles that satisfy specified criteria, create novel populations of patterns and identify those that fit the dataset, and generate gene groupings from profiles preordered by nonsupervised learning algorithms. The formatting of gabriel knowledge in rules enables the program to readily indicate the basis for its decisions and also facilitates the acquisition of new knowledge from users. Rules that evaluate the quality of the data being analyzed can be chained to pattern-based or proband-based rules to extend the scope of gabriel conclusions.
Here we have illustrated certain gabriel features by analyzing a previously published microarray dataset. Although our goal was not to determine specifically whether gabriel could reproduce the conclusions reached during the Iyer et al. team's post hoc analysis of hierarchical clusters of gene expression profiles, we nevertheless found considerable overlap between gabriel's findings and those of Iyer et al. In instances where the results differed, the gabriel rule explanation function indicated the statistical or threshold parameters responsible for the differences. We also found that application of gabriel's pattern-based and proband-based rules identified novel and previously undetected gene expression relationships in the Iyer et al. dataset and that the gabriel GA discovered patterns not found in the Iyer et al. analysis or anticipated by us.
Used in conjunction with the FDR rule to estimate the incidence of falsely discovered continuities, gabriel's continuity/gap algorithm has proved to be a robust and useful method for learning probands when they have not been defined by the user, and also for assessing the effects of time-independent variables such as chromosomal position (26). Potentially, the domain ontology of gabriel and its data-quality rules will also enable the elucidation of multivariate relationships among samples having similar or disparate properties.
Correlation coefficient has been used in algorithms used previously for microarray analysis, including hierarchical clustering and nearest-neighbor approaches (42). However, its mode of use in gabriel's proband-based rules enables both positive and negative correlations and also correlations that show a time delay or advance—concepts that are not easily represented by a hierarchical tree. Additionally, the architecture of gabriel facilitates integration of the correlation coefficient with other rules and its inclusion as a component of composite rules. Similarly, it facilitates the combination of statistical approaches such as bootstrapping (23, 43) and ANOVA (19) with gene search rules for assessment of data reliability.
gabriel differs from other systems that use machine knowledge in a supervised manner to analyze DNA microarray data [e.g., support vector machines (4, 5), rough set (6), splash (7), and probabilistic relational models (8)] in providing a rule-based platform that synergistically integrates domain ontologies with methods of statistical analysis and problem solving. Although the gabriel platform has been applied here only to microarray analysis, our results suggest that its key features (e.g., explicitness of the reasoning process, uniform application of knowledge, ability to systematically explore a dataset using criteria of different stringency, and ability to combine different types of knowledge) may also be useful for analysis of large datasets generated by other types of genomic and proteomic approaches.
Supplementary Material
Acknowledgments
We thank R. B. Altman, D. Botstein, M. Musen, T. C. Rindfleish, and E. H. Shortliffe for their helpful comments on the manuscript. This work was supported by Grants MDA972–00-1–0032 and N65236–99-1–5425 to S.N.C. from the U.S. Defense Advanced Research Projects Agency. K.-H.P. was supported by a Stanford Graduate Fellowship.
Abbreviations
- gabriel
Genetic Analysis By Rules Incorporating Expert Logic
- GA
genetic algorithm
- FDR
false discovery rate
- I/E
immediate/early
References
- 1.Quackenbush J. Nat Rev Genet. 2001;2:418–427. doi: 10.1038/35076576. [DOI] [PubMed] [Google Scholar]
- 2.Sherlock G. Curr Opin Immunol. 2000;12:201–205. doi: 10.1016/s0952-7915(99)00074-6. [DOI] [PubMed] [Google Scholar]
- 3.Brazma A, Vilo J. FEBS Lett. 2000;480:17–24. doi: 10.1016/s0014-5793(00)01772-5. [DOI] [PubMed] [Google Scholar]
- 4.Brown M P, Grundy W N, Lin D, Cristianini N, Sugnet C W, Furey T S, Ares M, Jr, Haussler D. Proc Natl Acad Sci USA. 2000;97:262–267. doi: 10.1073/pnas.97.1.262. [DOI] [PMC free article] [PubMed] [Google Scholar]
- 5.Furey T S, Cristianini N, Duffy N, Bednarski D W, Schummer M, Haussler D. Bioinformatics. 2000;16:906–914. doi: 10.1093/bioinformatics/16.10.906. [DOI] [PubMed] [Google Scholar]
- 6.Hvidsten T R, Komorowski J, Sandvik A K, Laegreid A. Pac Symp Biocomput. 2001;6:299–310. doi: 10.1142/9789814447362_0030. [DOI] [PubMed] [Google Scholar]
- 7.Califano A, Stolovitzky G, Tu Y. Proc Int Conf Intell Syst Mol Biol. 2000;8:75–85. [PubMed] [Google Scholar]
- 8.Segal E, Taskar B, Gasch A, Friedman N, Koller D. Bioinformatics. 2001;17, Suppl. 1:S243–S252. doi: 10.1093/bioinformatics/17.suppl_1.s243. [DOI] [PubMed] [Google Scholar]
- 9.Shortliffe E H, Davis R, Axline S G, Buchanan B G, Green C C, Cohen S N. Comput Biomed Res. 1975;8:303–320. doi: 10.1016/0010-4809(75)90009-9. [DOI] [PubMed] [Google Scholar]
- 10.Shortliffe E H. Computer-Based Medical Consultations,mycin. New York: Elsevier; 1976. [Google Scholar]
- 11.Shortliffe E H, Axline S G, Buchanan B G, Merigan T C, Cohen S N. Comput Biomed Res. 1973;6:544–560. doi: 10.1016/0010-4809(73)90029-3. [DOI] [PubMed] [Google Scholar]
- 12.Davis R, Buchanan B G, Shortliffe E H. Artif Intell. 1977;8:15–45. [Google Scholar]
- 13.Davis R. Artif Intell. 1979;12:121–158. [Google Scholar]
- 14.Yu V L, Buchanan B G, Shortliffe E H, Wraith S M, Davis R, Scott A C, Cohen S N. Comput Progr Biomed. 1979;9:95–102. doi: 10.1016/0010-468x(79)90022-9. [DOI] [PubMed] [Google Scholar]
- 15.Miller R A, Pople H E, Jr, Myers J D. N Engl J Med. 1982;307:468–476. doi: 10.1056/NEJM198208193070803. [DOI] [PubMed] [Google Scholar]
- 16.Mulsant B, Servan-Schreiber D. Comput Biomed Res. 1984;17:71–91. doi: 10.1016/0010-4809(84)90007-7. [DOI] [PubMed] [Google Scholar]
- 17.Musen M A. In: Knowledge Engineering and Agent Technology. Cuena J, Demazeau Y, Garcia A, Treur J, editors. Vol. 52. Amsterdam: IOS; 2002. , in press. [Google Scholar]
- 18.Iyer V R, Eisen M B, Ross D T, Schuler G, Moore T, Lee J C, Trent J M, Staudt L M, Hudson J, Jr, Boguski M S, et al. Science. 1999;283:83–87. doi: 10.1126/science.283.5398.83. [DOI] [PubMed] [Google Scholar]
- 19.Heiman G W. Basic Statistics for the Behavioral Sciences. New York: Houghton Mifflin; 2000. [Google Scholar]
- 20.Carlson A B, Crilly P B, Rutledge J C. Communications Systems: An Introduction to Signals and Noise in Electrical Communications. New York: McGraw–Hill; 2001. [Google Scholar]
- 21.Cover T, Thomas J. Elements of Information Theory. New York: Wiley; 1991. [Google Scholar]
- 22.Makovsky A. Medical Imaging Systems. Englewood Cliffs, NJ: Prentice–Hall; 1983. [Google Scholar]
- 23.Efron B. Annals Statistics. 1979;7:1–26. [Google Scholar]
- 24.Kerr M K, Churchill G A. Proc Natl Acad Sci USA. 2001;98:8961–8965. doi: 10.1073/pnas.161273698. [DOI] [PMC free article] [PubMed] [Google Scholar]
- 25.Tusher V G, Tibshirani R, Chu G. Proc Natl Acad Sci USA. 2001;98:5116–5121. doi: 10.1073/pnas.091062498. [DOI] [PMC free article] [PubMed] [Google Scholar]
- 26.Huang J Q, Lih C-J, Pan K-H, Cohen S N. Genes Dev. 2001;15:3183–3192. doi: 10.1101/gad.943401. [DOI] [PMC free article] [PubMed] [Google Scholar]
- 27.Holland J H. Adaptations in Natural and Artificial Systems. Ann Arbor: Univ. of Michigan Press; 1975. [Google Scholar]
- 28.Koza J. Genetic Programming: On the Programming of Computers by Means of Natural Selection (Complex Adaptive Systems) Cambridge, MA: MIT Press; 1992. [Google Scholar]
- 29.Raymer M L, Sanschagrin P C, Punch W F, Venkataraman S, Goodman E D, Kuhn L A. J Mol Biol. 1997;265:445–464. doi: 10.1006/jmbi.1996.0746. [DOI] [PubMed] [Google Scholar]
- 30.Gardiner E J, Willett P, Artymiuk P J. Proteins. 2001;44:44–56. doi: 10.1002/prot.1070. [DOI] [PubMed] [Google Scholar]
- 31.Zhang C, Wong A K. Comput Appl Biosci. 1997;13:565–581. doi: 10.1093/bioinformatics/13.6.565. [DOI] [PubMed] [Google Scholar]
- 32.Shapiro B A, Wu J C, Bengali D, Potts M J. Bioinformatics. 2001;17:137–148. doi: 10.1093/bioinformatics/17.2.137. [DOI] [PubMed] [Google Scholar]
- 33.Fan Y, Shi L M, Kohn K W, Pommier Y, Weinstein J N. J Med Chem. 2001;44:3254–3263. doi: 10.1021/jm0005151. [DOI] [PubMed] [Google Scholar]
- 34.Koza J R, Mydlowec W, Lanza G, Yu J, Keane M A. Pac Symp Biocomput. 2001;6:434–445. doi: 10.1142/9789814447362_0043. [DOI] [PubMed] [Google Scholar]
- 35.Clancey W J. Artif Intell. 1983;20:215–251. [Google Scholar]
- 36.Musen M A. Methods Inf Med. 1998;37:540–550. [PubMed] [Google Scholar]
- 37.Jahner D, Hunter T. Mol Cell Biol. 1991;11:3682–3690. doi: 10.1128/mcb.11.7.3682. [DOI] [PMC free article] [PubMed] [Google Scholar]
- 38.Greenberg M E, Ziff E B. Nature (London) 1984;311:433–438. doi: 10.1038/311433a0. [DOI] [PubMed] [Google Scholar]
- 39.Ryder K, Lau L F, Nathans D. Proc Natl Acad Sci USA. 1988;85:1487–1491. doi: 10.1073/pnas.85.5.1487. [DOI] [PMC free article] [PubMed] [Google Scholar]
- 40.Lau L F, Nathans D. Proc Natl Acad Sci USA. 1987;84:1182–1186. doi: 10.1073/pnas.84.5.1182. [DOI] [PMC free article] [PubMed] [Google Scholar]
- 41.Eisen M B, Spellman P T, Brown P O, Botstein D. Proc Natl Acad Sci USA. 1998;95:14863–14868. doi: 10.1073/pnas.95.25.14863. [DOI] [PMC free article] [PubMed] [Google Scholar]
- 42.Troyanskaya O, Cantor M, Sherlock G, Brown P, Hastie T, Tibshirani R, Botstein D, Altman R B. Bioinformatics. 2001;17:520–525. doi: 10.1093/bioinformatics/17.6.520. [DOI] [PubMed] [Google Scholar]
- 43.Efron B, Tibshirani R. An Introduction to the Bootstrap. New York: Chapman & Hall/CRC; 1994. [Google Scholar]
Associated Data
This section collects any data citations, data availability statements, or supplementary materials included in this article.