

SUMMARY
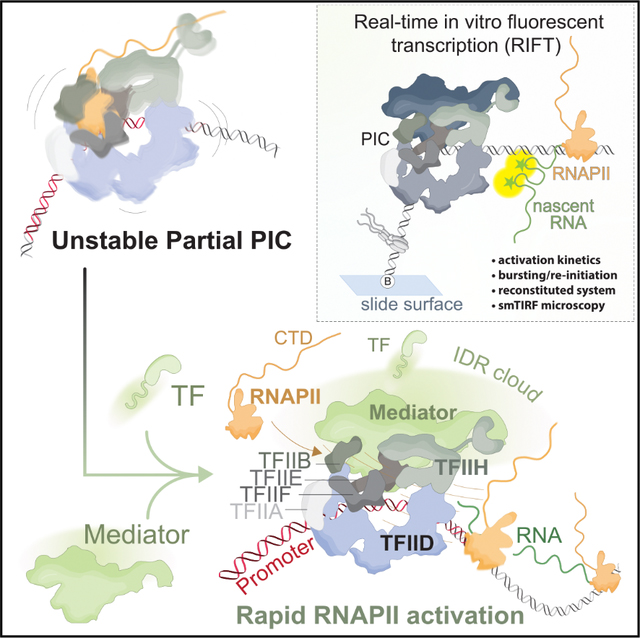
RNA polymerase II (RNAPII) is regulated by sequence-specific transcription factors (TFs) and the pre-initiation complex (PIC): TFIIA, TFIIB, TFIID, TFIIE, TFIIF, TFIIH, and Mediator. TFs, Mediator, and RNAPII contain intrinsically disordered regions (IDRs) and form phase-separated condensates, but how IDRs control RNAPII function remains poorly understood. Using purified PIC factors, we developed a real-time in vitro fluorescence transcription (RIFT) assay for second-by-second visualization of transcription at hundreds of promoters simultaneously. Our results establish IDRs as essential for rapid RNAPII activation, without condensate formation. For example, HSF1 condensates and single molecules function identically, whereas MED1-IDR can functionally replace HSF1 but activates RNAPII with slower kinetics. Through their IDRs, Mediator and TFs rapidly and synergistically activate RNAPII bursting and re-initiation, and surprisingly, Mediator drives TF-promoter recruitment without TF-DNA binding. Importantly, RIFT directly addresses questions largely intractable with cell-based methods, yielding mechanistic insights about condensates, IDRs, enhancer-promoter communication, and RNAPII bursting that complement live-cell imaging data.
In brief
Palacio and Taatjes develop a method that combines biochemical reconstitution of RNAPII transcription with smTIRF microscopy. Mechanistic insights include Mediator requirements for rapid TF-dependent RNAPII activation and re-initiation, experimental evidence supporting re-initiation via a PIC scaffold assembly, and direct functional comparison of molecular condensates vs. single molecules.
Graphical Abstract
INTRODUCTION
The core regulatory assembly for RNA polymerase II (RNAPII) transcription initiation is the 4.0 MDa pre-initiation complex (PIC), which consists of transcription factor (TF) IIA, TFIIB, TFIID, TFIIE, TFIIF, TFIIH, RNAPII, and Mediator.1 Over many decades, biochemical experiments have elucidated mechanisms through which the PIC regulates RNAPII initiation.2–4 Some basic themes that emerged were that (1) transcription per se could occur with a minimal system of TATA-binding protein (TBP), TFIIB, TFIIF, and RNAPII5,6; (2) TFIIE and TFIIH worked together to promote RNAPII initiation,7,8 in part by melting promoter DNA at the transcription start site (TSS); (3) TFIID helps assemble the entire PIC on promoter DNA, through direct high-affinity contacts downstream and upstream of the TSS9; and (4) activated transcription, directed by DNA-binding TFs, requires the 1.4 MDa Mediator complex, which triggers TF-dependent RNAPII activation through mechanisms that remain incompletely understood.10
Over the past 10–20 years, imaging of RNAPII transcription in live cells has transformed our understanding of how gene expression is regulated.11–13 Among the many insights provided from live cell imaging are that (1) RNAPII transcription occurs in bursts, followed by prolonged dormant periods14; (2) bursts may generate multiple transcripts (i.e., RNAPII initiation and reinitiation from the same promoter)15,16; (3) enhancer sequences, which contain many TF-binding sites, may activate RNAPII at promoters even without direct enhancer-promoter (E-P) contact17–19; (4) PICs are highly unstable in vivo, and Mediator and TFIID appear to be major drivers of PIC assembly and stability20; and v) RNAPII, TFs, Mediator, and other factors form transient clusters in metazoan cell nuclei, which correlate with transcription at nearby genes.17,21–23 Such clusters have been reasonably proposed to represent phase-separated condensates,24 but verifying condensate formation in cells is challenging and fraught with caveats.25–27 Furthermore, directly demonstrating that condensates—in and of themselves—activate RNAPII at specific promoters in cells is not possible with existing techniques.12,28,29
With the new mechanistic framework provided by live cell imaging, considered together with foundational biochemical experiments, a series of “next-level” questions have emerged. For example, (1) how is RNAPII bursting and re-initiation regulated?; (2) how might E-P RNAPII activation occur at a distance (i.e., without direct E-P contact)?; (3) how do stimulus-response TFs rapidly locate the “correct” target promoters in the nucleus?; (4) what are the kinetics of these processes (1, 2, 3), and how are rates impacted by TFs or PIC factors?; and v) how do intrinsically disordered regions (IDRs) contribute to RNAPII activation kinetics? Are IDR-containing condensates required for RNAPII activation? Transcription regulatory proteins are enriched in IDRs,30 including especially TFs and Mediator.31,32 Is their primary function to drive condensate formation, or do they act independently of this biophysical phenomenon?
To address these and other mechanistic questions, we developed a real-time in vitro fluorescence transcription assay (RIFT). Key features of this experimental system include (1) reconstitution of regulated, TF-dependent transcription with purified human PIC factors (no extracts) at the native HSPA1B promoter, (2) direct visualization and quantitation of nascent RNA transcripts in real time, (3) direct visualization of individual promoters, TFs, or condensates with single-molecule resolution, (4) precise timing, with onset of transcription occurring upon the addition of ribose nucleotide triphosphates (NTPs), and (5) continuous monitoring of transcriptional output at hundreds of individual promoters over time, to allow accurate assessment of RNAPII initiation and re-initiation events.
The RIFT assay builds upon pioneering work from the Tjian lab that showed that it was feasible to reconstitute and visualize RNAPII transcription at individual promoters. In this case, PICs were assembled with purified factors on promoters immobilized on microscopy slides. After NTP addition, transcripts were visualized by subsequent incubation with fluorophore-tagged DNA sequences that hybridized with RNA products.33 More recently, the Buratowski and Gelles labs pioneered methods to visualize PIC factor recruitment to single promoters in real time, using yeast nuclear extracts from cells expressing labeled proteins.34,35 This co-localization single-molecule spectroscopy (CoSMoS) system has markedly advanced understanding about factor recruitment and PIC assembly,36 although transcriptional output is not measured with CoSMoS.
We applied the RIFT system toward the “next level” questions cited above. Our results yielded new mechanistic insights and were also consistent with models inferred from live cell imaging and single-cell nascent transcriptomics. For example, our RIFT experiments yielded insights about how burst size is regulated, how TFs can rapidly find their target promoters, and how enhancers might activate nearby promoters without direct E-P contact. Furthermore, all TF- and Mediator-dependent effects on RNAPII activation do not require condensate formation, although this remains an area for future study.
RESULTS
Development of a RIFT assay
The RNA imaging technology utilized for RIFT is based on the Peppers RNA aptamer,37 which folds into a secondary structure that binds to fluorogenic small molecules with high affinity. We hypothesized that Peppers could be adapted for the real-time detection of nascent transcripts as they emerged from an actively transcribing RNAP. As an initial proof-of-concept, we completed in vitro transcription with T7 RNAP and confirmed that transcriptional output was dependent on the fluorogenic ligand, DNA template, and T7 RNAP (Figure S1A), demonstrating that Peppers could allow in situ visualization and quantitation of RNAP transcription.
We next evaluated Peppers in our well-tested human RNAPII transcription system, which uses purified human PIC factors (no extracts; Figure S1B).38,39 To adapt for RIFT, the native human HSPA1B promoter was tethered to biotin at its 5′ end, and tandem Peppers aptamer sequences were inserted 100 bp downstream of the TSS (Figure 1A). Thus, all regulatory sequences (e.g., TATA box and initiator element) were retained. The regulatory TF for HSPA1B, HSF1, was pre-bound to the template, and NTPs were added to initiate transcription after PIC assembly (Figure 1B); the moment of NTP addition was designated t = 0. To visualize RNAPII transcription in real time, continuous single-molecule total internal reflection fluorescence (smTIRF) imaging was conducted out to 3 min (Figure 1C), with a frame rate of 5/s (200 ms; 400 ms for 2-color imaging) for precise temporal resolution.
Figure 1. Real-time in vitro fluorescent transcription.

(A) Schematic of HSPA1B promoter template with native sequence highlighted in green.
(B) Overview of the RIFT assay.
(C) Representative RIFT images of RNA produced from immobilized HSPA1B promoter with corresponding intensity trace below. In this case, three transcripts were generated. Blue bars illustrate (A) time to first-round transcription, (B) time to second-round transcription (i.e., re-initiation), and (C) is the time until another re-initiation event. Green dashed line represents signal filter to distinguish RNA transcripts from background noise with high confidence.
(D) Representative smTIRF image of immobilized HSPA1B DNA template labeled with Cy5 (see STAR Methods).
(E) Representative smTIRF image of immobilized promoters (red) during RIFT. In this case, an RNA (green) colocalized with DNA (yellow), indicative of an RNAPII transcript. Scale bars, 1 μM in (C–E).
As shown in Figure 1C and Video S1, the RIFT assay allowed direct visualization of RNAPII transcription, including re-initiation events, at individual promoters. Through direct labeling of the DNA templates (Figure 1D), we confirmed that ~800 promoters were visualized in a single experiment simultaneously, and 100–200 templates typically generated at least one transcript within the 3-min experimental time frame (Figure 1E), yielding a template usage consistent with bulk in vitro studies.40–42 Because all templates are identical, the number of active templates reflects the probability that RNAPII will generate a “runoff” transcript. Real-time measurement of RNAPII transcription at hundreds of active promoters allowed rigorous statistical analysis of population-level effects, to complement single-molecule resolution at individual promoters (Figure S1C). Additional control experiments were completed and summarized in Figures S1D–S1I, and we separately confirmed that RIFT data matched established “ensemble” assays with 32P-CTP.43
Based on the results summarized in Figures 1 and S1, we concluded that the RIFT assay could reliably measure human RNAPII transcriptional output at hundreds of promoters simultaneously, with high spatial and temporal resolution. We next shifted our focus to the mechanistic roles of individual PIC components and the sequence-specific TF, HSF1.
TFIIE and TFIIH increase transcription; TFIID accelerates first-round RNAPII activation
As a starting point for assessing PIC function, we tested RNAPII, TBP, TFIIB, and TFIIF, which is considered the “minimal system” because these factors are sufficient for RNAPII transcription initiation in vitro.5,6 Separately, we tested PICs that included additional factors. In each case, HSF1 was pre-bound to the HSPA1B promoter for PIC assembly. As expected, RNAPII transcription increased from PICs that included TFIIE and TFIIH (Figure 2A).7,8 Mediator further increased RNAPII transcription from TBP-containing PICs (Figures 2A and 2B). By contrast, TFIID-containing PICs attenuated overall transcriptional output vs. TBP-containing PICs in this assay (Figures 2A, 2B, and S2A). (TFIID contains TBP plus 13 TBP-associated factors [TAFs]). This result highlights the fact that RIFT detects transcripts during the “elongation” phase of RNAPII transcription (over 100 bp downstream of the TSS), after the promoter-proximal pause region. Prior experiments have shown that TFIID enables RNAPII promoter-proximal pausing, whereas TBP-containing PICs do not pause,39 providing a straightforward mechanistic explanation for reduced RNAPII transcripts with TFIID-containing PICs compared with TBP in the RIFT assays.
Figure 2. TFIIE and TFIIH increase transcription; TFIID accelerates RNAPII activation.
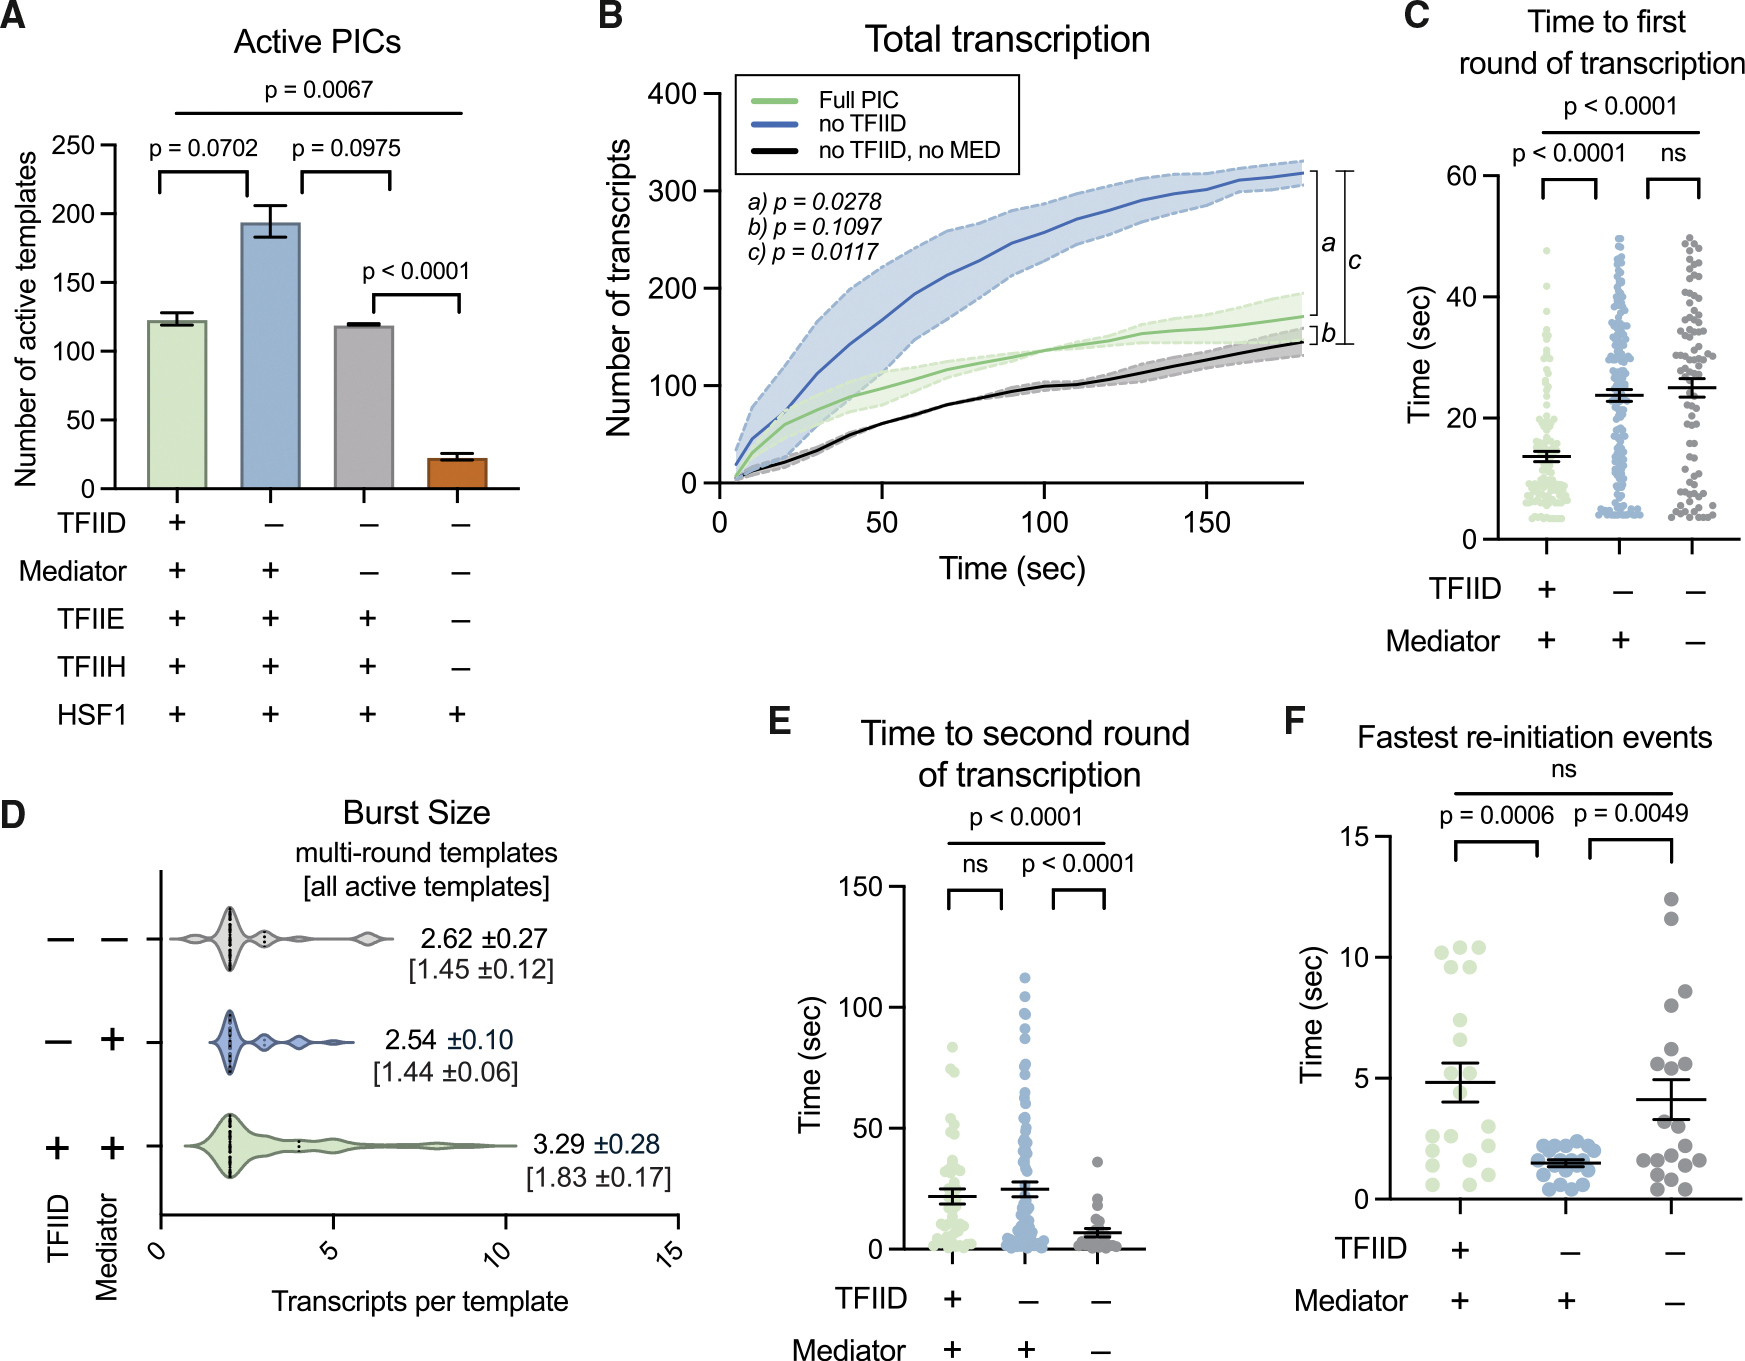
(A) Number of active promoters based upon PIC composition. All lanes include TBP, TFIIA, TFIIB, TFIIF, and RNAPII; other PIC factors added as noted. If TFIID was added, TBP was not included in addition. Bars represent mean ± SEM.
(B) Total transcription over time from PICs ± Mediator and/or TFIID. Line depicts mean values, and shading represents SEM. No TFIID experiments included TBP instead.
(C) Time to first-round transcription from full PIC (left) or PICs lacking TFIID or Mediator and TFIID. If no TFIID, TBP was used. Black bars represent mean ± SEM.
(D) Burst size as a function of Mediator and TFIID. Values listed are mean burst sizes from multi-round promoters (±SEM); values in brackets are mean burst size of all active promoters (±SEM).
(E) Time to re-initiation with full PIC (left) or PICs lacking TFIID or Mediator and TFIID. If no TFIID, TBP was used. Black bars represent mean ± SEM.
(F) Fastest re-initiation events (n = 20). Black bars represent mean ± SEM.
(A–F) represent n = 2 biological replicates.
PICs containing Mediator and TFIID (i.e., complete PICs) resulted in the fastest “first-round” RNAPII activation (Figures 2C and S2B). Our reported rate of first-round RNAPII transcription considers only the first 60 s, to balance PIC-specific differences in activation duration. For example, few additional templates are activated after 60 s without Mediator and TFIID, in contrast with Mediator-containing PICs (Figure S2B). We next determined whether TFIID and/or Mediator increased the probability that a once-activated PIC would re-initiate. As shown in Figure S2C, the fraction of active templates that re-initiated was similar across conditions, whereas the average number of transcripts generated from single promoters (i.e., burst size) increased with the full PIC (Figure 2D; Table S1.). Consistent with live-cell imaging,11 a burst involved the generation of one or more transcripts/promoter. Given the short RIFT time frames (3 min), all re-initiation events were considered part of the same burst. Re-initiation rates were similar or slightly reduced with full PICs compared with PICs lacking TFIID and Mediator (Figure 2E). However, as with first-round transcription, re-initiation occurred across longer time frames with PICs containing TFIID and/or Mediator (Figure 2E), which skews the overall re-initiation rate. We therefore compared the fastest re-initiation events (n = 20) for each condition (Figure 2F). Taken together, the data in Figures 2E and 2F showed that PICs containing Mediator and TFIID extend the time frame for RNAPII re-initiation and that Mediator accelerated re-initiation rates.
HSF1 and Mediator synergistically activate RNAPII through multiple mechanisms
The data summarized in Figures 2 and S2 established benchmarks for RNAPII transcription activation with the RIFT assay. We next focused on Mediator and the TF HSF1, based in part upon their paramount importance for RNAPII regulation in cells.10,44 Because Mediator and TFIID have been shown to coordinately regulate RNAPII transcription in vitro and in cells,45–47 all subsequent experiments included TFIID rather than TBP.
Compared with the full PIC, removal of both HSF1 and Mediator had dramatic negative effects on RNAPII transcription, greater in magnitude than loss of either factor alone. Fewer templates generated transcripts (Figure 3A)—suggesting a lower probability of RNAPII activation—and no re-initiation occurred in the absence of HSF1 and Mediator (Figure 3B). Collectively, these defects yielded a massive reduction in overall RNAPII transcription (Figure 3C). Removal of HSF1 or Mediator individually had intermediate impacts on RNAPII transcription compared with loss of both factors at once (Figures 3A–3D). A notable exception was that only Mediator altered the proportion of active templates undergoing re-initiation (Figure S2D), suggesting a key role independent of HSF1 binding.
Figure 3. HSF1 and Mediator synergistically activate RNAPII through multiple mechanisms.

(A) Number of active PICs ± HSF1, ±Mediator, or ±Mediator and HSF1. Bars represent mean ± SEM.
(B) Burst size as a function of Mediator and HSF1. Values listed are mean burst sizes from multi-round promoters (±SEM); values in brackets are mean burst size of all active promoters (±SEM).
(C) Total transcription over time as a function of Mediator and HSF1. Line depicts mean values, and shading represents SEM.
(D) Time to first-round transcription from full PIC (left) or PICs lacking factors as indicated. Black bars represent mean ± SEM.
(E) Calculated synergy indices of different RIFT metrics, where values below zero indicate no synergy.
(F) Cumulative re-initiation events (dots) fit to a non-linear two-rate model (lines) with a fast (red) and slow (blue) population (n = 6 biological replicates).
(A–E) represent n = 2 biological replicates.
Combined loss of Mediator and HSF1 also significantly reduced the rates of RNAPII activation. As shown in Figure 3D, generation of “first-round” transcripts was significantly faster in the presence of Mediator and HSF1 (i.e., full PIC). While reinitiation did not occur in the absence of Mediator and HSF1, data summarized in Figure S2E reveal that HSF1 has a dominant effect on RNAPII re-initiation rates. Moreover, combined loss of Mediator and HSF1 markedly reduced the burst size (Figure 3B) and activation duration (Figures 3C and S2F). Finally, by applying a synergy index,48 we confirmed that Mediator and HSF1 synergistically activate RNAPII transcription (Figure 3E). A summary of how TFIID, HSF1, and/or Mediator impact RNAPII first-round transcription and re-initiation rates is shown in Figure S2G. Separate sets of RIFT experiments compared full PICs vs. PICs lacking either Mediator or HSF1, with results summarized in Figures S3A–S3J.
RNAPII re-initiation occurs through at least two distinct mechanisms
The mechanistic basis for RNAPII re-initiation and bursting remains incompletely understood.49 We applied non-linear models using one- or two-phase exponentials to assess re-initiation kinetics based upon experiments with HSF1 and the complete PIC. As shown in Figure 3F, the data showed evidence for “fast” and “slow” re-initiation rate constants, suggesting at least two molecular mechanisms (Figures S3K and S3L). Note that the population of fast events encompasses re-initiation rates ranging from 0.4 to 21 s.
Mediator accelerates HSF1 target search for rapid RNAPII activation
Like most sequence-specific, DNA-binding TFs, HSF1 has a DNA-binding domain (DBD; residues 1–221) and a disordered activation domain (AD; residues 407–529). Activation of heat shock response genes by HSF1 has shown Mediator dependence in model organisms,50,51 and HSF1 supports rapid RNAPII re-initiation and bursting under heat shock conditions.15
HSF1 is a stimulus-response TF, and under normal conditions, HSF1 is inactive and sequestered in the nucleus and cytoplasm by the HSP70 chaperone. Upon heat shock stimulation, HSP70 dissociates and HSF1 accumulates in the nucleus, promoting DNA binding and target gene activation.52 To replicate this stimulus response, we modified the RIFT assay such that PICs were pre-assembled on promoters in the absence of HSF1. HSF1 was then introduced concurrently with NTPs. As expected, HSF1 activated RNAPII transcription under these conditions, similar to pre-bound HSF1 experiments (Figures 4A and S4A); however, RNAPII activation occurred even faster under this “stimulus response” condition compared with standard RIFT assays with pre-bound HSF1 (Figures 4A and 4B), and re-initiation was completely blocked in the absence of Mediator under these conditions (Table S1; Figures S4B–S4D). Consequently, overall RNAPII transcriptional output was substantially reduced in the absence of Mediator (Figure 4C), consistent with the pre-bound HSF1 experiments (Figure 3C).
Figure 4. Mediator accelerates HSF1 target search for rapid RNAPII activation.

(A) Plot showing first-round transcripts over time for pre-bound HSF1 vs. HSF1 added with NTPs. Blue arrow highlights faster RNAPII activation in NTP HSF1 condition. Line depicts mean values, and shading represents SEM. Inset: total transcription for pre-bound HSF1 vs. HSF1 added with NTPs. Bars represent mean ± SEM.
(B) Time to first-round transcription comparing pre-bound HSF1 vs. HSF1 added with NTPs; also shown are data from NTP HSF1 condition in the absence of Mediator. Black bars represent mean ± SEM.
(C) Total transcription over time of HSF1 added with NTPs ± Mediator. Line depicts mean values, and shading represents SEM.
(D) Time to HSF1 binding to promoters ± Mediator. Black bars represent mean ± SEM. (A–D) represent n = 2 biological replicates.
We next tested whether rapid RNAPII activation was Mediator dependent. As shown in Figure 4B, Mediator accelerated HSF1-dependent RNAPII activation compared with PICs lacking Mediator. Furthermore, Mediator accelerated the “on rate” for HSF1-promoter recruitment and increased HSF1 dwell times (Figures 4D and S4E), consistent with direct HSF1-Mediator binding through its AD.
Compared with standard RIFT assays with pre-bound HSF1, the Mediator dependence was amplified under the stimulus response condition, such that re-initiation and rapid RNAPII activation did not occur in its absence. We consider the stimulus response experimental paradigm, in which HSF1 is added with NTPs, to better reflect physiological conditions because NTPs are always available in vivo, including the moment HSF1 enters the nucleus and binds target gene promoters. Consequently, all remaining experiments were completed in this way.
Mediator enables rapid TF-dependent RNAPII activation without TF-DNA binding
HSF1 activation of RNAPII was so fast with the stimulus response experimental scheme (Figures 4A and 4B), we wondered whether the HSF1 DBD was even required. Potentially, Mediator-dependent activation was occurring through direct interactions between HSF1-AD and Mediator, without HSF1-DNA binding. To test this concept, we completed RIFT assays with HSF1 lacking its DBD (i.e., HSF1-AD only), in which HSF1-AD was added with NTPs. Remarkably, HSF1-AD was sufficient to rapidly activate RNAPII transcription, and this activity was Mediator dependent (Figures 5A, 5B, and S5A). Furthermore, no re-initiation occurred with HSF1-AD in the absence of Mediator (Figure S5B), similar to full-length (FL) HSF1 experiments (Figure S4D). Mediator also accelerated HSF1-AD promoter recruitment (Figure 5C) but had no impact on dwell time (Figure S5C). Interestingly, activation kinetics were slower and total transcriptional output was reduced with HSF1-AD vs. FL HSF1 (Figures 5D–5F), suggesting auxiliary mechanistic roles for HSF1 DNA binding.
Figure 5. Mediator enables rapid TF-dependent RNAPII activation without TF-DNA binding.

(A) Total transcription over time of HSF1-AD added with NTPs as a function of Mediator. Line depicts mean values, and shading represents SEM.
(B) Time to first-round transcription of HSF1-AD added with NTPs as a function of Mediator. Black bars represent mean ± SEM.
(C) Time to HSF1-AD binding to promoters ± Mediator. Black bars represent mean ± SEM.
(D) Time to first-round transcription or re-initiation of full-length HSF1 vs. HSF1-AD (both added with NTPs). Black bars represent mean ± SEM.
(E) Total transcription of full-length HSF1 vs. HSF1-AD (both added with NTPs). Bars represent mean ± SEM.
(F) Fraction of active promoters that undergo re-initiation for full-length HSF1 vs. HSF1-AD (both added with NTPs). Bars represent mean ± SEM.
(G) Total transcription over time of SREBP-AD added with NTPs ± Mediator and ±TFIID. Line depicts mean values, and shading represents SEM.
(H) SREBP-AD dwell time on promoters ± Mediator. Black bars represent mean ± SEM.
(A–H) represent n = 2 biological replicates.
The data with HSF1-AD suggested that Mediator could recruit TFs to promoters independent of TF-DNA binding and that TF-Mediator binding (via the TF AD) was sufficient for RNAPII activation. To probe further, we completed a series of RIFT assays with the SREBP-AD (residues 1–50), which is an IDR that is among the best characterized TF-Mediator interactors.53,54 Because SREBP-AD is challenging to isolate on its own, we fused it to glutathione-S-transferase (GST). As shown in Figures 5G and S5D, SREBP-AD rapidly activated RNAPII transcription and re-initiation, and these functions were Mediator dependent, with some contribution from TFIID (Figures S5E–S5G). Consistent with high-affinity Mediator binding, SREBP-AD dwell time increased significantly with Mediator-containing PICs (Figure 5H). Finally, because HSF1-AD and SREBP-AD are IDRs, we tested whether their activity in the RIFT assays might involve condensate formation. Using fluorescently labeled HSF1-AD or SREBP-AD at concentrations used in RIFT experiments (13 nM), no evidence for condensates or clusters was observed (Videos S2 and S3).
Collectively, the results summarized in Figures 5 and S5 demonstrated that (1) a DBD was not required for rapid, TF-dependent RNAPII activation and that (2) Mediator was sufficient for rapid TF recruitment to the PIC, via TF AD-Mediator interactions. Furthermore, RIFT experiments showed that (3) condensate formation was not required for rapid TF-dependent RNAPII activation, but (4) rapid TF-dependent activation did require Mediator.
HSF1 condensates and single molecules are functionally indistinguishable
Phase separation and molecular condensates have been proposed to drive cellular RNAPII transcription,24 although data also suggest limited or even inhibitory roles.55–59 IDR-containing proteins can phase separate, and HSF1, Mediator, and RNAPII have each been shown to form condensates under appropriate conditions in vitro.60–63
We next tested whether HSF1 condensates might “super-activate” RNAPII transcription. By increasing HSF1 concentration to 250 nM, HSF1 condensates formed that partitioned RNAPII in vitro (Figures 6A, 6B, and S6A). Larger HSF1 condensates in the presence of RNAPII are consistent with partitioning and condensate behavior.27 As expected, RNAPII transcriptional output was Mediator dependent under these conditions (Figure S6B); however, by tracking promoter-associated transcripts that co-localized with HSF1 condensates vs. HSF1 single molecules, no difference was observed in activation kinetics (Figure S6C) or RNAPII transcriptional output (Figure 6C; Video S4).
Figure 6. HSF1 condensates impact RNAPII transcription similar to HSF1 single molecules; MED1-IDR can replace HSF1 to activate RNAPII.

(A) Representative image (scale bar, 2 μm) of mCherry-HSF1 showing condensate and single molecule during RIFT, with zoom-in inset images (scale bars, 1 μm).
(B) Condensate size ± RNAPII as a function of mCherry-HSF1 concentration. Imaged by confocal microscopy. Black bars represent mean ± SEM.
(C) Total transcription with mCherry-HSF1 sorted by either single molecule or condensate. Bars represent mean ± SEM.
(D) Total transcription DBD-MED1-IDR or HSF1 on 19X template. Bars represent mean ± SEM.
(E) Time to first-round transcription or re-initiation of DBD-MED1-IDR or HSF1 on 19X template. Black bars represent mean ± SEM.
(F) Total transcription of DBD-MED1-IDR on native or 19X template ± Mediator. Bars represent mean ± SEM.
(G) Fraction of active promoters that undergo re-initiation on native or 19X template ± Mediator using DBD-MED1-IDR. Bars represent mean ± SEM.
(H) Time to DBD-MED1-IDR binding to promoters on native or 19X template ± Mediator. Black bars represent mean ± SEM.
(I) Total transcription over time ± MED1-IDR (free; not DBD tethered). Line depicts mean values, and shading represents SEM. Inset: number of active PICs ± MED1-IDR. Bars represent mean ± SEM.
(B–I) represent n = 2 biological replicates.
MED1-IDR can replace HSF1 to activate RNAPII transcription
To further probe IDR-dependent functions and potential distinctions between condensates and single molecules, we tested whether the MED1-IDR (residues 948–1567) tethered to the native HSF1 DBD (DBD-MED1-IDR; Figure S6D) could functionally replace wild-type (WT) HSF1. The MED1-IDR is a well-tested domain that forms condensates in vitro.61,64
To enforce localization of the MED1-IDR to the HSPA1B promoter, we generated a modified HSPA1B template in which 17 consensus HSF1-binding sites were inserted upstream of the native HSF1 sites (Figure S6E). This modified HSPA1B promoter contained 19 HSF1 sites compared with two for the native promoter, but the core promoter sequence remained unchanged (i.e., unchanged from the HSE at −109 to the beginning of the 2X Peppers sequence at +100). We then used the “19X″ template to test whether forced promoter localization of the MED1-IDR might “super-activate” RNAPII transcription. The DBD-MED1-IDR chimera was tested alongside WT HSF1 at 100 nM concentration to better assess TF-dependent effects. Remarkably, the DBD-MED1-IDR was able to activate RNAPII similarly to WT HSF1, despite lacking the native HSF1 AD (Figure 6D). Interestingly, however, WT HSF1 acted with faster kinetics for PIC first-round activation and re-initiation (Figure 6E), although each protein generated similar burst sizes from multi-round templates (Table S1). HSF1 had longer dwell times compared with DBD-MED1-IDR (Figure S6F), which may contribute to the faster RNAPII activation rates. In a separate series of experiments, we confirmed that although the DBD-MED1-IDR chimera could form condensates under RIFT assay conditions, the chimera activated RNAPII transcription as single molecules in these assays (Figures S6G and S6H), and unlike HSF1 condensates, DBD-MED1-IDR condensates showed little evidence for association with promoter DNA (Video S5).
Next, we compared the 19X template with the native HSPA1B promoter and tested whether the DBD-MED1-IDR chimera acted through Mediator. As shown in Figures 6F and 6G, RNAPII activity increased at the 19X template vs. native, and activation by DBD-MED1-IDR required Mediator. Activation kinetics also varied on the 19X template and were sensitive to Mediator (Figures S6I and S6J); DBD-MED1-IDR promoter binding was also faster on the 19X template and was Mediator dependent (Figure 6H). Furthermore, increased RNAPII transcriptional output correlated with longer DBD-MED1-IDR dwell times on the 19X template, and this was also Mediator dependent (Figure S6K). Together, these results demonstrated that (1) the MED1-IDR can functionally replace a TF AD, invoking new mechanisms for RNAPII activation within the PIC; (2) WT HSF1 more rapidly activated RNAPII initiation and re-initiation compared with DBD-MED1-IDR, (3) RNAPII transcriptional output tracked with DBD-MED1-IDR dwell times, and (4) all of these functions were Mediator dependent.
Free MED1-IDR forms condensates, sequesters RNAPII, but squelches transcription
We next wondered whether free MED1-IDR might similarly activate RNAPII transcription (i.e., when not fused to HSF1 DBD). Using confocal microscopy, we confirmed that MED1-IDR formed condensates (Figure S7A) and sequestered RNAPII (Figure S7B), in agreement with prior reports.62,64 As shown in Figure 6I, RIFT assays with free MED1-IDR (100 nM) completely inhibited RNAPII transcription, and only single molecules—not MED1-IDR condensates—were observed near promoter DNA (Video S6). These results are consistent with a squelching effect seen in prior biochemical assays with nuclear extracts64 and reveal that the MED1-IDR can activate RNAPII transcription as a single protein (Figure 6F) but squelches transcription as a condensate, in contrast to HSF1 condensates (Figure 6C).
Increased HSF1 promoter occupancy drives RNAPII burst size
Finally, we used RIFT to test mechanistic links between TF dwell times and RNAPII burst size, which have been widely reported in yeast and mammalian cells.65–67 The underlying mechanisms remain unclear, in part because TFs interact with many transcriptional regulatory proteins, including Mediator but also chromatin remodeling and chromatin modifying complexes.68,69
As expected, HSF1 dwell times increased at the 19X promoter compared with the native HSPA1B promoter (Figure S7C), providing a “model system” to test whether the PIC factors were sufficient to recapitulate TF-dependent changes in RNAPII bursting. As shown in Figure 7A, the 19X HSPA1B promoter markedly increased RNAPII transcriptional output. Mechanistically, this was due to (1) increased probability of RNAPII activation, resulting in more active PICs (Figure 7A), (2) increased burst size across all active promoters (Table S1), and (3) increased probability that active PICs would reinitiate (Figure 7B). Moreover, the 19X promoter increased RNAPII re-initiation rates (Figure S7D); however, first-round RNAPII transcription was actually slower from the 19X promoter (Figure S7E).
Figure 7. Increased HSF1 dwell time drives RNAPII transcription; models.

(A) Total transcription over time, comparing native vs. 19X templates. Line depicts mean values, and shading represents SEM. Inset: number of active PICs comparing native vs. 19X templates. Bars represent mean ± SEM.
(B) Fraction of active promoters that undergo re-initiation from native or 19X HSPA1B promoter. Bars represent mean ± SEM.
(C) Model depicting different TF-dependent activation mechanisms, one involving TF binding to promoter DNA (top), and another involving TF-promoter recruitment via Mediator (bottom). In each case, TF-Mediator interaction drives RNAPII activation.
(D) Model depicting HSF1 function as a condensate or single molecule.
(E) Model depicting how TFs and Mediator enable rapid RNAPII activation and increased burst size, likely through PIC stabilization. Mediator also increases the probability of RNAPII re-initiation.
(A and B) represent n = 2 biological replicates.
Collectively, these data are consistent with live-cell imaging results that correlate RNAPII burst size with TF dwell times,65–67 suggesting that cellular strategies to increase TF-promoter occupancy are essential for high-level activation. Because RIFT experiments included only TFs and the PIC factors, our results establish that TF-PIC interactions, presumably through Mediator, contribute to TF-dependent regulation of RNAPII re-initiation and bursting either partially or entirely.
DISCUSSION
RIFT allows second-by-second visualization of RNAPII transcription across a population of hundreds of promoters at once and direct visualization of RNAPII re-initiation from individual promoters. Furthermore, the RIFT system provided a means to distinguish single TFs from clusters or condensates, to determine whether condensates per se were required for rapid TF-dependent PIC activation, RNAPII re-initiation, or other processes. Each of these regulatory events, and their rates, are fundamental for RNAPII-dependent gene expression but have not been directly visualized in a defined, biochemically reconstituted system before, to our knowledge. The results from the RIFT assays yielded mechanistic insights that help reconcile confounding and/or unsettled models derived from live cell imaging experiments. We summarize in Figures 7C–7E and provide additional description in the following paragraphs.
E-P communication
One of the most important but confounding questions in the transcription field is how enhancers regulate RNAPII activity at promoters.70 A straightforward model involves direct E-P contact, in which enhancer-bound TFs activate a promoter-bound PIC.49 Live-cell imaging experiments suggested an alternative model that is not mutually exclusive, involving enhancer activation at a distance,17–19 via factors that dissociate from the enhancer to a nearby promoter.10,71 However, this model remains speculative because of inherent limitations with spatial resolution that cannot distinguish direct vs. indirect E-P interactions.12,28 Moreover, because E-P interactions are transient and asynchronous across cells, fluorescence microscopy may not capture such events due to limits in temporal resolution.29,72
Our RIFT experiments with HSF1 under “stimulus response” conditions indicated that rapid TF-dependent RNAPII activation requires Mediator. More importantly, we demonstrate that (1) a TF activation domain without a DBD (e.g., HSF1-AD or SREBP-AD) is sufficient for rapid RNAPII activation, and (2) Mediator is sufficient for TF recruitment to the PIC. These results suggest a straightforward mechanism for E-P activation at a distance, via TF-Mediator binding (Figure 7C) without requiring concomitant DNA-binding to the promoter. In cells, it is not possible to prove that TF-promoter recruitment is DBD independent but Mediator dependent; however, supporting evidence derives from live-cell imaging, in which the TF AD and DBD were each shown to influence residence times or recruitment/clustering on genomic DNA.58,73 We hypothesize that the Mediator “IDR cloud” contributes to rapid TF recruitment in cell nuclei, providing a means by which IDR-rich TFs could partition without requiring phase separation. Furthermore, we emphasize that a TF-PIC recruitment mechanism that circumvents the DBD has significant biological consequences, given emerging evidence that TF isoforms lacking the DBD are widely expressed in cell-type and context-specific ways,74 and that TFs can influence transcription at genomic loci without detectable DNA binding.75
Molecular condensates and IDR-dependent RNAPII regulation
In light of recent evidence suggesting that condensates regulate RNAPII function in cells,60–63 we were surprised to discover that rapid RNAPII activation kinetics occurred without condensate formation (Figure 7D). For practical reasons, most RIFT assays included concentrations of Mediator, RNAPII, and HSF1 that were lower than required to form condensates in vitro, and their co-localization on promoter DNA did not induce condensate formation. However, low-affinity IDR-IDR interactions can be biologically meaningful in the absence of phase separation, even at low concentrations. For example, because they are unstructured, IDRs have a large hydrodynamic radius, which presents an “IDR cloud” that may accelerate on-rates with other IDR-containing proteins.30,76 Mediator contains an unusually large number of IDRs,32 and we observed that Mediator accelerated RNAPII activation kinetics across all experiments and Mediator accelerated TF recruitment to promoter-bound PICs. Based upon these results, we hypothesize that a primary function for IDRs is to accelerate RNAPII activation, in part through rapid TF-promoter recruitment.
Using RIFT, we were able to measure functional differences between proteins as condensates or single molecules, to directly test whether condensates per se might regulate RNAPII activity. With HSF1, we show that rapid RNAPII activation occurs without condensate formation. Moreover, HSF1 condensates did not alter RNAPII activity (total output or kinetics) compared with HSF1 single molecules; by contrast, the MED1-IDR squelched transcription as a free condensate but activated transcription as a DNA-bound single-molecule.
Our results are most consistent with reports that suggest minor or specialized roles for condensates in the regulation of cellular gene expression.55,56,58,59 Drawing parallels from the “sub-optimization” of TF binding affinities on genomic DNA,77,78 we speculate that similar sub-optimization evolved among IDR-rich transcription regulatory proteins. Consistent with this idea, TFs designed with enhanced condensate-forming properties had gain-of-function activity and reduced target gene specificity.79 We plan to further address the role of condensates in future projects. However, recent work suggests that potential condensate-dependent RNAPII regulatory mechanisms will not be intuitive or straightforward.80
Contrary to expectations, the MED1-IDR was sufficient for PIC activation and could functionally replace a TF activation domain. Because MED1-IDR can sequester TFs and RNAPII,61,62,64,81 we hypothesize that the IDR alone—if localized to the promoter—enhances PIC assembly and stability. However, the kinetics of first-round PIC activation were slower with the DBD-MED1-IDR compared with WT HSF1. Faster first-round PIC activation with WT HSF1 may reflect a distinct HSF1 AD-Mediator interaction, to trigger conformational shifts that activate RNAPII. Prior work has yielded evidence for large-scale structural re-organization of Mediator upon TF binding,82 including with the SREBP-AD,53 and TF-dependent structural shifts correlate with RNAPII activation within the PIC.83 Potentially, Mediator structural isomerization occurs rapidly with WT HSF1 (or SREBP-AD) but more slowly with an artificial TF such as the MED1-IDR. Given the unstable nature of the PIC,20,34 this kinetic difference might have meaningful consequences in cells.
RNAPII bursting and rapid activation coordinated by TF-Mediator within the PIC
The PIC appears to be highly unstable in yeast and mammalian cells.84 In yeast, the PIC may persist on genomic DNA for 4–9 s,20 whereas RNAPII or Mediator clusters have a lifetime of approximately 10 s in mouse embryonic stem cells.22,23 These findings suggest that RNAPII initiation mechanisms evolved for rapid activation. Here, we demonstrate that PIC activation is extremely rapid under two different experimental conditions: a standard assay with HSF1 pre-bound for NTP addition, and a stimulus response assay in which HSF1 was added with NTPs. We identify the TF HSF1, TFIID, and Mediator as essential for fast first-round RNAPII activation, suggesting that these factors serve as “gatekeepers” to prevent unregulated or random RNAPII initiation events that could otherwise disrupt normal transcriptional responses. In agreement, Mediator and TFs are linked to burst size regulation in cells,16,67,85 and the TAF1 subunit of TFIID limited RNAPII burst size during stimulus response in Drosophila.86
Data from live-cell imaging experiments suggest that burst size is Mediator dependent16,85 and tracks with TF occupancy/dwell time at promoters.65–67,87 We observed that burst size increased in a Mediator- and TF-dependent manner (Figure 7E) under both experimental paradigms (standard and stimulus response). We further probed TF-dependent effects with an artificial HSPA1B template with 19 HSF1-binding sites (vs. two for native promoter). Consistent with cell-based results, the 19X template (1) increased HSF1 dwell times, (2) increased burst size, (3) accelerated RNAPII re-initiation rates, and (4) increased the probability of re-initiation. Each of these HSF1-dependent functions required Mediator; Mediator also increased the probability that an active promoter would re-initiate, suggesting additional uncharacterized regulatory functions. Our results implicate TFs and Mediator in stabilization of the PIC and potentially a scaffold PIC (see below), in agreement with prior biochemical experiments.88,89 Because the PIC is inherently unstable in vivo,20 PIC stabilization could have meaningful biological consequences. Finally, because RIFT uses a defined set of factors, our results demonstrate that the PIC is sufficient to recapitulate TF-dependent effects measured in cells, and auxiliary factors are not required. In fact, burst sizes measured with RIFT on the native HSPA1B promoter are consistent with estimates from live-cell imaging and single-cell transcriptomics experiments (Table S2).90–94
Although first-round RNAPII activation was fast, RIFT data showed that re-initiation was even faster. Analysis of re-initiation rates suggests at least two different mechanisms, fast and slow. We speculate that slow re-initiation occurs via de novo PIC reassembly. Among the fast events, we commonly observed reinitiation within 1–2 s in the presence of Mediator and HSF1. This rapid rate suggests that re-initiation occurs via a PIC scaffold complex,89 but its composition and potential mechanism of action remain unclear.49 Others have shown that de novo PIC assembly is rate limiting for RNAPII activation in vitro.46,95,96 Our RIFT assays were designed such that PIC assembly occurred prior to NTP addition. The fact that re-initiation was still faster overall, compared with first-round transcription from pre-assembled PICs, further supports a scaffold model. That said, we acknowledge that the scaffold PIC remains controversial,97 poorly understood, and may function in a variety of compositional or structural states.98–100
Limitations of this study
The reconstituted system we use for the RIFT assays does not match the complex array of proteins, nucleic acids, and metabolites that converge on an active gene in a human cell. Moreover, RIFT condensates will have simpler composition compared with cells. This has advantages for addressing mechanistic questions, but contributions from other regulatory factors cannot be assessed. In cells, transcription occurs on chromatin templates, whereas “nucleosome free regions” were used here. The concordance of our results with data derived from cell-based methods is striking and suggests that the PIC is the primary regulator of RNAPII function at gene 5′ ends in cells. The Peppers sequence was located beyond +100; consequently, we cannot measure promoter-proximal transcription, and promoter-proximal paused transcripts will not be detected. Finally, we cannot exclude the possibility that under “full PIC” conditions, some transcripts may be generated from partial PICs in the population.
RESOURCE AVAILABILITY
Lead contact
Further information and requests should be directed to and will be fulfilled by the lead contact, Dylan J. Taatjes (taatjes@colorado.edu).
Materials availability
Plasmids or reagents generated in this study are available from the lead contact upon request.
Data and code availability
All data reported in this paper will be shared by the lead contact upon request.
All original code has been deposited at our GitHub repository and is publicly available at https://github.com/meganpalacio/RIFTA.
Any additional information required to reanalyze the data reported in this paper is available from the lead contact upon request.
STAR★METHODS
EXPERIMENTAL MODEL AND STUDY PARTICIPANT DETAILS
HeLa cell nuclear extracts were used to purify human Mediator, TFIID, TFIIH, and RNAPII. HeLa cells were grown in suspension in RPMI media (ThermoFisher; #31800) supplemented with 10% newborn calf serum (Cytiva; #SH30401.02H1) at 37°C with 5% CO2.
METHOD DETAILS
T7 promoter DNA template
A plasmid containing an 8x-repeat of the Pepper aptamer downstream of a T7 promoter was purchased (Fluorescence Diagnosis (Shanghai) Biotech Co. Ltd. #PET2802MCS0). The T7 promoter with the Pepper array sequence was amplified by PCR (forward primer: AGGATC GAGATC TCGATC CCGC; reverse primer ATCCGG ATATAG TTCCTC CTTTCA GC) by Phusion polymerase (Thermo-Scientific #F530S). The resulting PCR product was then purified using the E.Z.N.A. Cycle Pure Kit (Omega BioTek #6492–01). The DNA template was then ethanol precipitated, washed, and resuspended to 100 nM in milliQ water, and stored frozen in single-use aliquots.
T7 RNAP in vitro transcription
The T7 promoter DNA template was mixed with 100μM HBC508 (Fluorescence Diagnosis (Shanghai) Biotech Co. Ltd. #H15081) and T7 RNAP (Thermo Scientific #EP0112) in transcription buffer (30mM Tris HCl pH 7.9, 5mM NaCl, 1mM KCl, 10mM DTT, 50μg/mL BSA, 1.67% DMSO, 0.005% Triton X-100, 2% PEG8000). All reactions were performed in a 384 well plate (Nunc #P6491–1CS) and incubated on ice for 15 min. Transcription was initiated with the addition of rNTPs (2.5 mM; Thermo Scientific #R0481) and monitored at 37°C using a BioTek Synergy H1 Multimode Reader with 488nm excitation and a 15 s interval. For control RNA experiments, a DNA template had the T7 promoter followed by either a 2x- or 8x-repeat of the Pepper array was in vitro transcribed using the TranscriptAid T7 High Yield Transcription Kit (Thermo Scientific #K0441).
HSPA1B promoter DNA template
The DNA sequence of the 2x-repeat Pepper aptamer (2xPepper RNA sequence: 5′- AUGAUCCCCAAUCGUGGCGUGUCGGC CUCUCCCAAUCGUGGCGUGUCGGCCUCUCUUCGGAGAGGCACUGGCGCCGGAGAGGCACUGGCGCCGGGAUCA-3′) was inserted into a plasmid containing the native human HSPA1B promoter that was previously amplified from genomic DNA (HeLa) as described.39 The HSPA1B promoter corresponded to −501 to +100 base pairs relative to the transcription start site. The 2x-repeat Pepper DNA sequence was inserted at +101. The template was then PCR amplified using a biotinylated primer set (forward primer:/5Biosg/TTCTCA GGCAGA CTAGGC CATTAG GTG; reverse primer: GCGCGC CATTGG GATGAT) by Phusion polymerase (Thermo Scientific #F530S). For fluorescent DNA templates, a primer set of a biotinylated primer (forward primer:/5Biosg/TTCTCA GGCAGA CTAGGC CATTAG GTG) and a Cy5 primer (reverse primer:/5Cy5/GCGCGCCATTGGGATGAT) was used for amplification. The resulting PCR product was then purified using the E.Z.N.A. Cycle Pure Kit (Omega BioTek #6492–01). The DNA template was ethanol precipitated, washed, and resuspended to 100 nM in milliQ water, and stored frozen in single-use aliquots. The 19X HSF1 binding site template was generated by inserting 17 additional binding sites upstream of the −109 native HSF1 site, PCR amplified, and purified in the same manner.
Flow chamber functionalization
The cleaning and assembly of the flow chambers and surface functionalization were completed as previously described.105 Briefly, slides and coverslips were sequentially cleaned by water bath sonication using 1% alconox, followed by a 50:50 methanol-ethanol solution, then 1M potassium hydroxide, and finally 100% methanol. Slides and coverslips were then coated with 2% aminosilane before pegylation with 0.38% biotin-PEG-succinimidyl carbonate (w/v) and 20% mPEG-succinimidyl valerate (w/v) in 0.1M sodium bicarbonate. Next, slides and coverslips are assembled into flow chambers and stored at room temperature in a light-blocking container with desiccant.
Real-time in vitro fluorescent transcription (RIFT)
Flow chamber preparation (immediately before RIFT)
Prior to RIFT, the flow chamber was washed twice with milliQ water, followed by filtered DB/RM buffer (10 mM Tris-HCl pH 7.9, 50 mM KCl, 4 mM MgCl2, 10 mM HEPES pH 7.9, 10% glycerol, 1 mM DTT, 0.05 mg/mL BSA). Streptavidin (0.2 mg/mL) was bound to the biotinylated slide surface in DB/RM buffer with 0.08 mg/mL BSA. After a 5-min incubation, the slide was washed again with DB/RM. At this point, the flow chamber was placed into the microscope slide holder stage which was encased in an environmental chamber set to 30°C. The field-of-view (FOV) was photobleached for 1 min to remove background noise.
Reconstituted in vitro transcription for “standard condition” experiments
For standard RIFT conditions, the HSPA1B promoter template (final concentration of 0.06nM) was incubated with HSF1 (13 nM, unless otherwise stated) in DB buffer to make the ‘template mix’ (20 mM Tris-HCl pH 7.9, 100 mM KCl, 20% glycerol, 1 mM DTT, 0.1 mg/mL BSA) at 30°C for 5 min. Next, PIC components (TFIIA, TFIIB, TFIID (or TBP), TFIIE, TFIIF, TFIIH, RNAPII, and Mediator) were added with HBC525 (final concentration of 1 μm; Fluorescence Diagnosis (Shanghai) Biotech Co. Ltd. #H15251) to the template mix in order to make the ‘PIC mix’. The concentration of PIC factors used in the assay were empirically determined but were approximately 10–40nm, similar to prior ensemble assays.38,39 The PIC mix was incubated at 30°C for 5 min, then flowed across the prepared slide, and incubated for another 5 min for template immobilization. A short time series (50 frames) was collected at this point to obtain images that would serve to evaluate noise/background. These images were collected for all replicates to correct for experiment-to-experiment variability. Transcription was initiated by adding A/C/G/UTP (final concentration of 2.5 mM) in imaging buffer (3 mM Trolox, 1 mg/mL glucose oxidase, 0.08 mg/mL catalase, 0.8% D-glucose, 1.7 mM RNaseOUT in DB/RM buffer; prepared as described)105 onto the flow chamber.
Imaging transcription in real time
Data collection (3-min continuous imaging with no interval delay and 200ms exposures) started prior to NTP addition so that t = 0 was captured. For two-color imaging experiments where both RNA and TF where imaged simultaneously, the exposure was 400ms due to alternating laser excitation. However, there were slight delays (~3–6 s) after NTP addition caused by the micro-adjustments of z-height required to achieve proper focus. All experiments were completed with two biological replicates (n = 2), except for “Full PIC” results (n = 6).
Pre-bound HSF1 versus NTP TF “stimulus response” experiments
The RIFT protocol described above was for standard RIFT in which pre-bound HSF1 was incubated with the DNA template prior to PIC assembly and NTP addition. To mimic a stimulus response condition, the TF (e.g., HSF1, GST-SREBP-AD, or DBD-MED1-IDR) was added with NTPs. In these cases, the RIFT assay followed the same protocol as standard conditions except that i) the HSPA1B promoter template (final concentration of 0.06nM in DB buffer) was incubated without TF at 30°C for 5 min prior to the assembly of PICs on the template and ii) transcription was initiated by adding a mix of rNTPs (final concentration 2.5mM) and TF (13nM, unless otherwise stated) in imaging buffer onto the flow chamber.
Imaging controls
Sets of control experiments were completed to image fluorescent microspheres (Invitrogen #T7279) for microscope calibration. Experiments with fluorescent HSPA1B promoter template (0.06 nM; labeled by Cy5 as described above) were completed to confirm template immobilization and spacing of templates on the slide surface. On average, 801.9 ± 6.67 (SEM) templates were immobilized. Purified fluorescent RNA (0.1μg; in vitro transcribed by T7 RNAP as described above) containing the 2x-Pepper aptamer was attached to a biotin moiety by RNA 3′-end labeling (Thermo Scientific #20160). smTIRF imaging of the purified RNA with HBC525 ligand (1 μM) validated the stability of the fluorophore:aptamer complex, and standardized fluorescence intensity of single RNAs produced during RIFT experiments.
Single-molecule data collection and analysis
smTIRF microscopy
Flow chambers were imaged using an objective-based TIRF microscope (Nikon Ti2-E) equipped with a 100 × 1.49NA Apo TIRF oil objective, Piezo Z stage, Oko Labs full enclosure environmental chamber, automated shutter system, and CCD camera. Manual TIRF alignment was performed prior to every experiment. Samples were excited with 488nm, 561nm, or 647nm lasers or a combination of compatible lines depending on the experiment. Emission was captured by the Andor Ixon 897 EMCCD. Data were collected through the NIS elements software (version 5.21.03) at 200ms exposure time with no interval delay for the duration of the movie.
Early on in development of RIFT, experiments were conducted using a different TIRF microscope (Nikon TE-2000 U), which featured a 1.49NA oil immersion objective, a Piezo nano-positioning stage, and two CCD cameras. Emission from 532nm excitation was captured with an Evolve Photometric CCD, while emission from 635nm excitation was captured with a Cascade II Photometric CCD. However, this setup posed limitations on imaging near t = 0, prompting a transition to a more advanced TIRF microscope (Nikon Ti2-E; described above). All data presented were captured using the advanced Nikon Ti2-E. The sole exception was the minimal system experiment (Figure 2A), which was conducted on the Nikon TE-2000 U.
smTIRF microscopy analysis of RIFT data
Movies were analyzed in FIJI (ImageJ2 version 2.14.0/1.54k) to perform spot intensity analysis for single-molecule detection and particle intensity quantification.104 A low noise tolerance provided detection of all particles, including background, and their respective intensity values over time. The data were analyzed using a custom script (RIFTA) developed in R studio to determine ‘real’ transcripts from noise with high confidence (>99th percentile).106 The ‘PIC’ image (flow chamber with PICs and HBC ligand; no NTPs) collected for all replicates provided intensity traces of background noise or inherent fluorescence of unbound HBC ligand. The 99th percentile of all intensity values for the background foci observed determined the signal filter (Figure S1F; green dashed line). This permitted the rigorous removal of intensity traces that originated from background particles that were not true RNA molecules, and provided confidence that foci that passed the filter cutoff were real transcripts. In the movies where transcription was initiated, a transcript was called when it passed the signal filter (e.g., Figure 1C). In addition, to be called a re-initiated transcript from the same promoter, the intensity values had to return to noise levels after the first transcript (e.g., Figure S1F; orange area) and subsequently surpass the filter level again. This same data processing protocol was applied for every experiment to account for variance. Moreover, the RIFTA script reported amounts and rates of first round PIC activation and re-initiation.
smTIRF microscopy analysis of fluorescent TFs
Movies were analyzed in FIJI (ImageJ2 version 2.14.0/1.54k) to perform spot intensity analysis for single-molecule detection. Additionally, TF foci were distinguished from background by setting a threshold, and measurements of foci size and intensity were taken. Foci consistent with condensates were sorted from single molecules using a size cut-off of r = 0.2μm, which is in agreement with previous condensate size estimates.23,107 We estimate the number of HSF1 molecules within an HSF1 condensate to be hundreds of molecules. The number of molecules present in discrete foci was determined by measuring the integrated intensity of foci and comparing it to the intensity of a single molecule. TF time to binding and dwell times were calculated by measuring the time to or duration a TF remained at the same location, respectively. A TF was considered bound if observed for 2+ frames.
Confocal microscopy
Confocal microscopy images were collected on a spinning disc confocal (Nikon TiE) equipped with a 100 × 1.4NA oil objective, MCL Piezo Z stage, environmental control (Oko Labs enclosure), and Andor IXon 888 Ultra camera. Samples were excited with 488nm, 561nm, or 640nm lasers or a combination of compatible lines depending on the experiment. Movies were captured through the NIS elements software (version 5.42.03) with no interval delay for the duration. Data were then analyzed in FIJI (ImageJ2 version 2.14.0/1.54k) to minimize background, detect all particles, and quantify particle size and intensity across all movies. mCherry-MED1-IDR (200nM), DBD-MED1-IDR (100nM), and HSF1 (50–250nM) were imaged in DB/RM buffer at 30°C.
Purification of human PIC factors
TFIID, TFIIE, TFIIF, TFIIH, Mediator, and RNAPII were purified as described.39 The remaining GTFs were purchased: TFIIA (Protein One #P1032–01), TBP (Active Motif #81114), TFIIB (Novus Biologicals #NBP1–30313).
Purification of HSF1, GST-SREBP-AD, mCherry-MED1-IDR, mCherry-DBD-MED1-IDR, mCherry-HSF1, and mCherry-HSF1-AD
mCherry-MED1-IDR, mCherry-DBD-MED1-IDR, mCherry-HSF1, and mCherry-HSF1-AD were expressed in E.coli LOBSTR (low background strain; Kerafast #EC1002) cells. Cells were grown at 37°C to an OD ~ 0.7, induced with 1mM IPTG (American Bio #AB00841), and continued growth for 4 h at 37°C. All mCherry-tagged proteins had a 6xHis tag allowing for purification by nickel affinity chromatography using a HisTrap HP column (Cytiva # 17524701). For mCherry-MED1IDR and mCherry-DBD-MED1-IDR, peak fractions were then purified further with a Superdex 200 Increase 10/300 GL (Cytiva # 28990944) size exclusion column. For mCherry-HSF1-AD, peak fractions were then purified further with a DNA-mimic Heparin (Cytiva # 17040701) column. The peak HisTrap fractions of mCherry-HSF1-AD were further purified using FLAG M2 affinity resin (Sigma-Aldrich #A2220–5ML) because this construct also had an N terminus FLAG tag. GST-SREBP-AD was expressed in E.coli and cells were grown at 37°C to an OD ~0.7, induced with 1mM IPTG, and continued growth for 3 h at 30°C. GST-SREBP-AD was isolated from lysate by binding to glutathione Sepharose beads (Cytiva #17075601) and eluted with buffer containing 30 mM glutathione (Sigma-Aldrich #G4251). HSF1 was expressed in Expi293F (Gibco #A14527) cells that underwent 0.5-h heat shock (42°C) after 48 h transfection. The HSF1 construct had an FLAG tag that allowed purification using FLAG M2 affinity resin (Sigma-Aldrich #A2220–5ML) from whole cell extracts. HSF1 was eluted with 5mg/mL of FLAG peptide (Sigma-Aldrich #F4799–25MG) in 0.15M KCl HEGN.
Fluorescent labeling of TFs HSF1 and GST-SREBP-AD
For microscopy experiments visualizing TFs, HSF1 and GST-SREBP-AD were fluorescently labeled with Alexa Fluor 647 (Invitrogen #A20347). Alexa Fluor labeling was completed by incubating samples with a 10X molar excess of TCEP (tris-(2-carboxyethyl)phosphine; Invitrogen #T2556) and 2X molar excess of Alexa Fluor 647 for 2 h at 4°C while nutating and protecting from light. Excess dye was removed using Pierce dye removal columns (Thermo Scientific #22858). Labeling efficiency was assessed using gel electrophoresis, with BSA and Alexa Fluor 647 oligo standards serving to determine the protein concentration of the sample and the extent of fluorescence incorporation.
QUANTIFICATION AND STATISTICAL ANALYSIS
Probability of HBC:aptamer dissociation
The affinity of HBC525 for the Peppers aptamer is Kd = 3.8 nM; HBC ligands have slow dissociation rates (0.0023 s−1) and high photostability (>3600 s).37 With the assumption that one imaging FOV (field of view; ca. 800 templates) produced 300 transcripts and that ligand-aptamer binding is in equilibrium, we estimate that the probability of a single aptamer not being bound by HBC525 is 0.38% and the probability of both aptamers in the 2× array remaining unbound is 0.0014%. Thus, the probability that an RNA transcript would remain ‘dark’ and undetected was low.
Re-initiation kinetics calculation
The time to re-initiation events was fit to either a one-phase association model or two-phase association model using Graph Pad Prism (v. 10.4.1 532). The one-phase association and two-phase association model used the following equations:
One-phase association
Two-phase association
where is the value when (time) is zero, is rate constant, is time, and is the fraction of the fast population span from to . Although the model allowed for a floating baseline, the fitted value was negative, which is not biologically plausible in this context. Therefore, was constrained to zero for all fits. The fits were compared by evaluating the ΔAIC (Akaike Information Criterion) and if the difference was significant, the model with the lower AIC was selected. A three-phase association model was also evaluated and it scored worse compared with the two-phase model based upon ΔAIC.
Corrected Akaike Information Criterion calculation
For each model, Prism calculates the corrected Akaike Information Criterion () as:
where is the number of data points, is the number of fitted parameters, and is the residual sum of squares. penalizes model complexity to prevent overfitting. The difference in (ΔAICc) between models was used to compare relative fit quality, with lower values indicating stronger support for a model.
Simulation of data
Best-fit parameters from each model were used to calculate predicted values at each experimental timepoint. These values were used as the simulated data. Residuals were computed by subtracting observed values from simulated values (Simulated – Observed) at each timepoint. Residuals were plotted over time to visualize deviations between each model and experimental data.
Synergy index calculation
To quantify synergy between HSF1 and Mediator in regulating transcription, we calculated the additive expectation based on the individual effects of each factor.48 For metrics where higher values reflect increased activity (e.g., number of active PICs), the expected additive effect was computed as:
where baseline refers to the value that had both Mediator and HSF1 removed. For metrics where lower values indicate enhanced activity (e.g., time to first round of transcription), raw time values were first transformed into effectiveness units by taking the reciprocal (1/time), and the additive expectation was calculated using the same formula. The observed combined effect (HSF1 + Mediator) was then compared to the expectation, and synergy was reported as the difference between observed and expected values, expressed as a normalized synergy index:
A positive synergy index indicates that the combined effect exceeded the additive expectation, suggesting functional synergy. For example, an SI of 0.5 indicates that the observed effect was 50% greater than the expected additive effect.
Statistical analysis
Statistical comparison of RIFT data was performed using a Welch’s t test, to determine p-values while accounting for variance in sample sizes. P-values are reported on plots and the “ns” label was used for any p-value ≥0.2. Outliers were determined by robust regression and outlier removal (ROUT method) with a strict Q = 0.1%.108 Statistical analyses and plot generation was completed using GraphPad Prism 10 for macOS version 10.4.1(532).
Supplementary Material
SUPPLEMENTAL INFORMATION
Supplemental information can be found online at https://doi.org/10.1016/j.celrep.2025.116251.
KEY RESOURCES TABLE.
| REAGENT or RESOURCE | SOURCE | IDENTIFIER |
|---|---|---|
|
| ||
| Antibodies | ||
|
| ||
| monoclonal ERCC3 antibody | This paper | N/A |
| monoclonal TAF4 antibody | This paper | N/A |
|
| ||
| Chemicals, peptides, and recombinant proteins | ||
|
| ||
| Alexa Fluor™ 647 C2 Maleimide | Invitrogen | Cat#A20347 |
| Biotin-PEG-succinimidyl carbonate | Laysan Bio | Cat#BIOTIN-PEG-SC-5000-1GR |
| Catalase | Sigma-Aldrich | Cat#E3289-100MG |
| D-(+)-Glucose | Sigma-Aldrich | Cat#G8270-100G |
| DTT | Sigma-Aldrich | Cat#D0632 |
| Glucose oxidase | TCI America | Cat#G00501G |
| Glutathione Sepharose beads | Cytiva | Cat#17075601 |
| HBC508 | Fluorescence Diagnosis (Shanghai) Biotech Co. Ltd. | Cat#H15081 |
| HBC525 | Fluorescence Diagnosis (Shanghai) Biotech Co. Ltd. | Cat# H15251 |
| L-Glutathione reduced | Sigma-Aldrich | Cat#G4251 |
| mPEG-succinimidyl valerate | Laysan Bio | Cat#MPEG-SVA-5000-1G |
| N-(2-Aminoethyl)-3-aminopropyltrimethoxysilane | Sigma-Aldrich | Cat#8191720100 |
| Phusion High-Fidelity DNA polymerase | Thermo Scientific | Cat#F530S |
| Pierce™ Dye Removal Columns | Thermo Scientific | Cat#22858 |
| RNaseOUT™ | Invitrogen | Cat#10777019 |
| Streptavidin | Invitrogen | Cat#434301 |
| TBP | Active Motif | Cat#81114 |
| TetraSpeck Microspheres, 0.1 μm | Invitrogen | Cat#T7279 |
| TFIIA | Protein One | Cat#P1032-01 |
| TFIIB | Novus Biologicals | Cat# NBP1-30313 |
| Trolox | Cayman Chemical | Cat#NC1980415 |
| T7 RNA Polymerase (20U/uL) | Thermo Scientific | Cat#EP0112 |
| UltraPure™ BSA | Invitrogen | Cat#AM2616 |
| SY-5609 | Syros Pharmaceuticals | N/A |
|
| ||
| Experimental model and study participant details | ||
|
| ||
| HeLa S3 cells | ATCC | CCL-2.2 |
|
| ||
| Critical commercial assays | ||
|
| ||
| Pierce™ RNA 3′ End Biotinylation Kit | Thermo Scientific | Cat#20160 |
| TranscriptAid T7 High Yield Transcription Kit | Thermo Scientific | Cat#K0441 |
|
| ||
| Oligonucleotides | ||
|
| ||
| 5′ Alexa Fluor 647: /5Alex647N/TTCTCAGGCAG ACTAGGCCATTAGGTG |
Integrated DNA technologies (IDT) | N/A |
|
| ||
| Recombinant DNA | ||
|
| ||
| pET28a-2Pepper | Fluorescence Diagnosis (Shanghai) Biotech Co. Ltd. | Cat#PET2802MCS0 |
| FLAG-HSF1 | Wang et al.101 | Addgene plasmid #32537 |
| pET-28a-mCherry-MED1-IDR | Mensah et al.102 | Addgene plasmid #194545 |
| mCherry-DBD-MED1-IDR | This paper | N/A |
| mCherry-HSF1 | This paper | N/A |
| mCherry-HSF1-AD | This paper | N/A |
| GST-SREBP-AD | Ebmeier et al.103 | N/A |
|
| ||
| Software and algorithms | ||
|
| ||
| FIJI v2.14.0/1.54k | Schindelin et al.104 | https://imagej.net/software/fiji/downloads |
| GraphPad Prism v10.4.1(532) | GraphPad Software | https://www.graphpad.com |
| NIS-Elements v5.21.03 and v5.42.03 | Nikon | https://www.microscope.healthcare.nikon.com/products/software/nis-elements |
| RStudio: Integrated Development Environment for R | Posit Team | https://www.posit.co/ |
| Custom code (RIFTA) | This paper | https://github.com/meganpalacio/RIFTA |
|
| ||
| Other | ||
|
| ||
| Micro Cover Glass | VWR International | Cat#48393-230 |
| Microscope Glass Slides | Fisher Scientific | Cat#12-550-A3 |
| NTP Set, 100 mM | Thermo Scientific | Cat#R0481 |
Highlights.
RNAPII activation with HSF1 condensates identical to HSF1 single molecules
TFs and Mediator control RNAPII burst size and rapid reinitiation
Mediator is sufficient for TF-promoter recruitment, without TF-DNA binding
Rapid re-initiation kinetics support RNAPII bursting via PIC scaffold
ACKNOWLEDGMENTS
We thank Bede Portz and Ann Boija (Dewpoint Therapeutics) for their helpful advice; Jim Goodrich, Stephen Archuleta, and Joe Dragavon (UC-Boulder) for assistance with development of the RIFT system; Theresa Nahreini (UC-Boulder) for cell culture assistance; Annette Erbse (UC-Boulder) for instrumentation support; and Kent Ritchie for development of the RIFTA script. We thank Jim Goodrich (UC-Boulder) for providing monoclonal TAF4 antibodies and R. Tjian (UC-Berkeley) for monoclonal ERCC3 antibodies. Imaging was performed at the UC-Boulder BioFrontiers Institute’s Advanced Light Microscopy Core (RRID: SCR_018302) on microscopes supported by the BioFrontiers Institute and Howard Hughes Medical Institute. We acknowledge the UC-Boulder Shared Instruments Pool (RRID: SCR_018986), funded by the NIH (S10OD034218; S10OD025267). This work was supported by the NIH (R35 GM139550 to D.J.T. and T32 GM065103 to M.P.) and the NSF (MCB-1818147 to D.J.T. and DGE-204034 to M.P.). Funding was also provided by Dewpoint Therapeutics to D.J.T.
Footnotes
DECLARATION OF INTERESTS
D.J.T. received some funding support from Dewpoint Therapeutics.
REFERENCES
- 1.Schier AC, and Taatjes DJ (2020). Structure and mechanism of the RNA polymerase II transcription machinery. Genes Dev. 34, 465–488. 10.1101/gad.335679.119. [DOI] [PMC free article] [PubMed] [Google Scholar]
- 2.Roeder RG (1996). The role of general initiation factors in transcription by RNA polymerase II. Trends Biochem. Sci. 21, 327–335. [PubMed] [Google Scholar]
- 3.Roeder RG (2019). 50+ years of eukaryotic transcription: an expanding universe of factors and mechanisms. Nat. Struct. Mol. Biol. 26, 783–791. 10.1038/s41594-019-0287-x. [DOI] [PMC free article] [PubMed] [Google Scholar]
- 4.Thomas MC, and Chiang CM (2006). The general transcription machinery and general cofactors. Crit. Rev. Biochem. Mol. Biol. 41, 105–178. [DOI] [PubMed] [Google Scholar]
- 5.Goodrich JA, and Tjian R (1994). Transcription factors IIE and IIH and ATP hydrolysis direct promoter clearance by RNA polymerase II. Cell 77, 145–156. [DOI] [PubMed] [Google Scholar]
- 6.Horn AE, Kugel JF, and Goodrich JA (2016). Single molecule microscopy reveals mechanistic insight into RNA polymerase II preinitiation complex assembly and transcriptional activity. Nucleic Acids Res. 44, 7132–7143. 10.1093/nar/gkw321. [DOI] [PMC free article] [PubMed] [Google Scholar]
- 7.Kugel JF, and Goodrich JA (1998). Promoter escape limits the rate of RNA polymerase II transcription and is enhanced by TFIIE, TFIIH, and ATP on negatively supercoiled DNA. Proc. Natl. Acad. Sci. USA 95, 9232–9237. [DOI] [PMC free article] [PubMed] [Google Scholar]
- 8.Parvin JD, Shykind BM, Meyers RE, Kim J, and Sharp PA (1994). Multiple sets of basal factors initiate transcription by RNA polymerase II. J. Biol. Chem. 269, 18414–18421. [PubMed] [Google Scholar]
- 9.Louder RK, He Y, López-Blanco JR, Fang J, Chacón P, and Nogales E (2016). Structure of promoter-bound TFIID and model of human pre-initiation complex assembly. Nature 531, 604–609. 10.1038/nature17394. [DOI] [PMC free article] [PubMed] [Google Scholar]
- 10.Richter WF, Nayak S, Iwasa J, and Taatjes DJ (2022). The Mediator complex as a master regulator of transcription by RNA polymerase II. Nat. Rev. Mol. Cell Biol. 23, 732–749. 10.1038/s41580-022-00498-3. [DOI] [PMC free article] [PubMed] [Google Scholar]
- 11.Lammers NC, Kim YJ, Zhao J, and Garcia HG (2020). A matter of time: Using dynamics and theory to uncover mechanisms of transcriptional bursting. Curr. Opin. Cell Biol. 67, 147–157. 10.1016/j.ceb.2020.08.001. [DOI] [PMC free article] [PubMed] [Google Scholar]
- 12.Patange S, Ball DA, Karpova TS, and Larson DR (2021). Towards a ‘spot on’ understanding of transcription in the nucleus. J. Mol. Biol. 433, 167016. [DOI] [PMC free article] [PubMed] [Google Scholar]
- 13.Rodriguez J, and Larson DR (2020). Transcription in Living Cells: Molecular Mechanisms of Bursting. Annu. Rev. Biochem. 89, 189–212. 10.1146/annurev-biochem-011520-105250. [DOI] [PubMed] [Google Scholar]
- 14.Wan Y, Anastasakis DG, Rodriguez J, Palangat M, Gudla P, Zaki G, Tandon M, Pegoraro G, Chow CC, Hafner M, and Larson DR (2021). Dynamic imaging of nascent RNA reveals general principles of transcription dynamics and stochastic splice site selection. Cell 184, 2878–2895.e20. 10.1016/j.cell.2021.04.012. [DOI] [PMC free article] [PubMed] [Google Scholar]
- 15.Buckley MS, Kwak H, Zipfel WR, and Lis JT (2014). Kinetics of promoter Pol II on Hsp70 reveal stable pausing and key insights into its regulation. Genes Dev. 28, 14–19. 10.1101/gad.231886.113. [DOI] [PMC free article] [PubMed] [Google Scholar]
- 16.Tantale K, Mueller F, Kozulic-Pirher A, Lesne A, Victor JM, Robert MC, Capozi S, Chouaib R, Bäcker V, Mateos-Langerak J, et al. (2016). A single-molecule view of transcription reveals convoys of RNA polymerases and multi-scale bursting. Nat. Commun. 7, 12248. 10.1038/ncomms12248. [DOI] [PMC free article] [PubMed] [Google Scholar]
- 17.Li J, Hsu A, Hua Y, Wang G, Cheng L, Ochiai H, Yamamoto T, and Pertsinidis A (2020). Single-gene imaging links genome topology, promoter-enhancer communication and transcription control. Nat. Struct. Mol. Biol. 27, 1032–1040. 10.1038/s41594-020-0493-6. [DOI] [PMC free article] [PubMed] [Google Scholar]
- 18.Lim B, Heist T, Levine M, and Fukaya T (2018). Visualization of Transvection in Living Drosophila Embryos. Mol. Cell 70, 287–296.e6. 10.1016/j.molcel.2018.02.029. [DOI] [PMC free article] [PubMed] [Google Scholar]
- 19.Ohishi H, Shinkai S, Owada H, Fujii T, Hosoda K, Onami S, Yamamoto T, Ohkawa Y, and Ochiai H (2024). Transcription-coupled changes in genomic region proximities during transcriptional bursting. Sci. Adv. 10, eadn0020. 10.1126/sciadv.adn0020. [DOI] [PMC free article] [PubMed] [Google Scholar]
- 20.Nguyen VQ, Ranjan A, Liu S, Tang X, Ling YH, Wisniewski J, Mizuguchi G, Li KY, Jou V, Zheng Q, et al. (2021). Spatiotemporal coordination of transcription preinitiation complex assembly in live cells. Mol. Cell 81, 3560–3575.e6. 10.1016/j.molcel.2021.07.022. [DOI] [PMC free article] [PubMed] [Google Scholar]
- 21.Cho CY, and O’Farrell PH (2023). Stepwise modifications of transcriptional hubs link pioneer factor activity to a burst of transcription. Nat. Commun. 14, 4848. 10.1038/s41467-023-40485-6. [DOI] [PMC free article] [PubMed] [Google Scholar]
- 22.Cho WK, Jayanth N, English BP, Inoue T, Andrews JO, Conway W, Grimm JB, Spille JH, Lavis LD, Lionnet T, and Cisse II (2016). RNA Polymerase II cluster dynamics predict mRNA output in living cells. eLife 5, e13617. 10.7554/eLife.13617. [DOI] [PMC free article] [PubMed] [Google Scholar]
- 23.Cho WK, Spille JH, Hecht M, Lee C, Li C, Grube V, and Cisse II (2018). Mediator and RNA polymerase II clusters associate in transcription-dependent condensates. Science 361, 412–415. 10.1126/science.aar4199. [DOI] [PMC free article] [PubMed] [Google Scholar]
- 24.Pei G, Lyons H, Li P, and Sabari BR (2025). Transcription regulation by biomolecular condensates. Nat. Rev. Mol. Cell Biol. 26, 213–236. 10.1038/s41580-024-00789-x. [DOI] [PMC free article] [PubMed] [Google Scholar]
- 25.McSwiggen DT, Mir M, Darzacq X, and Tjian R (2019). Evaluating phase separation in live cells: diagnosis, caveats, and functional consequences. Genes Dev. 33, 1619–1634. 10.1101/gad.331520.119. [DOI] [PMC free article] [PubMed] [Google Scholar]
- 26.Musacchio A (2022). On the role of phase separation in the biogenesis of membraneless compartments. EMBO J. 41, e109952. 10.15252/embj.2021109952. [DOI] [PMC free article] [PubMed] [Google Scholar]
- 27.Palacio M, and Taatjes DJ (2022). Merging Established Mechanisms with New Insights: Condensates, Hubs, and the Regulation of RNA Polymerase II Transcription. J. Mol. Biol. 434, 167216. 10.1016/j.jmb.2021.167216. [DOI] [PMC free article] [PubMed] [Google Scholar]
- 28.Bohrer CH, and Larson DR (2023). Synthetic analysis of chromatin tracing and live-cell imaging indicates pervasive spatial coupling between genes. eLife 12, e81861. 10.7554/eLife.81861. [DOI] [PMC free article] [PubMed] [Google Scholar]
- 29.Brandao HB, Gabriele M, and Hansen AS (2021). Tracking and interpreting long-range chromatin interactions with super-resolution live-cell imaging. Curr. Opin. Cell Biol. 70, 18–26. 10.1016/j.ceb.2020.11.002. [DOI] [PMC free article] [PubMed] [Google Scholar]
- 30.Ferrie JJ, Karr JP, Tjian R, and Darzacq X (2022). Structure”-function relationships in eukaryotic transcription factors: The role of intrinsically disordered regions in gene regulation. Mol. Cell 82, 3970–3984. 10.1016/j.molcel.2022.09.021. [DOI] [PubMed] [Google Scholar]
- 31.Basu S, Mackowiak SD, Niskanen H, Knezevic D, Asimi V, Grosswendt S, Geertsema H, Ali S, Jerković I, Ewers H, et al. (2020). Unblending of Transcriptional Condensates in Human Repeat Expansion Disease. Cell 181, 1062–1079.e30. 10.1016/j.cell.2020.04.018. [DOI] [PMC free article] [PubMed] [Google Scholar]
- 32.Toth-Petroczy A, Oldfield CJ, Simon I, Takagi Y, Dunker AK, Uversky VN, and Fuxreiter M (2008). Malleable machines in transcription regulation: the mediator complex. PLoS Comput. Biol. 4, e1000243. [DOI] [PMC free article] [PubMed] [Google Scholar]
- 33.Revyakin A, Zhang Z, Coleman RA, Li Y, Inouye C, Lucas JK, Park SR, Chu S, and Tjian R (2012). Transcription initiation by human RNA polymerase II visualized at single-molecule resolution. Genes Dev. 26, 1691–1702. 10.1101/gad.194936.112. [DOI] [PMC free article] [PubMed] [Google Scholar]
- 34.Baek I, Friedman LJ, Gelles J, and Buratowski S (2021). Single-molecule studies reveal branched pathways for activator-dependent assembly of RNA polymerase II pre-initiation complexes. Mol. Cell 81, 3576–3588.e6. 10.1016/j.molcel.2021.07.025. [DOI] [PMC free article] [PubMed] [Google Scholar]
- 35.Rosen GA, Baek I, Friedman LJ, Joo YJ, Buratowski S, and Gelles J (2020). Dynamics of RNA polymerase II and elongation factor Spt4/5 recruitment during activator-dependent transcription. Proc. Natl. Acad. Sci. USA 117, 32348–32357. 10.1073/pnas.2011224117. [DOI] [PMC free article] [PubMed] [Google Scholar]
- 36.Zhou DH, Jeon J, Farheen N, Friedman LJ, Kondev J, Buratowski S, and Gelles J (2024). Mechanisms of synergistic Mediator recruitment in RNA polymerase II transcription activation revealed by single-molecule fluorescence. Preprint at bioRxiv, 2024.12.10.627625. 10.1101/2024.12.10.627625. [DOI] [Google Scholar]
- 37.Chen X, Zhang D, Su N, Bao B, Xie X, Zuo F, Yang L, Wang H, Jiang L, Lin Q, et al. (2019). Visualizing RNA dynamics in live cells with bright and stable fluorescent RNAs. Nat. Biotechnol. 37, 1287–1293. 10.1038/s41587-019-0249-1. [DOI] [PubMed] [Google Scholar]
- 38.Allen BL, Quach K, Jones T, Levandowski CB, Ebmeier CC, Rubin JD, Read T, Dowell RD, Schepartz A, and Taatjes DJ (2022). Suppression of p53 response by targeting p53-Mediator binding with a stapled peptide. Cell Rep. 39, 110630. 10.1016/j.celrep.2022.110630. [DOI] [PMC free article] [PubMed] [Google Scholar]
- 39.Fant CB, Levandowski CB, Gupta K, Maas ZL, Moir J, Rubin JD, Sawyer A, Esbin MN, Rimel JK, Luyties O, et al. (2020). TFIID Enables RNA Polymerase II Promoter-Proximal Pausing. Mol. Cell 78, 785–793.e8. 10.1016/j.molcel.2020.03.008. [DOI] [PMC free article] [PubMed] [Google Scholar]
- 40.Hawley DK, and Roeder RG (1987). Functional steps in transcription initiation and reinitiation from the major late promoter in a HeLa nuclear extract. J. Biol. Chem. 262, 3452–3461. [PubMed] [Google Scholar]
- 41.Holstege FC, Fiedler U, and Timmers HT (1997). Three transitions in the RNA polymerase II transcription complex during initiation. EMBO J. 16, 7468–7480. 10.1093/emboj/16.24.7468. [DOI] [PMC free article] [PubMed] [Google Scholar]
- 42.Kamakaka RT, Tyree CM, and Kadonaga JT (1991). Accurate and efficient RNA polymerase II transcription with a soluble nuclear fraction derived from Drosophila embryos. Proc. Natl. Acad. Sci. USA 88, 1024–1028. 10.1073/pnas.88.3.1024. [DOI] [PMC free article] [PubMed] [Google Scholar]
- 43.Luyties O, Sanford L, Rodino J, Nagel M, Jones T, Rimel JK, Ebmeier CC, Palacio M, Shelby GS, Cozzolino K, et al. (2025). Multiomics and biochemical reconstitution reveal CDK7-dependent mechanisms controlling RNA polymerase II function at gene 5’- and 3’ ends. Cell Rep. 44, 115904. 10.1016/j.celrep.2025.115904. [DOI] [PMC free article] [PubMed] [Google Scholar]
- 44.Bradner JE, Hnisz D, and Young RA (2017). Transcriptional Addiction in Cancer. Cell 168, 629–643. 10.1016/j.cell.2016.12.013. [DOI] [PMC free article] [PubMed] [Google Scholar]
- 45.Guermah M, Tao Y, and Roeder RG (2001). Positive and negative TAF(II) functions that suggest a dynamic TFIID structure and elicit synergy with traps in activator-induced transcription. Mol. Cell Biol. 21, 6882–6894. 10.1128/MCB.21.20.6882-6894.2001. [DOI] [PMC free article] [PubMed] [Google Scholar]
- 46.Johnson KM, Wang J, Smallwood A, Arayata C, and Carey M (2002). TFIID and human mediator coactivator complexes assemble cooperatively on promoter DNA. Genes Dev. 16, 1852–1863. [DOI] [PMC free article] [PubMed] [Google Scholar]
- 47.Marr MT, Isogai Y, Wright KJ, and Tjian R (2006). Coactivator cross-talk specifies transcriptional output. Genes Dev. 20, 1458–1469. [DOI] [PMC free article] [PubMed] [Google Scholar]
- 48.Herschlag D, and Johnson FB (1993). Synergism in transcriptional activation: a kinetic view. Genes Dev. 7, 173–179. [DOI] [PubMed] [Google Scholar]
- 49.Nagel M, and Taatjes DJ (2025). Regulation of RNA polymerase II transcription through re-initiation and bursting. Mol. Cell 85, 1907–1919. 10.1016/j.molcel.2025.04.011. [DOI] [PMC free article] [PubMed] [Google Scholar]
- 50.Kim S, and Gross DS (2013). Mediator recruitment to heat shock genes requires dual Hsf1 activation domains and mediator tail subunits Med15 and Med16. J. Biol. Chem. 288, 12197–12213. 10.1074/jbc.M112.449553. [DOI] [PMC free article] [PubMed] [Google Scholar]
- 51.Park JM, Werner J, Kim JM, Lis JT, and Kim YJ (2001). Mediator, not holoenzyme, is directly recruited to the heat shock promoter by HSF upon heat shock. Mol. Cell 8, 9–19. [DOI] [PubMed] [Google Scholar]
- 52.Kmiecik SW, and Mayer MP (2022). Molecular mechanisms of heat shock factor 1 regulation. Trends Biochem. Sci. 47, 218–234. 10.1016/j.tibs.2021.10.004. [DOI] [PubMed] [Google Scholar]
- 53.Taatjes DJ, Näär AM, Andel F, Nogales E, and Tjian R (2002). Structure, function, and activator-induced conformations of the CRSP coactivator. Science 295, 1058–1062. [DOI] [PubMed] [Google Scholar]
- 54.Yang F, Vought BW, Satterlee JS, Walker AK, Jim Sun ZY, Watts JL, DeBeaumont R, Saito RM, Hyberts SG, Yang S, et al. (2006). An ARC/Mediator subunit required for SREBP control of cholesterol and lipid homeostasis. Nature 442, 700–704. [DOI] [PubMed] [Google Scholar]
- 55.Chong S, Graham TGW, Dugast-Darzacq C, Dailey GM, Darzacq X, and Tjian R (2022). Tuning levels of low-complexity domain interactions to modulate endogenous oncogenic transcription. Mol. Cell 82, 2084–2097.e5. 10.1016/j.molcel.2022.04.007. [DOI] [PubMed] [Google Scholar]
- 56.Chowdhary S, Paracha S, Dyer L, and Pincus D (2025). Emergent 3D genome reorganization from the stepwise assembly of transcriptional condensates. Preprint at bioRxiv, 2025.02.23.639564. 10.1101/2025.02.23.639564. [DOI] [Google Scholar]
- 57.Fu Y, Yang X, Li S, Ma C, An Y, Cheng T, Liang Y, Sun S, Cheng T, Zhao Y, et al. (2025). Dynamic properties of transcriptional condensates modulate CRISPRa-mediated gene activation. Nat. Commun. 16, 1640. 10.1038/s41467-025-56735-8. [DOI] [PMC free article] [PubMed] [Google Scholar]
- 58.Trojanowski J, Frank L, Rademacher A, Mücke N, Grigaitis P, and Rippe K (2022). Transcription activation is enhanced by multivalent interactions independent of phase separation. Mol. Cell 82, 1878–1893. e10. 10.1016/j.molcel.2022.04.017. [DOI] [PubMed] [Google Scholar]
- 59.Yang J, Chung CI, Koach J, Liu H, Navalkar A, He H, Ma Z, Zhao Q, Yang X, He L, et al. (2024). MYC phase separation selectively modulates the transcriptome. Nat. Struct. Mol. Biol. 31, 1567–1579. 10.1038/s41594-024-01322-6. [DOI] [PMC free article] [PubMed] [Google Scholar]
- 60.Boehning M, Dugast-Darzacq C, Rankovic M, Hansen AS, Yu T, Marie-Nelly H, McSwiggen DT, Kokic G, Dailey GM, Cramer P, et al. (2018). RNA polymerase II clustering through carboxy-terminal domain phase separation. Nat. Struct. Mol. Biol. 25, 833–840. 10.1038/s41594-018-0112-y. [DOI] [PubMed] [Google Scholar]
- 61.Boija A, Klein IA, Sabari BR, Dall’Agnese A, Coffey EL, Zamudio AV, Li CH, Shrinivas K, Manteiga JC, Hannett NM, et al. (2018). Transcription Factors Activate Genes through the Phase-Separation Capacity of Their Activation Domains. Cell 175, 1842–1855.e16. 10.1016/j.cell.2018.10.042. [DOI] [PMC free article] [PubMed] [Google Scholar]
- 62.Guo YE, Manteiga JC, Henninger JE, Sabari BR, Dall’Agnese A, Hannett NM, Spille JH, Afeyan LK, Zamudio AV, Shrinivas K, et al. (2019). Pol II phosphorylation regulates a switch between transcriptional and splicing condensates. Nature 572, 543–548. 10.1038/s41586-019-1464-0. [DOI] [PMC free article] [PubMed] [Google Scholar]
- 63.Zhang H, Shao S, Zeng Y, Wang X, Qin Y, Ren Q, Xiang S, Wang Y, Xiao J, and Sun Y (2022). Reversible phase separation of HSF1 is required for an acute transcriptional response during heat shock. Nat. Cell Biol. 24, 340–352. 10.1038/s41556-022-00846-7. [DOI] [PubMed] [Google Scholar]
- 64.Sabari BR, Dall’Agnese A, Boija A, Klein IA, Coffey EL, Shrinivas K, Abraham BJ, Hannett NM, Zamudio AV, Manteiga JC, et al. (2018). Coactivator condensation at super-enhancers links phase separation and gene control. Science 361, eear3958. 10.1126/science.aar3958. [DOI] [PMC free article] [PubMed] [Google Scholar]
- 65.Pomp W, Meeussen JVW, and Lenstra TL (2024). Transcription factor exchange enables prolonged transcriptional bursts. Mol. Cell 84, 1036–1048.e9. 10.1016/j.molcel.2024.01.020. [DOI] [PMC free article] [PubMed] [Google Scholar]
- 66.Senecal A, Munsky B, Proux F, Ly N, Braye FE, Zimmer C, Mueller F, and Darzacq X (2014). Transcription factors modulate c-Fos transcriptional bursts. Cell Rep. 8, 75–83. 10.1016/j.celrep.2014.05.053. [DOI] [PMC free article] [PubMed] [Google Scholar]
- 67.Stavreva DA, Garcia DA, Fettweis G, Gudla PR, Zaki GF, Soni V, McGowan A, Williams G, Huynh A, Palangat M, et al. (2019). Transcriptional Bursting and Co-bursting Regulation by Steroid Hormone Release Pattern and Transcription Factor Mobility. Mol. Cell 75, 1161–1177.e11. 10.1016/j.molcel.2019.06.042. [DOI] [PMC free article] [PubMed] [Google Scholar]
- 68.Chen H, and Pugh BF (2021). What do Transcription Factors Interact With? J. Mol. Biol. 433, 166883. 10.1016/j.jmb.2021.166883. [DOI] [PMC free article] [PubMed] [Google Scholar]
- 69.Udupa A, Kotha SR, and Staller MV (2024). Commonly asked questions about transcriptional activation domains. Curr. Opin. Struct. Biol. 84, 102732. 10.1016/j.sbi.2023.102732. [DOI] [PMC free article] [PubMed] [Google Scholar]
- 70.Furlong EEM, and Levine M (2018). Developmental enhancers and chromosome topology. Science 361, 1341–1345. 10.1126/science.aau0320. [DOI] [PMC free article] [PubMed] [Google Scholar]
- 71.Karr JP, Ferrie JJ, Tjian R, and Darzacq X (2022). The transcription factor activity gradient (TAG) model: contemplating a contact-independent mechanism for enhancer-promoter communication. Genes Dev. 36, 7–16. 10.1101/gad.349160.121. [DOI] [PMC free article] [PubMed] [Google Scholar]
- 72.Finn EH, Pegoraro G, Brandao HB, Valton AL, Oomen ME, Dekker J, Mirny L, and Misteli T (2019). Extensive Heterogeneity and Intrinsic Variation in Spatial Genome Organization. Cell 176, 1502–1515.e10. 10.1016/j.cell.2019.01.020. [DOI] [PMC free article] [PubMed] [Google Scholar]
- 73.Dongre S, and Vastenhouw N (2024). Specificity in transcription factor clustering is encoded in the genome. Preprint at bioRxiv, 621483. 10.1101/2024.11.01.621483. [DOI] [Google Scholar]
- 74.Sidorov S, Pal K, Lenhard B, and Luscombe NM (2024). Cross-tissue isoform switches by human transcription factors suggest a wide-spread regulatory mechanism. Preprint at bioRxiv, 625692. [Google Scholar]
- 75.Mahendrawada L, Warfield L, Donczew R, and Hahn S (2025). Low overlap of transcription factor DNA binding and regulatory targets. Nature 642, 796–804. 10.1038/s41586-025-08916-0. [DOI] [PubMed] [Google Scholar]
- 76.Shoemaker BA, Portman JJ, and Wolynes PG (2000). Speeding molecular recognition by using the folding funnel: the fly-casting mechanism. Proc. Natl. Acad. Sci. USA 97, 8868–8873. 10.1073/pnas.160259697. [DOI] [PMC free article] [PubMed] [Google Scholar]
- 77.Farley EK, Olson KM, Zhang W, Brandt AJ, Rokhsar DS, and Levine MS (2015). Suboptimization of developmental enhancers. Science 350, 325–328. 10.1126/science.aac6948. [DOI] [PMC free article] [PubMed] [Google Scholar]
- 78.Lim F, Solvason JJ, Ryan GE, Le SH, Jindal GA, Steffen P, Jandu SK, and Farley EK (2024). Affinity-optimizing enhancer variants disrupt development. Nature 626, 151–159. 10.1038/s41586-023-06922-8. [DOI] [PMC free article] [PubMed] [Google Scholar]
- 79.Naderi J, Magalhaes AP, Kibar G, Stik G, Zhang Y, Mackowiak SD, Wieler HM, Rossi F, Buschow R, Christou-Kent M, et al. (2024). An activity-specificity trade-off encoded in human transcription factors. Nat. Cell Biol. 26, 1309–1321. 10.1038/s41556-024-01411-0. [DOI] [PMC free article] [PubMed] [Google Scholar]
- 80.Bremer A, Lang WH, Kempen RP, Sweta K, Taylor AB, Borgia MB, Ansari AZ, and Mittag T (2024). Reconciling competing models on the roles of condensates and soluble complexes in transcription factor function. Preprint at bioRxiv, 2024.11.21.624739. [DOI] [PMC free article] [PubMed] [Google Scholar]
- 81.Zamudio AV, Dall’Agnese A, Henninger JE, Manteiga JC, Afeyan LK, Hannett NM, Coffey EL, Li CH, Oksuz O, Sabari BR, et al. (2019). Mediator Condensates Localize Signaling Factors to Key Cell Identity Genes. Mol Cell 76, 753–766.e6. 10.1016/j.molcel.2019.08.016. [DOI] [PMC free article] [PubMed] [Google Scholar]
- 82.Tsai KL, Tomomori-Sato C, Sato S, Conaway RC, Conaway JW, and Asturias FJ (2014). Subunit architecture and functional modular re-arrangements of the transcriptional mediator complex. Cell 157, 1430–1444. 10.1016/j.cell.2014.05.015. [DOI] [PMC free article] [PubMed] [Google Scholar]
- 83.Meyer KD, Lin SC, Bernecky C, Gao Y, and Taatjes DJ (2010). p53 activates transcription by directing structural shifts in Mediator. Nat. Struct. Mol. Biol. 17, 753–760. [DOI] [PMC free article] [PubMed] [Google Scholar]
- 84.Kupkova K, Shetty SJ, Hoffman EA, Bekiranov S, and Auble DT (2024). Genome-scale chromatin binding dynamics of RNA Polymerase II general transcription machinery components. EMBO J. 43, 1799–1821. 10.1038/s44318-024-00089-2. [DOI] [PMC free article] [PubMed] [Google Scholar]
- 85.Ling YH, Ye Z, Liang C, Yu C, Park G, Corden JL, and Wu C (2024). Disordered C-terminal domain drives spatiotemporal confinement of RNAPII to enhance search for chromatin targets. Nat. Cell Biol. 26, 581–592. 10.1038/s41556-024-01382-2. [DOI] [PMC free article] [PubMed] [Google Scholar]
- 86.Pennington KL, Marr SK, Chirn GW, and Marr MT 2nd. (2013). Holo-TFIID controls the magnitude of a transcription burst and fine-tuning of transcription. Proc. Natl. Acad. Sci. USA 110, 7678–7683. 10.1073/pnas.1221712110. [DOI] [PMC free article] [PubMed] [Google Scholar]
- 87.Donovan BT, Huynh A, Ball DA, Patel HP, Poirier MG, Larson DR, Ferguson ML, and Lenstra TL (2019). Live-cell imaging reveals the interplay between transcription factors, nucleosomes, and bursting. EMBO J. 38, e100809. 10.15252/embj.2018100809. [DOI] [PMC free article] [PubMed] [Google Scholar]
- 88.Cantin GT, Stevens JL, and Berk AJ (2003). Activation domain-mediator interactions promote transcription preinitiation complex assembly on promoter DNA. Proc. Natl. Acad. Sci. USA 100, 12003–12008. [DOI] [PMC free article] [PubMed] [Google Scholar]
- 89.Yudkovsky N, Ranish JA, and Hahn S (2000). A transcription reinitiation intermediate that is stabilized by activator. Nature 408, 225–229. [DOI] [PubMed] [Google Scholar]
- 90.Du M, Stitzinger SH, Spille JH, Cho WK, Lee C, Hijaz M, Quintana A, and Cissé II (2024). Direct observation of a condensate effect on super-enhancer controlled gene bursting. Cell 187, 2595–2598. 10.1016/j.cell.2024.04.001. [DOI] [PubMed] [Google Scholar]
- 91.Larsson AJM, Johnsson P, Hagemann-Jensen M, Hartmanis L, Faridani OR, Reinius B, Segerstolpe Å, Rivera CM, Ren B, and Sandberg R (2019). Genomic encoding of transcriptional burst kinetics. Nature 565, 251–254. 10.1038/s41586-018-0836-1. [DOI] [PMC free article] [PubMed] [Google Scholar]
- 92.Lenstra TL, Coulon A, Chow CC, and Larson DR (2015). Single-Molecule Imaging Reveals a Switch between Spurious and Functional ncRNA Transcription. Mol. Cell 60, 597–610. 10.1016/j.molcel.2015.09.028. [DOI] [PMC free article] [PubMed] [Google Scholar]
- 93.Mahat DB, Tippens ND, Martin-Rufino JD, Waterton SK, Fu J, Blatt SE, and Sharp PA (2024). Single-cell nascent RNA sequencing unveils coordinated global transcription. Nature 631, 216–223. 10.1038/s41586-024-07517-7. [DOI] [PMC free article] [PubMed] [Google Scholar]
- 94.Rodriguez J, Ren G, Day CR, Zhao K, Chow CC, and Larson DR (2019). Intrinsic Dynamics of a Human Gene Reveal the Basis of Expression Heterogeneity. Cell 176, 213–226.e18. 10.1016/j.cell.2018.11.026. [DOI] [PMC free article] [PubMed] [Google Scholar]
- 95.Baek HJ, Kang YK, and Roeder RG (2006). Human Mediator enhances basal transcription by facilitating recruitment of transcription factor IIB during preinitiation complex assembly. J. Biol. Chem. 281, 15172–15181. [DOI] [PubMed] [Google Scholar]
- 96.Yakovchuk P, Gilman B, Goodrich JA, and Kugel JF (2010). RNA polymerase II and TAFs undergo a slow isomerization after the polymerase is recruited to promoter-bound TFIID. J. Mol. Biol. 397, 57–68. 10.1016/j.jmb.2010.01.025. [DOI] [PubMed] [Google Scholar]
- 97.Joo YJ, Ficarro SB, Soares LM, Chun Y, Marto JA, and Buratowski S (2017). Downstream promoter interactions of TFIID TAFs facilitate transcription reinitiation. Genes Dev. 31, 2162–2174. 10.1101/gad.306324.117. [DOI] [PMC free article] [PubMed] [Google Scholar]
- 98.Chen X, Liu W, Wang Q, Wang X, Ren Y, Qu X, Li W, and Xu Y (2023). Structural visualization of transcription initiation in action. Science 382, eadi5120. 10.1126/science.adi5120. [DOI] [PubMed] [Google Scholar]
- 99.Yang C, Fujiwara R, Kim HJ, Basnet P, Zhu Y, Gorbea Colón JJ, Steimle S, Garcia BA, Kaplan CD, and Murakami K (2022). Structural visualization of de novo transcription initiation by Saccharomyces cerevisiae RNA polymerase II. Mol. Cell 82, 660–676.e9. 10.1016/j.molcel.2021.12.020. [DOI] [PMC free article] [PubMed] [Google Scholar]
- 100.Zhan Y, Grabbe F, Oberbeckmann E, Dienemann C, and Cramer P (2024). Three-step mechanism of promoter escape by RNA polymerase II. Mol. Cell 84, 1699–1710.e6. 10.1016/j.molcel.2024.03.016. [DOI] [PubMed] [Google Scholar]
- 101.Wang X, Grammatikakis N, Siganou A, and Calderwood SK (2003). Regulation of molecular chaperone gene transcription involves the serine phosphorylation, 14–3-3 epsilon binding, and cytoplasmic sequestration of heat shock factor 1. Mol. Cell Biol. 23, 6013–6026. 10.1128/MCB.23.17.6013-6026.2003. [DOI] [PMC free article] [PubMed] [Google Scholar]
- 102.Mensah MA, Niskanen H, Magalhaes AP, Basu S, Kircher M, Sczakiel HL, Reiter AMV, Elsner J, Meinecke P, Biskup S, et al. (2023). Aberrant phase separation and nucleolar dysfunction in rare genetic diseases. Nature 614, 564–571. 10.1038/s41586-022-05682-1. [DOI] [PMC free article] [PubMed] [Google Scholar]
- 103.Ebmeier CC, and Taatjes DJ (2010). Activator-Mediator binding regulates Mediator-cofactor interactions. Proc. Natl. Acad. Sci. USA 107, 11283–11288. [DOI] [PMC free article] [PubMed] [Google Scholar]
- 104.Schindelin J, Arganda-Carreras I, Frise E, Kaynig V, Longair M, Pietzsch T, Preibisch S, Rueden C, Saalfeld S, Schmid B, et al. (2012). Fiji: an open-source platform for biological-image analysis. Nat. Methods 9, 676–682. 10.1038/nmeth.2019. [DOI] [PMC free article] [PubMed] [Google Scholar]
- 105.Ly E, Goodrich JA, and Kugel JF (2019). Monitoring transcriptional activity by RNA polymerase II in vitro using single molecule co-localization. Methods 159–160, 45–50. 10.1016/j.ymeth.2019.03.006. [DOI] [PubMed] [Google Scholar]
- 106.PositTeam (2024). RStudio: Integrated Development Environment for R (Version 2023.12.1.402) (Posit Software, PBC; ). http://www.posit.co. [Google Scholar]
- 107.Henninger JE, Oksuz O, Shrinivas K, Sagi I, LeRoy G, Zheng MM, Andrews JO, Zamudio AV, Lazaris C, Hannett NM, et al. (2021). RNA-Mediated Feedback Control of Transcriptional Condensates. Cell 184, 207–225.e24. 10.1016/j.cell.2020.11.030. [DOI] [PMC free article] [PubMed] [Google Scholar]
- 108.Motulsky HJ, and Brown RE (2006). Detecting outliers when fitting data with nonlinear regression - a new method based on robust nonlinear regression and the false discovery rate. BMC Bioinf. 7, 123. 10.1186/1471-2105-7-123. [DOI] [PMC free article] [PubMed] [Google Scholar]
Associated Data
This section collects any data citations, data availability statements, or supplementary materials included in this article.
Supplementary Materials
Data Availability Statement
All data reported in this paper will be shared by the lead contact upon request.
All original code has been deposited at our GitHub repository and is publicly available at https://github.com/meganpalacio/RIFTA.
Any additional information required to reanalyze the data reported in this paper is available from the lead contact upon request.