Abstract
Ca2+ signals, produced by Ca2+ release from cellular stores, switch metabolic responses inside cells. In muscle, Ca2+ sparks locally exhibit the rapid start and termination of the cell-wide signal. By imaging Ca2+ inside the store using shifted excitation and emission ratioing of fluorescence, a surprising observation was made: Depletion during sparks or voltage-induced cell-wide release occurs too late, continuing to progress even after the Ca2+ release channels have closed. This finding indicates that Ca2+ is released from a “proximate” compartment functionally in between store lumen and cytosol. The presence of a proximate compartment also explains a paradoxical surge in intrastore Ca2+, which was recorded upon stimulation of prolonged, cell-wide Ca2+ release. An intrastore surge upon induction of Ca2+ release was first reported in subcellular store fractions, where its source was traced to the store buffer, calsequestrin. The present results update the evolving concept, largely due to N. Ikemoto and C. Kang, of calsequestrin as a dynamic store. Given the strategic location and reduction of dimensionality of Ca2+-adsorbing linear polymers of calsequestrin, they could deliver Ca2+ to the open release channels more efficiently than the luminal store solution, thus constituting the proximate compartment. When store depletion becomes widespread, the polymers would collapse to increase store [Ca2+] and sustain the concentration gradient that drives release flux.
Keywords: calcium signaling, calcium sparks, excitation–contraction coupling, sarcoplasmic reticulum, skeletal muscle
Rapid changes in intracellular cytosolic [Ca2+] are required for signaling functions in many cell types (1). These changes are achieved via Ca2+ release through channels, ryanodine receptors (RyRs), which must open and close quickly. To increase its speed, gating of RyRs relies on effects of the permeant ion, including channel opening by elevated cytosolic [Ca2+] (2). In muscle, the desirable fast kinetic features are already present in its elementary signaling events, Ca2+ sparks (3), which involve the nearly simultaneous opening (4) of a number of channels (5), followed by their synchronized closing (4). Thus, this gating does not follow the usual Markovian rules for channels that evolve independently but requires time-keeping and synchronization (6). In cardiac muscle, depletion of sarcoplasmic reticulum (SR) Ca2+ is the likely timer of channel closing, and the substantial depletion that follows the cardiac beat (7) was imaged as “blinks” associated with Ca2+ sparks (8). The sensor that translates depletion into channel closing appears to be the main intra-SR buffer, calsequestrin (CSQ) (9).
By contrast, in skeletal muscle, depletion associated with a twitch is only 8–15% (10). This low rate of depletion reflects a SR with larger terminal cisternae containing higher concentrations of a CSQ of greater binding capacity, thus constituting a much greater calcium reservoir. Despite the greater store, sparks of skeletal muscle are even briefer and more stereotyped than in cardiac muscle, which casts doubts on the signaling role of depletion in skeletal muscle and elsewhere.
To ascertain the magnitude and role of Ca2+ depletion, we combined shifted excitation and emission ratioing of fluorescence (SEER) imaging of [Ca2+] in the SR, [Ca2+]SR (11) with confocal imaging of cytosolic [Ca2+] in frog skeletal muscle. First we sought images of the depletion associated with sparks, which we named “skraps” a priori, expecting mirror images of sparks. We had two surprises: Skraps did not mirror sparks but had their own suggestive kinetics. Also, cell-wide Ca2+ release was often accompanied by increases in free intrastore [Ca2+].
Results
Simultaneous Imaging of [Ca2+] in Cytosol and SR Lumen.
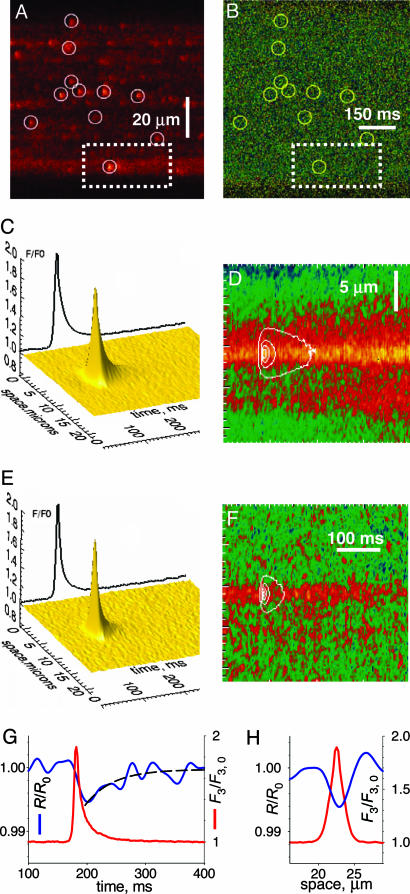
The evolution of [Ca2+]SR was monitored by the ratio of simultaneously recorded SEER (11) images (F1 and F2) of SR-trapped mag-indo-1. Cytosolic [Ca2+] was monitored by the fluorescence, F3, of rhod-2 placed in the cytosol. Fig. 1A is a line-scan image of F3(x, t) in a frog muscle cell with permeabilized plasmalemma immersed in a sparks-promoting solution. Fig. 1B is the ratio R(x, t) of F1 and F2, obtained simultaneously with F3. R is a monotonic function of [Ca2+]SR calibrated in situ (11).
Fig. 1.
Simultaneous imaging of cytosolic and intra-SR [Ca2+]. (A) Line-scan F3(x, t) of rhod-2 in cytosol. Circles mark Ca2+ sparks. (B) SEER image R(x, t) = F1/F2 of mag-indo-1 in organelles. Circles repeated from A. (C) Average of subarrays (dashed rectangle in A) of F3 around sparks. (D) Corresponding average of R, with spark overlayed. (E and F) Averages in cells with inhibited mitochondria. (G) Evolution of F3 (red trace) and R (blue trace) at the spark center. The exponential fit (dashed trace) has an 0.56% amplitude and a τ of 48 ms. (H) Spatial profiles of F3 at its peak (red trace) and R at nadir (blue trace).
[Ca2+] varied between 300 μM and 1 mM in non-spark regions (10 cells). The circles in Fig. 1A were placed by an automatic detector of sparks. Those in Fig. 1B mark the corresponding spatiotemporal locations in the R image. No depletion was evident to the eye at these locations. For every spark, the surrounding subarray within the image was extracted (dashed rectangle); their average is in Fig. 1C (numbers of cells and events averaged are given in the Table 1). Fig 1D is the corresponding average of R images, with the spark overlapped as a contour. Instead of the expected depression in [Ca2+]SR, we found a stable increase of ≈5% of the resting value of R, or an increase of ≈10% in [Ca2+] monitored by the dye.
Table 1.
Properties of sparks and skraps
| Condition | Skraps |
Sparks |
|||||||
|---|---|---|---|---|---|---|---|---|---|
| A | ttn, ms | W, μm | τ, ms | A | W, μm | RT, ms | n events | N cells | |
| Reference | NA | NA | NA | NA | 1.13 | 2.25 | 7.28 | 4,103 | 6 |
| Inhibited | 0.00 | 44 | 3.50 | 46.3 | 1.14 | 2.19 | 7.76 | 2,249 | 3 |
| SO4 | 0.01 | 70 | 3.95 | 702 | 1.65 | 2.69 | 9.12 | 2,878 | 3 |
| Inhibited | 0.01 | 66 | 3.70 | 200 | 1.41 | 2.57 | 7.43 | 3,421 | 3 |
| SO4, all | 0.01 | 68 | 3.85 | 251 | 1.52 | 2.68 | 8.21 | 6,299 | 6 |
For skraps, amplitude (A) and full width at half magnitude (W) are measured at nadir; for sparks, amplitude and full width at half magnitude are measured at peak. Both inhibited conditions are in the presence of mitochondrial inhibitors, with the first inhibited condition in reference and the second in SO4. “SO4, all” includes events in SO4 and SO4 inhibited. τ, time constant of recovery, RT, rise time; ttn, time to nadir; NA, not applicable.
Skraps of SR Depletion.
[Ca2+] increases in mitochondria upon Ca2+ release (12) and mag-indo-1 loads in mitochondria as well as SR (11). When imaging in cells exposed to four inhibitors of mitochondrial Ca2+ uptake (Fig. 1 E and F), the local increase in organellar [Ca2+] was greatly reduced, and a small depression was found on the central ridge of increased [Ca2+] at the time of the spark. The profiles of the normalized and filtered R(x, t) image are in Fig. 1 G and H. The decay in R (blue trace) started at the same time as the spark (red trace), reaching a nadir, down 0.6% from the starting value after an interval of ≈45 ms. The recovery had a time constant of 48 ms.
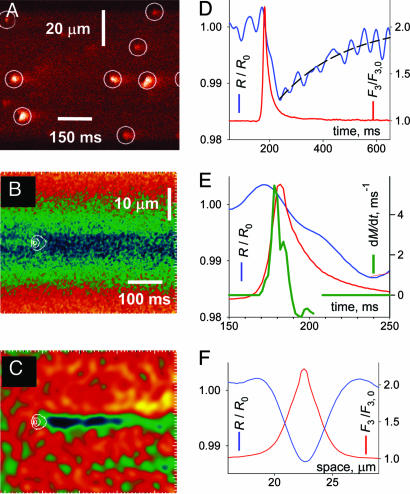
The skraps were defined better by replacing glutamate with sulfate in the solution, which widens sparks (as shown in Fig. 2A) probably by recruitment of channels (13). The local increase in organellar [Ca2+] was not found in sulfate, irrespective of the presence of mitochondrial inhibitors (Table 1). This effect of sulfate supports a mitochondrial origin of the increase, because sulfate is not a substrate for mitochondrial metabolism. Fig. 2B is the average R image at the location of sparks in sulfate. The panel reveals a steady depression and a transient skrap (shown in Fig. 2 C–E) after normalization and filtering. In sulfate the nadir is deeper, reaching 1.5%, and the recovery time constant is 251 ms. Differences in parameter values of the skrap in reference solution versus sulfate solution are entirely explained by the greater spark amplitude reached in sulfate (Fig. 7, which is published as supporting information on the PNAS web site).
Fig. 2.
Sparks and skraps enhanced by sulfate. (A) F3(x, t) in a fiber in sulfate. Note the larger sparks. (B) Average of spark regions in images R, located as in Fig. 1. (C) Image in B after low-pass filtering and normalization by prespark ratio, revealing a skrap. (D) Profiles at center of spark (red trace) or skrap (blue trace). The exponential fit (dashed trace) had an initial value of 1.5% and a τ of 251 ms. (E) Spark and skrap, with rate of signal mass production (dM/dt, green trace) as estimator of Ca2+ release flux. (F) Spatial profiles.
The Delayed Onset of Skraps.
The fractional change in ratio during skraps ranged from 0.006 (in reference solution) to 0.031 (in sulfate solution, in sparks of amplitude above the median), implying a reduction of [Ca2+] by at most 7.4%. A depletion of this magnitude is consistent with current estimates of Ca2+ current in a spark and Ca2+ content of the SR. By contrast, the kinetics of depletion were truly unexpected in that the phase of increasing depletion lasted too long. The flux of Ca2+ release underlying a spark (green trace in Fig. 2E) estimated by the rate of production of signal mass (14) was essentially over by the time the spark peaked. Surprisingly, [Ca2+]SR continued to decrease afterward, reaching nadir 50 ms later.
Ca2+ Release Induced by Physiological Stimuli.
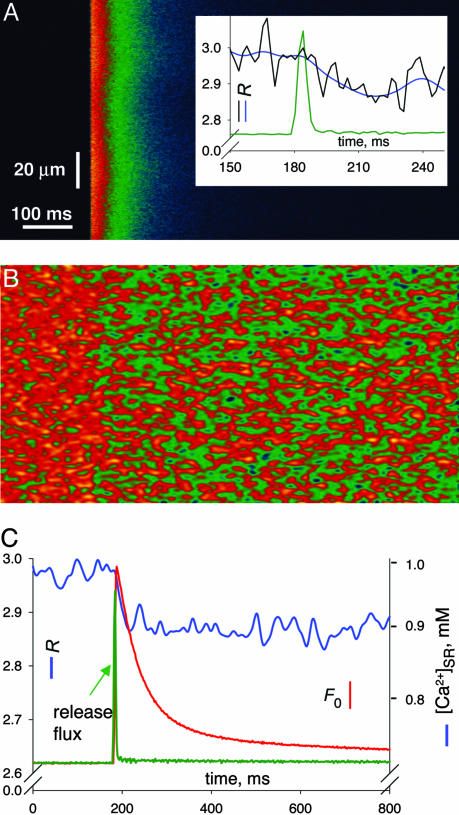
The paradoxical kinetics of skraps is reflected in physiological cell-wide transients. Upon mechanical peeling, the transverse tubular system reseals, restoring electrical excitability (15, 16). Shown in Fig. 3A is the cytosolic Ca2+ transient in response to an action potential in a peeled fiber. Fig. 3B shows the simultaneously recorded SEER ratio, and Fig. 3C shows their averaged time courses, with release flux as a green trace. Upon Ca2+ release, [Ca2+]SR fell from 980 to 900 μM, which is consistent with a depletion of ≈8% of total SR Ca2+ and within the range of earlier estimates of fractional release caused by an action potential (10). As plotted in blue in Fig. 3 A Inset and C, [Ca2+]SR continued to decrease for 30 ms after cessation of release, repeating in the cell-wide signal the delay observed locally. The average delay was somewhat briefer than in sparks, perhaps because the action potential synchronizes not just the beginning but also the termination of sparks (17). Unlike skraps, cell-wide depletion did not visibly recover by 600 ms, which agrees with refilling times estimated by global photometry (18). The faster recovery of single skraps suggests that local depletion is replenished by diffusion from neighboring SR regions. The same hypothesis justifies that smaller skraps recover more rapidly.
Fig. 3.
SR depletion upon an action potential. (A and B) Averages of six line-scan images from a skinned frog fiber. (A) F3(x, t) normalized to its average before the stimulus. Inset shows profiles in expanded scale. The blue trace shows R(t) from C. The black trace shows R(t) calculated after minimal filtering to show the slow onset of depletion. (B) Average of corresponding R images. (C) profiles F3(t) (red trace) or R(t) (blue trace) averaged over x. [Ca2+] scale calculated from equation 1 of ref. 11. The green trace shows the time course of release flux derived from F3 in arbitrary units.
A depletion delayed with respect to the flux that causes it violates conservation laws unless Ca2+ is released to the cytosol from a proximate source, distinct from the SR-luminal solution and therefore invisible to the monitoring dye. The evolution of [Ca2+]SR upon stimulation of prolonged cell-wide Ca2+ release revealed other properties of this proximate store.
Ca2+ Transients Inside the Cellular Store.
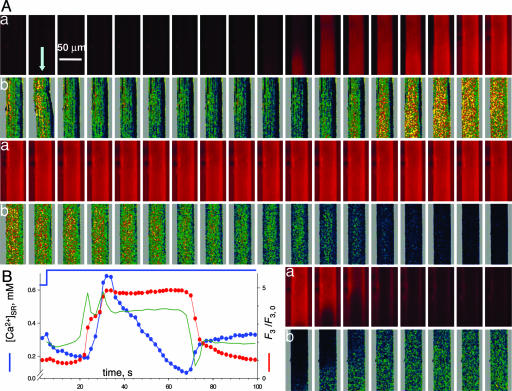
Fig. 4 shows successive xy scans in one fiber. Fig. 4A, rows a, shows images of F3 (monitoring [Ca2+] in the cytosol, [Ca2+]cyto); in rows b are images of [Ca2+]SR. Fig. 4B shows image-averaged F3 (red trace) and [Ca2+]SR (blue trace). At the time indicated by the arrow in Fig. 4A, the solution was changed to a release-inducing (RI) solution, a low Ca2+, low Mg2+ saline that induces moderate Ca2+ release. [Ca2+]cyto increased, stayed elevated for tens of seconds, then decayed rapidly to resting values. Surprisingly, here and in 11 other cells, there was also a transient increase in [Ca2+]SR.
Fig. 4.
Simultaneous imaging of cytosolic and SR [Ca2+]. (A) Rows: a, xy scans of fluorescence F3 of rhod-2; b, [Ca2+]SR derived from images R(x, y). (B) Image averages of F3/F3,0 (red trace) and [Ca2+]SR (blue trace). During acquisition of the second set (arrow in A), the solution was changed to RI solution (blue trace in B), eliciting Ca2+ release. An increase in [Ca2+]SR followed shortly after the beginning of the cytosolic transient. The green trace shows the time course of Ca2+ release flux.
An analogous transient, described in suspensions of SR vesicles upon stimulation by RyR-opening drugs was traced to intravesicular Ca2+ release from CSQ (19). The intrastore buffer is clearly involved in the present transients as well. The flux, shown in green in Fig. 4B, exhibits two peaks corresponding to the two steps in the cytosolic Ca2+ transient. The first peak caused only a small reduction in [Ca2+]SR (blue), which implies that the SR lumen was highly buffered. The second peak was essentially cotemporal with the [Ca2+]SR peak and perhaps was driven by it. Afterward, release continued at a lower rate, but [Ca2+]SR declined rapidly, reflecting a greatly reduced Ca2+ buffering power. It follows that the initial surge in [Ca2+]SR resulted from a decrease in buffering power, namely in the number or affinity of Ca2+ binding sites of the store buffer. This change is expected from CSQ, because this protein polymerizes and gains Ca2+ binding sites in the presence of elevated [Ca2+], whereas the opposite occurs as [Ca2+] is lowered (20).
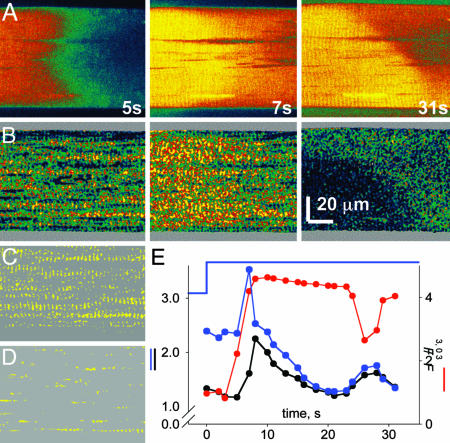
In Fig. 5, the response to low Mg2+ consisted of two separate cytosolic waves propagating slowly from left to right in the images (Fig. 5A). Whereas the first wave of release into the cytosol at 7 s was accompanied by marked increase in [Ca2+]SR, the second wave, which occurred at 31 s with a largely depleted SR, resulted in immediate and marked reduction in [Ca2+]SR (Fig. 5 A Right and B Right). This observation and Figs. 8 and 9, which are published as supporting information on the PNAS web site. establish a good SR Ca2+ load as a requisite for the intra-SR Ca2+ release.
Fig. 5.
[Ca2+]SR during waves of Ca2+ release. (A) xy scans of fluorescence F3 of rhod-2, selected from a series. (B) [Ca2+]SR (x, y) derived from R(x, y). (C) SR mask. Shown are areas where R(x,y) before Ca2+ release was >2. (D) Mitochondrial mask, where R was <1.5. (E) Average of F3 (red trace) and R in SR mask (blue trace) or mitochondrial mask (black trace). The application of RI solution is indicated at the top of the graph. (Scale bar: 20 μm.) Two waves of Ca2+ release move toward the right in A. The first wave in B Center is accompanied by increase in [Ca2+]SR. The second wave, instead, causes a sharp decrease in [Ca2+]SR.
Mitochondria contributed little to the signal and were identified as regions of the image with initially low [Ca2+] (11), clearly visible in the [Ca2+] image at 5 s, Fig. 5B Left, and marked yellow in the binary mask of Fig. 5D. The evolution of the average R in mitochondrial areas (• in Fig. 5E) features a transient in [Ca2+] that is minor and delayed by comparison with [Ca2+]SR. Fig. 9 shows that Ca2+ release in cells with poisoned mitochondria also resulted in a substantial [Ca2+]SR transient.
Figs. 8–12 and Supporting Text, which are published as supporting information on the PNAS web site, illustrate other aspects of the increase in [Ca2+]SR. (i) The increase in [Ca2+]SR occurred under a variety of triggers, including the signature RyR agonist, caffeine (Fig. 8), and sudden decreases in [Ca2+]cyto (Fig. 10) (ruling out artifacts of the increase in [Ca2+]cyto); (ii) similar to the earlier observations with vesicular SR (19), the [Ca2+]SR transient was most visible under moderate stimuli; (iii) increase in [Ca2+]SR was often preceded by a brief decrease in [Ca2+]SR; and (iv) it could also be demonstrated by using the single-λ dye fluo-5N loaded inside the SR (Figs. 11 and 12), which rules out artifacts related to the chemistry of one particular dye.
Discussion
A Proximate Ca2+ Store.
Both the delayed onset of depletion in skraps and the [Ca2+]SR transient observed during prolonged cell-wide Ca2+ release appear to violate the laws of mass conservation. Both observations are explained if the SR buffer provides a kinetically distinct Ca2+ compartment, which must be proximate (topologically close to the release channels), so that it constitutes the immediate source for release during a spark. The delayed depletion is then explained as flux from the SR lumen to reload Ca2+ lost from the buffer during a spark. Our work offers no evidence for a specific chemical nature of this compartment, which therefore remains purely hypothetical. However, known properties of CSQ are intriguingly consistent with the biophysical features required to explain the present results.
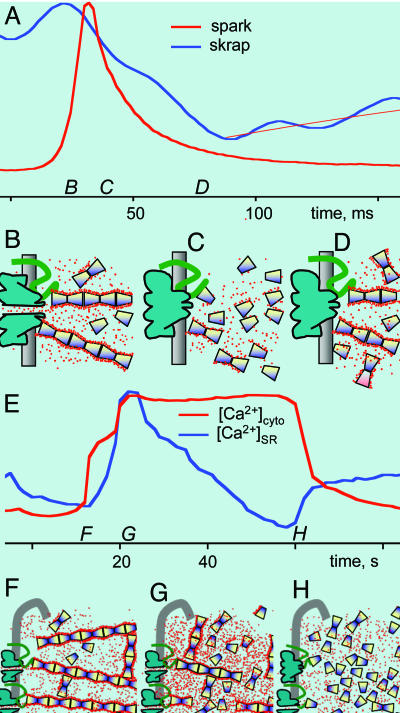
In terminal cisternae of skeletal muscle, CSQ forms linear polymers, visible as a fibrillar network (21). Bonds with triadin and junctin (22) place CSQ polymers near the luminal mouth of RyRs. Ca2+ favors formation of these polymers and stabilizes them, occupying a layer where it is adsorbed rather than bound (20). In this layer, Ca2+ is able to diffuse laterally and should be readily deliverable to the open channels (20). According to the properties of CSQ in aqueous solutions, this polymer-specific bound Ca2+ could constitute the proximate store, evolving as illustrated in Fig. 6: the rising phase of a spark (at time B in Fig. 6A) is due to Ca2+ release from CSQ polymers (Fig. 6B); this delivery should cause depolymerization, i.e., disassembly of the proximate store (Fig. 6C); continuing depletion afterward would reflect repolymerization and refilling of the proximate store (Fig. 6D).
Fig. 6.
A proximate source of releasable Ca2+. A proposal to reconcile the paradoxical evolution of [Ca2+]SR with features of the main store buffer, demonstrated in ref. 20 for CSQ in aqueous solutions. (A) Spark and skrap from 2E. (B–D) Putative states of the proximate store at times B–D. (B) The channel opens, and Ca2+ adsorbed to linear CSQ polymers feeds rapid release. (C) At time C the polymers are depleted and, hence, disassemble, a conformational change that could be transmitted by triadin as a signal for channel closure. (D) Depletion becomes deeper as Ca2+ replenishes the proximate store and the CSQ polymer reassembles. (E) [Ca2+]cyto and [Ca2+]SR during prolonged release, from Fig. 4B. (F) At resting, [Ca2+]SR CSQ polymers provide maximum Ca2+ binding. At time F, release lowers local [Ca2+]SR. (G) The polymer disassembles, and Ca2+ dissociates, causing the intra-SR transient. (H) As Ca2+ release continues, CSQ depolymerizes fully.
The [Ca2+]SR transient during prolonged cell-wide release, reproduced in Fig. 6E, is explained likewise: Fig. 6F represents the resting situation (at times F in Fig. 6E). In the well loaded SR, CSQ is polymerized (20). During Ca2+ release, [Ca2+]SR will decrease near release sites, which should cause widespread depolymerization of CSQ (20) with loss of binding sites (20) and release of Ca2+ to the SR lumen (Fig. 6G). Ca2+ release afterward will find a less buffered SR, resulting in rapid decay in [Ca2+]SR and further depolymerization of CSQ (Fig. 6H). Whether a net increase in [Ca2+]SR is observed will depend on the balance between exit rate of Ca2+ from CSQ and flux through release channels. From the present observations it appears that twitches in response to isolated action potentials only result in reduction of [Ca2+]SR, whereas increases in [Ca2+]SR require more prolonged stimulation of Ca2+ release.
Advantages of a Dynamic Store.
In 1968, Adam and Delbruck (23) proposed that ligand binding to cell surface receptors is enhanced by the two-dimensional diffusion that follows membrane adsorption of the ligands. This so-called reduction of dimensionality increases efficiency of diffusion (24) by a factor that may reach hundreds (25). The “perfect sink” version of this theory (26) applies to delivery of ions to an open channel. Because CSQ polymers are linear structures, of one dimension, adsorption to them would involve further reduction of dimensionality and diffusion enhancement. Given this dimensional advantage, CSQ polymers would function as “calcium wires,” which efficiently deliver Ca2+ to the channel mouth (20).
As we have found, depletion of the SR lumen is small, probably too small to convey the robust signal that closes channels to terminate sparks. This conclusion is especially obvious considering that depletion is only starting to develop at the time the channels close, at the peak of the spark (Fig. 6A). However, depletion of the proximate store could mediate channel gating. Indeed, CSQ depolymerizes upon loss of bound Ca2+. This structural change could have gating effects via triadin or junctin, as represented in Fig. 6C by an altered triadin and a closed channel. In this view, the proximate store would not just improve delivery of Ca2+ but also signal the channel to close after a set number of ions are delivered to it. Such an “ion-counting” device (first contemplated under different assumptions in ref. 27) should be especially useful with Ca2+, an ion with multiple signaling functions.
Finally, we have seen that under appropriate, albeit artificial, stimuli, the SR buffer may release bound Ca2+ and cause a transient inside the SR. In the examples, these transients helped sustain the [Ca2+] gradient that drives flux, thus delaying the effects of depletion under prolonged Ca2+ release. Ca2+ signaling is thought to be the role of membrane channels in cells and organelles (28). The intrastore Ca2+ transients demonstrated here suggest a different strategy, control of the driving force for Ca2+ release through changes in conformation or the aggregation state of cellular buffers. Combined with the targeted delivery of Ca2+ by linear polymers, local control of store [Ca2+] by buffer aggregation could contribute to the specificity of the signals over wide-ranging scales of time, space, and Ca2+ concentration.
Methods
Single semitendinosus muscle fibers of Rana pipiens were imaged. Frogs were decapitated under anesthesia, a procedure approved by Rush University’s Institutional Animal Care and Use Committee. Muscles were incubated for 120 min at 18°C in Ringer’s solution with 10 μM mag-indo-1 acetoxymethyl (AM). Fiber segments were mounted, stretched under pins, and membrane-permeabilized with 0.002% saponin (29) or mechanically skinned before mounting.
Solutions.
For permeabilized cells, the reference solution contained (in mM): 70.6 mM K glutamate, 5 mM Na2ATP, 10.29 mM Na2 creatine phosphate, 1 mM EGTA, 5 mM glucose, 10 mM Hepes, 1 mM caffeine, 8% dextran, 25 μM n-benzyl-p-toluene sulfonamide (BTS; Sigma-Aldrich), 100 μM rhod-2, 0.186 mM CaCl2, and 4.96 mM MgCl2 for a nominal [Ca2+] of 100 nM and [Mg2+] of 0.4 mM. Sulfate solution had 74.5 mM K2SO4 instead of glutamate, no caffeine, 5.5 mM MgCl2, and 0.102 mM CaCl2 for a nominal [Ca2+] of 50 nM. pH was 7.0, and osmolality was 260 mosM/kg. For mitochondrial inhibition, we added 5 μM rotenone, 1.25 μg/ml carbonyl cyanide p-(trifluoromethoxy)phenylhydrazone, 1.25 μg/ml oligomycin, and 0.25 μg/ml antimycin. The composition of Ringer’s solution and relaxing solutions is published in ref. 29. For mechanically skinned fibers, the solution contained 117 mM K+, 36 mM Na+, 1 mM Mg2+, 50 mM HDTA, 8 mM ATP, 10 mM creatine phosphate, 0.1 mM EGTA, 25 μM n-benzyl-p-toluene sulfonamide, 0.05 mM rhod-2, and 60 mM Hepes, pH 7.1. The RI solution (30) was as the reference solution but with no CaCl2 and 0.54 mM MgCl2 (nominal [Mg2+] = 0.01 mM).
Microscopy and Image Processing.
SEER imaging was carried out as described in ref. 11 by using a TCS SP2 confocal system (Leica). Line-scan or xt images were acquired at 0.625 ms per line and 0.23 μm per pixel. Simultaneous monitoring of [Ca2+]SR and [Ca2+]cyto required three interleaved images: F1(x, t), F2(x, t) and F3(x, t), with excitation lines and emission bands described in ref. 11. SEER ratio images R(x, t) = F1(x, t)/F2(x, t) were used to derive [Ca2+] by equation 1 in ref. 11. [Ca2+] derived this way is monitored by mag-indo-1 largely inside the SR. R(x, t) was low-pass-filtered at 0.25 of the Nyquist frequencies. F3, of rhod-2 in the cytosol, was normalized by its average resting value F3,0, for an uncalibrated indication of [Ca2+]cyto. Maximal Ca2+ release in cells immersed in a 100 nM Ca2+ solution saturated rhod-2 at F3/F3,0 > 10. F3/F3,0 was thus a nearly linear measure of [Ca2+]cyto.
Signal mass was calculated by equation 3 from ref. 33. The rate of change dM/dt of signal mass (Fig. 2E) is used to approximate time course of release flux during the average spark (13, 14).
Mechanically Skinned Fibers.
Action-potential-induced Ca2+ release was elicited by field pulses (16). The analysis of images was analogous to that for local signals. Derivation of release flux used a simplified version of the removal method (31). Net release was the sum of a term proportional to [Ca2+]cyto, representing removal flow of Ca2+, plus a term proportional to d[Ca2+]cyto/dt, representing the accumulation of Ca2+ within the imaged area. The ratio of these terms was determined by making the flux small and negative at a point during the decay of [Ca2+]cyto, when release channels close. Because only the ratio is determined, the resulting waveform yields flux with an undetermined scale factor.
Alternative Imaging of [Ca2+]SR.
For imaging SR Ca2+ using a single-wavelength (nonratiometric) dye, fibers were loaded with fluo-5N acetoxymethyl (32). Fluorescence Ff of fluo-5N was excited at 488 nm and imaged in the emission range of 495–545 nm simultaneously with F3 (described above).
Supplementary Material
Acknowledgments
We thank D. George Stephenson (LoTrobe University, Melbourne) for advice on electrical stimulation of skinned fibers. This work was supported by grants from the National Institute of Arthritis and Musculoskeletal and Skin Disorders/National Institutes of Health (to E.R.). B.S.L. was a C. J. Martin Fellow of the National Health and Medical Research Council (Australia).
Abbreviations
- RyR
ryanodine receptor
- SR
sarcoplasmic reticulum
- CSQ
calsequestrin
- SEER
shifted excitation and emission ratioing of fluorescence.
Footnotes
Conflict of interest statement: No conflicts declared.
References
- 1.Carafoli E. FEBS J. 2005;272:1073–1089. doi: 10.1111/j.1742-4658.2005.04546.x. [DOI] [PubMed] [Google Scholar]
- 2.Endo M., Tanaka M., Ogawa Y. Nature. 1970;228:34–36. doi: 10.1038/228034a0. [DOI] [PubMed] [Google Scholar]
- 3.Cheng H., Lederer W. J., Cannell M. B. Science. 1993;262:740–744. doi: 10.1126/science.8235594. [DOI] [PubMed] [Google Scholar]
- 4.Lacampagne A., Ward C. W., Klein M. G., Schneider M. F. J. Gen. Physiol. 1999;113:187–198. doi: 10.1085/jgp.113.2.187. [DOI] [PMC free article] [PubMed] [Google Scholar]
- 5.González A., Kirsch W. G., Shirokova N., Pizarro G., Brum G., Pessah I. N., Stern M. D., Cheng H., Ríos E. Proc. Natl. Acad. Sci. USA. 2000;97:4380–4385. doi: 10.1073/pnas.070056497. [DOI] [PMC free article] [PubMed] [Google Scholar]
- 6.Rengifo J., Rosales R., González A., Cheng H., Stern M. D., Ríos E. Biophys. J. 2002;83:2511–2521. doi: 10.1016/S0006-3495(02)75262-4. [DOI] [PMC free article] [PubMed] [Google Scholar]
- 7.Shannon T. R., Guo T., Bers D. M. Circ. Res. 2003;93:40–45. doi: 10.1161/01.RES.0000079967.11815.19. [DOI] [PubMed] [Google Scholar]
- 8.Brochet D. X., Yang D., Di Maio A., Lederer W. J., Franzini-Armstrong C., Cheng H. Proc. Natl. Acad. Sci. USA. 2005;102:3099–3104. doi: 10.1073/pnas.0500059102. [DOI] [PMC free article] [PubMed] [Google Scholar]
- 9.Terentyev D., Viatchenko-Karpinski S., Gyorke I., Volpe P., Williams S. C., Gyorke S. Proc. Natl. Acad. Sci. USA. 2003;100:11759–11764. doi: 10.1073/pnas.1932318100. [DOI] [PMC free article] [PubMed] [Google Scholar]
- 10.Pape P. C., Jong D. S., Chandler W. K., Baylor S. M. J. Gen. Physiol. 1993;102:295–332. doi: 10.1085/jgp.102.2.295. [DOI] [PMC free article] [PubMed] [Google Scholar]
- 11.Launikonis B. S., Zhou J., Royer L., Shannon T. R., Brum G., Ríos E. J. Physiol. 2005;567:523–543. doi: 10.1113/jphysiol.2005.087973. [DOI] [PMC free article] [PubMed] [Google Scholar]
- 12.Shkryl V. M., Shirokova N. J. Biol. Chem. 2006;281:1547–1554. doi: 10.1074/jbc.M505024200. [DOI] [PubMed] [Google Scholar]
- 13.Zhou J., Brum G., González A., Launikonis B. S., Stern M. D., Ríos E. J. Gen. Physiol. 2005;126:301–309. doi: 10.1085/jgp.200509353. [DOI] [PMC free article] [PubMed] [Google Scholar]
- 14.ZhuGe R., Fogarty K. E., Tuft R. A., Lifshitz L. M., Sayar K., Walsh J. V., Jr J. Gen. Physiol. 2000;116:845–864. doi: 10.1085/jgp.116.6.845. [DOI] [PMC free article] [PubMed] [Google Scholar]
- 15.Donaldson S. K. J. Gen. Physiol. 1985;86:501–525. doi: 10.1085/jgp.86.4.501. [DOI] [PMC free article] [PubMed] [Google Scholar]
- 16.Posterino G. S., Lamb G. D., Stephenson D. G. J. Physiol. 2000;527:131–137. doi: 10.1111/j.1469-7793.2000.t01-2-00131.x. [DOI] [PMC free article] [PubMed] [Google Scholar]
- 17.Lacampagne A., Klein M. G., Ward C. W., Schneider M. F. Proc. Natl. Acad. Sci. USA. 2000;97:7823–7828. doi: 10.1073/pnas.97.14.7823. [DOI] [PMC free article] [PubMed] [Google Scholar]
- 18.Schneider M. F., Simon B. J., Szucs G. J. Physiol. 1987;392:167–192. doi: 10.1113/jphysiol.1987.sp016775. [DOI] [PMC free article] [PubMed] [Google Scholar]
- 19.Ikemoto N., Antoniu B., Kang J. J., Meszaros L. G., Ronjat M. Biochemistry. 1991;30:5230–5237. doi: 10.1021/bi00235a017. [DOI] [PubMed] [Google Scholar]
- 20.Park H., Wu S., Dunker A. K., Kang C. J. Biol. Chem. 2004;279:18026–18033. doi: 10.1074/jbc.M311553200. [DOI] [PubMed] [Google Scholar]
- 21.Franzini-Armstrong C., Kenney L. J., Varriano-Marston E. J. Cell Biol. 1987;105:49–56. doi: 10.1083/jcb.105.1.49. [DOI] [PMC free article] [PubMed] [Google Scholar]
- 22.Zhang L., Kelley J., Schmeisser G., Kobayashi Y. M., Jones L. R. J. Biol. Chem. 1997;272:23389–23397. doi: 10.1074/jbc.272.37.23389. [DOI] [PubMed] [Google Scholar]
- 23.Adam B., Delbruck M. In: Structural Chemistry and Molecular Biology. Rich A., Davidson N., editors. San Francisco: Freeman; 1968. pp. 198–215. [Google Scholar]
- 24.DeLisi C. Q. Rev. Biophys. 1980;13:201–230. doi: 10.1017/s0033583500001657. [DOI] [PubMed] [Google Scholar]
- 25.Axelrod D., Wang M. D. Biophys. J. 1994;66:588–600. doi: 10.1016/s0006-3495(94)80834-3. [DOI] [PMC free article] [PubMed] [Google Scholar]
- 26.Berg H. C., Purcell E. M. Biophys. J. 1977;20:193–219. doi: 10.1016/S0006-3495(77)85544-6. [DOI] [PMC free article] [PubMed] [Google Scholar]
- 27.Jong D. S., Pape P. C., Chandler W. K., Baylor S. M. J. Gen. Physiol. 1993;102:333–370. doi: 10.1085/jgp.102.2.333. [DOI] [PMC free article] [PubMed] [Google Scholar]
- 28.Berridge M. J., Bootman M. D., Roderick H. L. Nat. Rev. Mol. Cell Biol. 2003;4:517–529. doi: 10.1038/nrm1155. [DOI] [PubMed] [Google Scholar]
- 29.González A., Kirsch W. G., Shirokova N., Pizarro G., Stern M. D., Ríos E. J. Gen. Physiol. 2000;115:139–158. doi: 10.1085/jgp.115.2.139. [DOI] [PMC free article] [PubMed] [Google Scholar]
- 30.Launikonis B. S., Stephenson D. G. J. Physiol. 2000;526:299–312. doi: 10.1111/j.1469-7793.2000.00299.x. [DOI] [PMC free article] [PubMed] [Google Scholar]
- 31.Melzer W., Ríos E., Schneider M. F. Biophys. J. 1987;51:849–863. doi: 10.1016/S0006-3495(87)83413-6. [DOI] [PMC free article] [PubMed] [Google Scholar]
- 32.Kabbara A. A., Allen D. G. J. Physiol. 2001;534:87–97. doi: 10.1111/j.1469-7793.2001.00087.x. [DOI] [PMC free article] [PubMed] [Google Scholar]
- 33.Chandler W. K., Hollingworth S., Baylor S. M. J. Gen. Physiol. 2003;121:311–324. doi: 10.1085/jgp.200308787. [DOI] [PMC free article] [PubMed] [Google Scholar]
Associated Data
This section collects any data citations, data availability statements, or supplementary materials included in this article.


