Abstract
The NF-κB signaling system is involved in a variety of cellular processes including immune response, inflammation, and apoptosis. Recent experiments have found oscillations in the nuclear-cytoplasmic translocation of the NF-κB transcription factor [Hoffmann, A., et al. (2002) Science 298, 1241–1245; Nelson, D. E., et al. (2004) Science 306, 704–708.] How the cell uses the oscillations to differentiate input conditions and send specific signals to downstream genes is an open problem. We shed light on this issue by examining the small core network driving the oscillations, which we show is designed to produce periodic spikes in nuclear NF-κB concentration. The presence of oscillations is extremely robust to variation of parameters, depending mainly on the saturation of the active degradation rate of IκB, an inhibitor of NF-κB. The oscillations can be used to regulate downstream genes in a variety of ways. In particular, we show that genes to whose operator sites NF-κB binds and dissociates fast can respond very sensitively to changes in the input signal, with effective Hill coefficients of >20.
Keywords: genetic oscillations, negative feedback, saturated degradation
NF-κB is a family of dimeric transcription factors that participate in the regulation of a number of cellular processes, including immune response, inflammation, and apoptosis (1–4). Extensive experiments using electrophoretic mobility shift assay and single-cell fluorescence imaging have found oscillations in the nuclear–cytoplasmic translocation of the NF-κB transcription factor in mammalian cells (5, 6), with a time period of the order of hours. NF-κB can be activated by a number of external stimuli (7), including bacteria, viruses, and various stresses and proteins [e.g., tumor necrosis factor-α (TNF-α), which was the signal used in refs. 5 and 6]. In response to these signals, it targets >150 genes, including many chemokines, immunoreceptors, and stress response genes, as well as acute phase inflammation response proteins (7). Experiments show that NF-κB does not regulate all its downstream genes in the same way. For example, the chemokine gene RANTES turns on much later than another chemokine, IP-10, after TNF-α activation (5). Thus, the two main questions raised by the dynamics of the NF-κB system are as follows. How does the network of interactions produce oscillations? And how does the cell use the oscillations to differentiate input conditions and send specific signals to downstream genes? In this work, we elucidate the small core network driving the oscillations and show that it is designed to produce periodic spikes in nuclear NF-κB concentration. We show that the spiky oscillations are extremely robust to variation of parameters. We further argue that the spikiness is associated with an increased sensitivity of the system that could be used for differentially regulating downstream genes.
The NF-κB system has been modeled by Hoffman et al. (5) and Lipniacki et al. (8). Hoffman et al. (5) have constructed a long list of chemical reactions between 26 different molecules in the NF-κB system, including reaction constants. This is the model we have taken as our starting point. The Lipniacki model overlaps substantially with the Hoffman model for the processes we are interested in, differing mainly in that it contains an extra feedback loop in which NF-κB exerts an inhibitory influence on the external signal that triggers it.
Extracting the Core Feedback Loop
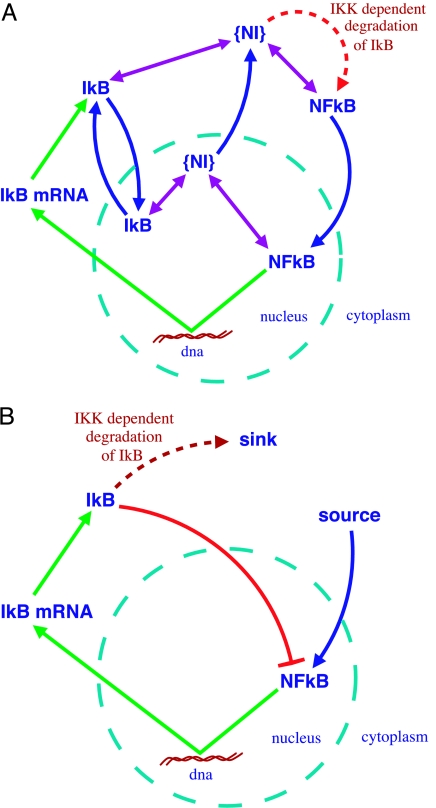
We reduced the NF-κB system, starting from the model in ref. 5, to the core feedback loop (Fig. 1B) generating oscillations. The reduction was done in three steps: the first, removing molecules that have no feedback from NF-κB and deleting slow reactions where faster alternate pathways exist (e.g., export of nuclear NF-κB), resulted in a seven-variable model.
Fig. 1.
Schematic diagram of key interactions in the NF-κB signaling system. Green arrows indicate transcription and translation; blue arrows indicate transport in and out of the nucleus; purple arrows indicate complex formation; and {NI} denotes the NF-κB–IκB complex. The red barred arrow in B indicates the effective inhibition of nuclear NF-κB by IκB. (A) Seven-variable model. The variables are the concentrations of NF-κB inside and outside the nucleus, IκB inside and outside, the complex {NI} inside and outside, and finally the concentration of the mRNA of IκB. (B) Three-variable model. The variables are the concentrations of nuclear NF-κB, the mRNA of IκB, and cytoplasmic IκB.
The interactions in this model are schematically displayed in Fig. 1A. It consists of cytoplasmic and nuclear NF-κB, its inhibitor, IκB, and IκB kinase (IKK), which phosphorylates the inhibitor, leading to its degradation. The inhibitor forms a complex with NF-κB, which, in the cytoplasm, prevents its transport into the nucleus. Only free nuclear NF-κB is imported into the nucleus. In contrast, from inside the nucleus, only the complex can be exported, not the free NF-κB. IκB is known to occur in several isoforms. Cells containing only the IκBα isoform show sustained oscillations, whereas cells with only the IκBβ or -ε isoforms do not show oscillations. Wild-type (WT) cells, with all three isoforms, typically exhibit damped oscillations (5). The difference between these isoforms is that only IκBα is activated by NF-κB (9, 10). In contrast IκBβ and -ε are produced at a rate independent of NF-κB and so lie outside the feedback loop (see Supporting Text, which is published as supporting information on the PNAS web site, for the equations governing the dynamics of the seven-variable model; further details on this work are provided in Figs. 9–16 and Table 1, which are published as supporting information on the PNAS web site).
Coarse graining over fast chemical reactions involving complex formation reduced this system to four variables. Finally, based on numerical observations, we found we could effectively eliminate nuclear IκB, giving the model in Fig. 1B. More details of the reduction process are given in Supporting Text.
Results
Three-Variable Model of NF-κB Oscillations.
The core feedback loop, we find, consists of only three constituents (Fig. 1B): nuclear NF-κB (Nn), cytoplasmic IκB (I), and IκB mRNA (Im). NF-κB dimers activate production of IκB mRNA, which translated to IκB inhibits nuclear NF-κB production, completing the feedback loop.
The dynamics of the system in Fig. 1B is captured by three coupled ordinary differential equations
For ease of analysis we have rescaled all variables to be dimensionless (the original equations and the rescaling process are described in Supporting Text). A, B, C, δ, and ε are dimensionless parameters dependent on the reaction constants (see Supporting Text and Figs. 9–11). The external signal is supplied by IKK that enters the equations through the parameter C, which is proportional to IKK concentration.
The first term in Eq. 1a represents the import of free cytoplasmic NF-κB (whose concentration is 1 − Nn) into the nucleus. This import is hindered by the presence of cytoplasmic IκB, which sequesters NF-κB in the cytoplasm. Parameter A is proportional to the NF-κB nuclear import rate. The second term in Eq. 1a derives from the export of NF-κB from the nucleus via the NF-κB–IκB complex, which is why the term also depends on I. B is proportional to IκB nuclear import rate. δ sets the concentration at which half the nuclear IκB is complexed to NF-κB, and it depends both on the rates of association and dissociation of the complex as well as the export rate.
The first term in Eq. 1b, the rate of production of IκB mRNA, contains the square of Nn because the production is activated by NF-κB dimers.‡ The second term is the degradation of the mRNA, whose rate, in these rescaled equations, sets the overall timescale. It is easy to modify this equation to deal with the β and ε isoforms of IκB simply by adding a constant for their NF-κB-independent rate of production (see Supporting Text).
Eq. 1c has one term for the production of cytoplasmic IκB from its mRNA and a second for its degradation due to the presence of IKK. This degradation is proportional to the concentration of the NF-κB–IκB complex, which depends on both I and (1 − Nn), the concentration of cytoplasmic NF-κB. ε sets the concentration at which half of the cytoplasmic NF-κB is in the complex. C is proportional to the rate of degradation and to the IKK concentration.
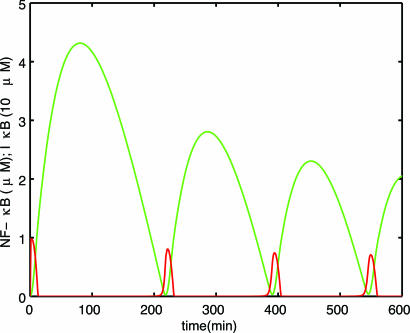
Fig. 2 shows a plot of nuclear NF-κB and cytoplasmic IκB concentrations obtained in simulations, using parameter values from ref. 5. Our model predicts the following experimentally observed facts (5, 6): (i) sustained oscillations in cells with only the α isoform of IκB; (ii) damped oscillations in WT cells that include other isoforms of IκB; (iii) time period of the order of hours; (iv) spikiness of nuclear NF-κB and asymmetry of cytoplasmic IκB oscillations; (v) phase difference between NF-κB and IκB; and (vi) lower frequency upon increased transcription of IκB (see Fig. 2 for i, iii, iv, and v, and see Supporting Text and Figs. 10 and 12 for ii and vi).
Fig. 2.
Oscillations of nuclear NF-κB (Nn) (red) and cytoplasmic IκB (green) for A = 0.007, B = 954.5, C = 0.035, δ = 0.029, and ε = 2 × 10⁻⁵ (using parameter values taken from ref. 5; see Supporting Text). The shape, phase, and period are remarkably similar to the experimental plot in figure 3B left in ref. 6. To facilitate comparison with the experimental plot, the x axis has been limited to 600 min. Figs. 3 and 9–11 show longer time plots of Nn, confirming that the oscillations are sustained.
Saturated Degradation of IκB Is Crucial for Oscillations.
A key element in our three-variable model is the saturated degradation of cytoplasmic IκB in the presence of IKK (second term in Eq. 1c) due to the Michaelis–Menten complex formation between NF-κB and IκB, a complex needed for IKK-triggered degradation of IκB. The same complex inhibits nuclear NF-κB production because only free cytoplasmic NF-κB is imported into the nucleus.
A stability analysis of the system shows the importance of the saturated degradation for oscillations (see Supporting Text and Fig. 11). The saturation is crucial for oscillations because it puts an upper limit to the degradation rate, allowing IκB to accumulate and stay around longer than with the more usual I-proportional degradation rate. This slower degradation effectively introduces a time delay into the feedback loop. Negative feedback with time delay is known to easily produce oscillations, and this mechanism has been used to model the p53 (12) and Hes oscillations (13). Here, instead of being put in by hand, the time delay arises more naturally through the dynamics of the system.
Interestingly, the NF-κB core in Fig. 1B is similar to an early model showing oscillations by negative feedback (14), which introduced precisely the same kind of saturated degradation to mitigate the unreasonably large Hill coefficient in an even earlier model of Goodwin (15). The importance of this mechanism also has been recognized by Goldbeter and coworkers (16–19), who have used it in models of various cellular oscillations, e.g., the cell cycle (16), development in myxobacteria (17), yeast stress response (18), and the mammalian circadian clock (19). Saturated degradation also has been implicated in models of calcium oscillations in cells (20, 21). An analysis of various circadian rhythm models also suggests that saturated degradation plays a crucial role (22). As is evident from these examples, saturated degradation can be the result of a variety of different mechanisms, all of which lead to an effective Michaelis–Menten kinetics. In our models, it comes from the complex formation between NF-κB and its inhibitor, IκB. It also would appear in any active degradation of a protein by an enzyme. In several of the models of Goldbeter referred to above, the Michaelis–Menten kinetics appears because of an interaction between phosphorylation and dephosphorylation reactions. We further note the p53 system, which also shows oscillations, contains the degradation of p53 through the formation of a complex with Mdm2 (23), which could result in saturated degradation. A detailed mathematical analysis of a “mixed feedback loop” motif in ref. 24 also suggests a key role for this kind of complex formation in producing oscillations. These findings suggest that saturated degradation might be a very general mechanism, easily implemented by complex formation and used by cellular processes to introduce time delays where necessary.
Spiky Oscillations and Control of Downstream Genes
Robust Spiky Oscillations.
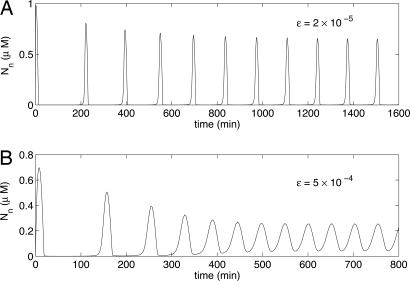
One feature of our model is that it can produce sharp spikes in nuclear NF-κB. This feature is unusual for oscillations driven by negative feedback (25). We quantify spikiness using the following measure: Z = (max(Nn) − min(Nn))/mean(Nn). Oscillations with Z > 2 we term spiky, and oscillations with Z < 2 we term soft. Fig. 3 shows an example of each type of oscillation, generated from the three-variable model using different parameter values.
Fig. 3.
Spiky and soft oscillations. Plots of nuclear NF-κB concentration as a function of time from Eq. 1 with A, B, C, and δ the same as in Fig. 2. (A) Spiky oscillations with ε = 2 × 10⁻⁵, the same as in Fig. 2. (B) Soft oscillations with ε = 5 × 10⁻⁴.
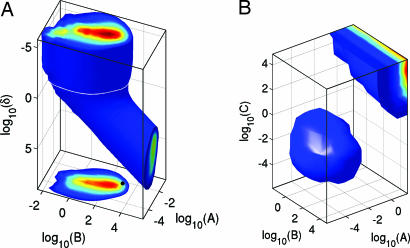
The spikiness is extremely robust to variation of parameters as shown in Fig. 4. Note the scales are logarithmic: parameters can be varied by several decades without going out of the oscillatory regime. The enormous robustness suggests that the spikiness of the oscillations is an important element in the design of NF-κB signaling and may be essential for its proper functioning as a transcription factor. We substantiate this idea in the subsequent sections.
Fig. 4.
Robustness of spiky oscillations. The 3D volume is the region of spiky oscillations (Z > 2; defined in the text); color gradient toward red shows increasing values of Z. (A) The robustness for parameters A, B, and δ. The 2D plot shows the horizontal slice (white line) through the 3D volume at δ = 0.029, the value used in Fig. 2. The black dot corresponds to values of A and B used in Fig. 2. (B) A similar plot for parameters A, B, and C.
Sensitivity to IKK Is High for Spiky Oscillations.
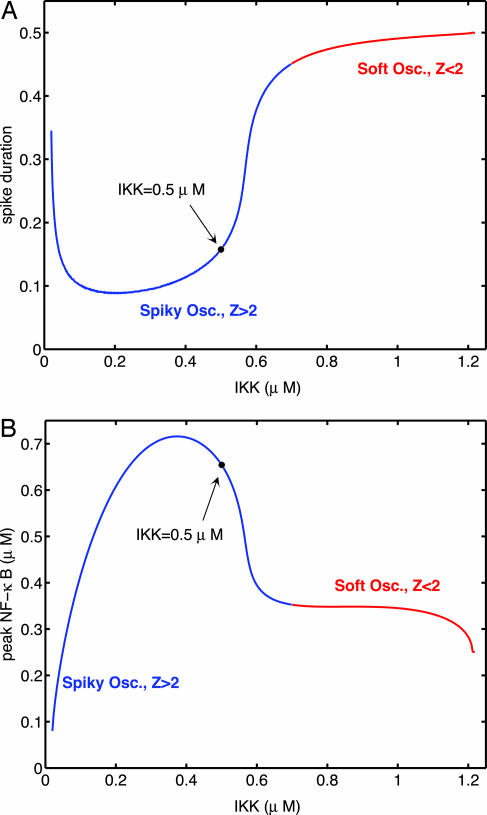
Because IKK is the external signal to which the system responds, we begin by comparing the sensitivity of spiky and soft oscillations with changes in IKK concentration. We consider two quantities: the spike duration, defined as the amount of time Nn spends above its average value, and the spike peak, defined as the maximum nuclear NF-κB concentration during each cycle of oscillations. Fig. 5A shows how the spike duration depends on IKK concentration. The sensitivity of the spike duration is very high in certain regions of spiky oscillations. It is especially large near the transition to soft oscillations as well as near the transition to stable steady states for small IKK. A similar sensitivity is seen in the peak NF-κB concentration (Fig. 5B). Thus, the spike duration and peak are much more sensitive to (and therefore easier to regulate by) IKK for spiky than for soft oscillations.
Fig. 5.
Sensitivity to IKK. (A) Spike duration, the fraction of time Nn spends above its mean value, as a function of IKK concentration. The black dot shows the IKK value used in Fig. 2. Blue and red, respectively, signify regions of spiky and soft oscillations. Notice the sharp response just before the transition to soft oscillations and for smaller values of IKK. (B) Spike peak, the maximum concentration of nuclear NF-κB, as a function of IKK concentration. The black dot shows the IKK value used in Fig. 2. Blue and red, respectively, signify regions of spiky and soft oscillations.
Large Hill Coefficients and Regulation of Downstream Genes.
It is possible for genes regulated by NF-κB to inherit this sensitivity in the form of a large effective Hill coefficient. Consider a gene that has an operator site at which NF-κB dimers can bind and activate the gene
 |
To begin with, we assume that the binding of NF-κB to the operator is in equilibrium; i.e., kon and koff are much larger than the rates of all other processes in the NF-κB system and, in particular, that 1/koff is much smaller than the time period of oscillations. Then, the gene activity, G*, follows Nn
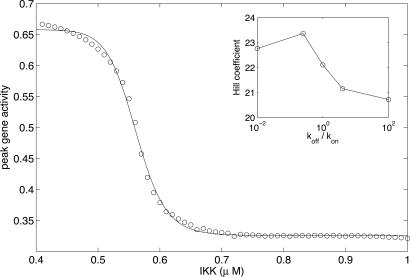
Fig. 6 shows the peak gene activity as a function of IKK concentration. In this case, the value of G* also oscillates, closely tracking the NF-κB oscillations: the peaks in G* correspond to the peaks in concentration of nuclear NF-κB (see Fig. 8A). The results of ref. 26 suggest that this is the case for many of NF-κB’s targets. The effective Hill coefficient of this response curve is >20, much larger than the values obtained by typical ways of introducing cooperativity in gene regulation (27, 28). As Fig. 6 Inset shows, the effective Hill coefficient remains >20 for a large range of values of the ratio koff/kon; i.e., genes controlled in this way show a very high sensitivity to the input signal. This high sensitivity is robust to variation of parameter values (see Supporting Text, Fig. 15, and Table 1).
Fig. 6.
Equilibrium binding of NF-κB to a downstream gene. The plot shows the peak gene activity as a function of IKK concentration, with koff/kon = 0.25 (open circles). The data have been fitted by a sigmoidal function of the form 1/(1 + (x/x0)h). The least-squares fit (solid line) gives an effective Hill coefficient h = 23.3. (Inset) Hill coefficient obtained by similar fitting for different koff/kon ratios.
Fig. 8.
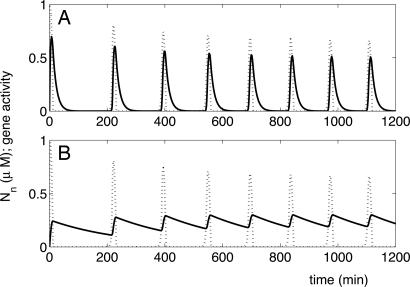
Examples of time course of gene activity for genes regulated by NF-κB. Dotted line shows the nuclear NF-κB concentration. The time period of oscillations is 130 min. Solid line shows the gene activity, G* (see text), as a function of time. (A) Equilibrium binding: 1/koff is much less than the time period of oscillations. koff = 1/13 min−1; kon ≈ 0.3 μM−2·min−1. (B) Nonequilibrium binding: 1/koff is larger than the time period. koff = 1/260 min−1; kon ≈ 0.04 μM−2·min−1.
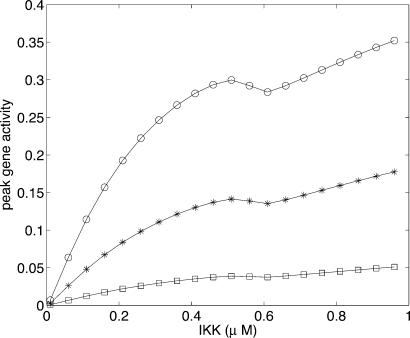
When kon and koff become comparable with other rates in the system, the binding of NF-κB to the operator remains out of equilibrium. When koff is small enough, i.e., 1/koff is more than the time period of oscillations, the gene activity does not have enough time to decay completely between spikes of NF-κB. Fig. 7 shows the peak activity as a function of IKK. In contrast to the equilibrium case, here the response is linear at best. Note also that the peak gene activity increases with IKK in contrast to the equilibrium case, where it decreases. In this regime, it is also possible to get genes to turn on with different time delays, after IKK addition, by placing them at the ends of cascades of different lengths (see Supporting Text and Fig. 16). Thus, the same oscillations are capable of regulating genes very differently, depending on their kon,off values, which are determined by their operator sites.
Fig. 7.
Nonequilibrium binding of NF-κB to a downstream gene. The plot shows the peak gene activity as a function of IKK concentration, with koff = 1/260 min−1 kept fixed (1/koff is twice the time period of oscillations). kon ≈ 0.04, 0.015, and 0.004 μM−2·min−1 for circles, asterisks, and squares, respectively.
Discussion
What functional role, if any, do the oscillations in the NF-κB system play? There have been several suggestions, including that downstream gene networks are perhaps regulated by the frequency of the oscillations, that the oscillations could be a by-product of rapid attenuation of NF-κB, or that they might be used to make multiple evaluations of the input signal (29, 30). Barken et al. (31) warn against overemphasizing the physiological role of oscillations. Our approach to tackling this question has been to construct a reduced three-variable model, which, despite its simplicity, captures many characteristic features of the system. The simplicity of the model allows us to fully explore and understand the range of dynamical behavior it exhibits. In particular, we have shown that it is capable of both spiky and soft oscillations and that the spiky oscillations are extremely robust to variation of parameters.§ These insights would have been significantly harder to extract from larger models. Simplification thus facilitates an understanding of the key mechanisms by isolating the relevant variables and parameters, as well as allowing a comparison with other strategies for producing similar dynamics. In the case of NF-κB, for instance, we learn that it lies within a class of negative feedback oscillators that have the uncommon ability to produce sharp spikes. It must be emphasized that a careful simplification of a large dynamical system retains many of the important details of the larger system in the particular form of the mathematical terms in the simplified system. For instance, our three-variable model does not explicitly contain the cytoplasmic NF-κB–IκB complex, yet its effects are evident in the saturation of the degradation rate of IκB, which is so crucial for oscillations, as well as in the import rate of NF-κB.
Our simplified models concentrate mainly on the feedback to NF-κB through the α isoform of IκB. Thus, our results apply directly to mutants lacking both the IκBβ and -ε isoforms. As shown in Figs. 12–14, extending the model to include the effect of these isoforms (which are not activated by NF-κB) leads to damped, but nevertheless spiky, oscillations. Therefore, we believe our conclusions would hold for WT cells also. Indeed, single-cell fluorescence measurements of the ratio of nuclear to cytoplasmic NF-κB in WT cells do show spiky oscillations (e.g., see figure 3B in ref. 6).¶ We emphasize that when we speak of spikiness of the oscillations, we are referring to the concentration of nuclear NF-κB. IκB oscillations, conversely, are not spiky, both in experiments as well as in our models.
Returning to the question of the functional role of oscillations, the activity of genes downstream of NF-κB depends on the amount of time for which NF-κB is present inside the nucleus in sufficiently large concentrations to dimerize and bind to those genes’ operator sites. It seems reasonable to assume that NF-κB could signal different downstream genes, simply by regulating the amount and exposure time to IKK, provided that the signaling system is sufficiently sensitive to changes in IKK concentration. We have shown that the spiky oscillations can, indeed, show a high sensitivity to IKK. This finding is a clearly testable prediction of our model and in fact seems to be consistent with the results of recent experiments studying triggering of NF-κB using various temporal profiles of IKK (33). This sensitivity allows a great versatility in the regulation of downstream genes by NF-κB. Where the cell requires a gene to be very sensitive to the IKK concentration, the system can use equilibrium binding of NF-κB to the operator site to get steep response curves with Hill coefficients >20. And where a slower response is necessary, it can be achieved by adjusting the binding and dissociation constants of NF-κB to the operator site so that the binding remains away from equilibrium.
The difference between the equilibrium and nonequilibrium cases stems from the fact that in the former case the gene activity follows the NF-κB concentration closely (see Fig. 8A), and so the peak gene activity follows the peak concentration, which is very sensitive to IKK as shown in Fig. 5B. Conversely, in the nonequilibrium case, the gene activity effectively integrates over successive spikes of NF-κB because it decays slowly between spikes (see Fig. 8B). Therefore, the peak gene activity follows the average NF-κB concentration. This average has much less sensitivity to IKK because it is proportional to the product of the spike peak and duration, and these two quantities have the opposite response to changes in IKK (Fig. 5), which roughly cancel in the product. Note that the nonequilibrium example is an extreme limit presented as a counterpoint to the equilibrium case. Such small values of koff are possible but unlikely in practice. Nevertheless, it is clear from these two limits that it is possible for genes to respond differently despite being triggered by the same oscillatory input.
Given this versatility in regulatory strategies, it seems likely that cells would have evolved to make use of these properties of the NF-κB oscillations. It remains to be uncovered the particular ways NF-κB regulates specific genes and to test whether the oscillations play any physiological role in this regulation.
Supplementary Material
Acknowledgments
We thank J. Ferkinghoff-Borg, E. Siggia, G. Tiana, and anonymous referees for useful suggestions. This work was supported by the Danish National Research Foundation.
Abbreviation
- IKK
IκB kinase.
Footnotes
Conflict of interest statement: No conflicts declared.
‡Ref. 11 argues that making this term linear in Nn is better. In addition, a small dimerization constant for NF-κB (i.e., NF-κB exists mostly as dimers) also would argue in favor of a linear production term. We have checked that this change does not alter our conclusions (see Supporting Text).
§Our conclusion is further bolstered by Hayot and Jayaprakash’s study (32) of the effects of stochastic noise on NF-κB oscillations using a simplified model similar to our seven-variable model.
¶Oscillations observed by Hoffman et al. (5) in WT cells and various mutants appear to be soft. We attribute this softness to their use of bulk measurements where the spikiness could be diluted by the averaging. Single-cell measurements avoid this averaging.
References
- 1.Lee K.-Y., D’Acquisto F., Hayden M. S., Shima J.-H., Ghosh S. Science. 2005;308:114–118. doi: 10.1126/science.1107107. [DOI] [PubMed] [Google Scholar]
- 2.Lawrence P., Bebien M., Liu G. Y., Nizet V., Karin M. Nature. 2005;434:1138–1143. doi: 10.1038/nature03491. [DOI] [PubMed] [Google Scholar]
- 3.Ghosh S., Karin M. Cell. 2002;109:S81–S96. doi: 10.1016/s0092-8674(02)00703-1. [DOI] [PubMed] [Google Scholar]
- 4.Ghosh S., May M. J., Kopp E. B. Annu. Rev. Immunol. 1998;16:225–260. doi: 10.1146/annurev.immunol.16.1.225. [DOI] [PubMed] [Google Scholar]
- 5.Hoffmann A., Levchenko A., Scott M. L., Baltimore D. Science. 2002;298:1241–1245. doi: 10.1126/science.1071914. [DOI] [PubMed] [Google Scholar]
- 6.Nelson D. E., Ihekwaba A. E. C., Elliott M., Johnson J. R., Gibney C. A., Foreman B. E., Nelson G., See V., Horton C. A., Spiller D. G., et al. Science. 2004;306:704–708. doi: 10.1126/science.1099962. [DOI] [PubMed] [Google Scholar]
- 7.Pahl H. L. Oncogene. 1999;18:6853–6866. doi: 10.1038/sj.onc.1203239. [DOI] [PubMed] [Google Scholar]
- 8.Lipniacki T., Paszek P., Brasier A. R., Luxon B., Kimmel M. J. Theor. Biol. 2004;228:195–215. doi: 10.1016/j.jtbi.2004.01.001. [DOI] [PubMed] [Google Scholar]
- 9.Sun S. C., Ganchi P. A., Ballard D. W., Greene W. C. Science. 1993;259:1912–1915. doi: 10.1126/science.8096091. [DOI] [PubMed] [Google Scholar]
- 10.Scott M. L., Fujita T., Liou H. C., Nolan G. P., Baltimore D. Genes Dev. 1993;7:1266–1276. doi: 10.1101/gad.7.7a.1266. [DOI] [PubMed] [Google Scholar]
- 11.Nelson D. E., Horton C. A., See V., Johnson J. R., Nelson G., Spiller D. G., Kell D. B., White M. R. H. Science. 2005;308 52. [Google Scholar]
- 12.Tiana G., Sneppen K., Jensen M. H. Eur. J. Phys. B. 2002;29:135–140. [Google Scholar]
- 13.Jensen M. H., Sneppen K., Tiana G. FEBS Lett. 2003;541:176–177. doi: 10.1016/s0014-5793(03)00279-5. [DOI] [PubMed] [Google Scholar]
- 14.Bliss R. D., Painter P. R., Marr A. G. J. Theor. Biol. 1982;97:177–193. doi: 10.1016/0022-5193(82)90098-4. [DOI] [PubMed] [Google Scholar]
- 15.Goodwin B. C. In: Advances in Enzyme Regulation. Weber G., editor. Vol. 3. Oxford: Pergamon; 1965. pp. 425–438. [Google Scholar]
- 16.Goldbeter A. Proc. Natl. Acad. Sci. USA. 1991;88:9107–9111. doi: 10.1073/pnas.88.20.9107. [DOI] [PMC free article] [PubMed] [Google Scholar]
- 17.Igoshin O. A., Goldbeter A., Kaiser D., Oster G. Proc. Natl. Acad. Sci. USA. 2004;101:15760–15765. doi: 10.1073/pnas.0407111101. [DOI] [PMC free article] [PubMed] [Google Scholar]
- 18.Jacquet H., Renault G., Lallet S., Mey J. D., Goldbeter A. J. Cell Biol. 2003;161:497–505. doi: 10.1083/jcb.200303030. [DOI] [PMC free article] [PubMed] [Google Scholar]
- 19.Leloup J.-C., Goldbeter A. Proc. Natl. Acad. Sci. USA. 2003;100:7051–7056. doi: 10.1073/pnas.1132112100. [DOI] [PMC free article] [PubMed] [Google Scholar]
- 20.Reidl J., Borowski P., Sensse A., Starke J., Zapotocky M., Eiswirth M. Biophys. J. 2006;90:1147–1155. doi: 10.1529/biophysj.104.058545. [DOI] [PMC free article] [PubMed] [Google Scholar]
- 21.Goldbeter A., Dupont G., Berridge M. Proc. Natl. Acad. Sci. USA. 1990;87:1461–1465. doi: 10.1073/pnas.87.4.1461. [DOI] [PMC free article] [PubMed] [Google Scholar]
- 22.Kurosawa G., Iwasa Y. J. Biol. Rhythms. 2002;17:568–577. doi: 10.1177/0748730402238239. [DOI] [PubMed] [Google Scholar]
- 23.Vogelstein B., Lane D., Levine A. J. Nature. 2000;408:307–310. doi: 10.1038/35042675. [DOI] [PubMed] [Google Scholar]
- 24.Francois P, Hakim V. Phys. Rev. E Stat. Phys. Plasmas Fluids Relat. Interdiscip. Top. 2005;72 031908. [Google Scholar]
- 25.Goldbeter A. Nature. 2002;420:238–245. doi: 10.1038/nature01259. [DOI] [PubMed] [Google Scholar]
- 26.Bosisio D., Marazzi I., Agresti A., Shimizu N., Bianchi M. E., Natoli G. EMBO J. 2006;25:798–810. doi: 10.1038/sj.emboj.7600977. [DOI] [PMC free article] [PubMed] [Google Scholar]
- 27.Huang C.-Y. F., Ferrel J. E., Jr. Proc. Natl. Acad. Sci. USA. 1996;93:10078–10083. doi: 10.1073/pnas.93.19.10078. [DOI] [PMC free article] [PubMed] [Google Scholar]
- 28.Goldbeter A., Koshland D. E. Proc. Natl. Acad. Sci. USA. 1981;78:6840–6844. doi: 10.1073/pnas.78.11.6840. [DOI] [PMC free article] [PubMed] [Google Scholar]
- 29.Lahav G. Sci. STKE. 2004;2004 doi: 10.1126/stke.2642004pe55. pe55. [DOI] [PubMed] [Google Scholar]
- 30.Ting A. Y., Endy D. Science. 2002;298:1189–1190. doi: 10.1126/science.1079331. [DOI] [PubMed] [Google Scholar]
- 31.Barken D., Wang C. J., Kearns J., Cheong R., Hoffmann A., Levchenko A. Science. Vol. 308. 2005. 52. [DOI] [PMC free article] [PubMed] [Google Scholar]
- 32.Hayot F, Jayaprakash C. J. Theor. Biol. 2006;240:583–591. doi: 10.1016/j.jtbi.2005.10.018. [DOI] [PubMed] [Google Scholar]
- 33.Werner S. L., Barken D., Hoffman A. Science. 2005;309:1857–1861. doi: 10.1126/science.1113319. [DOI] [PubMed] [Google Scholar]
Associated Data
This section collects any data citations, data availability statements, or supplementary materials included in this article.


