

Abstract
Recently, a series of closely related theoretical constructs termed the “topomer search model” (TSM) has been proposed for the folding mechanism of small, single-domain proteins. A basic assumption of the proposed scenarios is that the rate-limiting step in folding is an essentially unbiased, diffusive search for a conformational state called the native topomer defined by an overall native-like topological pattern. Successes in correlating TSM-predicted folding rates with that of real proteins have been interpreted as experimental support for the model. To better delineate the physics entailed, key TSM concepts are examined here using extensive Langevin dynamics simulations of continuum Cα chain models. The theoretical native topomers of four experimentally well-studied two-state proteins are characterized. Consistent with the TSM perspective, we found that the sizes of the native topomers increase with experimental folding rate. However, a careful determination of the corresponding probabilities that the native topomers are populated during a random search fails to reproduce the previously predicted folding rates. Instead, our results indicate that an unbiased TSM search for the native topomer amounts to a Levinthal-like process that would take an impossibly long average time to complete. Furthermore, intraprotein contacts in all four native topomers considered exhibit no apparent correlation with the experimental φ-values determined from the folding kinetics of these proteins. Thus, the present findings suggest that certain basic, generic yet essential energetic features in protein folding are not accounted for by TSM scenarios to date.
Keywords: protein folding, topomer search model, topomer-sampling model, Levinthal search, explicit-chain modeling
Many single-domain proteins fold via apparent two-state processes with rates that vary widely, from μsec−1 to sec−1 (Jackson 1998; Baker 2000). In 1998, an insightful discovery was made: These folding rates were found to be predictable to approximately within one to two orders of magnitude using a very simple topology-based parameter called the relative contact order, CO (Plaxco et al. 1998). This parameter quantifies the average sequence separation between native contacts divided by protein length. Proteins with low CO values (typically α-helical proteins) were found to fold faster than proteins with high CO values (typically α/β- and β-proteins). Since this seminal finding, other topology-based parameters have been found that exhibit similar correlation with folding rates. These include long-range order (Selvaraj and Gromiha 2001), total contact distance (Zhou and Zhou 2002), “cliquishness” (Micheletti 2003), local secondary structure content (Gong et al. 2003), and the topomer-derived parameter considered in this work (Makarov and Plaxco 2003). Several theoretical constructs that did not directly consider explicit chain representations have had notable successes in reproducing this empirically observed rate– topology relationship (Alm and Baker 1999; Galzitskaya and Finkelstein 1999; Muñoz and Eaton 1999; Weikl and Dill 2003). For more realistic explicit-chain models that involve direct simulations of folding kinetics, however, it has proven less straightforward (Koga and Takada 2001; Faisca and Ball 2002; Cieplak and Hoang 2003); nonetheless, significant recent advances have been made (Jewett et al. 2003; Kaya and Chan 2003c; Chavez et al. 2004; Ejtehadi et al. 2004).
Among the theoretical efforts aiming to elucidate the remarkable contact order-dependent folding rates, a series of closely related models under the name of “topomer search model” or “topomer-sampling model” (TSM) has been proposed in the past five years as a possible mechanistic basis for the empirically observed rate–topology relationship (Debe and Goddard 1999; Debe et al. 1999; Makarov and Metiu 2002; Makarov et al. 2002; Makarov and Plaxco 2003; Gillespie and Plaxco 2004). These topomer constructs share the idea that the folding of small single-domain proteins is a two-step process: The first step is an essentially unbiased, diffusive search for an overall native-like topological state termed the “native topomer state.” In the second step, after the chain has formed the correct gross topology, the native contacts rapidly zipper to form the completed native structure. Since this second step is assumed to occur very rapidly, the rate-limiting step in folding is the essentially unbiased search process in the first step, and folding rates are therefore determined by the “size,” or extent in conformational space, of the native topomer state.
The topomer folding picture may be schematically illustrated by the highly simplified energy landscape caricatures in Figure 1 ▶. Here the energy landscape “outside” of the native topomer (the part represented by a steep funnel in Fig. 1 ▶) has been drawn flat to highlight the unbiased nature of the hypothetical TSM process (Debe and Goddard 1999). This corresponds to the case in Makarov et al. (2002) for which “the barrier to folding is purely entropic,” although the possibility of a general energy favoring contact formation has also been considered as part of a TSM process (Makarov et al. 2002, p. 3538; see Discussion below). Thus, in a proposed unbiased topomer-search scenario, the first step of the folding process is a search on this flat region of the energy landscape. Then, as soon as the native topomer is found, folding proceeds quickly and downhill to the native state until all native contacts are formed. As a consequence of this folding picture, the folding rate of a protein is controlled by a quantity Ptop, the probability that the native topomer state is populated during a random search. Slowand fast-folding proteins thus have “tight” and “loose” native topomers, respectively, corresponding to the two landscapes in Figure 1 ▶ with smaller and larger “golf holes.”
Figure 1.

Simple schematic illustration of the energy landscape in the TSM, for a slow-folding (left) and a fast-folding (right) protein. The horizontal dimensions represent protein conformational variation or conformational entropy; the vertical dimension provides the free energy of every given protein conformation—with appropriate averaging of solvent degrees of freedom (Dill and Chan 1997).
To our knowledge, the original version of TSMwas first proposed by Debe et al. (1999). Using a discrete chain growth method to generate large numbers of random conformations, the total number of distinct topomer states (of which the native topomer is one)was estimated for proteins with chain lengths up to N=100 amino acid residues. For instance, they found the number of topomers to be ~3 × 10⁷ for N=100. It was then argued that if the topomer state space was sampled on a nanosecond timescale, native topomers could be found on typical folding times, even in the absence of a mechanism that simplifies and expedites the search. In a subsequent paper, Debe and Goddard (1999) set out to test themodel further by estimating the quantities Ptop for a set of 18 β- and α/β-proteins using a similar chain growth method (all-α proteins were excluded from this data set). The folding rates that resulted from their calculations showed a good correlation with experimental data (correlation coefficient 0.78).
In all TSM scenarios, the proposed folding process is quickly completed once the native topomer is located. It follows that if TSM is to provide a rationalization of apparent two-state folding mechanisms, the precise definition of the native topomer state is of critical importance. In the original TSMstudy by Debe and colleagues, “topomers are tubes of topologically equivalent conformations” (Debe and Goddard 1999): Two structures (conformations) were classified as topomeric (i.e., belonging to the same topomer state) based on a test procedure in which equal-strength harmonic forces were applied between corresponding Cα atoms of two optimally superimposed structures. If a conjugate gradient minimization procedure could completely relax the spring forces, that is, if small backbone moves of one structure could bring it onto the other without getting trapped in a local minimum, the two structures were classified as belonging to the same topomer (Debe et al. 1999).
In the subsequent development of the TSM approach by Makarov and colleagues, however, the native topomer state was defined by specific collections of native contacts, as the set of conformations in which all sequence-distant native contacts are formed. In other words, TSM is the conformational ensemble in which all sequence-distant residues (as defined by the formalism) that are in contact in the native state are in close spatial proximity. Hence, the number of sequence-distant native contacts, ΛD, plays a central role in this more recent TSM formulation, as will be detailed below. This approach is different in many respects from the original TSM of Debe and Goddard (1999) and Debe et al. (1999). Certain features introduced in the later formulation of Makarov and colleagues are seen as instrumental in extending the TSM’s ability to predict folding rates to include also purely α-helical proteins, as opposed to only β- and α/β-proteins (Makarov and Metiu 2002; Makarov et al. 2002; Makarov and Plaxco 2003).
The kinetic process of topomer sampling was envisioned by Debe and colleagues to be mainly among relatively compact conformations with low (favorable) solvation energies, as was depicted by the kinetic path on their “Rose Bowl” (a stadium in Pasadena, California) landscape (see Debe et al. 1999, Fig. 5 ▶). This amounts to postulating a folding mechanism that involves a fast, “burst-phase” collapse to an ensemble of compact conformations that are partitioned into different topomers. In that case, the flat areas in Figure 1 ▶ represent only such compact conformations but not the open conformations that presumably have higher solvation energies. The bulk of the search time for the native topomer is then spent in different compact conformations. But such a folding mechanism does not appear to correspond to that of many real, apparent two-state proteins—typified by chymotrypsin inhibitor 2 (Jackson and Fersht 1991)—that exhibit no significantly populated compact folding intermediates. In contrast, the topomer search approach of Makarov and colleagues seeks the probability of locating the native topomer among all possible conformations, most of which are presumably open (Makarov et al. 2002), and is therefore conceptually more in line with the principles of cooperative protein folding (Chan et al. 2004; Gillespie and Plaxco 2004).
Figure 5.

Comparison between TSM-predicted (+) and experimental (○) φ-values. The lines between data points serve merely as a guide for the eye. The secondary structure of the proteins along the sequences is indicated by large green and small black rectangular shapes for α-helical and β-sheet regions, respectively.
For this reason, our present analysis focuses primarily on the more recent TSM formulation of Makarov and colleagues with the above-described contact-based definition of the native topomer (Makarov and Metiu 2002; Makarov et al. 2002; Makarov and Plaxco 2003). In their approach, TSM prediction of folding rates is reduced to solving the following problem: What is the probability P(nD) that nD sequence-distant residue pairs are brought into proximity by a random search process? In this notation, the native topomer probability Ptop is identified with P(ΛD). The parameter ΛD (which is denoted QD in Makarov and Plaxco 2003) is closely related to the long-range order parameter LRO proposed previously by Selvaraj and Gromiha (2001), namely, ΛD/N=LRO provided that the same definition of a contact is used. Based on results from inert Gaussian chains (without consideration of polymer excluded volume), Makarov and Plaxco (2003) introduced the approximate formula P(ΛD)=γaΛD where a and γ are constants. This expression leads to a simple topology-based rate-prediction formula that was tested on a set of 24 two-state proteins (Makarov and Plaxco 2003), a diverse set that did not exclude all-α proteins as had been done previously (Debe and Goddard 1999). The rate-prediction formula showed excellent correlation with experimental folding rate data with a correlation coefficient ~0.9 (Makarov and Plaxco 2003), even though folding rates predicted using ΛD can sometimes be drastically different from those predicted using CO (Jones and Wittung-Stafshede 2003).
Because of this empirical success and the potential physical insights it may offer, it is imperative to take an in-depth look at the TSM perspective as several key aspects of it remain to be better elucidated. As it stands, TSM is not a self-contained, explicit-chain model. TSM investigations thus far have not used direct simulations of folding kinetics. Instead, kinetic behaviors and folding rates were deduced from presumed thermodynamics–kinetics relationships. In this basic respect, TSM is akin to other non-explicit-chain modeling of CO-dependent folding that have also enjoyed high degrees of success (Alm and Baker 1999; Muñoz and Eaton 1999). However, the relationship between the thermodynamics and kinetics of chain molecules can be subtle, and explicit-chain results do not always agree with expectations from non-explicitchain considerations (Karanicolas and Brooks 2003; Chan et al. 2004). Therefore, ultimately, TSM or any other non-explicit-chain model of protein folding has to be evaluated by ascertaining whether and how the model assumptions can emerge from polymer physics. With this in mind, this article explores the feasibility of the proposed TSM folding mechanism by performing extensive Langevin molecular dynamics simulations using an explicit Cα chain model. We focus on four apparent two-state proteins with diverse CO values. These chain models allow us to assess the logic of the physical picture afforded by TSM, and to perform structural comparisons with experiments.
In the analysis below, we first derive a clear structural characterization of the native topomers for the four proteins. Then, by using standard histogram reweighting techniques, we estimate their P(ΛD) values. We find them to be much smaller than that stipulated by the TSM approximation P(ΛD) = γaΛD. In fact, our calculations show that finding the correct native topomer state in a random, unbiased TSM search is so unlikely that it is comparable to the hypothetical Levinthal search process. Finally, to connect TSM with common understanding of folding kinetics, we compare experimental φ-values with TSM-predicted φ-values calculated by taking the ensemble of conformations constituting a native topomer state to be the TSM-prescribed folding transition state.
Results
Proteins
We focus on the four single-domain proteins in Table 1 that cover a variety of chain lengths, secondary structure contents, and folding rates. They are part of a larger set of roughly 30 single-domain proteins that have been shown to fold via simple, apparent two-state thermodynamics and kinetics. A list of these proteins along with experimental folding data can be found in Ivankov et al. (2003).
Table 1.
Data for the four proteins studied
| Protein | Pdb | N | Rng (Å) | kf (sec−1) | Texp (°C) |
| Acylphosphatase | 1aps | 98 | 12.6 | 2.3 × 10⁻¹ | 28 |
| Chymotrypsin inhibitor 2 | 2ci2 | 64 | 10.8 | 4.8 × 101 | 25 |
| Spliceosomal protein U1A | 1urn | 96 | 12.2 | 3.2 × 10² | 25 |
| λ-repressor | 1lmb | 80 | 11.5 | 1.1 × 10⁴ | 25 |
Protein databank id, pdb; number of amino acids, N; radius of gyration, Rng; and experimental folding rate in water, kf, determined at temperature Texp (Jackson and Fersht 1991; Silow and Oliveberg 1997; van Nuland et al. 1998; Myers and Oas 1999).
Preliminaries: Definitions and assumptions
Following Makarov and Plaxco (2003), we use a spatial proximity cutoff parameter rc and a sequence separation cutoff parameter lc to determine the set of sequencedistant native contacts: An amino acid pair ij is considered part of the native topomer contact set if the Cα’s of amino acids i and j are separated by a spatial distance rnij<rc and their sequence separation |i − j| > lc. Thus, the number of contacts ΛD in this set depends on the choice of lc and rc. In Table 2, we report the ΛD values for our four proteins, for several different choices of lc and rc within the limits 4 ≤ lc ≤ 12, and 6 Å ≤ rc ≤ 8 Å . Table 2 shows that ΛD depends rather strongly on lc and rc, and this dependence is particularly strong for 1lmb. For this protein, ΛD varies almost by a factor 10 between the different values of lc and rc considered here.
Table 2.
Number of sequence-distant native contacts ΛD
| rc = 8 Å | rc = 7 Å | rc = 6 Å | |||||||
| lc = 4 | 8 | 12 | lc = 4 | 8 | 12 | lc = 4 | 8 | 12 | |
| 1aps | 236 | 216 | 205 | 167 | 155 | 147 | 92 | 85 | 79 |
| 2ci2 | 108 | 93 | 88 | 80 | 69 | 67 | 47 | 41 | 40 |
| 1urn | 180 | 156 | 140 | 123 | 108 | 98 | 70 | 59 | 53 |
| 1lmb | 85 | 58 | 49 | 45 | 25 | 19 | 24 | 12 | 9 |
Here we focus on the cutoff values lc and rc within the limits suggested by Makarov and Plaxco (2003).
We then define the native topomer state of a protein as the set of conformations in which every ΛD amino acid pair has formed a “contact” or is otherwise in close spatial proximity. To simplify the terminology, in the following we will use “contact” to indicate simply that two Cα atoms are close in space. For this purpose, two definitions of contact are used. Unless stated otherwise, we use the contact criterion rij<1.2rnij , where rij is the Cα–Cα distance between i and j. This criterion has been used in previous studies of native-centric Cα models (Clementi et al. 2000; Kaya and Chan 2003a). In certain considerations, we find it useful to use a slightly more permissive contact criterion, rij<rnij+3.0 Å , which entails a broader definition of a native topomer. It should be noted that both of these contact criteria are independent of the cutoff parameter rc.
Chain simulation of the native topomer search process
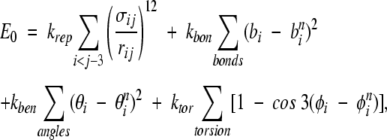
To assess the TSM folding picture by an explicit-chain approach, it is necessary to (1) construct an overall conformational ensemble that is essentially unbiased, (2) determine the size of the conformational space covered by the native topomer as a sub-ensemble of the overall conformational ensemble, and (3) estimate by explicit construction the probability that this conformational sub-ensemble can be located by a diffusive search, as envisioned by TSM. We adopt a simple Cα chain model for this purpose, with the following potential energy function:
 |
(1) |
where bi, θi, φi, and rij are the virtual bond lengths, bond angles, torsion angles, and Cα–Cα distances, respectively, and bni, θni, φni, and rnij are the corresponding native values. This energy function is designed to capture the basic polymer statistics of a generic self-avoiding polypeptide chain. The use of the θni and φni values in the last Here we focus on the cutoff values lc and rc within the limits suggested by Makarov and Plaxco (2003). two terms introduces a small bias toward the native state. These terms are included here for computational efficiency. Their presence does not alter our main conclusion, based on the results from Equation 1, that the probability of locating the native topomer by an unbiased search is vanishingly small (see below). This is because the native-centric nature of these terms in Equation 1 implies that the relative size of the native topomer sub-ensemble would be even smaller in an entirely unbiased overall conformational ensemble. The first term of the above potential function accounts for polymer excluded volume. Its summation is over all amino acid pairs ij, and the parameters σij are chosen in the following manner: σij=0.85 rnij for pairs ij in contact in the native state (rnij <rc); otherwise, σij=4.0 Å . To speed up the calculations, the repulsive energy term is evaluated using a cutoff procedure with cutoff radius 2σij. This choice of the σij parameters ensures that the native conformation would not be made inaccessible by unphysical repulsive forces.
A motivation for adopting a simplified Cα model in this study rather than using chain representations that account for more structural details is computational efficiency: A simplified chain model allows for extensive conformational sampling and reliable probability estimations that are essential in addressing issues pertinent to the TSM. In this regard, it is noteworthy that the TSM itself—like several other topology-based folding scenarios—is also an inherently structurally low-resolution formulation that does not refer directly to sequence-specific interactions (Makarov and Plaxco 2003). Hence, a Cα chain model enjoys the advantage of making direct connections to the underlying mathematical approximations of the TSM. Continuum (off-lattice) Cα models have been used extensively in the literature for studying protein folding, mostly in combination with Gō-type energy functions (Clementi et al. 2000) but also for structure prediction (Nanias et al. 2003). In particular, our model is similar to the one introduced in Clementi et al. (2000) and further studied in Kaya and Chan (2003a). Following Kaya and Chan (2003a), we choose the strengths of energy terms in Equation 1 to be krep= ɛ, kbon=100 ɛ, kben=20 ɛ, and ktor=0.5 ɛ, respectively, where the energy unit ɛ is set to 1, and use Langevin dynamics to calculate the thermodynamic behavior. The temperature is kept constant at T=1.0, and snapshots are taken every 100 time steps. Simulation details are otherwise the same as in Kaya and Chan (2003a).
The native topomers
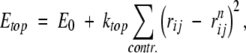
The energy function in Equation 1 describes a disordered and “floppy” protein chain that samples many different conformations. To obtain a subset of these conformations that corresponds to the native topomer state of each of the four proteins studied here, we impose harmonic constraints representing the sequence-distant topomer contact pairs on the Cα chain. This is achieved by using the energy function
 |
(2) |
where the summation shown is over the ΛD sequence-distant native contacts as defined by the cutoff parameters lc and rc (see Table 1). The conformational sampling procedure here is similar to the determination of ensembles of partially disordered protein conformational states that uses experimental data as constraints (Choy and Forman- Kay 2001; Vendruscolo et al. 2001), the main difference being that the constraints in this study are supplied by the TSM hypothesis instead of experimental measurements. In Equation 2, the topomer constraint strength is taken to be ktop=10 ɛ, making these harmonic forces one order of magnitude weaker than the strength kbon of the virtual bonds between sequentially adjacent Cα atoms. We perform Langevin dynamics simulations of the energy function Etop for each of our four proteins and different choices of the parameters lc and rc. Each simulation is started from the native structure. The system is first equilibrated for 108 simulation time steps, after which sampling is performed for 109 time steps.
In general, a smaller lc and a larger rc will produce a larger number of topomer constraints, resulting in a topomer ensemble that more closely resembles the native pdb structure. This trend can be seen from Table 3, which shows thermodynamic averages of the radius of gyration Rg, the root-mean-square deviation (rmsd) from the corresponding native structure, and the fraction of native contacts Q for four different parameter choices of lc and rc. Smaller lc and larger rc naturally lead to smaller 〈rmsd〉 and larger 〈Q〉 values, consistent with more native-like ensembles. We note also that 〈Rg〉 remains fairly close to the corresponding native values (see Table 1) across the various choices of lc and rc.
Table 3.
Native topomer thermodynamic averages
| lc = 4, rc = 8 Å | lc = 12, rc = 8 Å | lc = 4, rc = 6 Å | lc = 12, rc = 6 Å | |||||||||
| <Q> | <rmsd> | <Rg> | <Q> | <rmsd> | <Rg> | <Q> | <rmsd> | <Rg> | <Q> | <rmsd> | <Rg> | |
| 1aps | 0.99 | 0.97 | 12.5 | 0.96 | 1.43 | 12.5 | 0.97 | 3.09 | 12.6 | 0.86 | 5.37 | 12.6 |
| 2ci2 | 0.95 | 2.19 | 10.4 | 0.90 | 2.68 | 10.3 | 0.92 | 4.74 | 10.8 | 0.79 | 5.21 | 11.0 |
| 1urn | 0.96 | 2.45 | 11.9 | 0.86 | 3.06 | 12.0 | 0.90 | 6.73 | 12.9 | 0.70 | 7.41 | 13.4 |
| 1lmb | 0.87 | 3.07 | 10.8 | 0.58 | 4.44 | 11.1 | 0.83 | 9.42 | 12.9 | 0.34 | 11.0 | 14.3 |
Thermodynamic averages (denoted by <...>) of fraction of native contacts (Q), root-mean-square deviation (rmsd, in Å ), and radius of gyration (Rg in Å ), are obtained from simulations of the energy function Etop (see equation 2) at temperature T = 1.0. Q is calculated using the contact definition rij<1.2rnij.
The conformational ensembles of native topomers obtained here are a direct logical consequence of the TSM assumptions of Makarov and Plaxco (2003). An advantage of our explicit-chain approach is that it can supply relatively detailed conformational information that was not available in their TSM formulation that used an analytical approximation of conformations of chains without excluded volume. To provide a graphic structural illustration of the ensemble of topomer conformations obtained from our simulations, we display in Figure 2 ▶ a selected set of these conformations optimally superimposed on the corresponding native structure. These conformations are the first 25 centroids from a simple clustering scheme on the complete topomer ensembles (see figure caption). It is interesting to note that, qualitatively, these drawings appear to be consistent with the TSM perspective (Makarov et al. 2002; Makarov and Plaxco 2003) that a slow-folding protein such as 1aps has a “tighter” transition state ensemble than, for example, the much faster folding protein 1lmb, which has a very “loose” native topomer state (Fig. 2 ▶). A similar picture is offered by a more recent non-explicit- chain analysis of the correlation between folding rates and presumed ensemble sizes of “transition states” (Bai et al. 2004) derived from the total contact distance measure (Zhou and Zhou 2002). Here, the trend exhibited in Figure 2 ▶ is further demonstrated by Figures 3 ▶ and 4 ▶, which show the normalized probability distributions P(rmsd) and P(Q) for lc=12 and rc=8 Å . The order of these distributions in terms of their closeness to the native structure follows the order of the experimental folding rates for these proteins (see Table 1), as expected from the TSM picture. The same rmsd and Q order holds for practically all the other choices of lc and rc within the limits 4 ≤ lc ≤ 12 and 6 Å ≤ rc ≤ 8 Å studied here.
Figure 2.
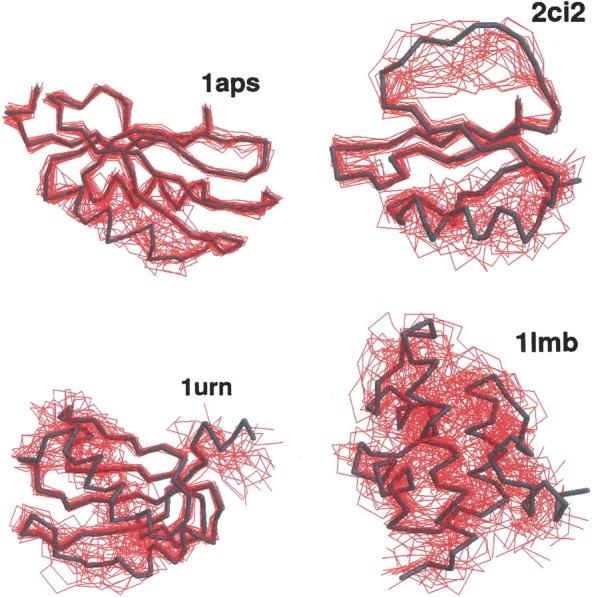
Illustrations of the native topomers for the proteins 1aps, 1ci2, 1urn, and 1lmb. Shown are the top 25 conformations (red) selected by a simple clustering procedure on the full lc=12, rc=8 Å topomer ensembles. Each of the 25 conformations is optimally superimposed on the corresponding native structure (dark trace). In the clustering procedure, the highest ranking conformation is the one with the largest number of conformational neighbors, where two conformations are considered to be neighbors if their rmsd is less than a certain cutoff (1.3–4.0 Å). The next highest ranking conformation is the conformation with most neighbors in the reduced ensemble, where the highest-ranking conformation and its neighbors have been excluded, and so on.
Figure 3.

Probability distributions P(rmsd), where rmsd is from the corresponding native pdb structure, for 1aps, 2ci2, 1urn, and 1lmb, as obtained using lc=12 and rc=8 Å in Equation 1, and sampling at T=1.0.
Figure 4.

Probability distributions P(Q) for 1aps, 2ci2, 1urn, and 1lmb, as obtained using lc=12 and rc=8 Å in Equation 1, and sampling at T=1.0.
Native topomer ensemble sizes and folding rate predictions
We turn now to a more quantitative assessment of the TSM. In the previous section we saw that the native topomer ensembles of the four proteins display various degrees of “floppiness”; the 1lmb topomer ensemble is, in a sense, larger than that of 1aps (see Fig. 2 ▶). The TSM perspective hypothesizes that it is these differences in ensemble sizes that underlie the different folding rates observed for different proteins. More precisely, TSM stipulates that the folding rate is essentially proportional to ΛDP(ΛD), the probability of populating the native topomer during a random, diffusive search, since TSM considers this to be the rate-limiting step in the folding of small, single-domain proteins (Makarov and Plaxco 2003).
As mentioned briefly above, Makarov and Plaxco (2003) made the approximation, based on considerations of Gaussian inert chains, that P(ΛD)= γaΛD, where γ and a are constants applicable to all proteins. This means that bringing each additional sequence-distant native pair together contributes on average a constant multiplicative factor a (<1) to the overall probability P(ΛD) of the native topomer state among the full ensemble of all accessible conformations. (The first three contact pairs are assumed to contribute with somewhat different factors, which are taken into account by the overall multiplicative factor γ ≠ 1.) The topomer search rate was then postulated to be given approximately by the formula kf= κ ΛDP(ΛD), where kf is the folding rate, and κΛD is the frequency of attempted contact formation. This formula was fitted to experimental folding rate data for a set of 24 twostate proteins yielding an excellent correlation coefficient of ≈0.88 (Makarov and Plaxco 2003). It should be noted that the dominant, exponential dependence on ΛD in this Makarov-Plaxco expression is in P(ΛD). Thus, this rate correlation formula resembles closely the ln kf ∝ LRO hypothesis proposed previously by Selvaraj and Gromiha (2001) because LRO=ΛD/N.
The success of this empirical two-parameter fit implies that the structural quantity ΛD or LRO—like the original CO parameter (Plaxco et al. 1998)—is capturing significant aspects of the physics of apparent two-state protein folding. Obviously, the more important issue, then, is whether the physical picture offered by the TSM perspective is supported by this remarkable folding rate correlation as well. Does the empirical success of the TSM kf (ΛD) formula necessarily imply that the proposed process of topomer search is correct or even physically plausible? To provide a logical answer to this question, an essential first step is to determine the mathematical validity of the P(ΛD)= γaΛD formula; more specifically, whether this formula, indeed, provides the native topomer probability it purports to describe. Obviously, unless the answer to this basic question is affirmative, the empirical success of the TSM kf(ΛD) formula can only be compared with empirical rate correlation with LRO and other proposed parameters but cannot logically be translated into support for the broader topomer-search discourse.
We therefore first focus on the TSM formula P(ΛD)= γaΛD. By fitting experimental data, the two constants γ and a have been determined to be a=0.86 and γ =4× 10⁻⁵ for lc=12 and rc=6 Å (Makarov and Plaxco 2003). Using these fitted values of Makarov and Plaxco in conjunction with the ΛD values for lc=12 and rc=6 Å in Table 2, the γaΛD values for our four proteins are found to be ranging from 10−5 to 10−10 (Table 4). Thus, according to this Makarov-Plaxco formula, populating the native topomer state during a random conformational search is about 3 × 10⁴ times more likely for llmb than for 1aps, for example; and this predicted probability difference is approximately equal to the folding rate difference of these two proteins.
Table 4.
Estimated probabilities P (ΛD)
| rc = 8 Å | rc = 6 Å | ||||
| lc = 4 | lc = 12 | lc = 4 | lc = 12 | γaΛD | |
| 1aps | 2 × 10−86 | 8 × 10−85 | 8 × 10−82 | 3 × 10−75 | 3 × 10⁻¹⁰ |
| 2ci2 | 2 × 10−47 | 7 × 10−45 | 2 × 10−38 | 1 × 10−36 | 1 × 10⁻⁷ |
| 1urn | 8 × 10−73 | 4 × 10−68 | 8 × 10−60 | 1 × 10−47 | 1 × 10⁻⁸ |
| 11mb | 7 × 10−60 | 3 × 10−48 | 2 × 10−37 | 1 × 10⁻¹⁸ | 1 × 10⁻⁵ |
P(ΛD) is the probability that the ΛD sequence-distant native contacts are formed during a search process described by the energy function E0 (see Equation 1). Two amino acid residues i and j are assumed to contact each other if rij < rnij +3.0 Å. For comparison, we have included the corresponding values from the Makarov-Plaxco P(ΛD)= γaΛD formula with a =0.86 and γ = 4610−5.
Now, is this predicted probability difference valid? Does the Makarov-Plaxco P(ΛD) formula adequately describe the relative size of the native topomer subensemble relative to the full conformational ensemble? To tackle this question, we compute the probability P(ΛD) for our four proteins in explicit-chain conformational ensembles defined by the energy function E0 in Equation 1. To err on the side of affording a higher probability to the native topomer, in this analysis we use the more permissive contact criterion rij<rnij+3.0 Å to determine if amino acid residues (Cα positions) are in contact. The most direct way to ascertain P(ΛD) would be to perform Langevin dynamics simulations with E0 and count the fraction of conformations that fulfill the native topomer criterion, that is, having the ΛD amino acid pairs close in space. But such a bruteforce approach is not computationally feasible because of the smallness of P(ΛD), making the native topomer very unlikely to be visited by unbiased conformational sampling. Thus, to enhance sampling of the native topomer, we introduce the auxiliary energy function
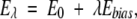 |
(3) |
where Ebias is a potential with a bias toward the native topomer and λ is a bias strength parameter. Two-dimensional histograms Pλ (nD, Ebias) are recorded for a series of λ, where nD denotes the number of sequencedistant native contacts formed. A standard histogram reweighting technique (Ferrenberg and Swendsen 1989) is then applied to obtain an improved estimate of P0(nD, Ebias), and hence of P0(nD=ΛD)=P(ΛD). Further details of this reweighting procedure, including the precise form of Ebias, are given in Materials and Methods. It should be noted that by design Ebias is not a function of all Cα positions, but only of those that are part of the native topomer constraint set, such that the added bias is toward the somewhat disordered native topomer state (whose sampling we aim to enhance) rather than toward the fully native pdb structure.
Table 4 shows the results of our P(ΛD) calculations for four different choices of lc and rc. For the four proteins studied, our explicit-chain estimates of P(ΛD) lie in the range ~10−86 to 10−18, in contrast to the much larger values produced by the formula P(ΛD)= γaΛD using the particular a and γ parameters of Makarov and Plaxco. In fact, some of the computed explicitchain P(ΛD) probabilities in Table 4 are as small as what would be expected for a Levinthal search. For instance, assuming that each Ramachandran torsion angle can occupy three discrete values, the total number of conformations for a 64-amino-acid protein (such as 2ci2) would be roughly (3×3)64 ≈ 1061. (The essential exponential increase with chain length N of the number ~ μN of all possible conformations—most of which are noncompact—applies to chains with excluded volume as well. The effect of excluded volume in three dimensions leads to an appreciable but not large decrease in μ. For instance, for chains configured on simple cubic lattices, μ decreases from 6 to ≈4.68; e.g, see Barber and Ninham 1970; Chan and Dill 1991). From a polymer physics perspective, the results in Table 4 are not surprising. This is because the native topomer ensembles, especially those with relatively large ΛD’s (e.g., 1aps), P(ΛD) is the probability that the ΛD sequence-distant native contacts are formed during a search process described by the energy function E0 (see Equation 1). Two amino acid residues i and j are assumed to contact each other if rij<rnij +3.0 Å . For comparison, we have included the corresponding values from the Makarov-Plaxco P(ΛD)= γaΛD formula with a=0.86 and γ =4 × 10⁻⁵. are constituted of conformations quite closely resembling that of the native pdb structure itself (cf. Figs. 3 ▶ and 4 ▶). A probable cause of the gross overestimation of native topomer probabilities by the Makarov-Plaxco γaΛD formula is its neglect of excluded volume. Excluded volume places enormous restrictions on the conformational freedom of compact chains (Chan and Dill 1990), but excluded volume effects are not taken into account in the Makarov-Plaxco TSM formulation. We note that the relative values of the P(ΛD) probabilities computed here mostly follow the same order as that provided by the P(ΛD)= γaΛD expression, suggesting that this formula might apply approximately for a different set of a and γ. For example, fitting this formula to our explicitchain P(ΛD) results for lc=12 and rc=8 Å yields the parameter values of a=0.60 and γ =4.5 × 10⁻³³; but in that case the exceedingly small value of γ would not conform to the TSM picture of Makarov and Plaxco (2003), who have related a γ ~ 10−5 value to “the extra entropy associated with the first few ordering events” (Makarov and Plaxco 2003, p. 21). More fundamentally, however, the very small values of the present explicitchain P(ΛD) values strongly support the argument against the TSM speculation that the “entropic cost of finding the native topomer may be reasonable even in the absence of native-like interactions that may favor this set of conformations” (Makarov and Plaxco 2003, p. 22). Quite to the contrary, the vanishingly small native topomer probabilities we obtained imply that an unbiased, diffusive search for the native topomer among all accessible conformations, like the hypothetical Levinthal search, is highly unlikely to succeed and is therefore not a viable mechanism for apparent twostate folding.
φ-values and rate-limiting formation of the native topomer
In the TSM picture, the rate-limiting step of folding is the search for the native topomer. Thus, TSM predicts how the conformational ensemble of any given protein should look at the point when the rate-limiting step is achieved during the folding process. In principle, these structural predictions of TSM can be independently verified or falsified by experiments, irrespective of the mathematical/physical question raised above regarding whether the TSM formula provides the correct probability for the hypothetical native topomer state.
The native topomer state has been identified with the folding transition state. According to Makarov et al. (2002), the TSM model “assumes that the folding rate is controlled by the rate of forming all the native contacts observed in the folded protein” (note that these “contacts” refer to native topomer contacts that require a contacting pair to be separated by at least a certain number of residues along the chain), and that the state created when all contacts that define the native topomer is formed is a “transition state” of the model (Makarov et al. 2002, pp. 3536, 3539). Therefore, it is instructive to compare the structural characteristics of the native topomer state with the folding transition state properties inferred by experimental techniques.
A common approach to characterize the transition state ensemble for two-state proteins is through φ-value analysis (Fersht et al. 1992). In these experiments, collection of single amino acid mutations is performed and their effects on the folding rate and stability are measured. The goal of φ-value analysis is to map out the degree of “interaction” of the mutated amino acids in the transition state. The final result for an amino acid is expressed as a φ-value, which states whether the amino acid is “ordered” (φ ≈ 1) or “disordered” (φ ≈ 0) in the transition state ensemble. Notwithstanding the recent controversy about the interpretation of experimental φ-values (Sanchez and Kiefhaber 2003; Fersht 2004; Hubner et al. 2004), φ-value analysis is a widely adopted approach. Thus, it is worthwhile to delineate the logical relationship between experimental φ-values and the corresponding quantities implied by TSM, even though φ-values were not computed by Makarov et al. themselves.
It is relatively straightforward to use the conformational ensembles from our simulations of the hypothetical native topomers to calculate TSM-predicted φ-values, which can then be compared with available experimental φ-value data for the four proteins studied here. Similar procedures have been applied before by other researchers to compare experimental φ-values and theoretical φ-values predicted by non-explicit-chain (Alm and Baker 1999; Galzitskaya and Finkelstein 1999; Muñoz and Eaton 1999) as well as explicit-chain (Clementi et al. 2000, 2003; Ejtehadi et al. 2004) models.
Before turning to more detailed calculations, several salient conclusions about TSM-predicted φ-values can be drawn by considering the general properties of the native topomer state (cf. Fig. 2 ▶). Any given amino acid residue making mostly sequence-distant native contacts in a protein’s pdb structurewill, because of the topomer constraints, havemanyof its spatially neighboringamino acid residues in the native structure also in proximity in the native topomer state. Consequently, TSM would predict a high φ-value for the given amino acid residue. In fact, if all of this amino acid residue’s native pdb contacts were sequence-distant, φ would be predicted byTSMto be ≈1.Onthe other hand, an aminoacid residuemakingmostlylocal contacts, as mightbe the case for residues in α-helical regions, is likely to have a lower TSM-predicted φ-value because by definition the amino acid residues it contacted in the native pdb structure are not required to be in spatial proximity in the native topomer state.
To calculate the TSM-predicted φ-values, we use the following definition of φ-value for an amino acid residue i:
 |
(4) |
where 〈Ni〉 is the average number of native contacts made by amino acid residue i in the native topomer conformational ensemble, and Nn i is the total number of native pdb contacts for this amino acid residue. This definition is identical to that introduced by Vendruscolo et al. (2001) to construct transition-state ensembles from experimental data. In the present calculation, a contact is considered formed if rij<1.2rnij. Figure 5 ▶ compares φicalc and φ-values obtained from experiments (Itzhaki et al. 1995; Burton et al. 1997; Chiti et al. 1999; Ternström et al. 1999). As expected, the TSM-predicted φicalc-values display a tendency to be lower in α-helical regions than in β-sheet regions. It is quite clear from Figure 5 ▶ that the TSM-predicted and experimental φ-values do not follow the same trend along the chain sequences. The correlation coefficient between φicalc and φiexp is <0.1 in each of the four cases, although there are isolated individual calculated φ-values that match the corresponding experimental values well. These results indicate that, at least for the four proteins studied, the TSM predictions about the structural characteristics of the rate-limiting transition- state conformational ensemble are very different from that obtained from common experimental φ-value analysis.
TSM “ψ-values”
A more informative way to characterize the folding transition state than the φ-values for individual amino acid residues is to consider the participation of pairs of contacting amino acid residues in the transition state. We apply this to the conformational ensembles of the four native topomer states, and determine the probability ψijcalc for each amino acid residue pair ij in the native contact set to be in contact in these topomer ensembles (Fig. 6 ▶). As before, a contact in these ensembles is defined by rij<1.2rnij. These TSM-predicted quantities are analogous to the -values in experimental analysis, wherein bi-histidine metal binding sites are introduced for selected pairs of amino acid residue positions, and the stability of folding pathways with the metal binding pair formed relative to other pathways is regulated by metal ion concentration. The resulting -value of a native contact ij, a number between 0 and 1, then represents the ratio of protein molecules that have the given metal binding site in the transition state (Sosnick and Krantz 2001).
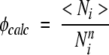
Figure 6.
Probabilities of native contacts being formed (ψijcalc-values) in the lc=12, rc=8 Å topomer ensembles. The color scale goes from =0 (green) to =1 (red). The triangular regions above and below the main diagonal provide identical information.
Figure 6 ▶ displays our computed ψijcalc values for the lc=12, rc=8 Å native topomer ensembles. By TSM definition, the probability of being in contact is close to 1 for pairs ij that are more than lc steps from the diagonal i=j. It is thus a general TSM prediction that ψijTSM ≈ for amino acid pairs ij that are distant in sequence. Not surprisingly, in line with the calculated φ-values, the TSM-predicted -values in Figure 6 ▶ indicate that the α-helical regions are relatively more disordered in the native topomer states. ψ-value analysis is a relatively novel method, and experimental data are quite limited thus far. None of our four proteins has been studied experimentally with this technique. Nonetheless, TSM predictions in Figure 6 ▶ should be useful for future assessment when pertinent experimental data become available.
TSM and native-centric explicit-chain folding models
In the above, we have shown by explicit-chain sampling that the population of the hypothetical native topomer state as a fraction of all accessible conformations is dramatically lower than that originally stipulated by Makarov and Plaxco (2003), and that the structural properties of the native topomer states of the four proteins considered in this study do not appear to resemble that of the corresponding folding transition states inferred from conventional experimental φ-value analysis. To further elucidate the relationship between the TSM picture and explicit-chain dynamics, we now consider a class of native-centric models that allow for direct kinetic simulations of folding rates (Clementi et al. 2000; Koga and Takada 2001; Kaya and Chan 2003a).
One of the main justifications for the use of nativecentric models to study the folding process has been the empirically observed relationship between native topology and folding rate, emphasizing the important energetic information embodied in the native topology of natural proteins. This principle is, naturally, also central to the TSM. We therefore find it worthwhile to compare and to put into context these two types of approaches. In particular, we choose to compare the TSM with the Langevin dynamics version (Kaya and Chan 2003a) of the continuum Cα model of Clementi et al. (2000), because a recent variation of this explicit-chain modeling construct has been shown to provide a good correlation between model-predicted and real folding rates of 16 apparent two-state proteins (Chavez et al. 2004).
Conformational search in these native-centric models is directed, not unbiased. The main energy term driving chain collapse and folding in this native-centric model consists of Lennard-Jones-like interactions between every pair of amino acid residues ij that satisfies |i − j|>3 and forms a contact in the native pdb structure (Clementi et al. 2000). We consider two different definitions for two residues to be a native contact pair in this model: (1) if their Cα–Cα separation in the native pdb structure is less than a certain cutoff distance rc; (2) if any two heavy (non-hydrogen) atoms, one from each residue, are within 4.5 Å ; this is identical to the definition used recently by Chavez et al. (2004). Definition (1) is sensitive to the choice of rc. It turns out that the thermodynamic behaviors of three of our four proteins do not appear to be two-state-like for rc=6 Å and rc=7 Å (data not shown). Here we focus only on the better-behaved rc=8 Å case. Computational runs of 109 simulation time steps are executed for each of the four proteins for the two different native contact sets we just described, using the potential energy function and Langevin dynamics simulation protocol detailed elsewhere (Equations 1, 2; see related discussion in Kaya and Chan 2003a). In the present investigation, the simulations are performed at these model proteins’ respective folding temperature Tf, the temperature at which the given chain model’s specific heat capacity is at its maximum.
Figure 7 ▶ shows our simulated free-energy profiles in the fraction of native contacts Q. The location of the free-energy barrier along these profiles (the single peak between the unfolded and folded minima at low and high Q, respectively) varies slightly between the four proteins and the two different contact sets. The chain structures in these peak regions are commonly taken as the transition state conformations for these and similar native-centric explicit-chain models (Clementi et al. 2000; Nymeyer et al. 2000; Chavez et al. 2004). However, it has been pointed out that not all structural details of transition-state conformations can be captured by such simple procedures, because the factors determining whether a conformation belongs to the folding transition state can be complex (Du et al. 1998; Hubner et al. 2004). In other words, some true transition- state conformations of the model may reside outside the Q-based free-energy peak region. Nonetheless, inasmuch as kinetic transitions between different Q-values are not too discontinuous, conformations populating the free-energy barrier region are indicative of general features of the conformations associated with the rate-limiting step in folding (Kaya and Chan 2002). With this in mind, in the following discussion we refer to the conformations in the free-energy barrier regions in Figure 7 ▶ as the putative transition states of the native-centric explicit-chain models.
Figure 7.

Free-energy profiles for the four proteins are given by the negative logarithm of the conformational distribution P(Q) in Q, obtained in this study by simulations of native-centric models (Kaya and Chan 2003a) at T ≈ Tf. Results from two native contact sets are shown: (1) contact pairs are defined by native Cα–Cα distance rnij<8 Å (dashed curves); and (2) contact pairs are defined by the shortest spatial separation between non-hydrogen atoms in the two amino acid residues as described by Chavez et al. (2004) and in the text (solid curves). For comparison with the hypothetical TSM picture, the range of variation of 〈Q〉 of the corresponding native topomers across different (lc, rc) criteria (Table 3) is indicated by the shaded areas.
Figure 7 ▶ shows that these putative transition-state conformation are found roughly around Q ≈ 0.4–0.6, and that they are quite dissimilar to the corresponding native topomer ensembles, which have very different 〈Q〉-values (Fig. 7 ▶, shaded areas). For 1aps, 2ci2, and 1urn, in terms of Q, the native topomers are far more native-like than the explicit-chain putative transition states. In these cases, even if some of the true transition- state conformations do reside outside the Q-based free-energy peak region, it is highly unlikely that they would share many similarities with the native topomer ensembles that have Q-values essentially equal to (2ci2 and 1urn) or higher than (1aps) the Q-based native free-energy minima of the explicit-chain models (although the possibility cannot be ruled out entirely without an exhaustive determination of transition-state conformations in the explicit-chain models). For 1lmb, the situation is more complicated because of the strong dependence of 〈Q〉 on the cutoff parameters lc and rc. Taken together, these observations suggest strongly that the native topomer states do not generally correspond to the folding transition state in these models. Instead, they are more representative of conformations that are visited after the rate-limiting step in the folding of these explicit-chain models.
Finally, we compare the TSM rate-prediction formula kf ∝ ΛDaΛD and the folding rate results from the native-centric models. Following Chavez et al. (2004), we determine folding rates in the native-centric model at Tf using the direct Langevin dynamics simulation method of Kaya and Chan (2003a). Folding and unfolding rates are identical at the transition midpoint. Thus, the folding rate kf nc of the native-centric models at Tf is defined as the reciprocal of the mean first passage time (MFPT) from the beginning of an unfolded “phase” to the initiation of a folded phase, or vice versa, during the Langevin dynamics simulation [i.e., kf nc=(MFPT)−1]. The unfolded and folded phases correspond to Q≤Qu and Q≥Qf, respectively, where Qu and Qf are the unfolded (low Q) and folded (high Q) free-energy minima. The MFPT was determined by averaging over 40 (1aps) to 3225 (1lmb) folding/unfolding events recorded during 109 simulation time steps. Figure 8 ▶ shows that the correlation between ΛDaΛD and kf nc is good, which is perhaps not surprising given that both sets of results have been shown previously to correlate strongly with real folding rate data (Makarov and Plaxco 2003; Chavez et al. 2004). We note, however, that both the topomer search rate-prediction formula and the native-centric model predict 1urn to fold roughly an order of magnitude slower than 2ci2, but in fact the opposite is true (see Table 1).
Figure 8.

Comparison between the TSM quantity ΛDaΛD (a=0.86) (Makarov and Plaxco 2003) of the four proteins and the corresponding folding rate kf nc computed in this study from direct kinetic simulations of the native-centric Langevin dynamics models at each model’s Tf. Results for kf nc denoted by × and ⊡ are, respectively, for the native contact sets (1) and (2) specified in the caption for Fig. 7 ▶.
Despite the limitations of native-centric models with essentially pairwise additive interactions (which include the models used here) in their ability to capture experimental features of kinetic cooperativity when native stability is significantly higher than that at the transition midpoint (Kaya and Chan 2003a; Chan et al. 2004), comparing them with TSM predictions offers valuable insights. The predicted folding rates of the two approaches correlate well, but the native topomer states most likely do not correspond to the explicit-chain transition states. Moreover, as an unbiased search for the native topomer state is not viable (see above), it is not clear whether there is any definitive way to construct viable explicit-chain models that are consistent with the TSM. In any event, the results in Figures 7 ▶ and 8 ▶ indicate clearly that a good rate correlation by itself is far from sufficient to pin down the underlying folding mechanism.
For the native-centric explicit-chain model considered here, every point in the conformational space has an energetic bias toward the native state. Frustration in the model arises solely from chain connectivity and excluded-volume effects. As Q increases, the combined effects of these incremental energetic favorabilities and the reduced conformational freedom as the chain acquires an increasing number of favorable contacts result in a free-energy slope (with respect to Q) that becomes first zero and then negative at intermediate values of Q. In contrast, TSM predicts conformational characteristics that are much more native-like at the rate-limiting step of folding. In this connection, it has been pointed out that, as a consequence of experimentally observed protein folding cooperativity, “an excess of 90% of the native structure is required for the free energy of a typical single-domain protein to drop below zero” (Gillespie and Plaxco 2004, p. 855). However, the configurational position of the transition state is determined by the gradient of free energy with respect to the reaction coordinate(s), not by the value of free energy itself. As an illustration of this basic principle, we note that a chain model’s stability and cooperativity can be arbitrarily enhanced by adding an ad hoc favorable energy to the unique native structure as a whole without affecting the folding kinetics (Kaya and Chan 2003b). Therefore, the above observation of Gillespie and Plaxco does not necessarily imply that transition states of real, cooperative proteins have to be very close to the native state. In fact, such a proposal would appear to be inconsistent with many chevron predictions of intermediate solvent exposure of folding transition states (Plaxco et al. 1998).
Discussion
The point of contention of this article is not the remarkable correlation between folding rates of apparent two-state proteins and parameters derived from native topology. The empirical success of these parameters —these include the original CO, LRO, and the ΛDaΛD of TSM, and several others—suggests strongly that they are capturing important aspects of protein physics, which we should try to better understand. The subject matter of our investigation is whether the folding mechanism offered by the TSM formulation of Makarov et al. (2002) and Makarov and Plaxco (2003) is physically viable. In other words, is it mathematically and physically possible for the TSM ΛDaΛD formula to really describe the topomer search process postulated by the TSM picture? Generally speaking, multiple models based on very different underlying mechanisms can give similar predictions (cf. Fig. 8 ▶), thus a good correlation with real folding rate is not sufficient for validating a proposed mechanism. To ensure that the predictions of a model formulation do, indeed, follow logically from the stated assumptions, issues of mathematical validity and internal consistency should be examined as well.
In obtaining ensembles of structures consistent with the Makarov-Plaxco definition of a native topomer, we found it natural to apply harmonic forces between the ΛD sequence-distant contacts required to be in proximity by the TSM. It is possible that using a different strength ktop of the harmonic forces can have some effect on the results. However, in view of the rather strong dependence of ΛD on the parameters lc and rc, the dependence on ktop is likely not critical. It has also been suggested by Makarov and Plaxco (2003) that “proximity” in their topomer definition does not necessarily have to mean close in space but refers to “any orientation in which elements can collide to form the native contacts more rapidly than the rate-limiting step in folding” (Makarov and Plaxco 2003, p. 22). But it is unclear how such a description should be implemented in an explicit-chain context. Moreover, under such a definition, there is no longer a close conceptual link between the topomer search picture of folding and the parameter ΛD defined by the simple criterion rnij<rc.
Our explicit-chain computation demonstrates that the Makarov-Plaxco formulation has grossly overestimated the probability of finding the hypothetical native topomer among all accessible conformations, by tens of order of magnitudes in some cases (Table 4). This means that the TSM ΛDaΛD formula does not actually describe the postulated topomer search process in the TSM picture. The likely reason for this failure is that excluded volume effects on chain conformations were neglected. Unlike the original topomer formulation of Debe et al. that took excluded volume into account (Debe and Goddard 1999; Debe et al. 1999), the conformational statistics of Makarov et al. (2002) were based on Gaussian inert (phantom) chains. It is not difficult to see how a neglect of excluded volume can lead to such large errors: If there were no excluded volume, all Cα positions of a phantom protein chain can be confined within a sphere of diameter ~3.8 Å , the virtual bond length between two sequential Cα’s. Since all inter-Cα distances in such conformations are less than the cutoff rc, these unphysical conformations are included in the native topomer. By the same token, unphysical topomer conformations can be constructed for spheres with different diameters <rc. These and other similarly unphysical “super-compact” conformations satisfying a given (lc, rc) criterion are all accepted as part of the native topomer state in the Makarov-Plaxco formulation, leading to a hugely inflated conformational count.
Another way to illustrate this problem of gross conformational overcount is the following. For real chains with excluded volume, when a sufficiently large set of consistent pairwise contact constraints is imposed, the number of viable conformations would reduce to unity or very close to unity. After all, this polymer principle is what allows compact protein native structures to be determined by NMR. (Presumably, hypothetical native topomer ensembles can be explored using common softwares such as XPLOR for NMR structure determination by imposing TSM interresidue distance restraints. Indeed, Figure 2 ▶ is reminiscent of NMR structural displays. It should be noted, however, that in NMR structure determination, instead of simple harmonic constraints, biharmonic, square-well, and other restraining potentials are usually adopted for distance geometry; see, e.g., Brünger et al. 1986; Brünger 1992.) But this basic condition is not satisfied by the Makarov-Plaxco formulation. Take 2ci2 as an example. For rc=8 Å , there are a total of 124 native contacts (rnij<8 Å , |i − j|>3; the corresponding numbers for 1aps, 1urn, and 1lmb are 263, 213, and 141, respectively). This number is only slightly larger than the 108 native contacts that define the lc=4, rc=8 Å 2ci2 native topomer (Table 2). Direct explicit-chain simulations of Cα models have indicated that the set of 124 native contacts is sufficient to essentially specify the 2ci2 native conformation uniquely (up to a mirror symmetry). If we substitute ΛD=124 into the Makarov- Plaxco formula P(ΛD)=γaΛD with a=0.86, we obtain a probability of P(124)=3.0×10⁻¹³. Since the unfolded states of small, two-state proteins are expected to consist of mostly open conformations (Kohn et al. 2004), the number of all accessible 2ci2 conformations may be very roughly estimated as ~1061 by assuming three rotational states per dihedral angle (see above). Even a much more conservative consideration based on three rotational states per amino acid residue yields an estimate of 364 ≈ 3 × 1030. Therefore, if the Makarov- Plaxco P(ΛD) expression is adequate for a realistic chain, the probability factor it predicts for ΛD=124 should be sufficiently small to reduce the huge number of all accessible 2ci2 conformations to order unity. But the predicted P(124) ~ 10−13 factor is 17 to 48 orders of magnitude too large to do so, underscoring the formula’s gross overestimation of the conformational freedom of compact chains with excluded volume.
Polymer excluded volume is notoriously difficult to treat by analytical methods, especially for compact conformations (Barber and Ninham 1970; Freed 1987; Chan and Dill 1991). Moreover, the impact of excluded volume effects is much more severe for compact conformations than for open conformations (Chan and Dill 1989; Camacho and Thirumalai 1993). In this context, explicit-chain modeling is indispensable in many applications. In the absence of the mathematical discipline and the deductive logic it affords, errors incurred by analytical approximations and semiquantitative arguments are often difficult to delineate.
Based on their P(ΛD) estimate, Makarov and Plaxco (2003) have stated that “this is precisely how the topomer search model solves Levinthal’s paradox; whereas the number of conformations in the native topomer is small relative to the total number of conformations available in the unfolded ensemble, it is enormously larger than unity” (Makarov and Plaxco 2003, p. 22). The simple considerations above and our explicit-chain sampling data have made it quite clear that this assertion is not tenable. Although the number of conformations in a native topomer is larger than unity, in general it is very far from sufficiently large to allow an unbiased search of the native topomer among all accessible conformations to be a viable solution to Levinthal’s paradox.
It has long been recognized that protein folding cannot be achieved by unbiased conformational search (Baldwin 1994). In light of the present findings, it is even more clear that the neglect of energetic contributions to the rate-limiting step of folding in the bulk of the TSM argument is not appropriate. The proponents of TSM have acknowledged that this is “obviously a potentially significant omission” (Makarov and Plaxco 2003, p. 22). Indeed, in order for protein folding to be achievable in physiological time scales, conformational sampling has to have elements of directed search (Leopold et al. 1992; Zwanzig et al. 1992; Bryngelson et al. 1995; Thirumalai and Woodson 1996; Dill and Chan 1997; Dobson et al. 1998), although the high degrees of thermodynamic and kinetic cooperativity of many natural proteins imply that their underlying energy landscapes may be somewhat different from those derived from certain common protein chain models (Kaya and Chan 2003b; Chan et al. 2004; Scalley- Kim and Baker 2004).
The main thrust of the TSM discourse is on the estimation of the (incorrectly) presumed affordable entropic cost of unbiased search for the native topomer. Nonetheless, the possibility of incorporating a general native-favoring energy term in the topomer search process has also been explored (Makarov et al. 2002). A desire to capture the high degree of cooperativity in protein folding was one of the motivations for the TSM proposal (Gillespie and Plaxco 2004). An explicit-chain construct that has apparently been inspired by the TSM perspective is the lattice model, with excluded volume, of Jewett et al. (2003). Instead of the usual linear relationship between Q and energy E in common Gō models, Jewett et al. (2003) introduced a nonlinear Q–E relationship, controlled by a parameter s, to enhance the cooperativity of their models and yet (when s ≠ ∞) allow for a native-centric directed conformational search. Relative to the corresponding common Gō models, the Jewett et al. construct results in an improvement in correlation between model folding rate and CO, and a slight increase in the folding rate diversity. But these improvements are considerably less significant than another lattice model that uses a different cooperative interaction scheme involving local–nonlocal coupling (see Chan et al. 2004, Fig. 7 ▶). It is unclear whether folding rate correlation with CO can be meaningfully improved further within the class of model interaction schemes of Jewett et al. (2003) by increasing their cooperative parameter s beyond the highest value of s=3 that they used because s → ∞ entails a Levinthal search. Such an unphysical process would most likely also abolish the dependence of folding rates on native topology. While these models are rudimentary, the following conceptual implication of this comparison is clear: Cooperativity per se is insufficient for protein-like correlation between folding rate and native topology. The specific energetic interactions that give rise to the cooperativity is the determining factor (Kaya and Chan 2003c). The TSM folding scenario of unbiased search for the native topomer has not been verified by any explicitchain model with a proper account of excluded volume. In fact, the analysis in this paper demonstrates that such a search cannot succeed. Inasmuch as the lattice model of Jewett et al. (2003) is an explicit-chain implementation of a more relaxed version of the TSM idea (i.e., without insisting on an unbiased search), the lattice model results mean that even such a relaxed TSM-inspired mechanism, when evaluated in an explicit-chain context, is quite far from capturing the trend of topology dependence in real protein folding.
Besides the unrealistic unbiased conformational search process it advocated, the hypothetical TSM folding process may be regarded as a particular form of a general nucleation mechanism (Fersht et al. 1992; Abkevich et al. 1994; Fersht 1995; Thirumalai and Guo 1995), with TSM offering a more definitive, and therefore falsifiable, prediction on the structural characteristics of folding transition states (cf. Fig. 2 ▶). It follows that not every protein model that produces a high degree of cooperativity can be regarded as an implementation of the TSM idea. Leaving aside the question of how the TSM-predicted sets of rate-limiting structures are located by conformational search, we have attempted a simple experimental evaluation of these structural predictions. The results so far are not positive.
An aspect of the TSM perspective worth further exploring is the idea relating to the size of transition state conformational ensemble as part of the entropic component of the free-energy barrier to folding (Bai et al. 2004). However, as is clear from the discussion above, energetic or enthalpic contributions to the ratelimiting step in folding cannot be neglected. Favorable intrachain interactions must exist in chains in the unfolded ensemble to direct the conformational search. Experimental observations of protein folding cooperativity using low-resolution techniques should serve as an important modeling constraint (Chan et al. 2004). But cooperativity as such does not eliminate all conformations with free energies intermediate between that of the folded and unfolded states. Sparsely populated or “hidden” intermediate conformations exist (Bai et al. 1995; Ollerenshaw et al. 2004; Kaya and Chan 2005). An elucidation of the protein folding process must involve deciphering the stability and kinetic connectivities of these conformations, because this information holds the key to how conformational search is directed during folding. Further advance would require concerted efforts in theory and experiment. In this endeavor, self-contained, explicit-chain modeling that embodies an adequate account of polymer excluded volume is an essential tool.
Materials and methods
Estimating the probabilities P(ΛD)
To estimate the thermodynamic quantities P(ΛD) in the explicit- chain model defined by the energy function E0 in Equation 1, we use the following computational strategy: An auxiliary energy function Eλ=E0+λEbias is used to calculate twodimensional probability histograms Pλi (nD, Ebias), where nD is the number of sequence-distant native contacts, for a series of K discrete bias strengths λ1, ..., λK. The maximum bias strength, λK, is chosen so that there is a significant population of the native topomer state at that λ, namely, PλK (ΛD)>10−4. These histograms can then be combined through standard histogram reweighting technique (Ferrenberg and Swendsen 1989) to give improved estimates of Pλ(nD, Ebias), for any λ. Hence, by using λ=0 in this reweighting procedure we obtain P0(nD, Ebias), from which the desired probability P0(ΛD)=P(ΛD) can easily be calculated.
The above sampling strategy is straightforward. In principle, if infinite sampling were possible, the result should be independent of the specific choice of the bias potential. In practice, however, care must be taken so that the native topomer state is sampled in a representative way. We therefore construct Ebias not as a function of all the N Cα positions of the Cα chain, but only of the subset of the Cα positions that are involved in the ΛD sequence-distant native contacts as defined by TSM. This bias function is composed of a “torsion” and a contact term:
 |
(5) |
where φ′k are the torsion angles formed by four consecutive Cα positions in the TSM-defined subset, and φ′k n the corresponding values in the native pdb structure. The first summation is over all such torsion angles. The second summation is over all native contacts kl (rnkl<rc) for which both k and l are part of the TSM-defined subset of Cα positions.
We obtain the two-dimensional probability distributions Pλi (nD, Ebias) by a dynamical-parameter method closely related to simulated tempering (Lyubartsev et al. 1992; Marinari and Parisi 1992; Irbäck and Potthast 1995). In simulated tempering, the configurational space of the system is expanded to include the temperature, which becomes a dynamical parameter. Here we instead let the bias parameter λ become a dynamical parameter. We use eight different linearly separated values (K=8) from λ1=0 to λK. The maximum bias used, λK, ranges from 1.15 (for 1aps and lc=4 and rc=8 Å ) to 8.0 (for 1lmb and lc=12 and rc=6 Å ). Conformational sampling is performed using Langevin dynamics, exactly as before for the constrained chain simulations, and changes between adjacent λi values are performed as elementary Monte Carlo moves. Frequent visits to λ1=0 effectively decorrelate the generated sequence of conformations and improve sampling. For each lc and rc in Table 4, a simulation with a sampling time of 109 steps is performed to obtain the eight Pλi(nD, Ebias) histograms, which are then combined to give the corresponding P(ΛD) value. As an example, we display in Figure 9 ▶ the marginal distributions Pλi(Ebias) obtained from one of these simulations, showing that sufficient overlaps between adjacent Ebias distributions are obtained despite the relatively few λi values used. Each simulation is initiated from a disordered conformation. We note that the dynamical parameter method used here works well together with the histogram reweighting technique since it provides the free energies at each chosen λi value (the so-called g-parameters), which are needed to achieve a self-consistent solution to the multiple-histogram reweighting equations (Ferrenberg and Swendsen 1989).
Figure 9.

Marginal distributions Pλi (Ebias) for eight linearly separated λi values (from λ1=0 to λ8=1.6), as obtained from a simulation of the energy function Eλ=E0+λEbias for 2ci2 and lc=12 and rc=8 Å in which λ is a dynamical parameter (see text).
Acknowledgments
Illuminating discussions with Kevin Plaxco and Eugene Shakhnovich are gratefully acknowledged. We thank Julie Forman-Kay for a helpful discussion on distance restraints in NMR structure determination, and an anonymous referee for instructive comments. This work was partly supported by the Swedish Research Council (S.W.), the Protein Engineering Network of Centres of Excellence (Canada), and a Canadian Institutes of Health Research grant (MOP-15323) to H.S.C., who holds a Canada Research Chair in Biochemistry.
Article and publication are at http://www.proteinscience.org/cgi/doi/10.1110/ps.041317705.
References
- Abkevich, V.I., Gutin, A.M., and Shakhnovich, E.I. 1994. Specific nucleus as the transition state for protein folding: Evidence from the lattice model. Biochemistry 33 10026–10036. [DOI] [PubMed] [Google Scholar]
- Alm, E. and Baker, D. 1999. Prediction of protein folding mechanisms from free-energy landscapes derived from native structures. Proc. Natl. Acad. Sci. 96 11305–11310. [DOI] [PMC free article] [PubMed] [Google Scholar]
- Bai, Y., Sosnick, T., Mayne, L., and Englander, S.W. 1995. Protein folding intermediates: Native-state hydrogen exchange. Science 269 192–197. [DOI] [PMC free article] [PubMed] [Google Scholar]
- Bai, Y.W, Zhou, H.Y., and Zhou, Y.Q. 2004. Critical nucleation size in the folding of small apparently two-state proteins. Protein Sci. 13 1173–1181. [DOI] [PMC free article] [PubMed] [Google Scholar]
- Baker, D. 2000. A surprising simplicity to protein folding. Nature 405 39–42. [DOI] [PubMed] [Google Scholar]
- Baldwin, R.L. 1994. Folding intermediates in protein folding. BioEssays 16 207–210. [DOI] [PubMed] [Google Scholar]
- Barber, M.N. and Ninham, B.W. 1970. Random and restricted walks: Theory and applications. Gordon and Breach, New York, NY.
- Brünger, A.T. 1992. XPLOR manual, Version 3.1. Yale University, New Haven, CT.
- Brünger, A.T., Clore, G.M., Gronenborn, A.M., and Karplus, M. 1986. Three-dimensional structures of proteins determined by molecular dynamics with interproton distance restraints: Application to crambin. Proc. Natl. Acad. Sci. 83 3801–3805. [DOI] [PMC free article] [PubMed] [Google Scholar]
- Bryngelson, J.D., Onuchic, J.N., Socci, N.D., and Wolynes, P.G. 1995. Funnels, pathways and the energy landscape of protein folding: A synthesis. Proteins Struct. Funct. Genet. 21 167–195. [DOI] [PubMed] [Google Scholar]
- Burton, R.E., Huang, G.S., Daugherty, M.A., Calderone, T.L., and Oas, T.G. 1997. The energy landscape of a fast-folding protein mapped by Ala → Gly substitutions. Nat. Struct. Biol. 4 305–310. [DOI] [PubMed] [Google Scholar]
- Camacho, C.J. and Thirumalai, D. 1993. Minimum energy compact structures of random sequences of heteropolymers. Phys. Rev. Lett. 71 2505–2508. [DOI] [PubMed] [Google Scholar]
- Chan, H.S. and Dill, K.A. 1989. Compact polymers. Macromolecule 22 4559–4573. [Google Scholar]
- ———. 1990. The effects of internal constraints on the configurations of chain molecules. J. Chem. Phys. 92 3118–3135. [Google Scholar]
- ———. 1991. Polymer principles in protein structure and stability. Annu. Rev. Biophys. Biophys. Chem. 20 447–490. [DOI] [PubMed] [Google Scholar]
- Chan, H.S., Shimizu, S., and Kaya, H. 2004. Cooperativity principles in protein folding. Methods Enzymol. 380 350–379. [DOI] [PubMed] [Google Scholar]
- Chavez, L.L., Onuchic, J.N., and Clementi, C. 2004. Quantifying the roughness on the free energy landscape: Entropic bottlenecks and protein folding rates. J. Am. Chem. Soc. 126 8426–8432. [DOI] [PubMed] [Google Scholar]
- Chiti, F., Taddei, N., White, P.M., Bucciantini, M., Magherini, F., Stefani, M., and Dobson, C.M. 1999. Mutational analysis of acylphosphatase suggests the importance of topology and contact order in protein folding. Nat. Struct. Biol. 6 1005–1009. [DOI] [PubMed] [Google Scholar]
- Choy, W.Y. and Forman-Kay, J.D. 2001. Calculation of ensembles of structures representing the unfolded state of an SH3 domain. J. Mol. Biol. 308 1011–1032. [DOI] [PubMed] [Google Scholar]
- Cieplak, M. and Hoang, T.X. 2003. Universality classes in folding times of proteins. Biophys. J. 84 475–488. [DOI] [PMC free article] [PubMed] [Google Scholar]
- Clementi, C., Nymeyer, H., and Onuchic, J.N. 2000. Topological and energetic factors: What determines the structural details of the transition state ensemble and “en-route” intermediates for protein folding? J. Mol. Biol. 298 937–953. [DOI] [PubMed] [Google Scholar]
- Clementi, C., Garcia, A.E., and Onuchic, J.N. 2003. Interplay among tertiary contacts, secondary structure formation and side-chain packing in the protein folding mechanism: All-atom study of Protein L. J. Mol. Biol. 326 933–954. [DOI] [PubMed] [Google Scholar]
- Debe, D.A. and Goddard, W.A. 1999. First-principles prediction of protein folding rates. J. Mol. Biol. 294 619–625. [DOI] [PubMed] [Google Scholar]
- Debe, D.A., Carlson, M.J., and Goddard III, W.A. 1999. The topomersampling model of protein folding. Proc. Natl. Acad. Sci. 96 2596– 2601. [DOI] [PMC free article] [PubMed] [Google Scholar]
- Dill, K.A. and Chan, H.S. 1997. From Levinthal to pathways to funnels. Nat. Struct. Biol. 4 10–19. [DOI] [PubMed] [Google Scholar]
- Dobson, C.M., S̆ali, A., and Karplus, M. 1998. Protein folding: A perspective from theory and experiment. Angew. Chem. Int. Ed. Engl. 37 868–893. [DOI] [PubMed] [Google Scholar]
- Du, R., Pande, V.S., Grosberg, A.Y., Tanaka, T., and Shakhnovich, E.I. 1998. On the transition coordinate for protein folding. J. Chem. Phys. 108 334–350. [Google Scholar]
- Ejtehadi, M.R., Avall, S.P., and Plotkin, S.S. 2004. Three-body interactions improve the prediction of rate and mechanism in protein folding models. Proc. Natl. Acad. Sci. 101 15088–15093. [DOI] [PMC free article] [PubMed] [Google Scholar]
- Faisca, P.F.N. and Ball, R.C. 2002. Topological complexity, contact order, and protein folding rates. J. Chem. Phys. 117 8587–8591. [Google Scholar]
- Ferrenberg, A.M. and Swendsen, R.H. 1989. Optimized Monte Carlo data analysis. Phys. Rev. Lett. 63 1195–1198. [DOI] [PubMed] [Google Scholar]
- Fersht, A.R. 1995. Optimization of rates of protein folding: The nucleation– condensation mechanism and its implications. Proc. Natl. Acad. Sci. 92 10869–10873. [DOI] [PMC free article] [PubMed] [Google Scholar]
- ———. 2004. Relationship of Leffler (Bronsted) φ values and protein folding φ values to position of transition-state structures on reaction coordinates. Proc. Natl. Acad. Sci. 101 14338–14342. [DOI] [PMC free article] [PubMed] [Google Scholar]
- Fersht, A.R., Matouschek, A., and Serrano, L. 1992. The folding of an enzyme. I. Theory of protein engineering analysis of stability and pathway of protein folding. J. Mol. Biol. 224 771–782. [DOI] [PubMed] [Google Scholar]
- Freed, K.F. 1987. Renormalization group theory of macromolecules. Wiley, New York, NY.
- Galzitskaya, O.V. and Finkelstein, A.V. 1999. A theoretical search for folding/unfolding nuclei in three-dimensional protein structures. Proc. Natl. Acad. Sci. 96 11299–11304. [DOI] [PMC free article] [PubMed] [Google Scholar]
- Gillespie, B. and Plaxco, K.W. 2004. Using protein folding rates to test protein folding theories. Annu. Rev. Biochem. 73 837–859. [DOI] [PubMed] [Google Scholar]
- Gong, H., Isom, D.G., Srinivasan, R., and Rose, G.D. 2003. Local secondary structure content predicts folding rates for simple, two-state proteins. J. Mol. Biol. 327 1149–1154. [DOI] [PubMed] [Google Scholar]
- Hubner, I.A., Shimada, J., and Shakhnovich, E.I. 2004. Commitment and nucleation in the protein G transition state. J. Mol. Biol. 336 745–761. [DOI] [PubMed] [Google Scholar]
- Irbäck, A. and Potthast, F. 1995. Studies of an off-lattice model for protein folding: Sequence dependence and improved sampling at finite temperature. J. Chem. Phys. 103 10298–10305. [Google Scholar]
- Itzhaki, L.S., Otzen, D.E., and Fersht, A.R. 1995. The structure of the transition state for folding of chymotrypsin inhibitor 2 analysed by protein engineering methods: Evidence for a nucleation–condensation mechanism for protein folding. J. Mol. Biol. 254 260–288. [DOI] [PubMed] [Google Scholar]
- Ivankov, D.N., Garbuzynskiy, S.O., Alm, E., Plaxco, K.W., Baker, D., and Finkelstein, A.V. 2003. Contact order revisited: Influence of protein size on the folding rate. Protein Sci. 12 2057–2062. [DOI] [PMC free article] [PubMed] [Google Scholar]
- Jackson, S.E. 1998. How do small single-domain proteins fold? Fold. Des. 3 R81–R91. [DOI] [PubMed] [Google Scholar]
- Jackson, S.E. and Fersht, A.R. 1991. Folding of chymotrypsin inhibitor 2. 1. Evidence for a two-state transition. Biochemistry 30 10428–10435. [DOI] [PubMed] [Google Scholar]
- Jewett, A.I., Pande, V.S., and Plaxco, K.W. 2003. Cooperativity, smooth energy landscapes and the origins of topology-dependent protein folding rates. J. Mol. Biol. 326 247–253. [DOI] [PubMed] [Google Scholar]
- Jones, K. and Wittung-Stafshede, P. 2003. The largest protein observed to fold by two-state kinetic mechanism does not obey contact-order correlation. J. Am. Chem. Soc. 125 9606–9607. [DOI] [PubMed] [Google Scholar]
- Karanicolas, J. and Brooks, C.L. 2003. The importance of explicit chain representation in protein folding models: An examination of Ising-like models. Proteins Struct. Funct. Genet. 53 740–747. [DOI] [PubMed] [Google Scholar]
- Kaya, H. and Chan, H.S. 2002. Towards a consistent modeling of protein thermodynamic and kinetic cooperativity: How applicable is the transition state picture to folding and unfolding? J. Mol. Biol. 315 899–909. [DOI] [PubMed] [Google Scholar]
- ———. 2003a. Solvation effects and driving forces for protein thermodynamic and kinetic cooperativity: How adequate is native-centric topological modeling? J.Mol. Biol. 326 911–931. (Corrigendum 337: 1069–1070.) [DOI] [PubMed] [Google Scholar]
- ———. 2003b. Simple two-state protein folding kinetics requires near-Levinthal thermodynamic cooperativity. Proteins Struct. Funct. Genet. 52 510–523. [DOI] [PubMed] [Google Scholar]
- ———. 2003c. Contact order dependent protein folding rates: Kinetic consequences of a cooperative interplay between favorable nonlocal interactions and local conformational preferences. Proteins Struct. Funct. Genet. 52 524–533. [DOI] [PubMed] [Google Scholar]
- ———. 2005. Explicit-chain model of native-state hydrogen exchange: Implications for event ordering and cooperativity in protein folding. Proteins Struct. Funct. Bioinform. 58 31–44. [DOI] [PubMed] [Google Scholar]
- Koga, N. and Takada, S. 2001. Roles of native topology and chain-length scaling in protein folding: A simulation study with a Gō-like model. J. Mol. Biol. 313 171–180. [DOI] [PubMed] [Google Scholar]
- Kohn, J.E., Millett, I.S., Jacob, J., Zagrovic, B., Dillon, T.M., Cingel, N., Dothager, R.S., Seifert, S., and Thiyagarajan, P., Sosnick, T.R., et al. 2004. Random-coil behavior and the dimensions of chemically unfolded proteins. Proc. Natl. Acad. Sci. 101 12491–12496. [DOI] [PMC free article] [PubMed] [Google Scholar]
- Leopold, P.E., Montal, M., and Onuchic, J.N. 1992. Protein folding funnels: A kinetic approach to the sequence–structure relationship. Proc. Natl. Acad. Sci. 89 8721–8725. [DOI] [PMC free article] [PubMed] [Google Scholar]
- Lyubartsev, A.P., Martsinovski, A.A., Shevkunov, S.V., and Vorontsov-Velyaminov, P.V. 1992. New approach to Monte Carlo calculation of the free energy: Method of expanded ensembles. J. Chem. Phys. 96 1776–1783. [Google Scholar]
- Makarov, D.E. and Metiu, H. 2002. A model for the kinetics of protein folding: Kinetic Monte Carlo simulations and analytical results. J. Chem. Phys. 116 5205–5216. [Google Scholar]
- Makarov, D.E. and Plaxco, K.W. 2003. The topomer search model: A simple, quantitative theory of two-state protein folding kinetics. Protein Sci. 12 17–26. [DOI] [PMC free article] [PubMed] [Google Scholar]
- Makarov, D.E., Keller, C.A., Plaxco, K.W., and Metiu, H. 2002. How the folding rate constant of simple, single-domain proteins depends on the number of native contacts. Proc. Natl. Acad. Sci. 99 3535–3539. [DOI] [PMC free article] [PubMed] [Google Scholar]
- Marinari, E. and Parisi, G. 1992. Simulated tempering: A new Monte Carlo scheme. Europhys. Lett. 19 451–458. [Google Scholar]
- Micheletti, C. 2003. Prediction of folding rates and transition-state placement from native-state geometry. Proteins Struct. Funct. Genet. 51 74–84. [DOI] [PubMed] [Google Scholar]
- Muñoz, V. and Eaton, W.A. 1999. A simple model for calculating the kinetics of protein folding from three-dimensional structures. Proc. Natl. Acad. Sci. 96 11311–11316. [DOI] [PMC free article] [PubMed] [Google Scholar]
- Myers, J.K. and Oas, T.G. 1999. Contribution of a buried hydrogen bond to λ repressor folding kinetics. Biochemistry 38 6761–6768. [DOI] [PubMed] [Google Scholar]
- Nanias, M., Chinchio, M., Pillardy, J., Ripoll, D.R., and Scheraga, H.A. 2003. Packing helices in proteins by global optimization of a potential energy function. Proc. Natl. Acad. Sci. 100 1706–1710. [DOI] [PMC free article] [PubMed] [Google Scholar]
- Nymeyer, H., Socci, N.D., and Onuchic, J.N. 2000. Landscape approaches for determining the ensemble of folding transition states: Success and failure hinges on the degree of frustration. Proc. Natl. Acad. Sci. 97 634–639. [DOI] [PMC free article] [PubMed] [Google Scholar]
- Ollerenshaw, J.E., Kaya, H., Chan, H.S., and Kay, L.E. 2004. Sparsely populated folding intermediates of the Fyn SH3 domain: Matching native-centric essential dynamics and experiment. Proc. Natl. Acad. Sci. 101 14748–14753. [DOI] [PMC free article] [PubMed] [Google Scholar]
- Plaxco, K.W., Simons, K.T., and Baker, D. 1998. Contact order, transition state placement and the refolding rates of single-domain proteins. J. Mol. Biol. 277 985–994. [DOI] [PubMed] [Google Scholar]
- Sanchez, I.E. and Kiefhaber, T. 2003. Origin of unusual φ-values in protein folding: Evidence against specific nucleation sites. J. Mol. Biol. 334 1077–1085. [DOI] [PubMed] [Google Scholar]
- Scalley-Kim, M. and Baker, D. 2004. Characterization of the folding energy landscapes of computer generated proteins suggests high folding free energy barriers and cooperativity may be consequences of natural selection. J. Mol. Biol. 338 573–583. [DOI] [PubMed] [Google Scholar]
- Selvaraj, S. and Gromiha, M.M. 2001. Comparison between long-range interactions and contact order in determining the folding rate of two-state proteins: Application of long-range order to folding rate prediction. J. Mol. Biol. 310 27–32. [DOI] [PubMed] [Google Scholar]
- Silow, M. and Oliveberg, M. 1997. High-energy channeling in protein folding. Biochemistry 36 7633–7637. [DOI] [PubMed] [Google Scholar]
- Sosnick, T.R. and Krantz, B.A. 2001. Engineered metal binding sites map the heterogeneous folding landscape of a coiled coil. Nat. Struct. Biol. 8 1042–1047. [DOI] [PubMed] [Google Scholar]
- Ternström, T., Mayor, U., Akke, M., and Oliveberg, M. 1999. From snapshot to movie: φ analysis of protein folding transition states taken one step further. Proc. Natl. Acad. Sci. 96 14854–14859. [DOI] [PMC free article] [PubMed] [Google Scholar]
- Thirumalai, D. and Guo, Z. 1995. Nucleation mechanism for protein folding and theoretical predictions for hydrogen-exchange labeling experiments. Biopolymers 35 137–140. [Google Scholar]
- Thirumalai, D. and Woodson, S.A. 1996. Kinetics of folding of proteins and RNA. Acc. Chem. Res. 29 433–439. [Google Scholar]
- van Nuland, N.A., Chiti, F., Taddei, N., Raugei, G., Ramponi, G., and Dobson, C.M. 1998. Slow folding of muscle acyphosphatase in the absence of intermediates. J. Mol. Biol. 283 883–891. [DOI] [PubMed] [Google Scholar]
- Vendruscolo, M., Paci, E., Dobson, C.M., and Karplus, M. 2001. Three key residues form a critical contact network in a protein folding transition state. Nature 409 641–645. [DOI] [PubMed] [Google Scholar]
- Weikl, T.R. and Dill, K.A. 2003. Folding rates and low-entropy-loss routes of two-state proteins. J. Mol. Biol. 329 585–598. [DOI] [PubMed] [Google Scholar]
- Zhou, H. and Zhou, Y. 2002. Folding rate prediction using total contact distance. Biophys. J. 82 458–463. [DOI] [PMC free article] [PubMed] [Google Scholar]
- Zwanzig, R., Szabo, A., and Bagchi, B. 1992. Levinthal’s paradox. Proc. Natl. Acad. Sci. 89 20–22. [DOI] [PMC free article] [PubMed] [Google Scholar]