Abstract
Clusters of orthologous groups [COGs; Tatusov, R. L., Koonin, E. V. & Lipman, D. J. (1997) Science 278, 631–637] were identified for a set of 13 completely sequenced herpesviruses. Each COG represented a family of gene products conserved across several herpes genomes. These families were defined without using an arbitrary threshold criterion based on sequence similarity. The COG technique was modified so that variable stringency in COG construction was possible. High stringencies identify a core set of highly conserved genes. Varying COG stringency reveals differences in the degree of conservation between functional classes of genes. The COG data were used to construct whole-genome phylogenetic trees based on gene content. These trees agree well with trees based on other methods and are robust when tested by bootstrap analysis. The COG data also were used to construct a reciprocal tree that clustered genes with similar phylogenetic profiles. This clustering may give clues to genes with related functions or with related histories of acquisition and loss during herpesvirus evolution.
The value of the genome sequencing projects will be determined by how the resulting mass of sequence data are analyzed. To address this need, several new techniques have been pioneered to make predictions about gene products based on their sequences. These include methods to predict protein tertiary structure (1, 2) and protein–protein interactions (3). One important technique was designed to identify families of functionally related proteins by identifying clusters of orthologous groups (COGs) (4–6).
Whole-genome phylogeny has been called one of the major open problems of comparative genomics (7). Phylogenies often have been based on trees constructed from the aligned sequence of a common protein or RNA. Unfortunately, the results for cellular genomes are rarely uniform over all of the genes conserved between the respective genomes. Additionally, this method by necessity ignores genes that are only partially conserved. Another method, which has been used with viral genomes, is to take the set of conserved genes and construct a phylogeny based on their genomic organization (8). Unfortunately, this technique only works for very closely related genomes and again only takes into account the conserved genes.
This paper uses herpesviruses as an alternative to cellular genomes for expanding on the COG technique and for applying it to the problem of whole-genome phylogeny. Herpesviruses were chosen for several reasons: They have relatively large genomes for viruses and therefore provide a rich data set to mine. They are well studied with a large percentage of identified or partially identified genes. They are very divergent in many aspects, but, like cellular organisms, are known to have a conserved core of genes that encode many of the required functions of the virus life cycle including DNA polymerase, major capsid protein, and helicase/primase complex. This research expands on the construction algorithm for COGs, to enhance their utility. We also demonstrate the efficacy of the COG technique by constructing gene content phylogenetic trees from the COG data. Phylogenetic profiles of herpesvirus genes also were constructed from the COG data and were organized on a tree.
As Tatusov et al. (4) originally designed it, the COG technique functioned to identify families of genes conserved between members of a set of completely sequenced genomes. Every protein sequence from each genome was compared with those from the other genomes. In each case, the most similar sequence in each of the other genomes was identified. This pairing of gene product to gene product across genomes was called a best hit (BeT) and was not based on a threshold value for sequence similarity or a statistical cutoff. Each gene product would have n-1 BeTs, where n is the number of genomes in the set. There is a good chance that a BeT represents an ortholog, especially if the two genes come from similar organisms. However, this is not always the case even when such an ortholog exists. This fact adds noise to any attempt to completely identify all of the ortholgous groups between genomes. This noise can be reduced by identifying COGs, which are defined by a particular type of pattern in the BeTs.
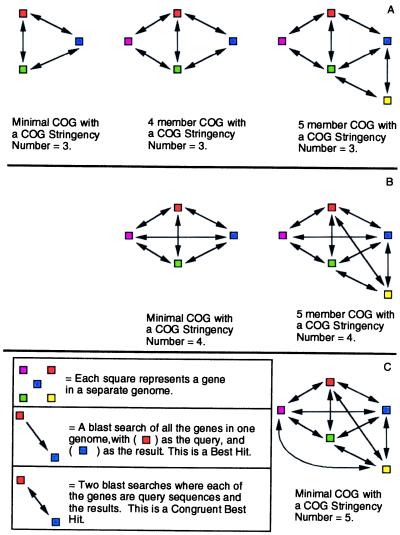
If protein A from genome 1 has a BeT relationship with protein B from genome 2, and in turn gene B has a BeT back to A, it is called a congruent BeT. Three congruent BeTs between three different gene products from different genomes form a triangle, the minimal COG. Triangles with sides in common would be merged to form larger groups potentially with more than one sequence from the same genome (Fig. 1A). Members would later be added to the COG based on noncongruent BeTs to at least two established members of the COG.
Figure 1.
How the CSN functions to increase the rigor of the test for addition of new members to a COG as well as construction of minimal COGs. (A) COGs as constructed in ref. 4 by merging of triangles with common sides (CSN = 3). (B) A similar set of COGs (CSN = 4) as in A, but in each case one more congruent BeT is required for construction of each minimal COG and for addition of members (in this case by merging of tetrahedrons with common faces). (C) Shown is the minimal COG at CSN = 5.
Methods
Herpesvirus Sequences.
Thirteen completely sequenced herpesviruses were used (Table 1). A gene list was obtained for each of 13 herpesviruses based on the annotation of its GenBank file. Each protein fragment from polyproteins was treated as a separate gene product, as was the uncleaved polyprotein.
Table 1.
Viruses, abbreviations, and accession numbers
| Virus name | Abbrev. | Accession |
|---|---|---|
| Epstein-Barr virus | EBV | V01555 |
| Equine herpesvirus 1 | EHV1 | M86664 |
| Equine herpesvirus 2 | EHV2 | U20824 |
| Equine herpesvirus 4 | EHV4 | AF030027 |
| Herpes simplex virus1 | HSV1 | X14112 |
| Herpes simplex virus2 strain H652 | HSV2 | Z86099 |
| Human cytomegalovirus strain AD169 | HCMV | X17403 |
| Human herpesvirus 6 variant A | HHV6 | X83413 |
| Human herpesvirus 7 JI | HHV7 | U43400 |
| Ictalurid herpesvirus (channel catfish virus) | IHV | M75136 |
| Murine herpesvirus 68 strain WUMS | MHV68 | U97553 |
| Saimiriine herpesvirus 2 | HVS2 | X64346 |
| Varicella-Zoster virus | VZV | X04370 |
Computational Analysis.
In this research a separate database was constructed from the gene products of each genome. A BeT was identified via blastp search with the EXP parameter equal to 1,000, reporting back only the highest scoring database match. For example, suppose that we performed a blastp search with protein A from genome 1 as the query, against a library of gene products from genome 2, and the result was protein B. We then would conclude that protein A from genome 1 has a BeT relationship with protein B from genome 2.
Interpretation of GenBank files was done by Perl scripts written for that purpose, as was the construction of blastp search results into congruent BeTs. A series of Perl scripts were written to construct the COGs and the binary sequence files used for phylogenetic analysis (see Results). blastp searches and other sequence manipulation was done with Wisconsin Package Version 10.0, Genetics Computer Group (GCG). Tree construction was performed with paup*, Phylogenetic Analysis Using Parsimony (*and Other Methods) Version 4.0b by D. L. Swofford. All neighbor-joining analysis was performed with standard distances set to mean character difference and with systematic (taxon order-dependent) tie breaking. One hundred bootstrap replicates were run for the gene content tree. During bootstrap analysis the search type was heuristic, and groups were retained with a frequency of >50%. Parsimony analysis was performed with the “keep best trees only” option set and the tbr branch swapping algorithm. The parsimony start tree was selected by simple stepwise addition. Tree visualization was performed with the program treeview (9) and paup. The reciprocal tree was constructed via the upgma algorithm in paup, with systematic tie breaking.
Fake Genome.
Other modifications were made to the COG generation algorithm. As an analytical tool to test the validity of the individual COGs, a “fake genome” database containing 20 gene products was created. Each fake gene product was a sequence of 200 identical residues of one of the amino acids. This was done to detect illegitimate COGs based on unusual amino acid composition rather than on sequence similarity resulting from homology.
Results
We proposed several enhancements to the COG technique, adapted it for use on virus genomes, and expanded on its usefulness for determining phylogenetic relationships by creating whole-genome phylogenetic trees based on gene content. We also produced a reciprocal tree that groups together COGs that have similar patterns of presence or absence in the various herpesvirus genomes.
COG Construction: COG Stringency Number (CSN).
One of the most important modifications was the addition of variable CSN. In Tatusov et al. (4), triangles were constructed from congruent BeTs. This created COGs with a CSN of 3, based on the merging of triangles with common sides (Fig. 1A). A tetrahedron consisting of four gene products from separate genomes with congruent BeTs to each other forms the basis for a COG with a CSN of 4. Larger COGs with CSN = 4 are formed by merging tetrahedrons with common faces (Fig. 1B). Similarly, COGs of higher CSN result from the merging of higher-order constructs. The minimal COG for CSN = 5 is diagrammed in Fig. 1C. The CSN can be increased up to the number of genomes in the set. Increasing the CSN increases the stringency of the test for adding a new member to a COG (Fig. 1). Each member of a COG must have CSN-1 congruent BeTs with other members. Higher CSNs are especially important for use in small genomes, such as those of viruses, because the chance of an erroneous congruent BeT, resulting from chance sequence similarity rather than homology, increases dramatically if there are few genes in each genome.
In Tatusov et al. (4) COGs were identified by merging triangles until no further COGs could be merged, and then members from noncongruent BeTs were added. We merged triangles, tetrahedrons, or higher-order constructs (depending on CSN) until no more could be merged. Then, before noncongruent members were added, all gene products with CSN-1 congruent BeTs to existing members were added, even if they did not happen to be inside a tetrahedron, or relevant construct, with existing members. This, iteratively, led to another round of merging and addition until all members had been added. Finally, noncongruent members were added if they had noncongruent BeTs to CSN-1 congruent members. The members of a COG based solely on congruent BeTs were called the COG core, and the members based on noncongruent BeTs were called additional members. Unlike in Tatusov et al. (4), no effort was made to ensure that each COG had a member from a distant lineage. Additional members were not observed for most COGs with a CSN greater than 5. A complete list of the COGs and the genes in them is available as supplemental data on the PNAS web site, www.pnas.org.
High Stringency Identifies a Highly Conserved Core of Genes.
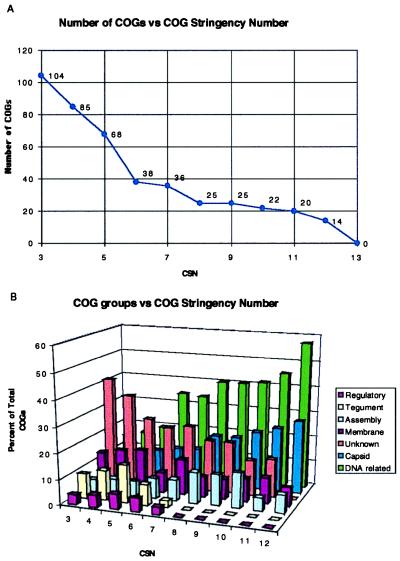
For 13 completely sequenced herpesviruses, all COGs with a CSN from 3 to 13 were identified. There were 104 COGs identified at CSN = 3. As the CSN was increased, the number of retained COGs diminished (Fig. 2A). No COGs remained at CSN = 13 because one of the virus genomes was ictalurid herpesvirus, which is very distantly related to other herpesviruses if at all (10). This result confirmed that there is a core of about 25 genes that are present in all herpesviruses (8). This set of conserved herpes products that is retained, even at high CSNs, is composed mainly of DNA and capsid-related proteins (Fig. 2B). Thus, increasing CSN provides an automatable way of identifying the most highly conserved genes in a set of related genomes.
Figure 2.
The set of herpes COGs vs. CSN. (A) As the stringency for creation of minimal COGs increases the number of COGs observed decreases. (B) The COGs at each CSN were divided into seven broad functional classes and plotted in terms of percent of the COGs that exist at each CSN 3–12. For example, DNA-related genes comprise 57% of the 14 COGs that exist at CSN = 12.
Increasing CSN Illuminates Relationships Between COG Members.
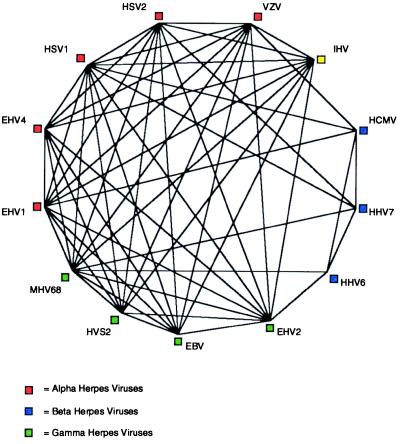
Another useful feature of variable CSNs can be seen in the conserved herpes protein dUTPase (Fig. 3). At CSN = 4, all of the viruses are represented in the dUTPase COG, but at CSN = 5, the beta herpesviruses are no longer represented. The dUTPases of the beta herpesviruses are known to be divergent from that of the alpha and gamma herpesviruses (11). Even though the BeTs are identified independently of absolute sequence similarity, the chances of a BeT being directed to a member of a COG increase with sequence similarity. Therefore retention within a COG, as CSN increases, reveals important details concerning the relationships between members of the COG.
Figure 3.
The dUTPase COG at CSN = 4. Each of the 13 herpesviruses has a member in the dUTPase COG at CSN = 4. The HCMV and HHV7 members are connected to the rest of the COG by virtue of the minimum number of congruent BeTs to non-beta genes, and the HHV6 dUTPase is only a member at CSN = 4 because of their presence. As a result, when the CSN increases to 5, the beta herpesvirus members drop out of the COG. This mirrors and is caused by a known divergence in beta herpesvirus dUTPases. See Table 1 for definitions of virus abbreviations.
Members of the fake genome were observed in eight of the 104 COGs at CSN = 3. Of those eight COGs, three are artifacts that either break up into smaller legitimate COGs at CSN > 3 or are not retained at CSN > 3. The other five do not retain their fake genome members as CSN increases. The presence of a gene from the fake genome, when it occurred, typically did not indicate that a COG was illegitimate, but merely composed of proteins rich in a specific amino acid.
Gene Content Tree.
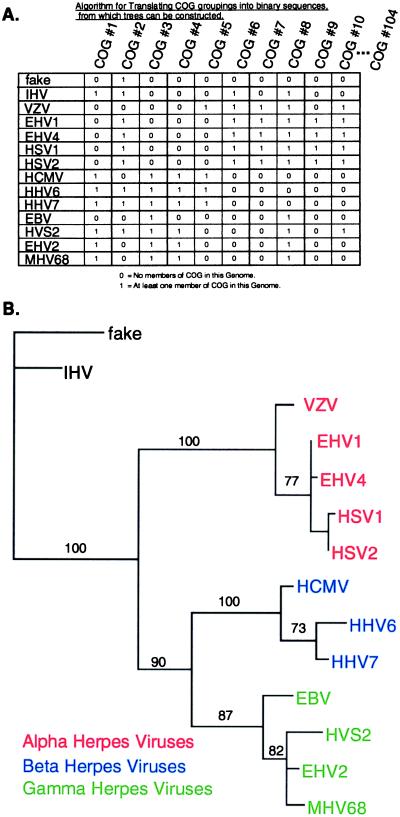
With the COG technique it is possible to construct phylogenetic trees from the gene content of the genomes alone, by viewing COG memberships as genetic traits. To each herpesvirus genome, for each COG, a one or a zero was assigned. One signified that the genome had at least one member in the relevant COG, and zero signified no members. The resulting COG membership data matrix is illustrated in Fig. 4A. Each row of this matrix is a binary sequence describing the COG content of one of the genomes, with a length equal to the total number of COGs (length = 104 for CSN = 3). The order of COGs in the sequences is arbitrary, but the same for all of the genomes (Fig. 4A). These aligned binary sequences then were analyzed with the neighbor-joining method (Fig. 4B). The method of maximum parsimony produced a very similar tree. All nodes in common between the two trees are strongly supported by bootstrap analysis, and bootstrap numbers are given only for those nodes (Fig. 4B). This method is similar to the method described by Fitz-Gibbon and House (12), except each gene family is defined by membership within a COG. [Fitz-Gibbon and House (12) used fasta3-defined BeTs with a preset z-score cutoff between 140 and 2,000 to define their gene families.]
Figure 4.
Whole-genome phylogenetic tree based on gene content. (A) Illustrated is a portion of the COG data matrix for COGs 1–10 with CSN = 3. Rows represent the sequences used for deducing whole-genome gene content trees. The rows are arranged to facilitate visual comparison with the tree shown in B. Columns are the sequences used for deriving the reciprocal gene history tree. (B) Whole-genome neighbor-joining tree based on gene content data from COGs at CSN = 3. A topologically similar tree was constructed by the method of maximum parsimony. Bootstrap numbers are displayed for all nodes in common with the parsimony tree. See Table 1 for definitions of virus abbreviations.
The fake genome was included in this tree even though it is unrelated to herpesviruses. The tree topology does not change when the fake genome is removed and the analysis repeated.
A separate tree was produced for the COGs at each value of CSN from 3 to 13. It was found that the tree had the same topology shown in Fig. 4B (CSN = 3) for CSNs 3–7. At CSN = 8 and above, the distinctions between alpha, beta, and gamma herpesviruses were lost because all of the genes at or above that CSN are highly conserved.
Reciprocal Tree.
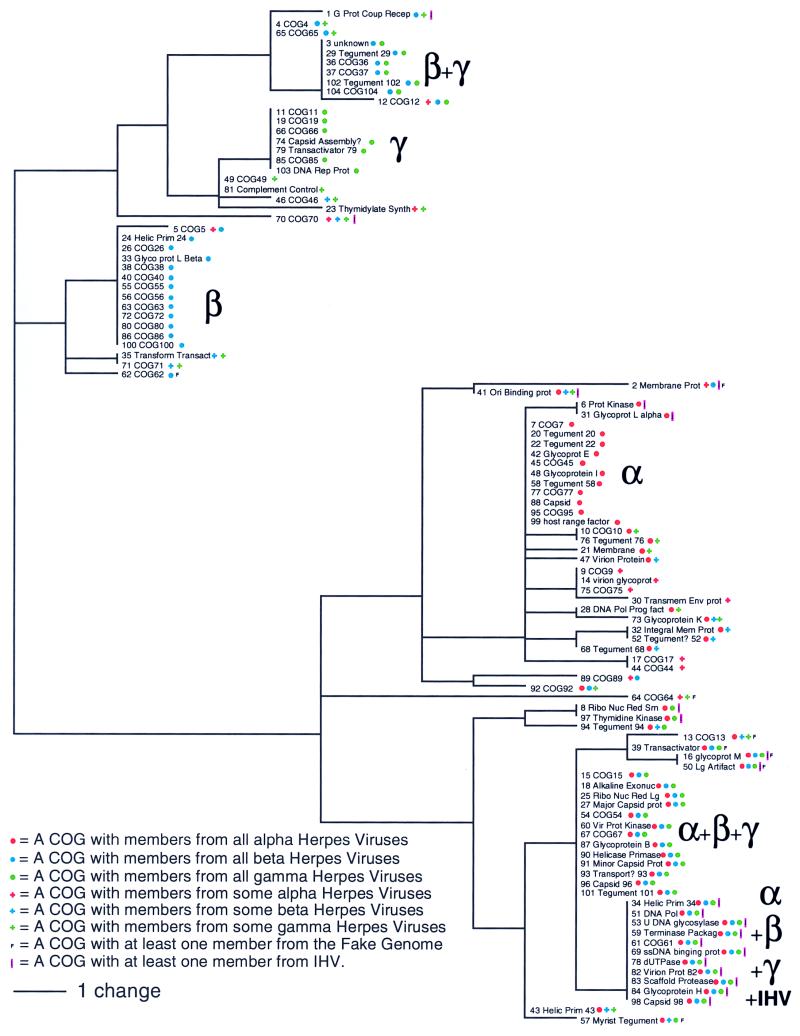
Each column in the COG data matrix (see Fig. 4A) is a binary sequence that describes the distribution of members of a particular COG among the herpesvirus genomes. These aligned sequences, termed phylogenetic profiles, can be used to derive a reciprocal tree that clusters the COGs rather than the genomes. We performed a clustering analysis of the phylogenetic profiles of the 104 COGs at CSN = 3 by the upgma method (Fig. 5). Genes conserved across all herpesviruses can be seen in the lower right corner. Directly above them are genes that are conserved across all herpesviruses except ictalurid herpesvirus. Alpha, beta, and gamma herpes all have between six and 13 COGs that have members across all of their genomes but not in any other genomes. Also there is a population of six COGs (near the top of Fig. 5) that have members in all beta and gamma herpesviruses, but no alpha herpesviruses.
Figure 5.
Reciprocal tree shows a clustering of the phylogenetic profiles of the 104 herpesvirus COGs at CSN = 3. Only the core members of each COG were used in this analysis. The number at the left of each COG description is a tracking number for the COG. Functional descriptions for the COGs were produced by visually inspecting the list of genes in each COG and their GenBank annotation. A listing of COG members can be seen in supplemental data posted on the PNAS web site at www.pnas.org.
Discussion
COGs provide a powerful tool for defining gene families in completely sequenced genomes. The work reported here shows that the method is useful for viral as well as cellular genomes. The concept of CSNs enhances the method and makes it useful even for genomes with fewer than 10 genes (results not shown). We have shown that COG membership is a useful phylogenetic trait for probing the evolutionary history of genomes and for analyzing the phylogenetic profiles of the genes that comprise them. This was done by producing a gene content tree for the herpesvirus genomes and a reciprocal phylogenetic profile tree for the genes that comprise them.
Gene Content Tree.
Unlike other tree building techniques, this technique takes into account genomewide conservation patterns, especially those of gene products that are not universally conserved. Gene products that are conserved across all genomes translate into a column of ones in the data matrix and thus are not informative. All differentiation is based on partially conserved genes. Because this technique creates a binary sequence for each genome, it is possible to use all of the phylogenetic sequence analysis tools that are available, such as maximum parsimony and bootstrap. The production of gene content trees is computationally tractable even for the large cellular genomes.
The organization of gene products in the genomes, or in the binary sequences, does not affect the resulting gene content tree. It is therefore interesting that a tree of herpesviruses has been constructed based entirely on gene arrangements (8). That method successfully segregates alpha, beta, and gamma herpesviruses and agrees with the root placement in Fig. 4B. The tree was deduced from the most parsimonious history of rearrangements that could account for differences in the order of the conserved core genes of the herpesviruses. The division (alpha, beta, and gamma) of the herpesvirus family originally was based on biological properties and only later on sequence alignments. Our gene content tree agrees with the tree based on the inferred history of genome rearrangements, classification of the herpesviruses based on biological properties, and sequence alignment trees for individual genes. This argues strongly for the validity of gene content trees for deducing evolutionary history from whole genome sequences.
Gene content trees have been constructed for cellular genomes by several groups (12–14). In each case they identified a BeT by using a statistical cutoff, instead of a COG algorithm, to filter noise from their results. Their results were consistent with the phylogenies based on the 16s rRNA alignments, but were far more robust as measured by bootstrap analysis (12). Because of the lack of arbitrary statistical cutoffs we believe that the COG technique is both more sensitive and more stringent. We therefore believe that COG-based gene content trees will be valuable for the analysis of cellular genomes.
In view of evidence for lateral gene transfer events during cellular evolution, the validity of the concept of whole-genome phylogenetic trees has been drawn into question (15). It is therefore interesting to consider the effect of such events on gene content trees. Each node in the gene content tree represents an ancestral organism that has gained or lost genes compared with its preceding ancestral node. If gene acquisition occurred by lateral transfer from some other lineage represented in the tree, then the event introduced discordant phylogenetic data into the analysis. Gene loss or gene transfer from lineages not included in the tree are phylogenetically informative, but do not introduce discordancy. We assume that each lateral gene transfer event contributes a small fraction of genes to the resulting genome. Under this assumption we can define the ancestor of an organism resulting from a lateral transfer event as the organism that contributed the majority of the resulting genome. With this assumption and definition it seems reasonable to conclude that the gene content tree approximates the actual history of speciation based on gene acquisition and loss. In the present study, lateral gene transfer from the host, or from other viruses not closely related to herpesviruses, would not introduce discordant phylogenetic data.
Reciprocal Tree of COG Phylogenetic Profiles.
The reciprocal tree clusters COGs with similar patterns of distribution among the herpesvirus genomes. Genes with similar histories of acquisition and loss would be expected to cluster on this tree, but there are other possible reasons for clustering. For example, the cluster specific to alpha herpesviruses might include genes that have been acquired and also ones that have been lost during evolution from the common ancestor of all herpesviruses.
Using different methods, it has been noted that genes with similar phylogenetic profiles tend to have related functions (16). The grouping of COGs of unknown function in the reciprocal tree (Fig. 5) may be useful in generating hypotheses concerning their roles. For example, we speculate that the beta-specific COGs clustered in the upper left of Fig. 5 may determine the cell-type specificity of the latent state of beta herpesviruses. Interestingly, this cluster contains about one-fourth of the COGs of unknown function.
Although it is built from phylogenetic data, the reciprocal tree does not have any straightforward phylogenetic interpretation of which we are aware. The clustering of genes on the reciprocal tree may, however, give clues to groups of genes that have related evolutionary histories or related functions. The reciprocal tree may, for example, be helpful in identifying genes involved in lateral transfer events.
Supplementary Material
Acknowledgments
We thank Dr. David A. Fenstermacher of the University of North Carolina-Chapel Hill Center for Bioinformatics for help and advice with the GCG package. We also thank Michael Mears and John Wrobel for helpful discussions and Jonathan Eisen for helpful comments. This work was supported in part by National Institutes of Health Grant GM21313.
Abbreviations
- COG
cluster of orthologous groups
- CSN
COG stringency number
- BeT
best hit
References
- 1.Przytycka T, Aurora R, Rose G D. Nat Struct Biol. 1999;6:672–682. doi: 10.1038/10728. [DOI] [PubMed] [Google Scholar]
- 2.Fisher D, Eisenberg D. Proc Natl Acad Sci USA. 1997;94:11929–11934. doi: 10.1073/pnas.94.22.11929. [DOI] [PMC free article] [PubMed] [Google Scholar]
- 3.Marcotte E M, Pellegrini M, Ng H-L, Rice D W, Yeates T O, Eisenberg D. Science. 1999;285:751–753. doi: 10.1126/science.285.5428.751. [DOI] [PubMed] [Google Scholar]
- 4.Tatusov R L, Koonin E V, Lipman D J. Science. 1997;278:631–637. doi: 10.1126/science.278.5338.631. [DOI] [PubMed] [Google Scholar]
- 5.Koonin E V, Tatusov R L, Galperin M Y. Curr Opin Struct Biol. 1998;8:355–363. doi: 10.1016/s0959-440x(98)80070-5. [DOI] [PubMed] [Google Scholar]
- 6.Makarova K S, Aravind L, Galperin M Y, Grishin N V, Tatusov R L, Wolf Y, Koonin E V. Genome Res. 1999;9:608–628. [PubMed] [Google Scholar]
- 7.Koonin E V. Bioinformatics. 1999;15:265–266. doi: 10.1093/bioinformatics/15.4.265. [DOI] [PubMed] [Google Scholar]
- 8.Hannenhalli S, Chappey C, Koonin E V, Pevzner P A. Genomics. 1995;30:299–311. doi: 10.1006/geno.1995.9873. [DOI] [PubMed] [Google Scholar]
- 9.Page R D M. Comput Appl Biosci. 1996;12:357–358. doi: 10.1093/bioinformatics/12.4.357. [DOI] [PubMed] [Google Scholar]
- 10.Davidson A J. Virology. 1992;186:9–14. doi: 10.1016/0042-6822(92)90056-u. [DOI] [PubMed] [Google Scholar]
- 11.Gompels U A, Nicholas J, Lawrence G, Jones M, Thompson B J, Martin M E D, Efstathiou S, Craxton M, Macaulay H A. Virology. 1995;209:29–51. doi: 10.1006/viro.1995.1228. [DOI] [PubMed] [Google Scholar]
- 12.Fitz-Gibbon S T, House C H. Nucleic Acids Res. 1999;27:4218–4222. doi: 10.1093/nar/27.21.4218. [DOI] [PMC free article] [PubMed] [Google Scholar]
- 13.Snel B, Bork P, Huynen M, A. Nat Genet. 1999;21:108–110. doi: 10.1038/5052. [DOI] [PubMed] [Google Scholar]
- 14.Tekaia F, Lazcano A, Dujon B. Genome Res. 1999;9:550–557. [PMC free article] [PubMed] [Google Scholar]
- 15.Doolittle W F. Science. 1999;284:2124–2129. doi: 10.1126/science.284.5423.2124. [DOI] [PubMed] [Google Scholar]
- 16.Pellegrini M, Marcotte E M, Thompson M J, Eisenberg D, Yeates T O. Proc Natl Acad Sci USA. 1999;96:4285–4288. doi: 10.1073/pnas.96.8.4285. [DOI] [PMC free article] [PubMed] [Google Scholar]
Associated Data
This section collects any data citations, data availability statements, or supplementary materials included in this article.


