Abstract
Protein synthesis translates information from messenger RNAs into functional proteomes. Because of the finite nature of the resources required by the translational machinery, both the overall protein synthesis activity of a cell and activity on individual mRNAs are controlled by the allocation of limiting resources. Upon introduction of heterologous sequences into an organism—for example for the purposes of bioprocessing or synthetic biology—limiting resources may also become overstretched, thus negatively affecting both endogenous and heterologous gene expression. In this study, we present a mean-field model of translation in Saccharomyces cerevisiae for the investigation of two particular translational resources, namely ribosomes and aminoacylated tRNAs. We firstly use comparisons of experiments with heterologous sequences and simulations of the same conditions to calibrate our model, and then analyse the behaviour of the translational system in yeast upon introduction of different types of heterologous sequences. Our main findings are that: competition for ribosomes, rather than tRNAs, limits global translation in this organism; that tRNA aminoacylation levels exert, at most, weak control over translational activity; and that decoding speeds and codon adaptation exert strong control over local (mRNA specific) translation rates.
INTRODUCTION
The expression of heterologous recombinant genes is a desired goal in many areas of biology. These include reporter gene-mediated measurements of cellular activities, the introduction of novel biochemical activities for synthetic biology applications, and the high-level over-expression of proteins for subsequent purification and formulation of bio-pharmaceuticals.
In all of these cases, resources required for translating the recombinant mRNA must be reallocated from their normal destination; i.e. translation of the regular cellular complement of gene products. Depending on the expression levels of the heterologous product, competition between endogenous and heterologous gene expression pathways can therefore greatly affect the quality and quantity of both recombinant and endogenous gene products. Aspects of this problem have been treated before: for example, it was demonstrated analytically that over-expression of heterologous proteins may lead to significant sequestration of rare tRNAs (1).
In more general terms, different endogenous mRNA species may similarly be regarded as competing for limited resources. The question of how resources of the translational system are allocated to different sequences, and which particular resources limit the overall capacity of the system, is thus important for understanding how translation was shaped and optimized during evolution, and how this optimization is affected when naturally occurring systems are altered for the purposes of bio-processing or synthetic biology.
A problem in quantifying the effect of resource competition lies in the complexity of the translational machinery. Changes in the availability of translation factors, tRNAs, ribosomes, etc., affect many different points in the translational system in a non-linear fashion: for example, withdrawal of a tRNA species will impair decoding of its cognate codon, but may positively affect decoding of codons for which it is near-cognate (2).
There have been significant recent advances in the use of computational approaches for studying translation. Models of translation now exist on genome-wide scales, mainly parameterized for bacterial systems (3–5). Such models would, in principle, allow us to examine how translation resources are allocated to different sequences. However, existing models still rely on overly simplified descriptions of the tRNA system, which are assumed to be always 100% charged. Because a translation elongation cycle generates deacylated tRNAs that need to be re-acylated before they are available for the next cycle, this may not be realistic. Similar considerations apply to the representation of ribosomes that are assumed to be present in unlimited supply in many models.
In the current study, we develop a computational model that can be used to assess the effect of competition for ribosomes and tRNAs on both endogenous and heterologous gene expression in Saccharomyces cerevisiae. Important hallmarks of our model include a mean-field approach to describe the endogenous yeast translation system. In this case this means that we consider an ‘average’ mRNA sequence instead of explicitly representing the species diversity that characterizes the mRNA population in vivo. The mean-field mRNA is matched like-for-like to the best available information on ribosome activity and tRNA usage patterns in real yeast cells. Our model allows us, for the first time, to consider a tRNA re-charging step as part of translational activity. Furthermore, the model also features an updated definition of near-cognate tRNAs compared to earlier models. We quantitatively validate our model by comparison to published and newly generated experimental data. We then use the model to explore the effect of heterologous gene expression on the overall translational system of S. cerevisiae.
METHODS
Modelling
The model represents translation as a set of chemical equations parameterized for S. cerevisiae. Simulations are based on a custom implementation of the SSA-CR algorithm (6), which is an efficient variant of the better known Gillespie SSA (7). The program files can be downloaded from our web-server (ftp://ftp.cs.kent.ac.uk/pub/djb/algo.tgz).
In the context of this study, we were interested in analysing the competition between the cellular ‘background’ translational activity and additionally introduced genes. We reduced computational cost of the model by adopting a mean-field approach for describing translational activity on endogenous genes, which accurately captures the overall behaviour and resource consumption of the system, while neglecting the finer details such as allocation of resources to individual mRNA species.
The translational system of yeast is approximated by a single mRNA species. The codon composition of this single mRNA is calculated as the average codon composition of all endogenous yeast genes, weighted over available data on their gene expression levels (8). The resulting mRNA is 799 codons long, its composition and sequence are given in the Supplementary Data (Supplementary File S1).
Our model represents the average mRNA as a string of codons in the following form:
Here  abbreviates the codon AAA,
  stands for AAC and so on. This means that the superscript i indicates the codon and the subscript distinguishes between different copies of this codon on the average mRNA; ni stands for the number of occurrences of the codon of type i on the average mRNA sequence.
Within the model, three types of reaction are possible:
Cognate tRNA binding to the ribosome.
Near-cognate tRNA binding to the ribosome.
tRNA re-charging.
Cognate tRNA binding is followed by the release of a de-acylated tRNA and translocation of the ribosome to the next codon. We assume essentially instantaneous translocation, which is a simplification that tends to overestimate the ribosome processing rate. This effect is small (as we confirmed in independent simulations). However, avoiding it entails a significant penalty in terms of simulation time. Cognate tRNA binding is represented as follows:
Here ‘aa-tRNA’ stands for an aminoacylated cognate tRNA, and ‘tRNA’ for an unloaded one. The pseudo first-order rate constant for this reaction is calculated from the known biochemical rate constants for codon decoding (2). If, in the above reaction scheme, the i = nj, then the reaction becomes instead:
i.e. the ribosome moves to the first codon of the next type.
If we now use ‘aa-tRNA’ for any aminoacylated tRNA from the near cognate set, then near-cognate binding is described by the following reversible reaction:
Here, Xj,i is a place-holder representing the aa-tRNA-ribosome complex. In order to ensure that the dynamics of the model is correct, in the sense that they represent the walk of the ribosome from one codon to the next in a modelling framework that only allows perfect mixing, it is necessary that this place-holder is specific to a particular codon. In practice this means that each complex is represented as its own chemical pseudo-species. Here this is indicated by the indices j and i that uniquely identify the place-holder species as belonging to the complex formed at the i-th copy of the j-th codon on the average mRNA. Note that what is represented here as Xj,i is in reality a whole sequence of possible states of the ribosome–mRNA compound. The transition rates between these individual steps are known (2), but within our framework there is nothing to be gained from modelling these explicitly; all we are interested in is the time the near cognate occupies the ribosomal binding site, preventing the cognate from binding. If we neglect the probability of a misread error occurring, then this is modelled by the above reaction with a forward rate of 140 and a reverse rate of 25.5; this latter value was calculated based on the parameters given by Fluitt et al. (2).
There is a further reaction to represent the re-charging reaction from tRNA to aa-tRNA given by:
The rate of this reaction, ai, depends on the tRNA species and is given in Supplementary Data S3.
Gillespie-type stochastic simulation algorithms assume perfect mixing of all molecules, and cannot directly represent spatial structures such as linear sequences of codons. We must therefore represent sequences indirectly, which can be achieved by having each codon  as a separate molecular species. At any time the total number of ribosomes at position
  is represented by the cardinality of the number of ‘particles’ of type
  . The model thus does not distinguish whether two ribosomes are on the same mRNA strand or on separate ones, i.e. the mRNA number in the cell is not explicitly defined. The sum
  is best interpreted as the number of ribosomes; in the present implementation this was chosen to be close to the experimentally measured value of 200 000 (9).
DNA constructs and strains
Dual luciferase expression constructs were cloned into a bidirectional yeast expression vector as follows. The bidirectional promoter/transcription terminator cassette pBEVY-U (10) was amplified by PCR and cloned as XhoI/NotI restriction fragment into the centromeric vector pRS316 (11), yielding pTH644. DNA encoding the Renilla luciferase gene was amplified from pDB688 (12), and cloned as an XmaI/EcoRI fragment into pTH644, thus placing expression of the Renilla luciferase under control of the ADH1 promoter. The resulting plasmid was designated pTH645. The wild-type firefly luciferase gene was then PCR-amplified from pDB688 and inserted into pTH645 as a BamHI/SalI fragment, yielding pTH650. This construct is referred to as the standard firefly luciferase construct (StaFLuc) throughout the rest of the manuscript.
In order to make versions of this plasmid with altered FLuc codon composition, we designed DNA sequences in which each codon from the StaFLuc sequence had been replaced by the isoaccepting codon with the highest (MaxFLuc) or lowest (MinFLuc) cognate tRNA gene copy number. These DNA sequences were synthesized by GenScript USA Inc. (Piscataway, NJ, USA), and cloned as BamHI/SalI fragments into pTH645 to yield pTH651 (MinFLuc) and pTH652 (MaxFLuc), respectively.
In order to generate a plasmid expressing all five essential single-gene encoded tRNAs in yeast, we amplified the respective genes plus 100 nucleotide DNA portions upstream and downstream via PCR. The five tDNA genes were then sequentially cloned into pRS315 (11). In detail, the respective genes are tQ(CUG)M (cloned as HindIII fragment), tS(CGA)C (cloned as SpeI fragment), tR(CCG)J (cloned as SalI fragment), tT(CGU)K (cloned as BamHI fragment), and tL(GAG)G (cloned as EclXI fragment). The resulting plasmid was designated pTH490.
All yeast strains used in thus study were derivatives of BY4741 (haploid) or BY4743 (diploid) (13). Gene deletions were obtained from Thermo Fisher Scientific/Open Biosystems (Huntsville, AL, USA).
DNA constructs were introduced into yeast using standard lithium acetate-based DNA transformation methods (14). All physical DNA constructs used in this study have been deposited with the Addgene plasmid repository (http://www.addgene.com).
Other experimental procedures
Luciferase assays were conducted and evaluated as previously described in (15). Protein expression and western blots were conducted as described in (16).
RESULTS
With a computational model as described in the ‘Materials and Methods’ section in place, we required knowledge of cognate and near-cognate tRNA abundances for each codon, as well as rate-constants for the tRNA re-charging steps. The derivation of these parameters is explained in the following sections.
Identification of near-cognate tRNA species
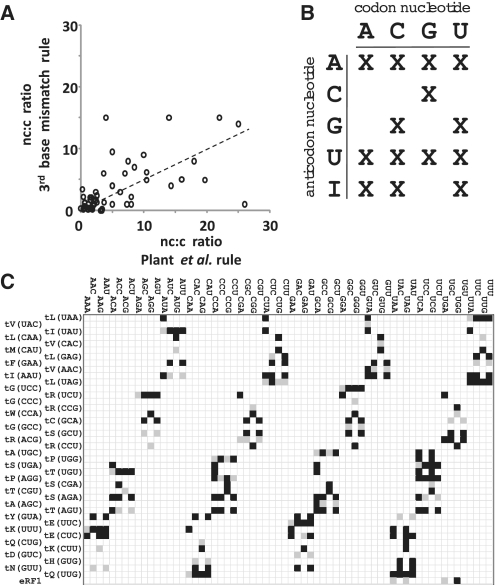
The nature and abundance of individual tRNA species can be estimated from the known yeast tRNA genes (17), the individual gene copy numbers which are proportional to tRNA expression levels (18), and a total cellular tRNA population of 3 × 10⁶ (19). In order to assign near-cognate tRNA levels, existing modelling studies use a ‘third-base mismatch’ rule (2,4), where a near-cognate tRNA is defined as any tRNA which can establish Watson–Crick base pairs with the first two nucleotides of the codon while not being cognate for that codon.
This definition of near-cognate tRNAs has recently been challenged (20), based on experimental identification of near-cognate tRNAs that do not follow this rule. Instead, this study proposes a more complex set of rules that is based around the ability of tRNAs to establish transient three-nucleotide base pairs with the codon, which require canonical Watson–Crick base pairs only in the central nucleotide.
It is possible to interpret these rules with respect to all possible cognate/near-cognate combinations of the yeast system (Figure 1). The resulting near-cognate:cognate tRNA ratios differ significantly from those following the third-base mismatch rule (Figure 1A), with the average ratio about 2-fold higher for the new set. The resulting near-cognate tRNA set is shown in Figure 1C, and is used to calculate near-cognate tRNA abundances for the simulations.
Figure 1.
Definition of the near-cognate tRNA system in S. cerevisiae. (A) Comparison of near-cognate:cognate (nc:c) ratios for individual codons as defined by the ‘third base mismatch’ rule, or by the rule proposed in ref. (20). (B) Base-pairing rules for nucleotides one and three that were used to establish near-cognate relationships. (C) The relationship between codons and decoding tRNAs in the yeast system. Cognate tRNAs are indicated in grey, near-cognate tRNAs are indicated in black.
tRNA re-charging-steps
tRNA synthesis is a complex reaction involving three co-substrates (ATP, amino acid, and tRNA). While some biochemical parameters are available for many tRNAs, there are few synthetases for which all three possible KM values have been determined. We therefore made the simplifying assumption that the assembly of the quaternary complex was fast compared to the catalysis of the aminoacylation reaction, and that tRNA synthesis rates depended largely on the kcat of the respective synthetase. Indeed, at reported intra-cellular concentrations of yeast tRNAs (1–10 μM, Supplementary File S2), synthetases (1–4 μM, Supplementary File S3), amino acids [0.1–100 mM (21)] and ATP [2–3 mM (22)], all binding reactions are much faster than the kcat.
A literature search indicates that kcat values are available for 10 of the 20 cytoplasmic tRNA synthetases from S. cerevisiae (Supplementary File S3). For one further tRNA, data are available from another eukaryote, and for a further nine tRNAs data are available from bacteria or archea. The only enzyme for which we were unable to find biochemical data in the literature is asparaginyl-tRNA synthetase (Asn-RS), to which we assigned the median value of the experimental data as a best guess.
Having fully parameterized the model, we then used it to run simulations of the yeast translation system. In these simulations, we use the cumulative number of finished translation cycles of the average mRNA over time as a measure of translational activity. We term this measure the ‘global translation rate score’ (GTRS). Although this parameter does not have a physiological equivalent, changes in it accurately reflect changes in translational activity in the modelled system.
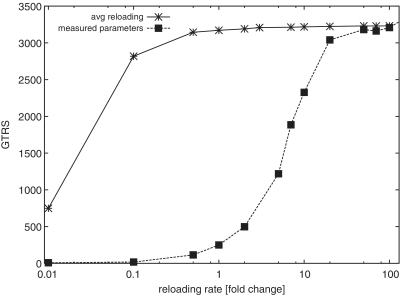
When we used the published synthetase data at face value, simulations yielded a base GTRS of 250. Uniformly varying the rate of re-charging ai for all tRNAs strongly affected activity (Figure 2). A plateau around a GTRS of 3000 was reached if all ai were increased 30-fold. Thus, in this scenario, tRNA synthesis rates were limiting for overall translational activity. When all near-cognate tRNA:codon interactions were removed from the model, we observed no acceleration of the system, nor any further decrease in the proportion of uncharged tRNAs. These results would contradict the well-supported conclusion from earlier studies that near-cognate tRNA interactions with codons limit the speed of decoding (2), and would instead place strong limitations on the tRNA aminoacylation step.
Figure 2.
The change of the GTRS as the re-charging rate for the tRNA is increased. A value of 1 means that the parameter corresponds to empirically determined values.
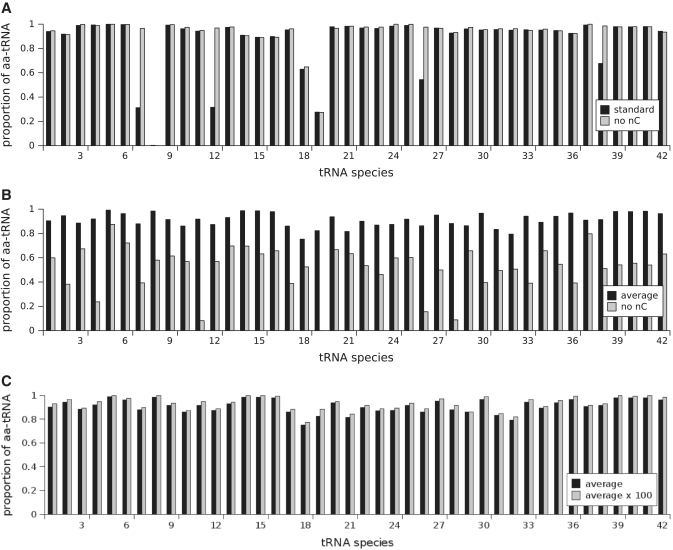
A detailed examination of empty to aminoacylated tRNA ratios showed that limitations were exerted via only a few tRNAs (Figure 3). tRNA species 8 (tD(GUC)) is nearly completely deacylated, while species 7, 12 and 19 (tR(ACG), tE(UUC) and tL(UAG)) are less than 50% aminoacylated. We note that the kcat for the aspartyl-tRNA synthetase that charges the limiting species 8 has an unusually low Kcat value. This value is from a study on the enzyme of a thermophilic archean, and is indeed the lowest in our compiled list of values (Supplementary File S3). When this value was increased so that reloading of this tRNA species was no longer rate-limiting, limitations were transferred to the synthetase with the next lowest kcat (data not shown). Thus, in this scenario translational activity appears very sensitive to the activities of individual tRNA synthetases.
Figure 3.
The proportion of aa-tRNA with and without near cognates for the standard parameters (A), the model with ai = āi (B), and a model where the average tRNA re-charging rate has been increased by a factor of 100 (C).
As an alternative, we explored the use of a single re-charging parameter, āi, corresponding to the mean of reported values for all tRNA synthetases. In this scenario, translational activity reaches the same plateau value observed with the individual ai, although at much lower re-charging activity (Figure 2). Both translation and tRNA synthetase activity are now robust to changes in āi over a wide range (Figures 2 and 3). Removal of near-cognate tRNAs now profoundly accelerate translation (Figure 3B). All of these observations indicate that in this scenario, tRNA re-charging does not exert limitations on the translational system, but that the codon decoding step is now strongly limiting.
In order to distinguish which of these sharply contrasting scenarios corresponded most closely to translation in S. cerevisiae, we used the observation that in fast-growing yeast half of all translation occurs in order to supply the protein complement of the daughter cell, rather than counteracting ongoing protein decay (8). Under fast growth conditions, reductions in translation therefore produce linked reductions in growth rate. Factors that exert strong rate-limitations on global translation can thus be identified because a moderate decrease in their activity should significantly impair growth rates in rich medium, but this effect should be less pronounced in poorer medium where growth rates are slower.
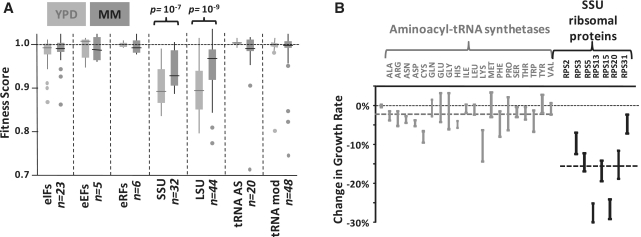
We initially examined a published genome-wide data set that measured the reduction in fitness upon a 50% reduction in gene dosage for all yeast genes (23). We selected genes involved in translation, grouped them according to specific sub-processes, and compared the effect on fitness between these groups (Figure 4A). Surprisingly, the only significant reduction in fitness is observed for genes encoding for proteins of the ribosomal subunits, and, for these genes, the effect is indeed significantly different for different growth speeds as predicted above.
Figure 4.
Components of the translational machinery that exert rate limitations on global translation. (A) Sensitivity of yeast fitness to 50% reductions in gene dosage for different translation-related proteins. Data were selected for heterozygous diploids in the case of single genes, and for homozygous deletions in the case of duplicated genes (the average effect of both homozygous deletions was considered in this case). Data are grouped according to translation initiation (eIFs), elongation (eEFs) and termination (eRFs) factors; small (SSU) and large (LSU) ribosomal subunit proteins, aminoacyl-tRNA synthetases (tRNA AS) and tRNA modifying enzymes (tRNA mod). Fitness effects in rich medium (YPD, fast growth) and defined medium (MM, slower growth) are summarized. The box-plots indicate the median (line), 25th/75th percentile range (box), full range without outliers (feathers) and individual outliers (points). (B) Growth rate measurements for the 20 possible heterozygous aminoacyl-tRNA synthetase deletions and for the 7 essential, non-duplicated small ribosomal subunit proteins. These data confirm the competition data in (A). Error bars indicate the standard deviation observed for three independent samples.
Because the genome-wide data were generated in competition experiments—where all deletion strains were grown in one mixed culture, and the relationship between fitness score in these experiments and actual growth rates is not fully understood—we measured growth rates for all 20 heterozygous synthetase deletions, and for the seven single-gene encoded small ribosomal subunit protein deletions. These data confirmed our findings with the reported genome-wide data, in that ribosomal protein depletion limited growth significantly more strongly than the synthetase mutants. In sum, these data indicate that tRNA re-charging is not particularly limiting for global translational activity. In the remainder of this study, we therefore used the āi scenario (average synthetase rates) for our simulations.
Experimental model calibration
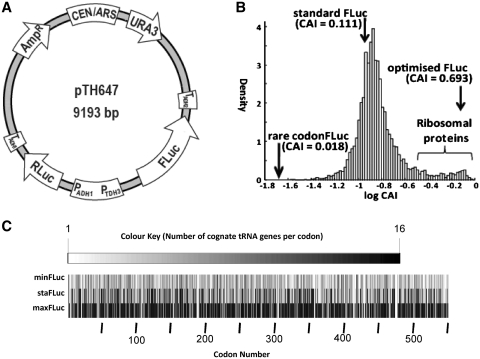
In the preceding paragraphs, we have developed a model of yeast translation that is qualitatively similar to available experimental data. In order to assess the model more quantitatively, we conducted a series of simulations in which we introduced additional mRNAs. The three chosen mRNA sequences encode the same firefly luciferase with differing codon usage (Figure 5). One of these sequences corresponds to that commonly used as a reporter gene [e.g. (12)], and is referred to as standard luciferase (StaFLuc). The other two sequences are derived from this by systematically replacing all codons for the synonymous codon with the highest (MaxFLuc) or lowest (MinFLuc) decoding tRNA abundance. In terms of the commonly used Codon Adaptation Index (CAI) (24), these sequences are equivalent to the median, best, and worst adapted endogenous yeast tRNAs (Figure 5B). The sequences for these different luciferase versions are given in Supplementary File S4.
Figure 5.
Firefly Luciferase sequences used in this study. (A) Principal organisation of the vector used for the luciferase experiments. Three different versions of this vector were constructed with varying FLuc codon composition. The invariant RLuc gene served as an internal control. (B) Comparison of the CAI of the three FLuc sequences to endogenous yeast genes. (C) Cognate tRNA abundance for the three FLuc variants.
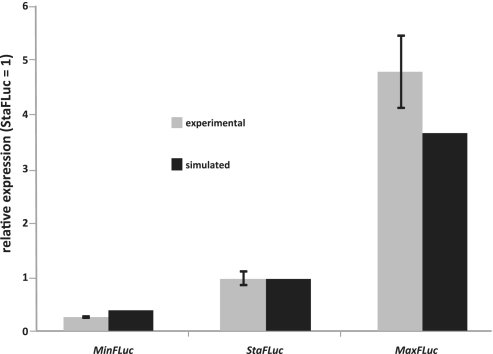
The same FLuc sequences were also synthesized as physical DNA, and introduced into yeast cells in the form of plasmid-born genes. Because our computer model cannot account for differences in mRNA stability, we used a yeast strain deleted for the dom34 gene, which minimizes the potential for mRNA degradation in response to rare codons (25). Compared to the StaFLuc sequence, MinFLuc luciferase activity was 5-fold lower in this strain, whereas MaxFLuc was 5-fold higher (Figure 6). We confirmed these data in quantitative western blots, which showed the same ratio as the activity measurements (Supplementary File S5). The observed changes were thus not caused by changes in specific activity due to impaired protein folding. Since all three luciferase versions are expressed from the same plasmid, promoter and with the same 5′- and 3′-untranslated regions, limitations at the elongation stage of translation are the most likely explanation for these observations.
Figure 6.
Simulated and experimentally observed expression differences for three FLuc variants. Grey bars indicate experimental values, black bars simulation results. Error bars on the experimental values indicate one standard deviation above and below the mean (n = 12).
Simulations yielded changes in FLuc GTRS score that were quantitatively similar to the experimental data (Figure 6). It should be noted that the absolute FLuc GTRS depends on the total number of ribosomes diverted to expressing these additional sequences. The regulatory sequences for FLuc expression are derived from the yeast TDH3 gene, which is expressed at ca6500 proteins/min (8). At identical translation initiation rates, we estimate a diversion of 6000 ribosomes for translation of the StaFLuc construct. At this expression level, the simulation moderately underestimates the effect of codon changes compared to experimental data, predicting 3–4 fold differences in expression level rather than the experimentally observed 5-fold difference (Figure 6). However, this discrepancy is relatively small. Simulations with different ribosome numbers also revealed that the discrepancy between simulation and experiment is not sensitive to the total number of ribosomes in the system, nor to the numbers of ribosomes diverted to FLuc expression. It is possibe that the discrepancies arise because of aspects of the gene expression pathway that can modulate translation and/or mRNA stability in response to codon usage. These effects are not represented in our model. Overall, the simulation results confirm that our interpretation of the cognate:near-cognate system, our implementation of tRNA synthetase activities, and the general modelling approach yield a model that represents yeast translation with a high degree of accuracy.
Since one of the intended uses of the model was the identification of limiting resources, we explored in more detail how yeast translation would react to changes in its tRNA pool. Yeast contains five essential tRNAs encoded by a single isogene. A sixth single-gene tRNA, tR(CCU), is non-essential and likely to decode the AGG codon cooperatively with tR(UCU) (26). Because of the strong link between tRNA gene dosage and tRNA abundance (18), the introduction of additional copies of these single-gene tRNAs on centromeric plasmids will roughly double the cellular content of the tRNAs. Accordingly, we generated a plasmid containing each of the five single-gene tRNAs, and compared its effect on expression of the different FLuc variants to simulations in which the concentration of these five tRNAs was doubled.
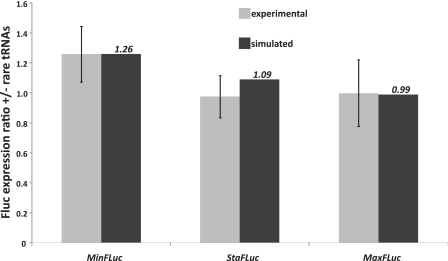
Our simulations predicted that doubling of the five rarest tRNA concentrations should lead to an improvement of MinFLuc expression by 26%, of StaFLuc expression by 9%, and to a minute reduction of MaxFLuc expression by 1% (Figure 7). These predictions agree with our experiments within the experimental standard deviation. In the cases of MinFLuc and MaxFLuc, agreement between simulation and the mean of experimental data is surprisingly exact with <2% difference. In the case of StaFLuc, the difference is slightly larger, for reasons we do not fully understand. Overall, however, our data indicate that the model can be used to predict expression differences arising from changes in tRNA availability with good reliability.
Figure 7.
The effect of changes in tRNA abundance on expression of different FLuc variants. Experimental results are shown in grey, simulated results in black. Error bars indicate one standard deviation above and below the mean for the experimental results (n = 8).
Effects of heterologous gene expression
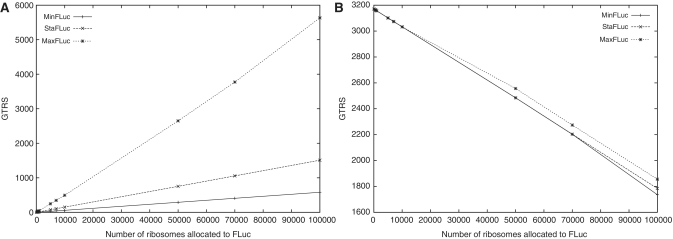
Having established that the model reliably represents basal translational activity, as well as changes to this activity caused by changes in the tRNA system, we simulated the expression of heterologous genes with varying codon optimization over a range of expression levels. The results showed that expression increased nearly linearly with the numbers of ribosomes allocated to translation of the heterologous sequences. The ratio of expression efficiency remained constant over a wide range of expression levels, indicating that their expression was limited by the absolute rate of ribosome movement along these sequences, rather than limitations in the tRNA supply. Only at very high expression levels (>20 000 or 10% of all yeast ribosomes) did the MaxFLuc sequence become disproportionally more efficient compared to the other two (Figure 8A). When half of all yeast ribosomes are committed to FLuc synthesis, this difference is of a magnitude of ≈15%. Thus, only at these very high expression levels does rare tRNA availability exert additional limitations on global translational activity.
Figure 8.
The efficiency of heterologous and endogenous translation as a function of codon usage and expression levels. (A) The efficiency (GTRS) of translation on differently adapted heterologous FLuc sequences as a function of the numbers of ribosomes diverted to their expression. (B) The efficiency of translation on endogenous mRNAs as a function of the numbers of ribosomes diverted to FLuc expression.
Figure 8B shows how the endogenous yeast translation system changed when ribosomes were re-assigned to translating additional heterologous sequences. Endogenous translation declines linearly with the number of ribosomes withdrawn from it. This reaction of endogenous translation is only weakly modulated by the codon usage in the heterologous sequence. However, at high expression levels, heterologous codon usage does make a small difference in that better-adapted heterologous genes allow slightly higher levels of endogenous translation to remain than the worst adapted heterologous sequences.
DISCUSSION AND CONCLUSION
Our study yields a number of important results. We establish a model that accurately represents aminoacylated tRNAs and ribosomes as limited resources in the translational system of a model eukaryote. We show experimentally that tRNA aminoacylation exerts, at most, modest rate-limitations under conditions of endogenous translational activity. This information is used to guide our interpretation of published rate information on aminoacyl-tRNA synthetase activity, and to parameterize our model accordingly. We compared the predicted and experimentally measured translational activity on heterologous mRNAs with differing codon usage. We did this for both the original tRNA complement and an experimentally altered one and found that our model captures essential details of resources in yeast cells quantitatively accurately. Lastly, we use the model to predict how the expression of heterologous genes affects this resource and thereby translation at a cellular level.
In real cells, translation of different mRNA species (be it endogenous or heterologous) is coupled to several mechanisms. For example, translation of each mRNA competes with the translation of those mRNAs that encode the components of the translational machinery itself. The introduction of additional sequences thus not only withdraws resources from the existing sequences, but makes the replenishing of these resources more difficult. There are known feedback loops in the system—such as the Gcn2/eIF2 system (27)—which exert additional control over the way translation of the different mRNAs is coupled.
Because of the implementation as a mean-field approach, and the ensuing loss of information on individual mRNA sequences, our model disregards most of these coupling mechanisms and intentionally isolates two such mechanisms; namely, the competition for aminoacylated tRNAs, and the competition for ribosomes. This simplification enables us to analyse in better detail how these particular coupling mechanisms affect the fitness of the translational system as a whole. We find that the expression of different sequences is coupled to each other mostly via their competition for ribosomes, and only to a small extent via their competition for aminoacylated tRNAs.
Interestingly, the extent of the contribution that tRNA competition makes to the coupling between different sequences depends to a small extent on codon usage as well as expression levels (Figure 8). At very high expression levels, mRNAs decoded by more abundant tRNAs affect the translational system less strongly than mRNAs decoded by rare tRNAs. This effect arises because only less abundant tRNAs can become a scarce enough resource to exert significant rate-limitations on translation. At extremely high expression levels, when 50% of all ribosomes are involved in the translation of a single mRNA species, the remaining translational system is ∼10% more efficient when that particular mRNA is codon-optimized.
In S. cerevisiae, such expression levels are not quite achievable even with synthetic constructs, and are far above levels achieved by any single endogenous gene. However, similar levels are known to occur naturally in some other contexts (e.g. the Pichia pastoris AOX1 gene), as well as in modern high-yield recombinant protein expression systems based on slower growing mammalian cells.
Moreover, although individual sequences could not endanger the supply of other mRNAs with rare tRNA species, highly expressed genes as a whole could significantly deplete this resource if they contained many codons decoded by such rare species. Thus, the fact that codons decoded by rare tRNAs are confined to lower expressed genes would be consistent with the prediction from our models that in these lower expressed genes they do not make a contribution to the coupling to other sequences.
It is likely that the relatively modest quantitative differences in our comparisons between model simulations and experimental data reflect those coupling mechanisms in the translational system that we have currently ignored in our model. It will be interesting to extend the scope of this model to take additional coupling mechanisms into account, and to quantify the relative contribution they make in enabling different mRNAs to compete for the resources of the translational machinery with different efficiencies.
SUPPLEMENTARY DATA
Supplementary Data are available at NAR Online.
FUNDING
Biotechnology and Biological Sciences Research Council (BBSRC)/BRIC (grant BB/I010351/1); Royal Society research (grant RG090115). Funding for open access charge: Departments/BBSRC, UK.
Conflict of interest statement. None declared.
Supplementary Material
REFERENCES
- 1.Varenne S, Lazdunski C. Effect of distribution of unfavourable codons on the maximum rate of gene expression by an heterologous organism. J. Theor. Biol. 1986;120:99–110. doi: 10.1016/s0022-5193(86)80020-0. [DOI] [PubMed] [Google Scholar]
- 2.Fluitt A, Pienaar E, Viljoen H. Ribosome kinetics and aa-tRNA competition determine rate and fidelity of peptide synthesis. Comput. Biol. Chem. 2007;31:335–346. doi: 10.1016/j.compbiolchem.2007.07.003. [DOI] [PMC free article] [PubMed] [Google Scholar]
- 3.Zouridis H, Hatzimanikatis V. A model for protein translation: polysome self-organization leads to maximum protein synthesis rates. Biophys. J. 2007;92:717–730. doi: 10.1529/biophysj.106.087825. [DOI] [PMC free article] [PubMed] [Google Scholar]
- 4.Zouridis H, Hatzimanikatis V. Effects of codon distributions and tRNA competition on protein translation. Biophys. J. 2008;95:1018–1033. doi: 10.1529/biophysj.107.126128. [DOI] [PMC free article] [PubMed] [Google Scholar]
- 5.Zhang G, Fedyunin I, Miekley O, Valleriani A, Moura A, Ignatova Z. Global and local depletion of ternary complex limits translational elongation. Nucleic Acids Res. 2010;38:4778–4787. doi: 10.1093/nar/gkq196. [DOI] [PMC free article] [PubMed] [Google Scholar]
- 6.Slepoy A, Thompson A, Plimpton S. A constant-time kinetic Monte Carlo algorithm for simulation of large biochemical reaction networks. J. Chem. Phys. 2008;128 doi: 10.1063/1.2919546. [DOI] [PubMed] [Google Scholar]
- 7.Gillespie D. Exact stochastic simulation of coupled chemical reactions. J. Phys. Chem. 1977;81:2340–2361. [Google Scholar]
- 8.von der Haar T. A quantitative estimation of the global translational activity in logarithmically growing yeast cells. BMC Syst. Biol. 2008;2:87. doi: 10.1186/1752-0509-2-87. [DOI] [PMC free article] [PubMed] [Google Scholar]
- 9.Boehlke K, Friesen J. Cellular content of ribonucleic acid and protein in saccharomyces cerevisiae as a function of exponential growth rate: calculation of the apparent peptide chain elongation rate. J. Bacteriol. 1975;121:429–433. doi: 10.1128/jb.121.2.429-433.1975. [DOI] [PMC free article] [PubMed] [Google Scholar]
- 10.Miller C, Martinat M, Hyman L. Assessment of aryl hydrocarbon receptor complex interactions using pbevy plasmids: expressionvectors with bi-directional promoters for use in Saccharomyces cerevisiae. Nucleic Acids Res. 1998;26:3577–3583. doi: 10.1093/nar/26.15.3577. [DOI] [PMC free article] [PubMed] [Google Scholar]
- 11.Sikorski R, Hieter P. A system of shuttle vectors and yeast host strains designed for efficient manipulation of DNA in Saccharomyces cerevisiae. Genetics. 1989;122:19–27. doi: 10.1093/genetics/122.1.19. [DOI] [PMC free article] [PubMed] [Google Scholar]
- 12.Salas-Marco J, Bedwell D. Discrimination between defects in elongation fidelity and termination efficiency provides mechanistic insights into translational readthrough. J. Mol. Biol. 2005;348:801–815. doi: 10.1016/j.jmb.2005.03.025. [DOI] [PubMed] [Google Scholar]
- 13.Brachmann CB, Davies A, Cost GJ, Caputo E, Li J, Hieter P, Boeke JD. Designer deletion strains derived from Saccharomyces cerevisiae S288C: a useful set of strains and plasmids for PCR-mediated gene disruption and other applications. Yeast. 1998;14:115–132. doi: 10.1002/(SICI)1097-0061(19980130)14:2<115::AID-YEA204>3.0.CO;2-2. [DOI] [PubMed] [Google Scholar]
- 14.Gietz R, Schiestl R. Quick and easy yeast transformation using the LiAc/SS carrier DNA/PEG method. Nat. Protoc. 2007;2:35–37. doi: 10.1038/nprot.2007.14. [DOI] [PubMed] [Google Scholar]
- 15.Merritt G, Naemi W, Mugnier P, Webb H, Tuite M, von der Haar T. Decoding accuracy in erf1 mutants and its correlation with pleiotropic quantitative traits in yeast. Nucleic Acids Res. 2010;38:5479–5492. doi: 10.1093/nar/gkq338. [DOI] [PMC free article] [PubMed] [Google Scholar]
- 16.von der Haar T. Optimized protein extraction for quantitative proteomics of yeasts. PLoS ONE. 2007;2:e1078. doi: 10.1371/journal.pone.0001078. [DOI] [PMC free article] [PubMed] [Google Scholar]
- 17.Hani J, Feldmann H. tRNA genes and retroelements in the yeast genome. Nucleic Acids Res. 1998;26:689–696. doi: 10.1093/nar/26.3.689. [DOI] [PMC free article] [PubMed] [Google Scholar]
- 18.Ikemura T. Correlation between the abundance of yeast transfer RNAs and the occurrence of the respective codons in protein genes. differences in synonymous codon choice patterns of yeast and escherichia coli with reference to the abundance of isoaccepting transfer rnas. J. Mol. Biol. 1982;158:573–597. doi: 10.1016/0022-2836(82)90250-9. [DOI] [PubMed] [Google Scholar]
- 19.Waldron C, Lacroute F. Effect of growth rate on the amounts of ribosomal and transfer ribonucleic acids in yeast. J. Bacteriol. 1975;122:855–865. doi: 10.1128/jb.122.3.855-865.1975. [DOI] [PMC free article] [PubMed] [Google Scholar]
- 20.Plant E, Nguyen P, Russ J, Pittman Y, Nguyen T, Quesinberry J, Kinzy T, Dinman J. Differentiating between near- and non-cognate codons in saccharomyces cerevisiae. PLoS ONE. 2007;2:e517. doi: 10.1371/journal.pone.0000517. [DOI] [PMC free article] [PubMed] [Google Scholar]
- 21.Hans MA, Heinzle E, Wittmann C. Free intracellular amino acid pools during autonomous oscillations in saccharomyces cerevisiae. Biotechnol. Bioeng. 2003;82:143–151. doi: 10.1002/bit.10553. [DOI] [PubMed] [Google Scholar]
- 22.Ozalp VC, Pedersen TR, Nielsen LJ, Olsen LF. Time-resolved measurements of intracellular atp in the yeast Saccharomyces cerevisiae using a new type of nanobiosensor. J. Biol. Chem. 2010;285:37579–37588. doi: 10.1074/jbc.M110.155119. [DOI] [PMC free article] [PubMed] [Google Scholar]
- 23.Deutschbauer A, Jaramillo D, Proctor M, Kumm J, Hillenmeyer ME, Davis RW, Nislow C, Giaever G. Mechanisms of haploinsufficiency revealed by genome-wide profiling in yeast. Genetics. 2005;169:1915–1925. doi: 10.1534/genetics.104.036871. [DOI] [PMC free article] [PubMed] [Google Scholar]
- 24.Sharp PM, Li WH. The codon adaptation index–a measure of directional synonymous codon usage bias, and its potential applications. Nucleic Acids Res. 1987;15:1281–1295. doi: 10.1093/nar/15.3.1281. [DOI] [PMC free article] [PubMed] [Google Scholar]
- 25.Doma M, Parker R. Endonucleolytic cleavage of eukaryotic mRNAs with stalls in translation elongation. Nature. 2006;440:561–564. doi: 10.1038/nature04530. [DOI] [PMC free article] [PubMed] [Google Scholar]
- 26.Kawakami K, Pande S, Faiola B, Moore DP, Boeke JD, Farabaugh PJ, Strathern JN, Nakamura Y, Garfinkel DJ. A rare tRNA-Arg(CCU) that regulates Ty1 element ribosomal frameshifting is essential for ty1 retrotransposition in saccharomyces cerevisiae. Genetics. 1993;135:309–320. doi: 10.1093/genetics/135.2.309. [DOI] [PMC free article] [PubMed] [Google Scholar]
- 27.Hinnebusch AG. Translational regulation of GCN4 and the general amino acid control of yeast. Annu. Rev. Microbiol. 2005;59:407–450. doi: 10.1146/annurev.micro.59.031805.133833. [DOI] [PubMed] [Google Scholar]
Associated Data
This section collects any data citations, data availability statements, or supplementary materials included in this article.


