

Abstract
Allostery in a protein involves effector binding at an allosteric site that changes the structure and/or dynamics at a distant, functional site. In addition to the chemical equilibrium of ligand binding, allostery involves a conformational equilibrium between one protein substate that binds the effector and a second substate that less strongly binds the effector. We run molecular dynamics simulations using simple, smooth energy landscapes to sample specific ligand-induced conformational transitions, as defined by the effector-bound and unbound protein structures. These simulations can be performed using our web server: http://salilab.org/allosmod/. We then develop a set of features to analyze the simulations and capture the relevant thermodynamic properties of the allosteric conformational equilibrium. These features are based on molecular mechanics energy functions, stereochemical effects, and structural/dynamic coupling between sites. Using a machine-learning algorithm on a dataset of 10 proteins and 179 mutations, we predict both the magnitude and sign of the allosteric conformational equilibrium shift by the mutation; the impact of a large identifiable fraction of the mutations can be predicted with an average unsigned error of 1 kBT. With similar accuracy, we predict the mutation effects for an 11th protein that was omitted from the initial training and testing of the machine-learning algorithm. We also assess which calculated thermodynamic properties contribute most to the accuracy of the prediction.
Keywords: energy landscape, protein dynamics, machine learning, allostery
Introduction
Allostery is a type of protein dynamics in which microscopic motions of individual residues determine a macroscopically observed allosteric mechanism. For allostery, a signal is initiated by effector binding and then transmitted through structural and/or dynamic changes involving a set of residues, known as the allosteric network. The allosteric network is responsible for shifting the equilibrium between effector-bound and effector-unbound conformational substates (Figure 1). Allosteric regulation therefore occurs because the substates have different levels of activity at a functional site distant from the effector. In previous work, we presented a model in which the allosteric network’s size and connectivity determine the cooperative motions and therefore the macroscopic allosteric mechanism1. The concept of the allosteric network has involved different descriptions throughout many decades of study.
Figure 1.

The chemical equilibrium between effector-bound and unbound states ( ) should, for an allosteric protein, be expanded to include the conformational equilibrium between substates. One conformational substate binds the effector (CS2) and another substate less strongly binds the effector (CS1). In most cases, our allostery model allows a conformational substate to contain a diverse set of structures of similar energy1, i.e. a substate may contain structurally diverse microstates. In some cases, CS1 and CS2 may be structurally similar, for instance, if a protein has an entropically driven allosteric mechanism67. (bottom) There are three types of mutations that differ in how they modify the effector binding equilibrium and the conformational equilibrium. In reality, mutations can bridge the different categories.
Studies have attempted to characterize allosteric mechanisms, such as cooperative oxygen binding in hemoglobin2; 3. Experimental methods characterize allosteric mechanisms by probing for allosteric networks4; 5. Sites on the protein surface can be assessed using site-directed ligands6; 7 and fluorophores8. All sites, including those internal to the protein, can be assessed using time resolved NMR spectroscopy9, site specific FTIR spectroscopy10, and room temperature X-ray crystallography11. Typically, allosteric networks are inferred from mutations and/or sequence diversity due to evolution12. Mutations that perturb the allosteric transition are thought to be in the allosteric network. However, mutations can cause orthogonal effects, such as inducing aggregation or new conformational states. A physical model is therefore needed to substantiate the data for characterizing the allosteric conformational equilibrium. With a sufficiently accurate energy function and sufficient conformational sampling, one can use variational/analytical models13; 14 or simulate allosteric transitions directly15; 16; 17; 18; 19. In practice, however, most experimental and computational techniques are limited by the size of the protein and the magnitude of structural changes during the allosteric transition.
Our previous work established an efficient allostery model that predicts the magnitudes of coupling for a rather diverse set of proteins1. The allostery model involves an atomistic description of the protein simulated using constant temperature molecular dynamics on a simplified, smooth energy landscape constructed to capture the essence of allostery. The energy landscape corresponds to a dual basin structure-based/Gō model20; 21; 22; 23; 24; 25; 26; 27; 28; 29, defined using the effector-bound and unbound crystal structures. This energy landscape allows for a well-sampled, statistical description of the relevant conformations and structural changes30; 31. Importantly, the crystal structures that define the landscape also define the conformational substates within the landscape (CS1 and CS2 in Figure 1). In our model, a conformational substate may be structurally diverse, which is determined by the contact density patterns in the crystal structures1; 25. The model therefore allows characterization of a specific allosteric conformational transition. If a system involves multiple conformational states, we can run separate simulations for each pair of conformational states.
Here, we apply our allostery model to further characterize how dynamics plays a role in the allosteric conformational equilibrium. We create energy landscapes to sample transitions between the effector-bound and the effector-unbound substates (CS2 and CS1, respectively). In order to test the limits of the method, we run simulations for several proteins with allosteric transitions that are observed using different types of data. Then, we predict the magnitude and sign of the mutation effects on the allosteric conformational equilibrium. The mutation effect predictions are dependent on the description of the energy landscape, in particular the relative stability between substates CS1 and CS2 that can determine changes in effector binding affinity. By using a large, diverse data set and different types of calculations, we gain insight into allosteric transitions.
Results
Our approach for predicting impact of mutations on the allosteric conformational equilibrium utilizes several different types of calculations. First, we use our allostery model, which is based on simplified energy landscapes1, to run simulations for a set of 10 proteins (Table 1). Second, we develop a set of features to analyze the simulations and capture the relevant thermodynamic properties of the allosteric conformational equilibrium (Table 2). These features are based on molecular mechanics energy functions32, stereochemical effects33, and structural/dynamic coupling between sites. Third, a boosted decision tree machine-learning algorithm is trained on the features to predict the effect of 179 mutations in the 10 proteins (Table 3)34; 35; 36; 37; 38; 39; 40; 41; 42; 43; 44; 45. For a given protein, we train the decision tree on the other 9 proteins. Fourth, we predict mutation effects for an 11th protein, thrombin, to further test the generality of the method. We minimize overtraining by using unrelated proteins.
Table 1.
Prediction Accuracy
| Protein Name | Number of Mutants1 | Protein Length | Data Types |
|---|---|---|---|
|
| |||
| Beta Lactamase | 1 / 2 | 263 | 1 |
| i Domain of LFA-1 (Lymphocyte Function Associated Antigen) | 13 / 23 | 191 | 3 |
| Tyrosine Phosphatase | 1 / 1 | 298 | 3 |
| Glucokinase | 13 / 28 | 455 | 3 |
| Hepatitis c Polymerase | 2 / 11 | 536 | 1,2 |
| PDK1 (3-Phosphoinositide Dependent Protein Kinase 1) | 1 / 20 | 311 | 2 |
| Maltose Binding Protein | 6 / 6 | 370 | 1 |
| Calmodulin-GFP | 0 / 19 | 451 | 3 |
| Caspase 7 | 24 / 42 | 494 | 3 |
| Hemoglobin | 9 / 27 | 574 | 1 |
| Thrombin5 | 63 / 76 | 291 | 1 |
|
| |||
| Prediction Subsets | Number of Mutants in AC Set | Fraction Correct Sign2 | Average Unsigned Error3 |
|
| |||
| Data Type 14 | 18 | 0.76 | 0.5 |
| Data Type 24 | 1 | 0 | 2.1 |
| Data Type 34 | 51 | 0.71 | 1.2 |
| AC set4 | 70 | 0.76 | 1.0 |
| Training/Test Set4 | 142 | 0.74 | 1.3 |
| Not Training/Test Set5 | 81 | 0.61 | 0.9 |
Number of mutants used for machine learning in the AC set/total set.
Fraction of the AC set that is predicted with the correct sign.
Averaged unsigned error in the AC set (kBT).
Data used for training and testing, without those that affect more than one relevant conformational equilibria.
Data excluded from training and testing, which includes thrombin mutations and hemoglobin mutations near the DPG binding site.
Table 2.
Features used in Machine Learning
| Index | Name | Type | Global/Local | Description |
|---|---|---|---|---|
|
| ||||
| 1 | side chain type (wild type) | side chain type | local | Classified as either hydrophobic, polar, positive, or negative1. |
| 2 | side chain type (mutant) | |||
|
|
||||
| 3 | PC(AS,i) | PC | local | Pseudo Correlation |
| 4 | PC(RS,i) | |||
|
|
||||
| 5 | LIC(i) | LIC | local | Ligand Induced Cooperativity |
| 6 | LIC(all residues) | global | ||
|
|
||||
| 7 | distance to AS | distance | local | Distance between the average side chain position and the closest atom in the ligand |
| 8 | distance to RS | |||
|
|
||||
| 9 | AF(i)Amber Energy (rsmooth = 0 Å) | residue energy | local | Allosteric Frustration - energy bias2 |
| 10 | AF(i)Amber Energy (rsmooth = 5 Å) | residue energy, smoothing | ||
| 11 | AF(i)Amber Energy (rsmooth = 6 Å) | |||
|
|
||||
| 12 | AF(i)crowding (rsmooth = 0 Å) | stereochemistry | local | Allosteric Frustration - stereochemical crowding bias3 |
| 13 | AF(i)crowding (rsmooth = 5 Å) | stereochemistry, smoothing | ||
| 14 | AF(i)crowding (rsmooth = 6 Å) | |||
|
|
||||
| 15 | AF(i)crowding if hydrophobic | stereochemistry | local | Allosteric Frustration - stereochemical crowding bias of hydrophobic, polar, positively charged, or negatively chaged residues3 |
| 16 | AF(i)crowding if polar | |||
| 17 | AF(i)crowding if + charged | |||
| 18 | AF(i)crowding if - charged | |||
|
|
||||
| 19 | <E(i)Amber> (rsmooth = 0 Å) | residue energy | local | Ensemble average of energy per residue2 |
| 20 | <E(i)Amber> (rsmooth = 5 Å) | residue energy, smoothing | ||
| 21 | <E(i)Amber> (rsmooth = 6 Å) | |||
|
|
||||
| 22 | <C(i)> if QIdiff < 0 (rsmooth = 0 Å) | stereochemistry | local | Ensemble average of stereochemical crowding per residue if in either the CS1 or CS2 substate3 |
| 23 | <C(i)> if QIdiff > 0 (rsmooth = 0 Å) | |||
| 24 | <C(i)> if QIdiff < 0 (rsmooth = 5 Å) | stereochemistry, smoothing | ||
| 25 | <C(i)> if QIdiff > 0 (rsmooth = 5 Å) | |||
| 26 | <C(i)> if QIdiff < 0 (rsmooth = 6 Å) | |||
| 27 | <C(i)> if QIdiff > 0 (rsmooth = 6 Å) | |||
|
|
||||
| 28 | <C(i)> if hydrophobic | stereochemistry | local | Ensemble average of stereochemical crowding per residue if hydrophobic3 |
|
|
||||
| 29 | entropy bias | entropy terms | global | Entropy bias and terms used to obtain the entropy bias |
| 30 | ΔFe−CS1→CS2 | |||
| 31 | ΔFe+CS1→CS2 | |||
|
|
||||
| 32 | AFAmber Energy of entire protein | residue energy | global | Allosteric Frustration - energy bias, calculated over the whole protein2 |
|
|
||||
| 33 | <E> of entire protein | residue energy | global | Energy calculated over the whole protein2 |
|
|
||||
| 34 | Δ AF(i)Amber Energy | residue energy | local | Change in residue energy bias from rsmooth = 0 Å to rsmooth = 5 Å |
|
|
||||
| 35 | Δ AF(i)crowding | stereochemistry | local | Change in stereochemical crowding bias from rsmooth = 0 Å to rsmooth = 5 Å |
|
|
||||
| 36 | Δ <E(i)Amber> | residue energy | local | Change in average residue energy from rsmooth = 0 Å to rsmooth = 5 Å |
|
|
||||
| 37 | side chain size change | side chain size | local | Change in number of side chain heavy atoms from wild type to mutant |
Residues classified using Eisenberg hydrophobicity index and charge at pH 7,
Energy calculated using Amber with the ff03 force field,
Stereochemical crowding calculated using HBPlus
Table 3.
Protein Details and Experimental Data
| PDB ID | Protein Name | Effector | Experimental Data | Mutants1 | Mutation Effects | ||||
|---|---|---|---|---|---|---|---|---|---|
| 1PZO/ 1JWP | Beta Lactamase | N,N-Bis(4-Chlorobenzyl)-1h-1,2,3,4-Tetraazol-5-Amine | Ki |
|
−0.02, −0.19 | ||||
| 1RD4/ 1ZON | i Domain of LFA-1 (Leukocyte Function Associated Molecule) | 1-Acetyl-4-(4-{4-[(2-Ethoxyphenyl)thio]-3-Nitrophenyl}pyridin-2-Yl)piperazine | Fraction Bound to ICAM-1 |

|
1.24, 0.82, 0.07, −0.43, 1.34, 1.62, | 0.35, 0.07, 1.53, −0.36, −0.25, 2.07, | 0.74, −0.02, −1.79, −0.53, −1.16, −1.04 | 1.49, 2.41, 1.07, −0.50, 0.70, | |
| 1T48/1PA1 | Tyrosine Phosphatase | 3-(3,5-Dibromo-4-Hydroxy-Benzoyl)-2-Ethyl-Benzofuran-6-Sulfonic acid dimethylamide | Catalytic Efficiency |
|
1.98 | ||||
| 1V4S/1V4T | Glucokinase | 2-Amino-4-Fluoro-5-[(1-Methyl-1h-Imidazol-2-Yl) sulfanyl]-N-(1,3-Thiazol-2-Yl)benzamide | Kd of glucose |

|
−0.30, −2.48, −0.71, 1.45, 3.40, 0.35, −0.43, | −0.75, −2.62, 1.95, −1.94, 0.14, −1.40, −1.35, | −1.34, −0.37, −1.26, −1.58, 0.62, −0.45, −0.96, | −3.56, −3.14, −0.89, −1.70, −0.35, −0.19, −1.42 | |
| 2BRK/1C2P | Hepatitis c Polymerase | 3-Cyclohexyl-1-(2-Morpholin-4-Yl-2-Oxoethyl)-2-Phenyl-1h-Indole-6-Carboxylic acid | Ki or IC50 |
|
−1.87, −5.04, 2.75, | −5.95, −5.43, −1.14, | −0.07, −2.62, −4.20 | −0.14, 1.93, | |
| 3HRF/ 3HRC | PDK1 (3-Phosphoinositide-dependent Protein Kinase 1) | (2z)-5-(4-Chlorophenyl)-3-Phenylpent-2-Enoic acid | EC50 |

|
−1.77, 0.00, −0.41, −1.77, 0.00, | −0.97, −1.12, −1.17, 0.82, 0.00, | −1.77, −1.77, −1.10, −1.65, −1.77, | −1.67, 0.00, −0.48, 0.00, −1.42 | |
| 1ANF/1OMP | Maltose Binding Protein | maltose | Kd of maltose |
|
0.40, −0.10 | −0.50, | −0.20, | −0.10, | −0.80, |
| 3EKH/3EKJ | Calmodulin-GFP Calcium Sensor Protein | calcium (x4) | Fluorescence |

|
−1.76, −5.61, −2.89, −0.45, −2.44, | −1.79, −1.75, −5.17, 0.19, −0.39, | 0.77, −4.58, −4.09, −2.74, 2.84 | −3.79, 0.20, 2.63, −1.86, | |
| 1F1J/1GQF | Caspase 7 | residues 191-196 and 212-215 (x2) | Catalytic Efficiency |
|
−1.32, −0.36, −3.58, −1.23, 0.57, −0.94, −6.03, | −1.78, −2.69, −8.80, −4.65, −2.80, −0.33, −0.22, | −2.82, −3.45, 0.35, −0.20, 0.20, −0.44, −1.25 | ||
| 2DN1/2DN2 | Hemoglobin | oxygen (x4) | P502.7 |
|
0.95, 0.64, 0.86, −2.57, 1.28, 1.99, | 0.00, 1.68, | −0.62, 2.19, −2.16, 0.55, 2.42, 2.02 | ||
Red indicates inclusion into the AC set. Underline indicates the site is less than 8 Å from the effector. Yellow indicates that the mutation involves a charged residue and an increase of 4 or more side chain atoms. Blue indicates more than one relevant conformational equilibria is affected. x2 indicates 2 copies of a site and therefore 2 predictions. The effector for caspase 7 is a pair of sites composed of peptide fragments that dock the protein after chain cleavage. The experimental data for hemoglobin is the midpoint of the oxygen dissociation curve raised to the wild type hill coefficient, which is approximately equal to the Kd of oxygen. The wild type value to used due to the lack of accurately determined mutant hill coefficients.
The allosteric proteins in the benchmark vary in function, size, and oligomerization state. The proteins also demonstrate rather diverse effector-induced structural changes. For example, β-lactamase involves core disruption, glucokinase involves complete reorientation between domains, hemoglobin involves twisting motions between domains, LFA-1 involves an alpha-helix bend, and PDK1 involves only subtle side chain motions (Figure 2). Also, the types of experimental data used to observe allosteric transitions vary significantly (Table 3) and therefore a general definition of mutation effects is needed.
Figure 2.

Crystal structures of the effector-bound (green) and effector-unbound (white) structures are shown for A) β-lactamase, B) the i domain of lymphocyte function associated antigen, C) glucokinase, and D) hemoglobin. Effectors are shown in black and regulated site ligands are shown in blue, if applicable. For the i domain, poorly predicted residues (error > 2 kBT) are shown in red and the remaining predicted residues are shown in yellow. For hemoglobin, oxygen is shown in blue and diphosphoglycerate is shown in black in a large, hydrated pocket.
Definition of Mutation Effects
We define mutation effects generally: θ log(Xwt / Xmut), where X is an experimental observable of data type 1 through 3 (see below). For type 1 data, θ is 1 and for types 2 and 3 data, θ is 1 or −1 if the effector is an activator or inhibitor, respectively. The mutation effect is therefore positive if the mutation increases the effector influence and negative otherwise.
Mutation effects are assessed with 3 types of experimental data grouped from the most direct to the least direct probe of the allosteric conformational equilibrium. Type 1 data are the ΔΔG of the effector dissociation reaction: ΔGmut − ΔGwt = RT log(Kdwt / Kdmut). The effector dissociation constant can be expressed using only one of the two conformational substates (Figure 1): Kd = [e][CS2] / [CS2·e]. Therefore, type 1 data directly measure the mutations’ ability to shift the allosteric conformational equilibrium. Type 2 data are the ΔΔG computed from IC50 or EC50: RT log(IC50wt / IC50mut). Type 2 data measure the mutation effect on the functional strength of the effector, which is a combination of binding affinity and strength of allosteric coupling. If the strength of allosteric coupling does not change upon mutation, then types 1 and 2 data are similar. Otherwise, prediction of mutation effects using type 2 data can only be qualitative. Type 3 data are the ΔΔG estimated from a measurement of function at the regulated site: RT log(Awt / Amut), where A can be binding affinity, catalytic efficiency, etc. Type 3 data are ambiguous because they measure how the mutation site affects the regulated site, not necessarily how the effector binding site is coupled to the allosteric conformational equilibrium.
Classifying Mutations
We model the energy landscape to study a specific allosteric conformational equilibrium, which is defined by the input crystal structures. Mutations that perturb the energy landscape can be classified into three groups: A) those that affect the allosteric conformational equilibrium and effector binding, B) those that do not affect the allosteric conformational equilibrium but do affect effector binding, and C) those that affect neither the allosteric conformational equilibrium nor effector binding (Figure 1). We hypothesize that this classification is related to whether or not the mutation is in the effector binding site and/or the allosteric network.
We expect quantitatively accurate predictions for mutation types A and C (the AC set) and qualitatively accurate predictions for remaining mutations (the B set). Predictions for the AC set should be accurate because these mutation effects are exclusively dependent on the region of the energy landscape sampled during an allostery model simulation, i.e. the mutations that can affect the allosteric network. The remaining B mutations can be separated into three subsets: B1) they affect the ligand binding site structure, B2) they cause significant perturbations that can induce new conformational substates, and B3) they affect more than one relevant conformational equilibria. These sets depend on details not included in the energy landscape sampled during an allostery model simulation. For instance, the energy function does not include protein-ligand interactions and cannot capture specific ligand effects. Therefore, the method can be only qualitatively accurate for PDK1, which has many ligands. Also, prediction error can stem from highly perturbing electrostatic changes or the existence of multiple coupled processes. We therefore define the AC set more precisely as those mutations that are not: 1) closer than 8 Å to a ligand, 2) involving a charged residue and an increase of 4 or more side chain atoms, 3) monitored by fluorescence, or 4) coupled to two or more allosteric sites. Here, we emphasize predicting mutations in the AC set, but we include all mutations to gauge accuracy.
Mutation effect predictions in the training and testing sets
The mutation effect predictions are accurate, especially for the AC set, which is shown for each protein (Figure 3). The AC set is predicted with an average unsigned error of 1 kBT and 59% of the predictions have an error of less than 1 kBT (Table 1). Mutations that change the effector binding site structure cause most of the error and are often significant outliers (Figure S1). Because of the machine learning algorithm used, much of the error originates from a small number of significant outliers. These few outliers strongly influence correlation scores and can give the appearance that there is only weak signal, but upon careful analysis, we will explain that most of the outliers are caused by knowable factors (see following sections). Nonetheless, all predictions remain qualitatively accurate as indicated by the fraction predicted to have the correct sign: 0.74 for all data and 0.76 in the AC set (Table 1). Accuracy can be further explained by considering the type of data used to observe allostery, as follows.
Figure 3.

Mutation effects determined by experiment are predicted using machine learning in units of kBT. Each panel is a different protein. Red squares indicate mutation effects in the AC set. The remaining mutations are either: 1) involving a charged residue and an increase of 4 or more side chain atoms (yellow triangles) and/or 2) less than 8 Å from the effector (black circles). Blue triangles indicate mutations that affect more than one relevant conformational equilibria. Dashed lines represent a 1 kBT range of accuracy.
The method most accurately predicts mutation effects for data types that directly measure the allosteric conformational equilibrium (Figure 4). Type 1 data are predicted very accurately (correlation of 0.83) while types 2 and 3 data are predicted less accurately (Table 1). The correlation for type 3 is 0.25 and becomes 0.42 if all mutations with charged residues are omitted. The result indicates the importance of electrostatics in allosteric conformational transitions for some mutations, which are not modeled well in this iteration of the method. The use of types 2 and 3 data, however, causes an undetermined amount of error because these data are not a direct measure of the allosteric conformational equilibrium that we analyze in our calculations. The presence of multiple relevant equilibria contributes to the error, which can make direct measurement of the allosteric conformational equilibrium difficult.
Figure 4.
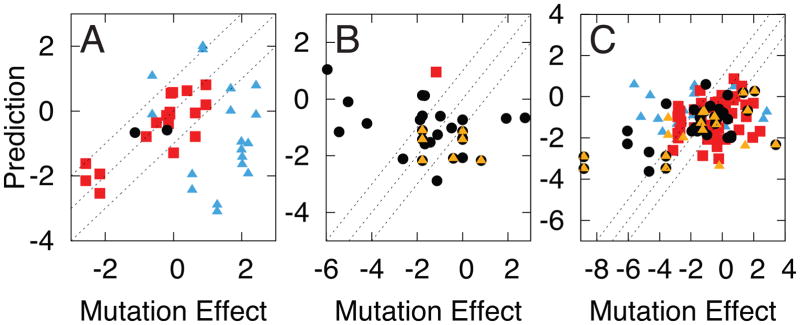
Mutation effects determined by experiment are predicted using machine learning in units of kBT. Each panel is a different data type: A) type 1, B) type 2, and C) type 3. Red squares indicate mutation effects in the AC set. The remaining mutations are either: 1) involving a charged residue and an increase of 4 or more side chain atoms (yellow triangles) and/or 2) less than 8 Å from the effector (black circles). Blue triangles indicate mutations that affect more than one relevant conformational equilibria. Dashed lines represent a 1 kBT range of accuracy. The correlation for type 1 is 0.83. The correlation for type 3 is 0.25 and becomes 0.42 if all mutations with charged residues are omitted.
Error from multiple conformational equilibria: solvation effects
The predictions for the calmodulin-GFP calcium sensor protein do not correlate with the experimental data. Calmodulin-GFP is composed of two proteins, neither one of which is allosteric independently. However, when a fluorescent GFP sequence is inserted into the middle of the calmodulin sequence, calcium binding induces folding of calmodulin and increases fluorescence due to the interface that is formed with GFP. We showed previously that the model predicts coupling between the GFP fluorophore and a residue if the average coupling at the site is used, i.e. by averaging all mutations effects at that site1. The effect for a specific mutation is not predicted, however, because fluorescence yield is more sensitive to the solvation of the chromophore than the conformational equilibrium triggered by calcium binding39. Therefore, the method requires data that measure the allosteric conformational equilibrium and do not measure other processes such as solvation, aggregation, etc.
Error from multiple conformational equilibria: multiple binding sites
The allostery model is used to sample a specific allosteric conformational equilibrium as defined by the input crystal structures. Some systems involve multiple conformational equilibria triggered by different effectors46. For instance, hemoglobin couples at least 5 distinct ligand binding sites for oxygen delivery in the blood (Figure 2): 4 binding sites for oxygen and 1 large, highly solvated binding site for diphosphoglycerate (DPG). Oxygen binding is inhibited by binding of DPG but is activated by binding of oxygen. A mutation can therefore have complicated effects by simultaneously influencing multiple ligand binding sites. In the current simulations, hemoglobin has 4 oxygen effectors. Mutation effects are well predicted for residues that primarily affect the oxygen binding sites, i.e. those further than 20 Å from the DPG binding site (Figure 2). The mutation effects for residues less than 20 Å to the DPG binding site (blue triangles in Figure 3,4C) are well predicted using simulations with DPG as the effector. The mutations close to the DPG binding site are not included in the present training and testing procedures, yet are predicted with an average unsigned error of 1.0 kBT (Table 1). Therefore, the method seems to predict which regions of the protein coupled to a specific allosteric site.
Many allosteric transitions involve systems without complete crystal structures, such as lymphocyte function associated antigen 1 (LFA-1). LFA-1 plays a role in cell adhesion and can be inhibited by effector binding to its i domain. Effector binding triggers a structural change within the i domain that modifies its interface to the rest of LFA-1. This interface has not been crystallized and is not well characterized35. Erroneous predictions are expected for residues at the interface between the i domain and the rest of LFA-1, which is not present in the simulations. The residues with large error (> 2 kBT) occur in a region near the N-terminus of the i domain that is thought to interact with the rest of LFA-1 (Figure 2). Like hemoglobin, the LFA-1 simulations predict the regions of the protein coupled to a specific ligand-induced conformational equilibrium.
Thrombin and multiple conformational states
Thrombin is a serine protease that plays an important role in the blood coagulation pathway. Thrombin forms when inactive prothrombin is cleaved by protease factor X. Thrombin’s activity is further activated by binding of sodium to an allosteric site. A sodium bound structure of thrombin is known as well as two different structures without sodium47; 48. The biological relevance of these two low activity, sodium unbound structures is not clear. We therefore run simulations for two sets of landscapes defined by the sodium bound structure and either: 1) unbound structure 1SGI with minor structural change at the allosteric site (Figure 5A) or 2) unbound structure 2GP9 with significant structural change at the allosteric site (Figure 5C). We then predict the effect of mutations on sodium binding47, which is directly coupled to the protein’s activity. The predictions are performed using the machine learning algorithm trained on 37 features and the 10 other proteins in the current study.
Figure 5.

Sodium binding to thrombin is modeled using two different sodium unbound (low activity) crystal structures. The sodium bound crystal structure 1SG8 (green) is shown with A) unbound crystal structure 1SGI (white) and C) unbound crystal structure 2GP9 (white). Sodium is shown as a black sphere and an active site inhibitor is shown with blue sticks. B,D) Mutation effect predictions are shown based on energy landscapes defined using A and C, respectively. E) The negative of the Pseudo Correlation feature shows how each mutation site is correlated with the allosteric site, i.e. −1 times feature 3 in Table 2 (average pseudo correlation from the two simulations). The best fit line is shown in black (R = 0.71). F) The average of the mutation effect predictions in B and D. As in Figures 3–4, red squares indicate mutation effects corresponding to the AC set. The remaining mutations are either: 1) involving a charged residue and an increase of 4 or more side chain atoms (yellow triangles) and/or 2) less than 8 Å from the effector (black circles). Dashed lines represent a 1 kBT range of accuracy.
The predictions are more accurate if using 2GP9 with significant structural change at the allosteric site (R = 0.30 and average unsigned error of 0.9 kBT) than if using 1SGI with minor structural change at the allosteric site (R = 0.11 and average unsigned error of 0.8 kBT). The calculations with 2GP9 more accurately capture the mutation effects that inhibit sodium binding. This result suggests that the allosteric site of thrombin undergoes a significant structural change in solution experiments and that 2GP9 is a biologically relevant structure. The result is also consistent with the observation that the 1SGI structure may be strongly influenced by crystal packing contacts48.
While the mutation effect predictions with 2GP9 are more accurate than with 1SGI, the pseudo correlation feature calculated from either set of simulations accurately captures the coupling of the mutation site to the allosteric site (Figure 5E). Pseudo correlation measures the likelihood that a residue’s local structure will couple to the structure of the allosteric site (Methods and feature 3 in Table 2). Experimentally measured mutation effects correlate with pseudo correlation in the 1SGI (R = 0.60) and 2GP9 (R = 0.66) simulations. In fact, averaging the pseudo correlation feature from the two simulations yields a correlation of 0.71 with experiment. The 2GP9 calculations are most consistent with experiment and therefore 2GP9 may be more populated than the 1SGI structure in solution.
The pseudo correlation calculations are more accurate than the mutation effect predictions. The pseudo correlation calculations have few false positives (mutations predicted to but do not inhibit sodium binding). The mutation effect predictions overestimate the mutation effects of many solvent exposed electrostatic residues, likely because the electrostatics of the sodium-thrombin interaction is omitted.
Discussion
The method accurately predicts mutation effects on the allosteric conformational equilibrium. The average unsigned error is 1.0 kBT for the AC mutation set and 0.9 kBT for data omitted from the training and testing procedure. For data type 1, which most directly reflects the modeled conformational changes, the correlation is 0.83 for data in the training and testing sets and 0.35 (up to 0.71 if considering pseudo correlation) for data omitted from the training and testing procedure. To our knowledge, no previous method can predict mutation effects on the allosteric conformational equilibria as accurately. There are successful qualitative predictions, i.e. whether or not a mutation influences ligand binding and/or the allosteric communication network12; 49; 50; 51; 52; 53; 54. Mutation effects on distant ligand binding sites have been characterized in terms of free energy shifts (ΔΔG’s) for ligand binding16; 55, but typically ΔΔG’s for ligand binding are reported for binding sites with proximal mutations56; 57. Alternatively, methods that predict ΔΔG’s for protein unfolding can in principle also predict mutation effects on the allosteric conformational equilibrium: by using the difference between the ΔΔG’s calculated from the effector-bound and unbound crystal structures. A study using a filtered set of mutations determined that the average unsigned error for these methods is approximately 2 kBT, with the best method giving an average unsigned error of 1.7 kBT58. This would imply an error of 2.9 kBT, approximated using the reported standard deviations. Therefore, our method represents a significant improvement over such calculations. Even though the current method was assessed on a diverse benchmark, it also improves over previous studies of individual systems16; 57.
The 37 features that give rise to the method’s accuracy reflect both global and local structural/energetic properties important for allosteric transitions. The importance of a feature can be gauged by the decrease of prediction accuracy in its absence (Figure 6), although overlapping information and coupling between features must also be considered. Local features, sensitive to a residue’s local environment, account for 84% of the features. Local features sensitive to energetic changes are particularly important for accuracy. Global features, reflecting the entire protein, are also important. The most important global feature, entropy bias, indicates a preference of one conformational substate over another due to an increase in disorder (Figure 7). The entropy bias correlates well with the average mutation effect in each protein (R = 0.88); in comparison, the global energy bias does not contribute significantly to the accuracy (R = 0.03). A mutation can therefore affect populated ensembles by changing local disorder. For example, mutation to glycine not only destroys favorable energetic interactions but also increases the degrees of freedom for neighboring residues. By this increase of local disorder, the mutation can shift the entire population towards a conformational substate with more entropy than the conformational substate populated without mutation. Our results suggest that there is an interplay between local energetic effects and entropic effects in the allosteric conformational equilibrium, an idea also supported by experimental evidence59.
Figure 6.

The importance of a feature is tested by excluding one or more features during the prediction: A) groups of features are excluded B) individual features are excluded. The features are listed in Table 2. The left most data points in each panel represent the prediction using all features. Blue lines are the averaged unsigned error (kBT) of all mutations in the AC set (red squares in Figures 3–4). Green lines are the fraction of mutation effects in the AC set correctly predicted to be positive or negative. Red and dashed lines are the correlation coefficients for the AC set and for type 1 data, respectively.
Figure 7.
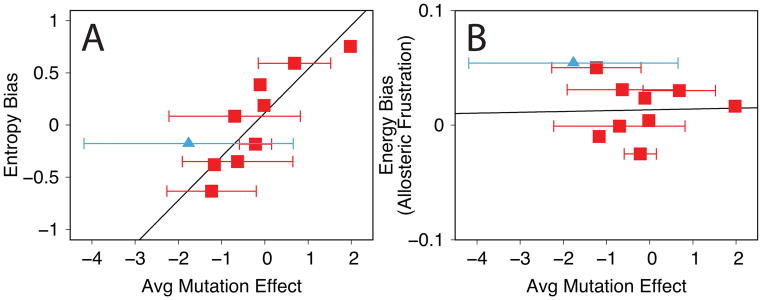
Plots showing the relationship between the average mutation effect for each protein and global features: A) the entropy bias and B) the energy bias (features 29 and 32 in Table 2). Error bars represent the standard deviation of the mutation effects in each protein. The calmodulin-GFP calcium sensor protein is shown with blue triangles. Black lines are the linear fit. The correlation coefficients are 0.88 for the entropy bias and 0.03 for the energy bias.
We address the balancing act between energy and entropy in a protein’s energy landscape by combining different types of calculations. Our structure-based simulations use approximate energies in order to increase sampling efficiency and allow for an accurate description of entropy changes. We then use detailed molecular mechanics energy functions to rescore the trajectory snapshots from our simulations. Rescoring the simulation trajectories effectively creates a new energy landscape that is based on a molecular mechanics energy function (Amber ff03)32. As a result, the method can benefit from a reasonably accurate assessment of substate entropies (Figure 7) without significantly sacrificing accuracy of the energy landscape.
The features were designed using the assumption that mutations only modestly perturb the energy landscape. Therefore, the calculations rely on simulations that do not explicitly include mutations, but due to thorough sampling, the simulation may include conformations not highly populated by the wild-type protein but perhaps accessible via mutation. To account for side chain modifications, features involving allosteric frustration measure properties of the entire ensemble. The allosteric frustration set of features measures whether or not a residue is biased, either energetically or stereochemically, towards either conformational substate (Methods). The features are related to local energetic frustration used to study protein crystal structures60. Allosteric frustration indicates that mutating an energetically biased residue, which is likely to destroy favorable interactions, can shift the equilibrium in the opposite direction of the bias. Allosteric frustration also accounts for stereochemical bias. Mutation to a larger side chain can shift the equilibrium towards the substate that allows the residue to occupy more space. Mutation effects are also captured using smoothing calculations, in which a local feature is averaged with the features of the surrounding residues. Smoothing identifies cooperative regions, as indicated by clusters of similarly biased residues (energetically or stereochemically).
The method suggests that protein energy landscapes may be robust to perturbations like point mutations and ligand binding because the predictions, which depend on a simple landscape, are accurate without explicitly accounting for all these effects. Perturbations can affect the energy landscape by changing: 1) the relative heights of the energy minima and/or 2) the configurations populated within the energy minima (we ignore barrier heights as an approximation). Through the two input crystal structures, both of these landscape changes are used to model effector binding, but we do not explicitly account for mutations. Nonetheless, the method accurately predicts mutation effects, even for type 3 data that measure perturbations from mutations but not from effector binding. The results suggest that a point mutation causes modest changes to the energy landscape allowing the protein to explore slightly different conformations likely populated by the wild-type protein. Correspondingly, highly perturbing mutations that likely change the energy landscape are often predicted inaccurately. An interesting question is how much of the natural motions of the effector-unbound protein also occur in the presence of different perturbations like effector binding and mutation. Our success predicting type 3 data, in which we predict mutation-induced perturbations from simulations based on effector-induced perturbations, suggests that effector-induced motions may indeed occur in the absence of the effector. This idea has been suggested based on other simplified descriptions of energy landscapes61.
The method utilizes a general approach based on a diverse dataset and different calculations. The predictions are most accurate for proteins in which the allosteric conformational equilibrium can be directly observed and is dominated by intra-protein interactions. Based on the importance of features in the prediction, local energetic and stereochemical effects as well as substate entropy changes play a dominant role in the allosteric conformational transition. Because effector binding and mutations can have similar effects on the protein energy landscape, the method can help predict new allosteric sites by focusing on binding pockets. The method can also guide biochemical experiments by predicting functionally important residues, such as for hemoglobin and LFA-1. With the use of comparative modeling, we can study dynamics for proteins without crystal structures. The method could therefore be used for de novo design of allosteric proteins. The method’s success depends on the complementary strengths of individual features that are combined using a machine-learning algorithm. Thus, there is potential for improvement by including protein-ligand energies, explicit electrostatics effects for mutants, and more experimental data. With these improvements, we hope to decrease the number of significant outliers that can cause reduction of correlation scores. Our future work will incorporate more information such as binding site flexibility and coupling between multiple ligand binding sites.
Materials and Methods
Allostery Model Simulations
The simulations can be performed as described in our previous work1 and via our web server at http://salilab.org/allosmod/. For a given protein, the allostery model defines several effector-bound and unbound landscapes that differ by the size of the allosteric site (defined by parameter rAS, see below). Each landscape is given by a potential energy function that is a sum of bonded and non-bonded terms implemented using MODELLER62: . Correct stereochemistry is achieved by the same terms MODELLER uses for standard comparative modeling: Ebonded = Ebond + Eangle + Edihedral + Eimproper. To induce allostery, we add a truncated Gaussian distance term and a soft-sphere atom overlap term, to obtain the total non-bonded energy: Enon-bonded = Esoft sphere + Edistance. This distance term is given by a sum over all heavy atom pairs more than two residues apart in sequence and with side chain centers of mass less than 11 Å apart. The energy for the distance term is distributed differently depending on the distance to the effector, rAS: Edistance = EAS + ERS (Figure S2). The energy for interactions less than rAS from the effector (EAS) is based on distances in either the effector-bound or unbound structure. The energy for interactions greater than rAS from the effector (ERS) is based on distances in both the effector-bound and unbound-structures.
Constant temperature molecular dynamics simulations at 300 K are used to sample each landscape. In each simulation, a random structure is generated by interpolating between the input crystal structures, which is then equilibrated and simulated for 6 nanoseconds using three femtosecond time steps and velocity rescaling every 200 steps. 30 simulations were run for the effector-bound and unbound landscapes at 3 different values of rAS (each value spaced 3 Å apart and starting at a value between 6 and 15 Å corresponding to the value with the minimum number allosteric site residues). The total sampling for each protein is completed in about 1 day (1 processor per simulation) and involves more than 1.08 microseconds of simulation time and over 2 million structures.
Features
The features used to analyze the simulations can be categorized as local when applied to a single residue or global otherwise. Local features tend to correlate with the mutation effects for a single protein. Global features improve the quantitative accuracy of the predictions. Many features include a calculation of the ensemble average of a property, 〈 X 〉. In other words, X is weighted by the Boltzmann probability for each structure (Pi) as calculated from the protein’s total energy: . The total energy is either the allostery model energy (EAllosmod) or the Amber energy (EAmber), as specified. The features are listed in Table 2 and explained here:
Local features
QIdiff(i) is a pairwise distance similarity metric that describes the local environment of residue i; it is positive if a residue’s configuration is closer to the effector-bound structure than to the effector-unbound structure and negative otherwise1. For a given structure, an overall fold similarity to any other structure is given by Q, reflecting the fraction of similar contacts. To determine if a simulated structure is more similar to the effector-bound (e+) or the effector-unbound (e−) crystal structures, we calculate QIdiff = (Qe+ − Qe−) / (1 − ΔQ) where ΔQ is the structural similarity (Q) between the effector-bound and unbound crystal structures. QIdiff(i) indicates if a residue (or set of residues) is in the CS1 or CS2 substates, i.e. QIdiff(i) < 0 and QIdiff(i) > 0, respectively (Figure 1 and S2).
〈EAmber (i)〉 is the ensemble average of a residue energy calculated from the simulation trajectories. As in previous work63, we recalculate energies of each simulation snapshot using Amber by: 1) adding hydrogen atoms to the structure (simulations include only heavy atoms), 2) minimizing the structure with a fixed backbone using the Amber ff03 force field32, and 3) decomposing the energy into residue specific contributions. The ensemble average uses sampling from the allostery model simulations at maximum rAS and the Boltzmann-weighted probability distributions using the Amber energy function ( ).
〈C(i)〉 is the ensemble average of a residue’s stereochemical crowding calculated using HBPlus33. Stereochemical crowding is defined as the number of atoms less than 4 Å from any side chain atom in residue i divided by the greater of: 1) the number of side chain atoms in residue i not including the Cβ or 2) the value 1. The ensemble average uses sampling from the allostery model simulations at maximum rAS and the Boltzmann weighted probability distributions using the allostery model energy function ( ).
-
AFX(i) is a general form for allosteric frustration. This term indicates if the local environment of residue i is biased towards either substate.
X represents a property such as Amber energy or stereochemical crowding. CS1 and CS2 means that the property is calculated for structures with QIdiff(i) < 0 or QIdiff(i) > 0, respectively. σ2 is the variance. Brackets imply an ensemble average of property X calculated using the Boltzmann-weighted probability distributions.
PC refers to pseudo correlation. Pseudo correlation maps are used to determine which subsets of residues have correlated motions1. We first analyze the simulation trajectories, for all values of rAS, and classify residues into the effector-bound (CS2) or unbound substate (CS1). Pseudo correlation is determined using the log odds ratio of the probability that a residue j is in CS1 if another residue i is also in substate CS1, given by P(j is CS1 | i is CS1), to the probability given by P(j is CS1 | i is CS2). This expression gives a likelihood that j will be affected by the substate of i: PCCS1(j,i) = log ( P(j is CS1 | i is CS1) / P(j is CS1 | i is CS2) ).
LIC refers to ligand-induced cooperativity. LIC is large if a residue’s local environment differs significantly between the effector-bound and unbound simulations1. Monitoring the coupling of residues along an order parameter for allostery, from low to high rAS, provides a measure of ligand-induced cooperativity: where N is either the total number of residues in the protein or 1 (corresponding to a single residue), a low rAS is defined as the smallest radius sampled (typically 6 Å), and a high rAS is the value that spans approximately half the distance to the regulated site.
rsmooth refers to the radius for smoothing a feature over conformational space. The feature for residue i is averaged with the feature for all residues with side chain centers of mass closer than rsmooth, as defined by the effector-bound and unbound crystal structures.
Δ refers to the change of a feature from rsmooth = 0 to rsmooth = 5 Å. Δ for a feature indicates proximity to cooperative or uncooperative regions.
Global Features
〈E〉 is the ensemble average of the entire protein’s Amber energy based on the Boltzmann-weighted distributions using .
AFX is global allosteric frustration: , in which AFX(i) is local allosteric frustration averaged over all residues Nres.
-
is the free energy change from CS1 to CS2 calculated from trajectories based on the effector-bound (or unbound) landscape.
The free energy is calculated using the probability that a residue is in a substate: CS1 and CS2 are defined by QIdiff(i) < 0 or QIdiff(i) > 0, respectively.
-
The entropy bias ( ) is composed of terms for the entropy change from CS1 to CS2 as well as the free energy of bond cleavage (only for caspase 7 because allosteric activation includes cleavage of the protein at two sites). This expression can be deduced from and because the allostery landscapes are defined in a particular manner (Figure S2). As an approximation, we set the free energy of the CS1 substate in the effector-unbound landscape equivalent to the free energy of the CS1 substate in the effector-bound landscape. An exception occurs if there is bond cleavage of the protein, in which an offset is used64: ΔFbond break = −0.7 Nbond break. The entropy bias simplifies to an expression composed of easily computed terms ( ) because our landscapes have the property that and are equivalent.
As a result, the entropy bias is negative if the CS1 substate has more entropy than the CS2 substate and positive otherwise.
Machine Learning
We use the “Toolkit for Multivariate Data Analysis” as part of Root65, which contains a regression algorithm for boosted decision trees. In contrast to classification decision tree algorithms that assign labels to a set of features (i.e. signal or background), the regression decision tree algorithm involves trees that assign prediction values to a set of features66 (in this case ΔΔG). The default parameters were used (BDTG): number of trees = 2000, gradient boosting = true, learning rate = 0.1, gradient bagging = true, bagging fraction = 0.5, number of node cuts during optimization = 20, max tree depth = 3, and max nodes = 15. The predictions are fairly stable, due to the use of the gradient boost algorithm, as indicated by the minimal change of accuracy when a single, unimportant feature is omitted (Figure S3).
Mutation effects are first predicted for the first 10 proteins in Table 1. For these 10 proteins, the testing set includes all mutations from the test protein and the training set includes all mutations from the remaining 9 proteins (excluding mutations that are involved in multiple conformational equilibria, i.e. blue triangles in Figures 3–4). While the final prediction includes 37 features per mutation (Table 2), many more were first considered. Deletion of features occurred after “one out” procedures in which training and testing is performed in the absence of one feature (Figure 6). A feature is eliminated if the average unsigned error of all mutations in the AC set (red points in Figures 3–4) improves or is not affected by omitting that feature. The final set of features is obtained by repeating the “one out” procedure until no more features can be eliminated. Eighteen mutations in hemoglobin were omitted from the above procedure and predicted afterwards (Table 1).
Mutation effects are then predicted for thrombin using the 10 proteins and 37 features, as described above, for the training set. Two sets of mutation effect predictions are made for thrombin because there are two proposed sodium unbound structures, as described in Results.
Supplementary Material
Allostery involves ligand-induced, long-range changes in structure and/or dynamics
We predict the effect of mutations on the allosteric conformational equilbrium
A large identifiable fraction of the mutations are predicted with 1 kBT accuracy
Several mutations omitted from the training/testing procedure are predicted with 1 kBT accuracy
We identify important metrics that capture the thermodynamics of the allosteric transition
Acknowledgments
We are grateful for helpful discussions with Javier Chaparro-Riggers, James Fraser, Jacob Glanville, Michael Marden, George Patrinos, Nathan Thomsen, and Andy Yeung. The work was supported by grants from the NIH (P01 GM71790), National Science Council, Taiwan (NSC98-2917-I-564-129), and Pfizer Inc.
Footnotes
Publisher's Disclaimer: This is a PDF file of an unedited manuscript that has been accepted for publication. As a service to our customers we are providing this early version of the manuscript. The manuscript will undergo copyediting, typesetting, and review of the resulting proof before it is published in its final citable form. Please note that during the production process errors may be discovered which could affect the content, and all legal disclaimers that apply to the journal pertain.
References
- 1.Weinkam P, Pons J, Sali A. Structure-based model of allostery predicts coupling between distant sites. Proc Natl Acad Sci U S A. 2012;109:4875–80. doi: 10.1073/pnas.1116274109. [DOI] [PMC free article] [PubMed] [Google Scholar]
- 2.Monod J, Wyman J, Changeux JP. On nature of allosteric transitions - a plausible model. Journal of Molecular Biology. 1965;12:88. doi: 10.1016/s0022-2836(65)80285-6. [DOI] [PubMed] [Google Scholar]
- 3.Koshland DE, Nemethy G, Filmer D. Comparison of experimental binding data and theoretical models in proteins containing subunits. Biochemistry. 1966;5:365–368. doi: 10.1021/bi00865a047. [DOI] [PubMed] [Google Scholar]
- 4.Kuriyan J, Eisenberg D. The origin of protein interactions and allostery in colocalization. Nature. 2007;450:983–990. doi: 10.1038/nature06524. [DOI] [PubMed] [Google Scholar]
- 5.Boehr DD, Nussinov R, Wright PE. The role of dynamic conformational ensembles in biomolecular recognition. Nature Chemical Biology. 2009;5:789–796. doi: 10.1038/nchembio.232. [DOI] [PMC free article] [PubMed] [Google Scholar]
- 6.Hardy JA, Lam J, Nguyen JT, O?Brien T, Wells JA. Discovery of an allosteric site in the caspases. Proc Natl Acad Sci USA. 2004;101:12461–12466. doi: 10.1073/pnas.0404781101. [DOI] [PMC free article] [PubMed] [Google Scholar]
- 7.Zhang XY, Bishop AC. Site-specific incorporation of allosteric-inhibition sites in a protein tyrosine phosphatase. Journal of the American Chemical Society. 2007;129:3812. doi: 10.1021/ja069098t. [DOI] [PMC free article] [PubMed] [Google Scholar]
- 8.Dattelbaum JD, Looger LL, Benson DE, Sali KM, Thompson RB, Hellinga HW. Analysis of allosteric signal transduction mechanisms in an engineered fluorescent maltose biosensor. Protein Science. 2005;14:284–291. doi: 10.1110/ps.041146005. [DOI] [PMC free article] [PubMed] [Google Scholar]
- 9.Popovych N, Sun S, Ebright RH, Kalodimos CG. Dynamically driven protein allostery. Nat Struct Mol Biol. 2006;13:831–8. doi: 10.1038/nsmb1132. [DOI] [PMC free article] [PubMed] [Google Scholar]
- 10.Weinkam P, Zimmermann J, Sagle LB, Matsuda S, Dawson PE, Wolynes PG, Romesberg FE. Characterization of Alkaline Transitions in Ferricytochrome c Using Carbon-Deuterium Infrared Probes. Biochemistry. 2008;47:13470–13480. doi: 10.1021/bi801223n. [DOI] [PMC free article] [PubMed] [Google Scholar]
- 11.Fraser JS, van den Bedem H, Samelson AJ, Lang PT, Holton JM, Echols N, Alber T. Accessing protein conformational ensembles using room-temperature X-ray crystallography. Proceedings of the National Academy of Sciences of the United States of America. 2011;108:16247–16252. doi: 10.1073/pnas.1111325108. [DOI] [PMC free article] [PubMed] [Google Scholar]
- 12.Suel GM, Lockless SW, Wall MA, Ranganathan R. Evolutionarily conserved networks of residues mediate allosteric communication in proteins. Nature Structural Biology. 2003;10:59–69. doi: 10.1038/nsb881. [DOI] [PubMed] [Google Scholar]
- 13.Itoh K, Sasai M. Entropic mechanism of large fluctuation in allosteric transition. Proceedings of the National Academy of Sciences of the United States of America. 2010;107:7775–7780. doi: 10.1073/pnas.0912978107. [DOI] [PMC free article] [PubMed] [Google Scholar]
- 14.Tripathi S, Portman JJ. Conformational flexibility and the mechanisms of allosteric transitions in topologically similar proteins. Journal of Chemical Physics. 2011:135. doi: 10.1063/1.3625636. [DOI] [PubMed] [Google Scholar]
- 15.Wu S, Zhuravlev PI, Papoian GA. High resolution approach to the native state ensemble kinetics and thermodynamics. Biophys J. 2008;95:5524–32. doi: 10.1529/biophysj.108.136697. [DOI] [PMC free article] [PubMed] [Google Scholar]
- 16.Kasson PM, Ensign DL, Pande VS. Combining Molecular Dynamics with Bayesian Analysis To Predict and Evaluate Ligand-Binding Mutations in Influenza Hemagglutinin. Journal of the American Chemical Society. 2009;131:11338. doi: 10.1021/ja904557w. [DOI] [PMC free article] [PubMed] [Google Scholar]
- 17.Kidd BA, Baker D, Thomas WE. Computation of conformational coupling in allosteric proteins. PLoS Comput Biol. 2009;5:e1000484. doi: 10.1371/journal.pcbi.1000484. [DOI] [PMC free article] [PubMed] [Google Scholar]
- 18.McClendon CL, Friedland G, Mobley DL, Amirkhani H, Jacobson MP. Quantifying Correlations Between Allosteric Sites in Thermodynamic Ensembles. Journal of Chemical Theory and Computation. 2009;5:2486–2502. doi: 10.1021/ct9001812. [DOI] [PMC free article] [PubMed] [Google Scholar]
- 19.Potoyan DA, Zhuravlev PI, Papoian GA. Computing Free Energy of a Large-Scale Allosteric Transition in Adenylate Kinase Using All Atom Explicit Solvent Simulations. Journal of Physical Chemistry B. 2012;116:1709–1715. doi: 10.1021/jp209980b. [DOI] [PubMed] [Google Scholar]
- 20.Go N. The Consistency Principle in Protein-Structure and Pathways of Folding. Advances in Biophysics. 1984;18:149–164. doi: 10.1016/0065-227x(84)90010-8. [DOI] [PubMed] [Google Scholar]
- 21.Sali A, Shakhnovich E, Karplus M. How Does a Protein Fold. Nature. 1994;369:248–251. doi: 10.1038/369248a0. [DOI] [PubMed] [Google Scholar]
- 22.Alm E, Baker D. Prediction of protein-folding mechanisms from free-energy landscapes derived from native structures. Proceedings of the National Academy of Sciences of the United States of America. 1999;96:11305–11310. doi: 10.1073/pnas.96.20.11305. [DOI] [PMC free article] [PubMed] [Google Scholar]
- 23.Munoz V, Eaton WA. A simple model for calculating the kinetics of protein folding from three-dimensional structures. Proceedings of the National Academy of Sciences of the United States of America. 1999;96:11311–11316. doi: 10.1073/pnas.96.20.11311. [DOI] [PMC free article] [PubMed] [Google Scholar]
- 24.Levy Y, Wolynes PG, Onuchic JN. Protein topology determines binding mechanism. Proceedings of the National Academy of Sciences of the United States of America. 2004;101:511–516. doi: 10.1073/pnas.2534828100. [DOI] [PMC free article] [PubMed] [Google Scholar]
- 25.Weinkam P, Zong CH, Wolynes PG. A funneled energy landscape for cytochrome c directly predicts the sequential folding route inferred from hydrogen exchange experiments. Proceedings of the National Academy of Sciences of the United States of America. 2005;102:12401–12406. doi: 10.1073/pnas.0505274102. [DOI] [PMC free article] [PubMed] [Google Scholar]
- 26.Hyeon C, Lorimer GH, Thirumalai D. Dynamics of allosteric transitions in GroEL. Proc Natl Acad Sci U S A. 2006;103:18939–44. doi: 10.1073/pnas.0608759103. [DOI] [PMC free article] [PubMed] [Google Scholar]
- 27.Whitford PC, Gosavi S, Onuchic JN. Conformational transitions in adenylate kinase - Allosteric communication reduces misligation. Journal of Biological Chemistry. 2008;283:2042–2048. doi: 10.1074/jbc.M707632200. [DOI] [PubMed] [Google Scholar]
- 28.Li W, Wolynes PG, Takada S. Frustration, specific sequence dependence, and nonlinearity in large-amplitude fluctuations of allosteric proteins. Proc Natl Acad Sci U S A. 2011;108:3504–9. doi: 10.1073/pnas.1018983108. [DOI] [PMC free article] [PubMed] [Google Scholar]
- 29.Sutto L, Mereu I, Gervasio FL. A Hybrid All-Atom Structure-Based Model for Protein Folding and Large Scale Conformational Transitions. Journal of Chemical Theory and Computation. 2011;7:4208–4217. doi: 10.1021/ct200547m. [DOI] [PubMed] [Google Scholar]
- 30.Frauenfelder H, Sligar SG, Wolynes PG. The Energy Landscapes and Motions of Proteins. Science. 1991;254:1598–1603. doi: 10.1126/science.1749933. [DOI] [PubMed] [Google Scholar]
- 31.del Sol A, Tsai CJ, Ma B, Nussinov R. The origin of allosteric functional modulation: multiple pre-existing pathways. Structure. 2009;17:1042–50. doi: 10.1016/j.str.2009.06.008. [DOI] [PMC free article] [PubMed] [Google Scholar]
- 32.Case DA, Cheatham TE, Darden T, Gohlke H, Luo R, Merz KM, Onufriev A, Simmerling C, Wang B, Woods RJ. The Amber biomolecular simulation programs. Journal of Computational Chemistry. 2005;26:1668–1688. doi: 10.1002/jcc.20290. [DOI] [PMC free article] [PubMed] [Google Scholar]
- 33.Mcdonald IK, Thornton JM. Satisfying Hydrogen-Bonding Potential in Proteins. Journal of Molecular Biology. 1994;238:777–793. doi: 10.1006/jmbi.1994.1334. [DOI] [PubMed] [Google Scholar]
- 34.Marvin JS, Corcoran EE, Hattangadi NA, Zhang JV, Gere SA, Hellinga HW. The rational design of allosteric interactions in a monomeric protein and its applications to the construction of biosensors. Proc Natl Acad Sci USA. 1997;94:4366–4371. doi: 10.1073/pnas.94.9.4366. [DOI] [PMC free article] [PubMed] [Google Scholar]
- 35.Huth JR, Olejniczak ET, Mendoza R, Liang H, Harris EAS, Lupher ML, Wilson AE, Fesik SW, Staunton DE. NMR and mutagenesis evidence for an I domain allosteric site that regulates lymphocyte function-associated antigen 1 ligand binding. Proceedings of the National Academy of Sciences of the United States of America. 2000;97:5231–5236. doi: 10.1073/pnas.97.10.5231. [DOI] [PMC free article] [PubMed] [Google Scholar]
- 36.Horn JR, Shoichet BK. Allosteric inhibition through core disruption. Journal of Molecular Biology. 2004;336:1283–1291. doi: 10.1016/j.jmb.2003.12.068. [DOI] [PubMed] [Google Scholar]
- 37.Montalibet J, Skorey K, McKay D, Scapin G, Asante-Appiah E, Kennedy BP. Residues distant from the active site influence protein-tyrosine phosphatase 1B inhibitor binding. Journal of Biological Chemistry. 2006;281:5258–5266. doi: 10.1074/jbc.M511546200. [DOI] [PubMed] [Google Scholar]
- 38.Engel M, Hindie V, Lopez-Garcia LA, Stroba A, Schaeffer F, Adrian I, Imig J, Idrissova L, Nastainczyk W, Zeuzem S, Alzari PM, Hartmann RW, Piiper A, Biondi RM. Allosteric activation of the protein kinase PDK1 with low molecular weight compounds. Embo Journal. 2006;25:5469–5480. doi: 10.1038/sj.emboj.7601416. [DOI] [PMC free article] [PubMed] [Google Scholar]
- 39.Akerboom J, Rivera JDV, Guilbe MMR, Malave ECA, Hernandez HH, Tian L, Hires SA, Marvin JS, Looger LL, Schreiter ER. Crystal Structures of the GCaMP Calcium Sensor Reveal the Mechanism of Fluorescence Signal Change and Aid Rational Design. Journal of Biological Chemistry. 2009;284:6455–6464. doi: 10.1074/jbc.M807657200. [DOI] [PMC free article] [PubMed] [Google Scholar]
- 40.Hang JQ, Yang YL, Harris SF, Leveque V, Whittington HJ, Rajyaguru S, Ao-Ieong G, McCown MF, Wong A, Giannetti AM, Le Pogam S, Talamas F, Cammack N, Najera I, Klumpp K. Slow Binding Inhibition and Mechanism of Resistance of Non-nucleoside Polymerase Inhibitors of Hepatitis C Virus. Journal of Biological Chemistry. 2009;284:15517–15529. doi: 10.1074/jbc.M808889200. [DOI] [PMC free article] [PubMed] [Google Scholar]
- 41.Witkowski WA, Hardy JA. L2 ‘ loop is critical for caspase-7 active site formation. Protein Science. 2009;18:1459–1468. doi: 10.1002/pro.151. [DOI] [PMC free article] [PubMed] [Google Scholar]
- 42.Rydberg EH, Cellucci A, Bartholomew L, Mattu M, Barbato G, Ludmerer SW, Graham DJ, Altamura S, Paonessa G, De Francesco R, Migliaccio G, Carfi A. Structural Basis for Resistance of the Genotype 2b Hepatitis C Virus NS5B Polymerase to Site A Non-Nucleoside Inhibitors. Journal of Molecular Biology. 2009;390:1048–1059. doi: 10.1016/j.jmb.2009.06.012. [DOI] [PubMed] [Google Scholar]
- 43.Hardy JA, Wells JA. Dissecting an Allosteric Switch in Caspase-7 Using Chemical and Mutational Probes. Journal of Biological Chemistry. 2009;284:26063–26069. doi: 10.1074/jbc.M109.001826. [DOI] [PMC free article] [PubMed] [Google Scholar]
- 44.Giardine B, Borg J, Higgs DR, Peterson KR, Philipsen S, Maglott D, Singleton BK, Anstee DJ, Basak AN, Clark B, Costa FC, Faustino P, Fedosyuk H, Felice AE, Francina A, Galanello R, Gallivan MVE, Georgitsi M, Gibbons RJ, Giordano PC, Harteveld CL, Hoyer JD, Jarvis M, Joly P, Kanavakis E, Kollia P, Menzel S, Miller W, Moradkhani K, Old J, Papachatzopoulou A, Papadakis MN, Papadopoulos P, Pavlovic S, Perseu L, Radmilovic M, Riemer C, Satta S, Schrijver I, Stojiljkovic M, Thein SL, Traeger-Synodinos J, Tully R, Wada T, Waye JS, Wiemann C, Zukic B, Chui DHK, Wajcman H, Hardison RC, Patrinos GP. Systematic documentation and analysis of human genetic variation in hemoglobinopathies using the microattribution approach. Nature Genetics. 2011;43:295–302. doi: 10.1038/ng.785. [DOI] [PMC free article] [PubMed] [Google Scholar]
- 45.Zelent B, Odili S, Buettger C, Zelent DK, Chen P, Fenner D, Bass J, Stanley C, Laberge M, Vanderkooi JM, Sarabu R, Grimsby J, Matschinsky FM. Mutational analysis of allosteric activation and inhibition of glucokinase. Biochemical Journal. 2011;440:203–215. doi: 10.1042/BJ20110440. [DOI] [PMC free article] [PubMed] [Google Scholar]
- 46.Dey S, Chakrabarti P, Janin J. A survey of hemoglobin quaternary structures. Proteins. 2011;79:2861–70. doi: 10.1002/prot.23112. [DOI] [PubMed] [Google Scholar]
- 47.Pineda AO, Carrell CJ, Bush LA, Prasad S, Caccia S, Chen ZW, Mathews FS, Di Cera E. Molecular dissection of Na+ binding to thrombin. Journal of Biological Chemistry. 2004;279:31842–31853. doi: 10.1074/jbc.M401756200. [DOI] [PubMed] [Google Scholar]
- 48.Pineda AO, Chen ZW, Bah A, Garvey LC, Mathews FS, Di Cera E. Crystal structure of thrombin in a self-inhibited conformation. Journal of Biological Chemistry. 2006;281:32922–32928. doi: 10.1074/jbc.M605530200. [DOI] [PubMed] [Google Scholar]
- 49.Ota N, Agard DA. Intramolecular signaling pathways revealed by modeling anisotropic thermal diffusion. Journal of Molecular Biology. 2005;351:345–354. doi: 10.1016/j.jmb.2005.05.043. [DOI] [PubMed] [Google Scholar]
- 50.Sharp K, Skinner JJ. Pump-probe molecular dynamics as a tool for studying protein motion and long range coupling. Proteins-Structure Function and Bioinformatics. 2006;65:347–361. doi: 10.1002/prot.21146. [DOI] [PubMed] [Google Scholar]
- 51.Chennubhotla C, Bahar I. Signal propagation in proteins and relation to equilibrium fluctuations. Plos Computational Biology. 2007;3:1716–1726. doi: 10.1371/journal.pcbi.0030172. [DOI] [PMC free article] [PubMed] [Google Scholar]
- 52.Liu J, Nussinov R. Allosteric effects in the marginally stable von Hippel-Lindau tumor suppressor protein and allostery-based rescue mutant design. Proc Natl Acad Sci U S A. 2008;105:901–6. doi: 10.1073/pnas.0707401105. [DOI] [PMC free article] [PubMed] [Google Scholar]
- 53.Tehver R, Chen J, Thirumalai D. Allostery Wiring Diagrams in the Transitions that Drive the GroEL Reaction Cycle. Journal of Molecular Biology. 2009;387:390–406. doi: 10.1016/j.jmb.2008.12.032. [DOI] [PubMed] [Google Scholar]
- 54.Demerdash ONA, Daily MD, Mitchell JC. Structure-Based Predictive Models for Allosteric Hot Spots. Plos Computational Biology. 2009;5 doi: 10.1371/journal.pcbi.1000531. [DOI] [PMC free article] [PubMed] [Google Scholar]
- 55.Pan H, Lee JC, Hilser VJ. Binding sites in Escherichia coli dihydrofolate reductase communicate by modulating the conformational ensemble. Proceedings of the National Academy of Sciences of the United States of America. 2000;97:12020–12025. doi: 10.1073/pnas.220240297. [DOI] [PMC free article] [PubMed] [Google Scholar]
- 56.Boyce SE, Mobley DL, Rocklin GJ, Graves AP, Dill KA, Shoichet BK. Predicting Ligand Binding Affinity with Alchemical Free Energy Methods in a Polar Model Binding Site. Journal of Molecular Biology. 2009;394:747–763. doi: 10.1016/j.jmb.2009.09.049. [DOI] [PMC free article] [PubMed] [Google Scholar]
- 57.McGillick BE, Balius TE, Mukherjee S, Rizzo RC. Origins of Resistance to the HIVgp41 Viral Entry Inhibitor T20. Biochemistry. 2010;49:3575–3592. doi: 10.1021/bi901915g. [DOI] [PMC free article] [PubMed] [Google Scholar]
- 58.Potapov V, Cohen M, Schreiber G. Assessing computational methods for predicting protein stability upon mutation: good on average but not in the details. Protein Engineering Design & Selection. 2009;22:553–560. doi: 10.1093/protein/gzp030. [DOI] [PubMed] [Google Scholar]
- 59.Frederick KK, Marlow MS, Valentine KG, Wand AJ. Conformational entropy in molecular recognition by proteins. Nature. 2007;448:325–U3. doi: 10.1038/nature05959. [DOI] [PMC free article] [PubMed] [Google Scholar]
- 60.Ferreiro DU, Hegler JA, Komives EA, Wolynes PG. On the role of frustration in the energy landscapes of allosteric proteins. Proceedings of the National Academy of Sciences of the United States of America. 2011;108:3499–3503. doi: 10.1073/pnas.1018980108. [DOI] [PMC free article] [PubMed] [Google Scholar]
- 61.Zheng WJ, Brooks BR, Thirumalai D. Low-frequency normal modes that describe allosteric transitions in biological nanomachines are robust to sequence variations. Proceedings of the National Academy of Sciences of the United States of America. 2006;103:7664–7669. doi: 10.1073/pnas.0510426103. [DOI] [PMC free article] [PubMed] [Google Scholar]
- 62.Sali A, Blundell TL. Comparative protein modeling by satisfaction of spatial restraints. Journal of Molecular Biology. 1993;234:779–815. doi: 10.1006/jmbi.1993.1626. [DOI] [PubMed] [Google Scholar]
- 63.Chen YC, Lim C. Common physical basis of macromolecule-binding sites in proteins. Nucleic Acids Research. 2008;36:7078–7087. doi: 10.1093/nar/gkn868. [DOI] [PMC free article] [PubMed] [Google Scholar]
- 64.Dobry A, Fruton JS, Sturtevant JM. Thermodynamics of hydrolysis of peptide bonds. Jour Biol Chem. 1952;195:149–154. [PubMed] [Google Scholar]
- 65.Hoecker A, Speckmayer P, Stelzer J, Therhaag J, von Toerne E, Voss H. TMVA: Toolkit for Multivariate Data Analysis. PoS. 2007;ACAT:040. [Google Scholar]
- 66.Breiman L, Friedman J, Olshen R, Stone C. Classification and Regression Trees. Taylor & Francis Ltd Chapman & Hall/CRC; Wadsworth: 1984. [Google Scholar]
- 67.Tsai CJ, del Sol A, Nussinov R. Allostery: absence of a change in shape does not imply that allostery is not at play. J Mol Biol. 2008;378:1–11. doi: 10.1016/j.jmb.2008.02.034. [DOI] [PMC free article] [PubMed] [Google Scholar]
Associated Data
This section collects any data citations, data availability statements, or supplementary materials included in this article.