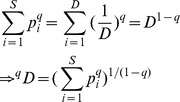
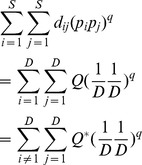
There is an error in Table 1, “A framework for Hill numbers, functional Hill numbers, mean functional diversity and (total) functional diversity of a single assemblage.” Please see the corrected Table 1 here.
Table 1. A framework for Hill numbers, functional Hill numbers, mean functional diversity and (total) functional diversity of a single assemblage.
| Abundance vector/matrix | weights | q-th power sum ( q≠1) | Equating the two q-th power sums | |
| (1) Hill numbers | ||||
| Actual assemblage | S species with relative abundance vector: | Unity weight for each species |

|

|

|
(1, 1, …., 1) | |||
| Idealized reference assemblage | D equally-abundant species | Unity weight for each species |

|
(Hill number of order q) |

|
(1, 1, …., 1) | |||
| (2) Functional Hill number, mean functional diversity and (total) functional diversity | ||||
| Actual assemblage |
 matrix of the product of relative abundances for pairs of species matrix of the product of relative abundances for pairs of species
|
 distance matrix as weight distance matrix as weight
|

|

|
| Idealized reference assemblage | D×D matrix of the product of equal relative abundances for pairs of species | D×D idealized distance matrix as weights |
 Or Or 
|

|

|

|
(Functional Hill number = number of rows or columns in the idealized distance matrix) 
|
||
| or | ||||

|
(Mean functional diversity = column/row sum in the idealized distance matrix) | |||
| Q* = QD /(D −1) |

|
|||
| (Total functional diversity = grand sum of the idealized distance matrix) | ||||
There are formatting errors in the Supporting Information files Appendix S1, Appendix S2, Appendix S3, Appendix S4, and Appendix S5. Please view the correct Appendix S1, Appendix S2, Appendix S3, Appendix S4, and Appendix S5 here.
Supporting Information
Some properties of the proposed functional diversity measures.
(PDF)
Decomposition of the proposed functional diversity measures.
(PDF)
Four classes of functional similarity/differentiation measures.
(PDF)
Functional beta diversity and functional diversity excess lead to the same classes of similarity and differentiation measures.
(PDF)
Supplementary examples and comparisons.
(PDF)
Reference
- 1. Chiu C-H, Chao A (2014) Distance-Based Functional Diversity Measures and Their Decomposition: A Framework Based on Hill Numbers. PLoS ONE 9(7): e100014 doi:10.1371/journal.pone.0100014 [DOI] [PMC free article] [PubMed] [Google Scholar]
Associated Data
This section collects any data citations, data availability statements, or supplementary materials included in this article.
Supplementary Materials
Some properties of the proposed functional diversity measures.
(PDF)
Decomposition of the proposed functional diversity measures.
(PDF)
Four classes of functional similarity/differentiation measures.
(PDF)
Functional beta diversity and functional diversity excess lead to the same classes of similarity and differentiation measures.
(PDF)
Supplementary examples and comparisons.
(PDF)


