Abstract
Exposure to loud, prolonged sounds (acoustic trauma, AT) leads to the death of both inner and outer hair cells (IHCs and OHCs), death of neurons of the spiral ganglion and degeneration of the auditory nerve. The auditory nerve (8cn) projects to the three subdivisions of the cochlear nuclei (CN), the dorsal cochlear nucleus (DC) and the anterior (VCA) and posterior (VCP) subdivisions of the ventral cochlear nucleus. There is both anatomical and physiological evidence for plastic reorganization in the denervated CN after AT. Anatomical findings show axonal sprouting and synaptogenesis; physiologically there is an increase in spontaneous activity suggesting reorganization of circuitry. The mechanisms underlying this plasticity are not understood. Recent data suggest that activated microglia may have a role in facilitating plastic reorganization in addition to removing trauma-induced debris. In order to investigate the roles of activated microglia in the CN subsequent to acoustic trauma we exposed animals to bilateral noise sufficient to cause massive hair cell death. We studied four groups of animals at different survival times: 30 days, 60 days, 6 months and 9 months. We used silver staining to examine the time course and pattern of auditory nerve degeneration, and immunohistochemistry to label activated microglia in the denervated CN. We found both degenerating auditory nerve fibers and activated microglia in the CN at 30 and 60 days and 6 months after AT. There was close geographic overlap between the degenerating fibers and activated microglia, consistent with a scavenger role for activated microglia. At the longest survival time, there were still silver-stained fibers but very little staining of activated microglia in overlapping regions. There were, however, activated microglia in the surrounding brainstem and cerebellar white matter.
Keywords: deafness, noise exposure, inflammation, synaptic stripping, macrophages
Introduction
The auditory system manifests a remarkable degree of plasticity in response to denervation. One form of denervation follows exposure to prolonged, loud sounds (acoustic trauma, AT); AT results in the death of hair cells and degeneration of the auditory nerve (reviews in Saunders et al., 1985, Kujawa and Liberman, 2009, Gold and Bajo, 2014). Axons of the acoustic nerve synapse in the three subdivisions of the cochlear nuclei (CN), the dorsal cochlear nucleus (DC), and the posterior (VCP) and anterior (VCA) subdivisions of the ventral cochlear nucleus (Cohen et al., 1972, Kane, 1974, Jones and Casseday, 1979). Noise trauma therefore removes a major input to these structures. There are both anatomical and electrophysiological data showing plastic reorganization in the CN after AT. Changes include the formation of new synapses and axonal sprouting (Benson et al., 1997, Bilak et al., 1997, Michler and Illing, 2002, Kim et al., 2004a, Kim et al., 2004c, b, Dong et al., 2010b). There is an increase of somatosensory input to the DC (Shore et al., 2008, Koehler et al., 2011, Dehmel et al., 2012, Zeng et al., 2012). Physiologically, there is an increase in spontaneous activity, suggesting significant reorganization of CN circuitry (Kaltenbach and McCaslin, 1996, Kaltenbach et al., 1998, Zhang and Kaltenbach, 1998, Kaltenbach, 2007, Mulders and Robertson, 2013, Groschel et al., 2014).
The critical mechanisms mediating this plasticity are not understood. Recent attention has focused on the possible role activated microglia may play in facilitating synaptic plasticity, both injury- and experience-induced, in several systems (Banati, 2002, Beggs and Salter, 2010, Tremblay and Majewska, 2011, Beynon and Walker, 2012). At present, little is known about the role of microglia in noise trauma-induced changes in the CN. Several studies have described activated microglia in the CN after cochlear lesions (Campos Torres et al., 1999, Fuentes-Santamaria et al., 2012, Janz and Illing, 2014) and proposed a role for activated microglia in CN plasticity. However, it is possible that the activated microglia were simply serving their traditional role as scavengers (Kreutzberg, 1996), removing the debris from auditory nerve degeneration. Auditory nerve degeneration was not examined in those reports. We therefore compared the distributions of degenerating auditory nerve fibers and activated microglia after noise exposure; overlap would support the “scavenger” hypothesis whereas more widespread microglia activation would be suggestive of a role in guiding neuroplasticity.
EXPERIMENTAL PROCEDURES
Animals
We followed the National Institute of Health Guide for the Care and Use of Laboratory Animals (NIH Publications No. 80-23) revised 1996. Animal experiments were reviewed and approved by the Institutional Animal Care and Use Committee of the University at Buffalo. We used a total of 17 adult (ages 2-3 months at time of noise exposure) male, albino SASCO Sprague-Dawley rats from Charles River Laboratories (Wilmington, MA). Animals were pair-housed and had ad lib. access to water and standard laboratory rodent chow. They were maintained on a 12 hour light-dark cycle.
Bilateral noise exposure (acoustic trauma, AT)
We exposed animals to bilateral noise. Under isoflurane anesthesia (Webster Veterinary Supply Inc., Sterling, MA, 4% induction 1.5%-2% maintenance) rats were exposed to narrowband noise (bandwidth 100 Hz) centered at 12 kHz, 126 SPL for 2 h. Sound stimuli were generated by Tucker-Davis Technology (TDT, Alachya FL) hardware and presented by a super compression driver (D-59l GMI Sound Corp., Brooklyn NY). The SPL was calibrated with a sound level meter coupled to a half-inch condenser microphone (Model 824 Audiometer, Larson Davis, Depew, NY). The control animals were anesthetized but not exposed to the noise stimulus.
We used four different survival times, 30 days (n = 3 experimental, n = 3 controls), 60 days (n =3), 6 months (200 days; n = 2 AT; n = 2 controls) and 9 months (284 days; n= 2 AT; n= 2 controls). At the end of the survival time rats were deeply anesthetized with 86 mg/kg i.p. of Fatal-plus (Vortech, Pharmaceutical Ltd.) and perfused through the heart with 0.1M phosphate buffered saline (PBS) followed by 4% paraformaldehyde (PFA) in PBS. The brains were removed and divided into two blocks in the coronal plane at approximately Bregma -5.30 (Paxinos and Watson, 1997). The blocks were post-fixed in 4% PFA overnight and then cryoprotected in 15% sucrose and then 30% sucrose in PBS. We made a small slit on the ventral surface of the brain on one side to be able to distinguish left and right. Frozen sections 40 μm thick were cut in the coronal plane on an AO sliding microtome equipped with a custom built freezing platform. All sections were collected and stored in tissue culture wells in a cryoprotection solution of 30% ethylene glycol and 30% glycerol in phosphate buffer at -20°C.
Immunohistochemistry
All processing was performed on free-floating sections. Sections were removed from the cryoprotectant and rinsed in PBS (all rinses were 3 × 10 min). Non-specific binding of primary antibodies was blocked by incubating the sections in a solution of 1% bovine serum albumin (BSA, Sigma), 1.5 % normal horse serum (NHS, Vector Laboratories, Burlingame, CA) and 0.1% TritonX-100 (TX) in PBS for 30 min. The primary antibody was added and the sections incubated overnight at 4° C. Table 1 shows the primary antibodies and dilutions used. Sections were then rinsed and incubated in the appropriate biotinylated secondary antibody (Vector Laboratories following manufacturer’s instructions); further processing was with the Vector ABC method using the Vectastain Elite kit. Immunoreactivity was visualized using the glucose oxidase modification of the diaminobenzidine (DAB) method (Shu et al., 1988, Van Der Gucht et al., 2006).
Table 1.
Antibodies and dilutions
| Antigen | Company, Catalogue # | host | dilution |
|---|---|---|---|
|
| |||
| CD11b | AbD Serotech | Ms | 1:300 |
| Cat # MCA275R | |||
|
| |||
| CD68 | AbD Serotech | Ms | 1:500 |
| Cat #: MCA341GA | |||
|
| |||
| OX6 | AbD Serotech | Ms | 1:300 |
| Cat #: MCA46R | |||
|
| |||
| SV2 | Developmental Studies | Ms | 1:50 |
| Hybridoma Bank, supernatant form | |||
Antibody characterization and specificity
CD11b (Serotech #MCA275R)
The immunogen was resident in rat peritoneal macrophages. The antibody recognized the rat integrin alpha-M, the receptor for the iC3b component of complement, expressed on most macrophages, and recognizes brain microglia (Manufacturer’s data sheet and Robinson et al., 1986). The antibody immunoprecipitates polypeptide chains of 160 and 95 kDa (Robinson et al., 1986). Antibodies to CD11b have been used to immunostain microglia in brain (Jeong et al., 2010, Maroso et al., 2011, Fuentes-Santamaria et al., 2013).
CD68 (Serotech #MCA341GA)
The protein ED1/cd68 was first recognized in the cytoplasm of peripheral macrophages and is considered a macrophage marker, with the level of expression correlated with phagocytosis (Damoiseaux et al., 1994). It is only weakly expressed on the cell surface. The properties of this antibody were summarized by Damm et al. (2011), based in part on information from the manufacturer. The antibody recognizes a glycosylated protein of 90–110 kD; the level of CD68 expression in a cell is correlated with phagocytic activity. The antibody has been used specifically to immunostain microglia in rat or mouse brain sections and in primary glial cultures (Bauer et al., 1994, Hughes et al., 2002, Wuchert et al., 2009).
OX6 (Serotech #MCA46R)
As summarized by Berglof et al. (2009), the antibody was raised against rat thymocyte membrane, purified by affinity chromatography on Protein G from tissue culture supernatant and recognizes a monomorphic determinant of the rat 1-A antigen. It has been used to label activated microglia (Ogura et al., 1994, Cho et al., 2006).
SV2 (DSHB, supernatant form)
The monoclonal antibody SV2, developed by Dr. K. M. Buckley, was obtained from the Developmental Studies Hybridoma Bank, created by the NICHD of the NIH and maintained at The University of Iowa, Department of Biology, Iowa City, IA 52242. The SV2 monoclonal antibody was raised against unique components of cholinergic synaptic vesicles from the electric organ of Discopyge ommata and recognizes a band of 75–110 kDa in immunoblots of brain synaptosomes (Wahlin et al., 2008). The antibody has been used as a marker of presynaptic terminals (D’Sa et al., 2007).
Silver staining
We used the FD Neurotechnologies NeuroSilver kit (FD NeuroTechnologies, Inc., Ellicott City, MD) to stain degenerating axons and neurons. For each case, we selected sections approximately 500 μm apart through the cochlear nuclei. Sections were removed from the cryoprotection solution, rinsed, incubated in 4% PFA for 5 days and then processed according to manufacturer’s instructions. Several steps in the protocol require vigorous agitation of the tissue and some sections have holes or tears as a result (e.g. Fig. 2D).
Figure 2.
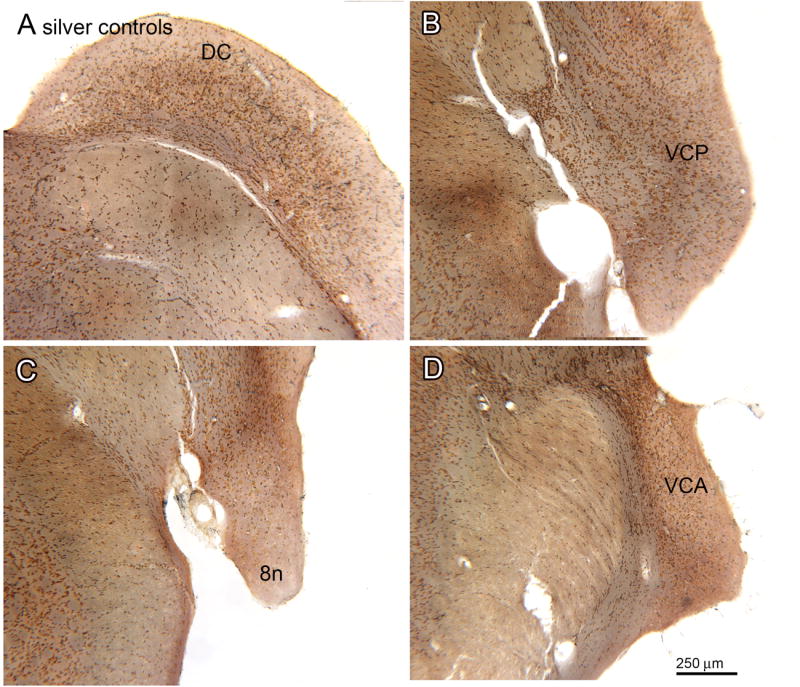
Absence of silver staining in the CN of control animals. A. Section through the DC (bregma -11.558). B. Section through the VCP (bregma -11.195). C. Section through the 8n and VCP (bregma -10.568). D. Section through the VCA (bregma -9.842). Scale bar also for A, B, C.
Data analysis and microscopy
Slides were examined with a Leitz Dialux 20 light microscope, and digital images (1200 × 1600 pixels) captured with a SPOT Insight Color Mosaic camera mounted on that microscope. Brightness and contrast of images were adjusted and plates assembled with Adobe Photoshop software (Adobe, San Jose CA). For ease of comparison, all images are shown as on the right. We use the abbreviations of Paxinos (Paxinos and Watson, 1997, Paxinos, 1999) for the subdivisions of the cochlear nuclei (CN), the dorsal cochlear nucleus (DC), and the posterior (VCP) and anterior (VCA) divisions of the ventral cochlear nucleus (VCN). We used the atlas of Paxinos (1999) to assign bregma levels to each of the sections shown in the Figures. We matched our sections to those in the atlas; the bregma level of the atlas plate that is the best fit to each section is noted in the Figure Legends.
Hair cell loss: cochleograms
To quantify the amount of noise-induced sensory receptor cell damage, we removed the cochlea and dissected the organ of Corti out of the cochlea as a flat surface preparation. It was then stained with Harris’ Hematoxylin solution as described in detail in previous publications (Ding et al., 2001, Ding et al., 2002). The basal, middle and apical turns of the organ of Corti were carefully removed, mounted on glass slides in glycerin, coverslipped and examined from base to apex under a microscope (Zeiss Standard, 400; Carl Zeiss MicroImaging, Inc., Thornwood, NY, USA). Cochleograms were prepared as previously described (Kraus et al., 2010). Hair cells with intact cell body and cuticular plate were counted in 0.24 mm intervals along the entire length of the cochlea. The graphs (Fig. 1A-D) show the percent missing outer (OHC) and inner (IHC) hair cells as a function of the percent distance from the apex of the cochlea for cochleas at each of the four survival times.
Figure 1.
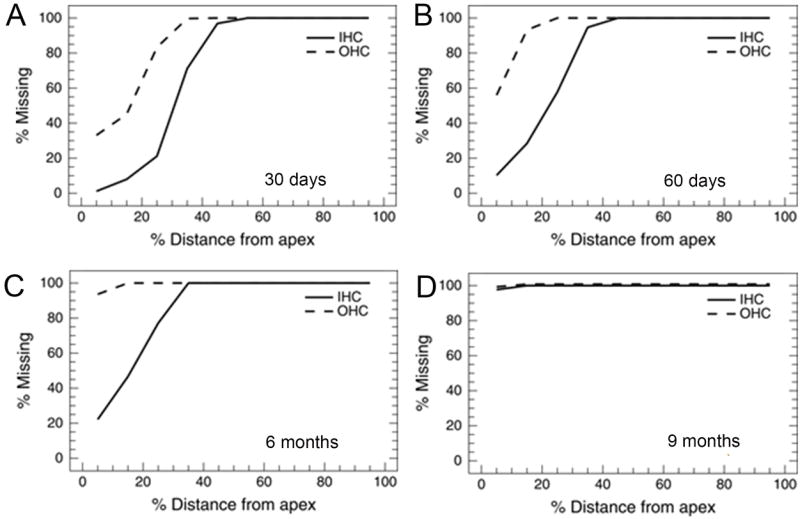
Inner (IHC) and outer (OHC) hair cell loss as a function of distance from the apex of the basilar membrane at four different survival times. A. 30 day survival animals. B. 60 day survival animals. C. 6 month survival animals. D. 9 month survival animals.
Results
Our results show, as expected, that noise exposure, results in the death of receptor cells and degeneration of the auditory nerve. Our results also show that there are activated microglia in the CN in regions that overlap the degeneration at the 30 and 60 day survival times and, to a lesser extent at the 6 month survival time. Degenerating axons are still seen at the longest survival time but there is a decrease in staining of OX6-ir microglia.
Noise exposure: hair cell loss
We first needed to verify that the noise exposure paradigm resulted in hair cell death. There are two types of receptor cells in the cochlea, the inner hair cells and outer hair cells (IHC and OHC); these are differentially innervated by the auditory nerve with the most (90-95%) auditory nerve fibers innervating the IHCs and only a few percent the OHCs (Kim, 1984). Noise exposure caused a profound loss of both IHCs and OHCs. Figure 1 A-D shows cochleograms from the 30 day (Fig. 1A), 60 day (Fig. 1B), 6 month (Fig. 1C) and 9 month (Fig. 1D) survival animals. For the first three groups there is nearly complete loss of both the OHCs and IHCs extending from about 25%-30% of the distance from the apex (low frequencies) all the way to the base (high frequencies). These lesions cause a profound hearing loss over the entire hearing range of the rat except for the very low frequencies (Muller, 1991). For the 9 months survival group there is a total loss of hair cells; this would result in total deafness (Fig. 1D).
Degenerating auditory nerve fibers: silver staining
We next established that the silver staining protocol stained degenerating fibers. We found no evidence of stained fibers in the DC (Fig. 2A), VCP (Fig. 2B), 8n (Fig. 2C) or VCA (Fig. 2D) in sections from the 30 day survival control animals, or in the 6 and 9 month survival control animals (data not shown). These results suggest that the silver staining protocol does not stain normal axons. We next examined the CN in sections from the experimental animals and found silver stained axons in the expected regions of termination of the auditory nerve (Lorente de No, 1933, Harrison and Feldman, 1970, Osen, 1970, Cohen et al., 1972). Figure 3A shows a section through the VCP of a 60 day survival animal. There is a wide region of dense black silver staining (Fig. 3A, arrowheads). The higher magnification image (Fig. 3B) shows that this region is composed of black round or oval objects of a range of sizes, some arranged linearly (example at arrow). The distribution of the black staining is consistent with the descriptions of auditory nerve termination in the CN (Harrison and Feldman, 1970), and supports the idea that we are indeed staining degenerating fibers.
Figure 3.
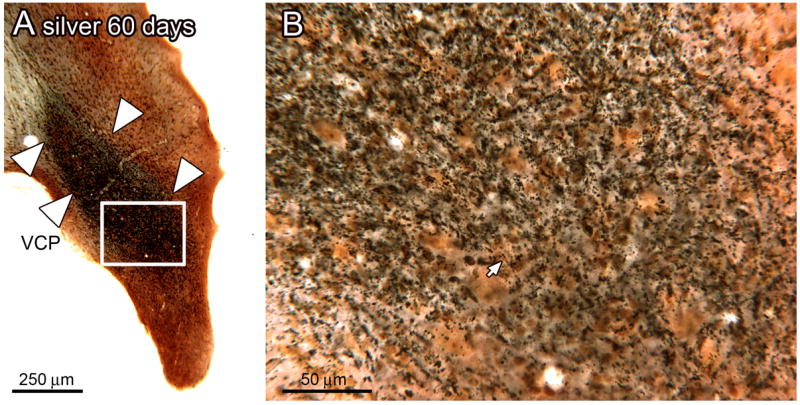
A. Dense silver staining in the VCP of an experimental animal, 60 day survival time. The white arrowheads mark the dense band of silver staining in the VCP (bregma -10.997). The rectangle shows the location of the higher magnification image in B. B. The staining is made of of black puncta, some of which are arranged in a line (arrow).
Resting and activated microglia in the CN
Microglia are ubiquitous in the central nervous system (summaries in Lawson et al., 1990, Kreutzberg, 1996). They exist in two forms, a resting state and an “activated” state, and shift from resting to activated in response to infection or injury to neurons or axons. There are both morphological and neurochemical changes associated with the transition. Resting microglia have small somata and long, thin mobile processes while activated microglia have thickened, shorter processes and rounder “amoeboid” cell bodies (reviews and references in Gehrmann et al., 1995, Kreutzberg, 1996, Schwartz et al., 2006, Block et al., 2007, Luo et al., 2010, Perego et al., 2011, Kettenmann et al., 2013).
We first examined the distribution of resting microglia in the normal cochlear nuclei using the antibody CD11b. Figure 4 shows pairs of photomicrographs through the cochlear nuclei of control animals with a lower magnification image on the left (panels A, C, E, G) and higher magnification images of the indicated regions on the right (panels B, D, F, and H). At all levels of the CN, resting microglia with small somata and ramified processes (white arrows in Fig. 4B, D, H) are distributed throughout, with the exception of the cochlear nerve root (Fig. 4E, F). We then examined the distribution of activated microglia in the CN of control animals. Figure 5 shows sections immunostained for OX6 at four levels of the CN. There are very few activated microglia in the CN and occasional OX6-labeled microglia scattered elsewhere in the brainstem (example in Fig. 5B, arrow). We then asked if activated microglia were seen in sections from the noise-exposed animals. Figure 6 shows OX6-ir elements distributed in both the VCA and VCP in a section from an experimental animal, 60 day survival. Figure 6B shows that these elements were of a variety of shapes, including examples with thickened processes (Fig. 6B, arrow).
Figure 4.
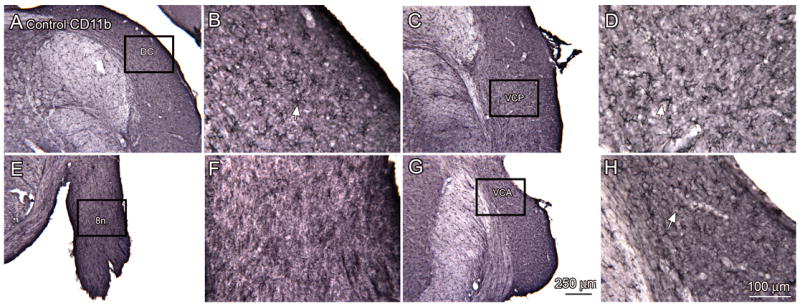
Distribution of resting microglia in the CN, sections from control animals. For each pair of images, the rectangle on the lower magnification image (A, C, E, G) shows the location of the higher magnification in the immediately adjacent panel (B, D, F, H.) A, B. DCN (bregma -11.261). The arrow in B shows an example of a labeled microglial cell. C, D. Resting microglia in the VCP more ventral on the same section (bregma -11.261). E, F. Absence of microglia in the 8n (bregma -11.030). G, H. Microglia in the VCA (bregma -9.974). Scale bar in G also for A, C, E. Scale bar in H also for B, D, G.
Figure 5.
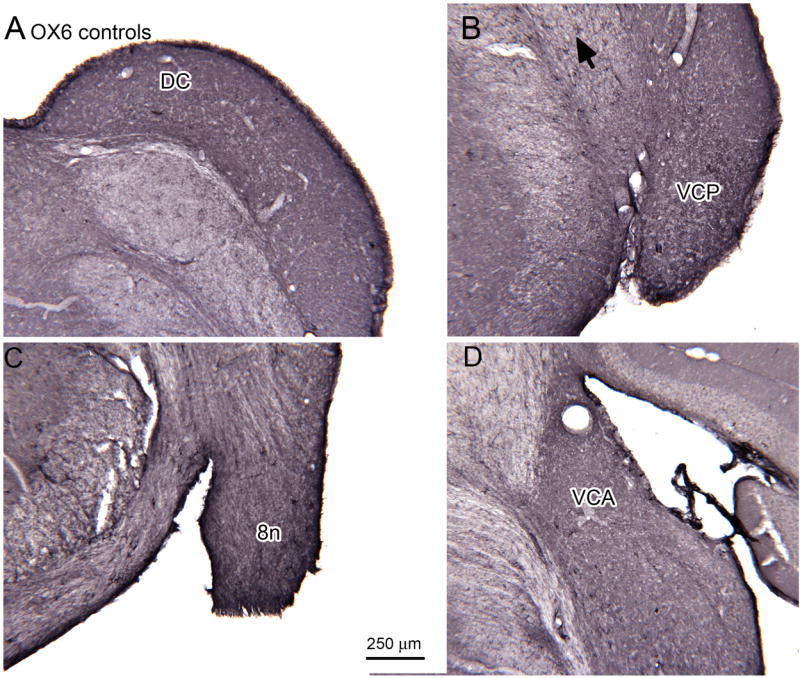
Absence of OX6-ir activated microglia in the CN of 30 day survival control animals shown on sections at four different levels; A is the most caudal. A. DC (bregma -11.624). B. VCP; the arrow indicates a labeled profile (bregma -11.195). C. 8n (bregma -10.964). D. VCA (bregma -10.370). Scale bar in C also for A, B, D.
Figure 6.
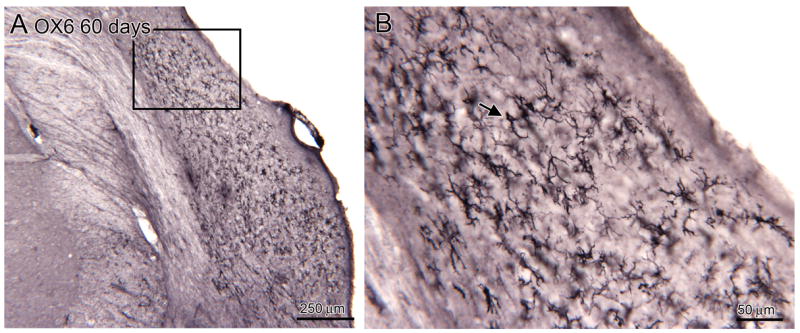
A. Distribution of activated microglia in the CN of an experimental animal, 60 day survival (bregma -10.898). The rectangle shows the location of the image in B. B. The labeled elements have a variety of shapes, some with thick processes (example at arrow), others with thin processes.
Overlap of degenerating fibers and activated microglia
Both silver staining of degenerating fibers and immunostaining of activated microglia were seen in the CN of experimental animals. We next examined the geographic relation between the two, comparing adjacent silver-stained and immunostained sections through the CN for the different survival times.
Figure 7 shows a series of sections from 30 day survival animals, arranged from most caudal (A, B) to most rostral (E, F). Each pair of sections (A, B; C, D; E, F) shows silver staining on the left and OX6-ir on the right on sections at the same bregma levels. All sections are shown as right side images. Figure 7A shows a band of degenerating fibers ventrally in the DC (arrow) and Figure 7B shows OX6-ir elements over a very similar region (arrow). Figure 7C shows a dense band of degenerating fibers (arrow) in the VCP. The inset shows that this band is again made up of black puncta of a range of sizes. Figure 7D shows OX6 immunostaining on an adjacent section. There is a region of dense OX6 immunoreactivity (arrow). The shapes and sizes of the activated microglia are shown in the inset. At this level, there is good overlap between the region of silver staining and the region of OX6 immunoreactivity. Figure 7E shows a section at a more rostral level with degenerating fibers in the auditory division of the eighth nerve (8cn, arrow). Figure 7F shows scattered OX6-ir elements at this level.
Figure 7.
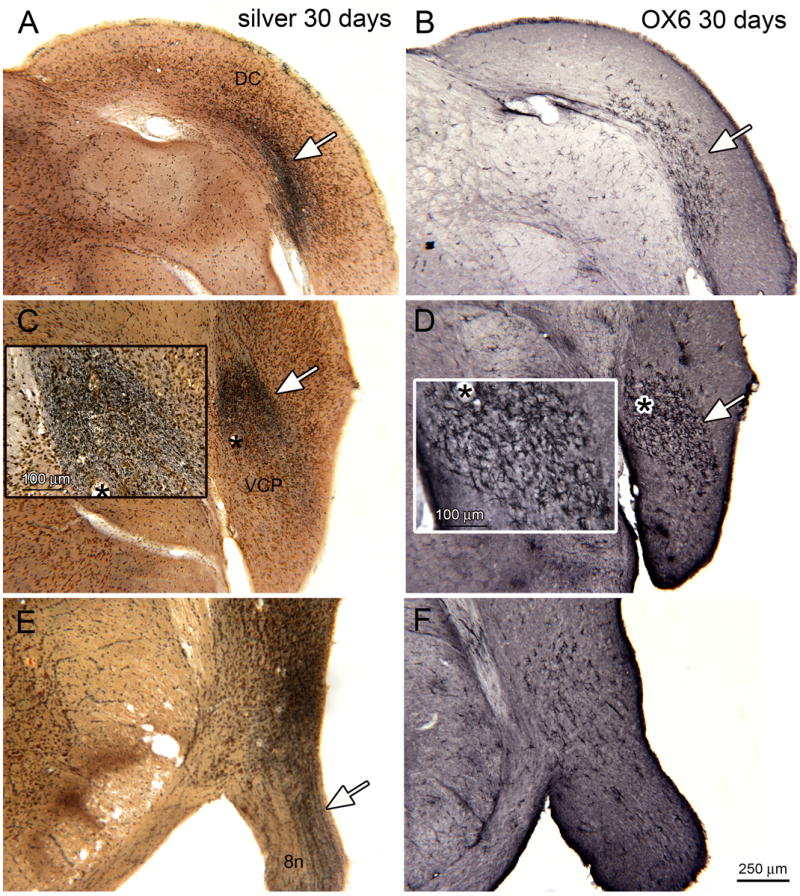
Silver staining and OX6 expression, bilateral noise exposure, 30 day survival. A. Band of silver staining (arrow) on a section through the DC (bregma -11.591). B. Adjacent staining showing a limited region of OX6 expression (white arrow). C. Silver staining (white arrow) in VCP (bregma -11.723). The asterisk is an alignment point for the inset. The inset shows a higher magnification image of the silver staining, showing dense black puncta. D. Adjacent section showing OX6 expression in the VCP. The asterisk is an alignment point for the inset that shows the appearance of the activated microglia. E. Silver staining (arrow) in the eighth nerve (bregma -11.096). F. Scattered OX6-ir profiles on an adjacent section.
Figure 8 shows the overall distributions of silver staining and OX6-ir for the 60 day survival animals. Both are seen in the same regions as in the 30 day survival animals, but the areas of staining for each were more extensive. As in the previous figure, each pair of sections (A, B; C, D; E, F) shows silver staining on the left and OX6-ir on the right on sections at the same bregma level. Figure 8A (arrow) shows a dense band of degenerating fibers in the DC extending from the medial limit of the DC to the dorsal border with VCP. Figure 8B (arrow) shows OX6-ir elements over this same region. Figure 8C shows a region of dark silver staining in the medial part of VCP. Figure 8D shows strong OX6 expression (arrow) with a distribution similar to the distribution of silver staining. Slightly more rostrally (Fig. 8E) the degenerating fibers are dense over the entire medio-lateral extent of the VCP, again with OX6-immunostaining over the same region (Fig. 8F, arrow).
Figure 8.
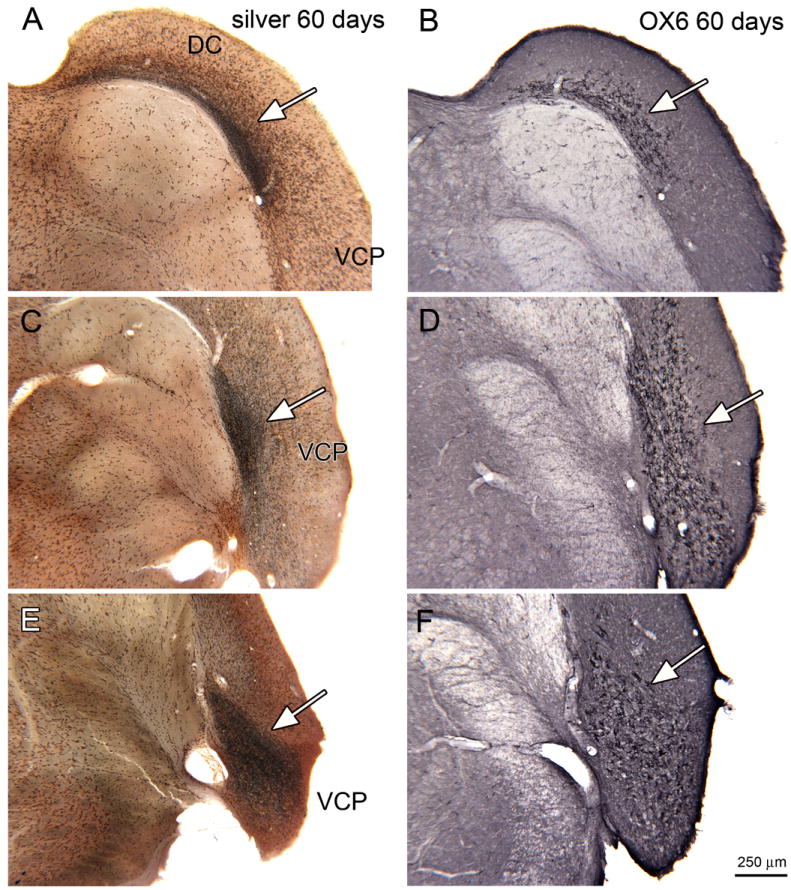
Silver staining and OX6 expression in the CN, 60 day survival. A. Silver staining on a section through the DC (bregma -11.624). The arrow shows the black band of stained fibers. B. An adjacent section immunostained to show OX6 expression. C. Silver stained section through VCP, the arrow indicates the region of darkest staining (bregma -11.591). D. Adjacent section showing the pattern of OX6 immunolabel, arrow. E. Silver staining in VCP (arrow; bregma -11.228). F. Parallel expression of OX6 (arrow). Scale bar also for A-E.
The pattern of OX6 immunoreactivity suggested activation of microglia over a region that largely overlapped the region of auditory nerve degeneration. Microglia undergo several different stages of activation; some, but not all, progress to have macrophage functions. CD68 is a macrophage marker and we compared OX6 and CD68 immunoreactivity on adjacent sections. The distribution of OX6 and CD68 immunoreactivity were similar. Figure 9A shows a broad region of OX6-ir in the VCP (Fig. 9A, arrowheads). Figure 9B shows that many labeled elements have relatively small somata and labeled processes (example at arrow). Figure 9C shows that CD68 immunoreactivity labels elements over the same region as the OX6-ir elements, but that they are not as numerous. As shown in Figure 9D, the CD68-ir elements are round, oval or irregular without stained processes, a typical macrophage appearance.
Figure 9.
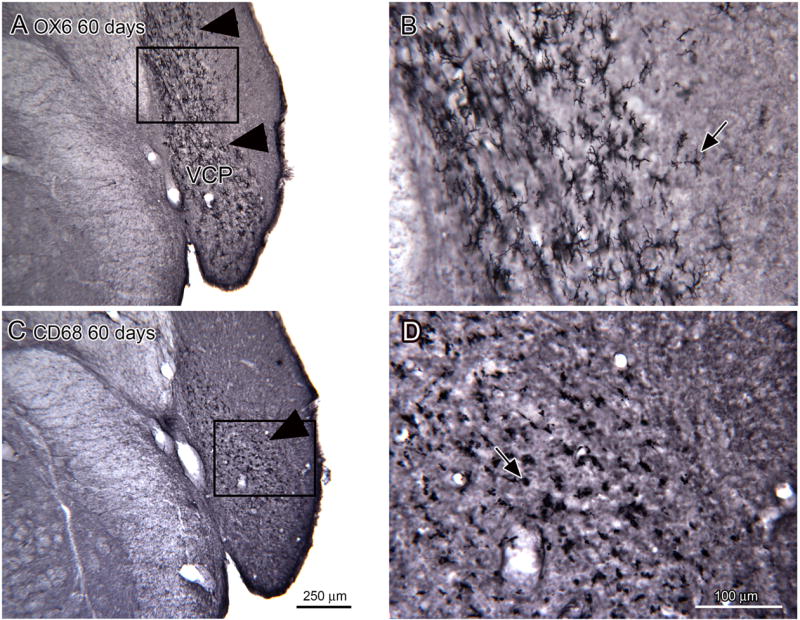
Comparison of OX6 and CD68 immunostaining in the CN of 60 day survival animals. A. Arrowheads show the region of dense OX6 expression in the VCP (bregma -11.723). The rectangle shows the location of the image in B. Shapes of OX6-ir elements. The arrow shows an example of a well-stained cell. C. More limited region of CD68 expression (arrow) in the VCP (bregma -11.723). The rectangle shows the location of the image in D. Scale bar also for A. D. The arrow (D) shows a CD68 immunostained cell with a round soma and no stained processes. Scale bar also for B.
Degeneration of the auditory nerve should result in deafferentation of the postsynaptic cells in the CN. We directly examined this using the antibody SV2, a marker of synaptic vesicle protein found in presynaptic terminals (Feany et al., 1992). Figure 10A, B shows SV2-ir in the VCP in a control animal. There are large neurons with round somata that are surrounded by a dense rim of immunoreactivity (Fig.10B, arrow); the stained elements likely are the terminals of auditory afferents. This pattern is not seen at a 30 day survival time (Fig. 5B and E). The paucity of SV2-ir suggests that there is massive loss of afferent terminals. After a 60 day survival a few outlined cells are seen (Fig. 10C, F).
Figure 10.
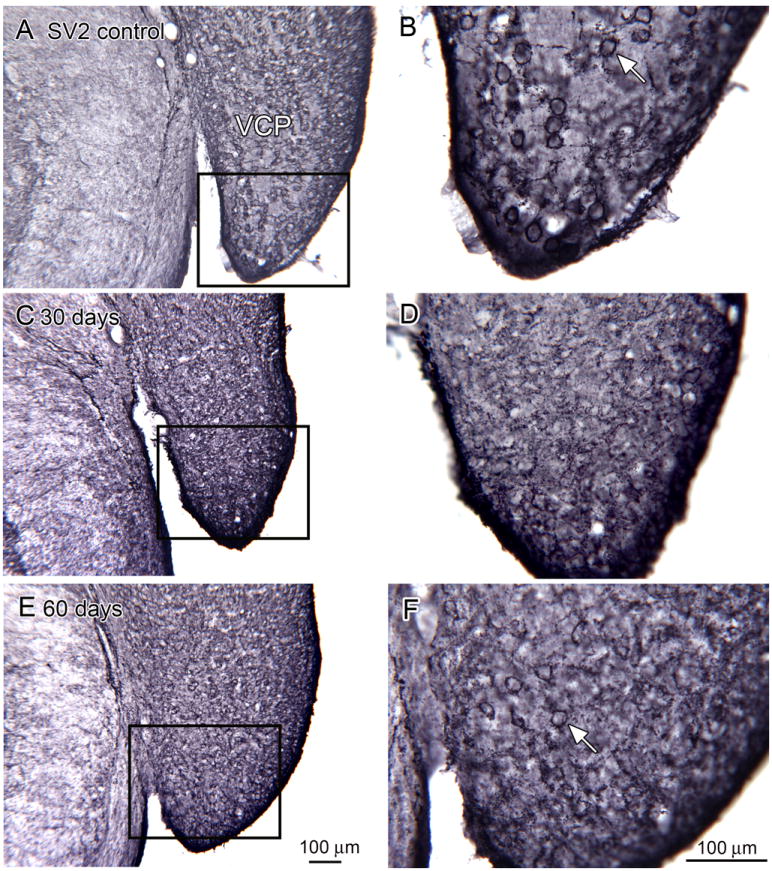
SV2 expression in the VCP in control (A, D; bregma -11.195), 30 day survival (B, E, bregma -11.195) and 60 day (C, F, bregma -11.195) animals. The rectangles in A, C, and E indicate the locations of the higher-magnification images in B, D and F.
Finally, we examined sections from the longer-survival animals. At the six month survival time there are still degenerating fibers in the CN. Figure 11A and 11C show there are silver-stained profiles (arrowheads) in the VCP (Fig. 11A) and 8cn (Fig. 11C). Figures 11B and 11D show OX6-ir microglia in regions that overlap, but are smaller than, the regions of silver-staining. A smaller region of degenerating fibers is also present in 9 month survival animals. Figure 11E shows a small region of silver-stained fibers (arrowhead) in the DC of a 9 month survival animal and Figure 11G shows silver-stained elements in the VCP of a second animal. At this survival time, however, relatively few OX6-ir elements are found in the CN (Fig. 11F, H). The inset in Fig. 11H shows that there are CD68-ir profiles in a region overlapping the region of silver-staining. There are many more OX6-ir microglia in the adjacent brainstem (Fig. 11F, H) and in cerebellar white matter (not shown) in the older animals than what was seen in the younger animals.
Figure 11.
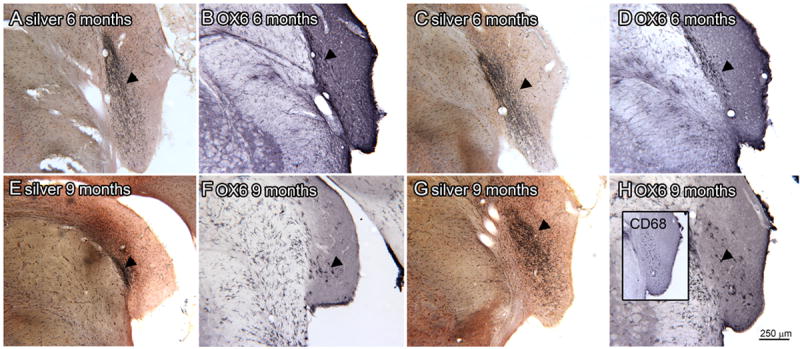
Silver staining and OX6 expression at 6 (A-D) and 9 (E-H) month survival times. A. Silver staining in VCP (arrowhead; bregma -11.195). B. An adjacent section showing OX6 expression within but smaller than the region of silver staining. C. Silver stained section through VCP and CN, the arrowhead indicates the region of darkest staining (bregma -11.096). D. Slightly more caudal section showing minimal OX6 immunolabel (arrowhead; bregma -11.195) E. Silver staining in DC (arrowhead; bregma -11.756). F. The arrowhead indicates a few OX6-ir elements on an adjacent section. G. Silver staining in the VCP (bregma -11.063). The inset shows CD68-r elements on an adjacent section. H. The arrowhead indicates an OX6-ir element on an adjacent section.
Discussion
Our long-term goal is to investigate the potential role of activated microglia in mediating the plastic changes seen in the CN subsequent to noise trauma. The traditional role of activated microglia is to act as scavengers (Kreutzberg, 1996); this role suggests that activated microglia should be found in regions of axonal degeneration. Our data support this hypothesis, with good geographic overlap between the distributions of degenerating auditory nerve fibers and activated microglia at all survival times. However, these data do not rule out other roles for activated microglia in plastic changes. We will therefore consider our results in the context of data on the time course of the anatomical, physiological and behavioral plastic changes induced by noise trauma.
Distribution and time course of auditory nerve degeneration
Our results on the pattern of projections of the auditory nerve to the CN are in good agreement with the earlier reports showing degenerating fibers in dorsal and ventral cochlear nuclei (Cohen et al., 1972, Kane, 1974, Albright et al., 1983, Kim et al., 2004a, Kim et al., 2004c, b, Feng et al., 2012). The decrease in SV2-labeled presynaptic terminals in the VCP compared to control animals also supports the interpretation that this silver staining protocol is in fact labeling degenerating auditory nerve fibers and terminals. We show that degeneration of the auditory nerve is well-underway by one month and is very dense at 2 months. Degenerating fibers are found 9 months after AT, indicative of a very long period of degeneration. While there is some species variation, degenerating fibers after noise trauma are first seen by 12 hrs-1 day, and are very dense after one month (Morest and Bohne, 1983, Kim et al., 1997, Muly et al., 2002). Degenerating fibers have been found in the CN eight months after noise exposure (Morest et al., 1998).
These results are also in agreement with other studies that have directly examined the time course of death of the neurons of the spiral ganglion (SGN) after AT. In general, loss of SGN neurons is delayed relative to hair cell death and also to the start of degeneration of auditory nerve fibers. Webster and Webster (1981) reported a decrease in SGN beginning at a month post-noise exposure in guinea pigs. Liberman and Kiang (1978) (cat) saw a loss of SGN beginning at about 45 days and increasing with longer survival times (>84 days). The delayed loss of SGN is consistent with the finding of degenerating fibers long after the AT.
In contrast to earlier reports we did not see silver-labeled fibers elsewhere in the auditory brainstem nor in the cerebellum; such fibers have been described in chinchilla (Morest and Bohne, 1983, Morest et al., 1997). This may reflect a species difference, the time points we examined, or limitations of this silver staining procedure.
Time course and possible roles of microglia activation
Gehrmann et al. (1995) proposed two classes of activated microglia, hypertrophic, but not phagocytic microglia; these would be recognized by the OX6 but not by the CD68 antibodies. The second class was the fully phagocytic microglia, recognized by both the OX6 and CD68 antibodies. In our sections, OX6 labeled profiles with a wide range of shapes with processes visible on many examples. The CD68-ir elements were much more uniform in shape, round or oval with few stained processes, consistent with their transformation into macrophages.
We compared the distribution of silver staining and OX6-ir and found that they were very closely matched. Very similar results have been reported for the visual system with activated microglia geographically and temporally aligned with degenerating fibers of the optic nerve (Rao and Lund, 1993). The spatial and temporal overlap of degenerating fibers and microglia, along with the CD68-ir, are consistent with a “scavenger” role for activated microglia in the CN after noise trauma, removing the debris resulting from axonal degeneration. This may include “synaptic stripping,” removing dysfunctional inputs and allowing for the possibility of new synaptic input (Kettenmann et al., 2013). The roles of activated microglia may be very different in neurodegenerative diseases; microglia may have a “destroyer” role; actively facilitating the degenerative processes of Alzheimer’s disease, amyotrophic lateral sclerosis, multiple sclerosis and other neurodegenerative disorders (Barger and Harmon, 1997, Streit, 2004, Ponomarev et al., 2006, Block et al., 2007, Luo et al., 2010).
Activated microglia after acoustic trauma
Our data support the traditional “scavenger” role of activated microglia in the CN subsequent to noise trauma at the time points examined. The data on the timing of physiological and anatomical indicators of plasticity suggest major temporal overlap with the time of auditory nerve degeneration and microglia activation. A physiological measure of plasticity after noise trauma, an increase in spontaneous activity, begins at about five days after noise exposure, and persists for as long as 180 days (Kaltenbach and McCaslin, 1996, Kaltenbach et al., 1998, Kaltenbach and Afman, 2000, Kaltenbach et al., 2000). Data from the somatosensory system suggest the denervation-induced increase in spontaneous activity might contribute to the activation of microglia (Xie et al., 2009). Anatomical measures of plasticity suggest plastic processes that continue for months after noise exposure. Bilak et al. (1997) reported the growth of fine axons in the CN over a period of 2-8 months after noise trauma. Muly et al. (2002) found evidence of synaptogenesis beginning as early as 14 days and continuing up to 90 days (12 weeks) post trauma. Kim et al. (2004a) saw evidence of synaptogenesis over about 16-32 weeks posttrauma. Michler and Illing (2002) reported an increase in GAP-43, a protein associated with synaptogenesis, in the VCN beginning at about 10 days after noise trauma and continuing for more than 30 days. Changes in gene expression compatible with plasticity were reported at 4 weeks post noise-trauma (Dong et al., 2010a). Again, all of these changes overlap the period of auditory nerve degeneration/microglia activation.
However, the conclusions we can infer about the role of microglia are limited as we have only examined microglia activation at four time points, and auditory nerve degeneration was seen at all of them. These allow the possibility of a role for activated microglia in plastic changes that occur during the period of nerve degeneration. These data also do not rule out a role for activated microglia prior to auditory nerve degeneration. Such activation could, for example, occur in response to the period of auditory overstimulation or to biochemical changes in the auditory nerve induced by a loss of trophic factors from hair cells prior to active degeneration of the auditory nerve. There is one hint from our data supporting such a mismatch: the spatial overlap between OX6-ir and silver staining was not perfect (compare silver and OX6 immunostaining in Figs. 7 and 8). This might reflect a difference in sensitivity between the two staining methods, but also is compatible with activation of microglia prior to the onset of auditory nerve degeneration. We have not determined the end of the period of nerve degeneration; it may continue for as long as a year after acoustic trauma. The finding of a much higher background level of OX6-ir microglia, especially in cerebellar white matter, is in agreement with earlier studies showing an increase in OX6-ir in white matter in aging rats (Ogura et al., 1994).
Activation of microglia in the CN and cochlear ablations
The suggestion that activated microglia might participate in auditory plasticity came from studies of a different model of auditory plasticity, cochlear ablation (Campos Torres et al., 1999, Fuentes-Santamaria et al., 2012, Janz and Illing, 2014). Both auditory nerve degeneration and brainstem plasticity occur much more rapidly after cochlear ablations than after acoustic trauma. While there is some variation across species, generally degenerating fibers in the CN are seen as early as 12-48 hours after a lesion, and disappear by 10 days - 1 month (Osen, 1970, Cohen et al., 1972, Gentschev and Sotelo, 1973, Kane, 1974, Benson et al., 1997, Bilak et al., 1997, Morest et al., 1997). Sprouting and synaptogenesis after cochlear ablations occur on the same time scale as auditory nerve degeneration. Benson et al. (1997) found recovery of synaptophysin staining a week after cochlear ablations. Fredrich and Illing (2010) found an upregulation of the synaptic protein GAP-43 in the rat CN 7 days after cochlear ablation. Janz and Illing (2014) found activated microglia in cochlear nuclei as early as one day after cochlear ablation. Fuentes-Santamaria et al. (2012) found changes in the relative positions of activated microglia and neurons at 100 days postablation and suggested that the function of these activated microglia was to facilitate changes in neuronal function. Thus the time courses of changes in the cochlea and auditory brainstem following cochlear ablation and noise trauma are very different, and may be mediated by different mechanisms (as suggested by Morest et al., 1998); activated microglia may have different roles in the two paradigms.
HIGHLIGHTS.
We studied auditory nerve degeneration and microglia activation after bilateral noise exposure destroying hair cells
At survival times of 30 and 60 days silver-staining showed many degenerating fibers in the cochlear nuclei
Degenerating fibers were also seen at 6 and 9 month survival times
Immunostaining using an antibody to OX6 showed activated microglia in the cochlear nuclei with a similar distribution
Activated microglia in the cochlear nuclei have a major role as “scavengers”
Acknowledgments
Supported by grants from the ONR: N000141210731 and the NIH: R01DC011808 (RJS).
Footnotes
Publisher's Disclaimer: This is a PDF file of an unedited manuscript that has been accepted for publication. As a service to our customers we are providing this early version of the manuscript. The manuscript will undergo copyediting, typesetting, and review of the resulting proof before it is published in its final citable form. Please note that during the production process errors may be discovered which could affect the content, and all legal disclaimers that apply to the journal pertain.
Contributor Information
Joan S. Baizer, Department of Physiology & Biophysics, University at Buffalo, Buffalo, NY 14214.
Keit Men Wong, Department of Physiology & Biophysics, University at Buffalo, Buffalo, NY 14214.
Senthilvelan Manohar, Center for Hearing and Deafness, University at Buffalo, Buffalo, NY 14214.
Sarah H. Hayes, Center for Hearing and Deafness, University at Buffalo, Buffalo, NY 14214
Dalian Ding, Center for Hearing and Deafness, University at Buffalo, Buffalo, NY 14214.
Robert Dingman, Center for Hearing and Deafness, University at Buffalo, Buffalo, NY 14214.
Richard J. Salvi, Center for Hearing and Deafness, University at Buffalo, Buffalo, NY 14214.
References
- Albright BC, Johnson JI, Ostapoff EM. The projection of cervical primary fibers to the DCN of the squirrel, Sciurus niger: fiber sorting in the dorsal columns. Brain Behav Evol. 1983;22:118–131. doi: 10.1159/000121512. [DOI] [PubMed] [Google Scholar]
- Banati RB. Brain plasticity and microglia: is transsynaptic glial activation in the thalamus after limb denervation linked to cortical plasticity and central sensitisation? J Physiol Paris. 2002;96:289–299. doi: 10.1016/s0928-4257(02)00018-9. [DOI] [PubMed] [Google Scholar]
- Barger SW, Harmon AD. Microglial activation by Alzheimer amyloid precursor protein and modulation by apolipoprotein E. Nature. 1997;388:878–881. doi: 10.1038/42257. [DOI] [PubMed] [Google Scholar]
- Bauer J, Sminia T, Wouterlood FG, Dijkstra CD. Phagocytic activity of macrophages and microglial cells during the course of acute and chronic relapsing experimental autoimmune encephalomyelitis. J Neurosci Res. 1994;38:365–375. doi: 10.1002/jnr.490380402. [DOI] [PubMed] [Google Scholar]
- Beggs S, Salter MW. Microglia-neuronal signalling in neuropathic pain hypersensitivity 2.0. Curr Opin Neurobiol. 2010;20:474–480. doi: 10.1016/j.conb.2010.08.005. [DOI] [PMC free article] [PubMed] [Google Scholar]
- Benson CG, Gross JS, Suneja SK, Potashner SJ. Synaptophysin immunoreactivity in the cochlear nucleus after unilateral cochlear or ossicular removal. Synapse. 1997;25:243–257. doi: 10.1002/(SICI)1098-2396(199703)25:3<243::AID-SYN3>3.0.CO;2-B. [DOI] [PubMed] [Google Scholar]
- Berglof E, Small BJ, Bickford PC, Stromberg I. Beneficial effects of antioxidant-enriched diet for tyrosine hydroxylase-positive neurons in ventral mesencephalic tissue in oculo grafts. J Comp Neurol. 2009;515:72–82. doi: 10.1002/cne.22002. [DOI] [PubMed] [Google Scholar]
- Beynon SB, Walker FR. Microglial activation in the injured and healthy brain: what are we really talking about? Practical and theoretical issues associated with the measurement of changes in microglial morphology. Neuroscience. 2012;225:162–171. doi: 10.1016/j.neuroscience.2012.07.029. [DOI] [PubMed] [Google Scholar]
- Bilak M, Kim J, Potashner SJ, Bohne BA, Morest DK. New growth of axons in the cochlear nucleus of adult chinchillas after acoustic trauma. Exp Neurol. 1997;147:256–268. doi: 10.1006/exnr.1997.6636. [DOI] [PubMed] [Google Scholar]
- Block ML, Zecca L, Hong JS. Microglia-mediated neurotoxicity: uncovering the molecular mechanisms. Nat Rev Neurosci. 2007;8:57–69. doi: 10.1038/nrn2038. [DOI] [PubMed] [Google Scholar]
- Campos Torres A, Vidal PP, de Waele C. Evidence for a microglial reaction within the vestibular and cochlear nuclei following inner ear lesion in the rat. Neuroscience. 1999;92:1475–1490. doi: 10.1016/s0306-4522(99)00078-0. [DOI] [PubMed] [Google Scholar]
- Cho BP, Song DY, Sugama S, Shin DH, Shimizu Y, Kim SS, Kim YS, Joh TH. Pathological dynamics of activated microglia following medial forebrain bundle transection. Glia. 2006;53:92–102. doi: 10.1002/glia.20265. [DOI] [PubMed] [Google Scholar]
- Cohen ES, Brawer JR, Morest DK. Projections of the cochlea to the dorsal cochlear nucleus in the cat. Exp Neurol. 1972;35:470–479. doi: 10.1016/0014-4886(72)90117-3. [DOI] [PubMed] [Google Scholar]
- D’Sa C, Gross J, Francone VP, Morest DK. Plasticity of synaptic endings in the cochlear nucleus following noise-induced hearing loss is facilitated in the adult FGF2 overexpressor mouse. Eur J Neurosci. 2007;26:666–680. doi: 10.1111/j.1460-9568.2007.05695.x. [DOI] [PubMed] [Google Scholar]
- Damm J, Luheshi GN, Gerstberger R, Roth J, Rummel C. Spatiotemporal nuclear factor interleukin-6 expression in the rat brain during lipopolysaccharide-induced fever is linked to sustained hypothalamic inflammatory target gene induction. J Comp Neurol. 2011;519:480–505. doi: 10.1002/cne.22529. [DOI] [PubMed] [Google Scholar]
- Damoiseaux JG, Dopp EA, Calame W, Chao D, MacPherson GG, Dijkstra CD. Rat macrophage lysosomal membrane antigen recognized by monoclonal antibody ED1. Immunology. 1994;83:140–147. [PMC free article] [PubMed] [Google Scholar]
- Dehmel S, Pradhan S, Koehler S, Bledsoe S, Shore S. Noise overexposure alters long-term somatosensory-auditory processing in the dorsal cochlear nucleus--possible basis for tinnitus-related hyperactivity? J Neurosci. 2012;32:1660–1671. doi: 10.1523/JNEUROSCI.4608-11.2012. [DOI] [PMC free article] [PubMed] [Google Scholar]
- Ding D, McFadden S, Salvi RJ. Cochlear hair cell densities and inner ear staining techniques. In: Willott JF, editor. The auditory psychobiology of the mouse. Boca Raton: CRC Press; 2001. pp. 189–204. [Google Scholar]
- Ding D, McFadden SL, Woo JM, Salvi RJ. Ethacrynic acid rapidly and selectively abolishes blood flow in vessels supplying the lateral wall of the cochlea. Hear Res. 2002;173:1–9. doi: 10.1016/s0378-5955(02)00585-3. [DOI] [PubMed] [Google Scholar]
- Dong S, Mulders WH, Rodger J, Woo S, Robertson D. Acoustic trauma evokes hyperactivity and changes in gene expression in guinea-pig auditory brainstem. Eur J Neurosci. 2010a;31:1616–1628. doi: 10.1111/j.1460-9568.2010.07183.x. [DOI] [PubMed] [Google Scholar]
- Dong S, Rodger J, Mulders WH, Robertson D. Tonotopic changes in GABA receptor expression in guinea pig inferior colliculus after partial unilateral hearing loss. Brain Res. 2010b;1342:24–32. doi: 10.1016/j.brainres.2010.04.067. [DOI] [PubMed] [Google Scholar]
- Feany MB, Lee S, Edwards RH, Buckley KM. The synaptic vesicle protein SV2 is a novel type of transmembrane transporter. Cell. 1992;70:861–867. doi: 10.1016/0092-8674(92)90319-8. [DOI] [PubMed] [Google Scholar]
- Feng J, Bendiske J, Morest DK. Degeneration in the ventral cochlear nucleus after severe noise damage in mice. J Neurosci Res. 2012;90:831–841. doi: 10.1002/jnr.22793. [DOI] [PMC free article] [PubMed] [Google Scholar]
- Fredrich M, Illing RB. MMP-2 is involved in synaptic remodeling after cochlear lesion. Neuroreport. 2010;21:324–327. doi: 10.1097/WNR.0b013e328335b518. [DOI] [PubMed] [Google Scholar]
- Fuentes-Santamaria V, Alvarado JC, Gabaldon-Ull MC, Manuel Juiz J. Upregulation of insulin-like growth factor and interleukin 1beta occurs in neurons but not in glial cells in the cochlear nucleus following cochlear ablation. J Comp Neurol. 2013;521:3478–3499. doi: 10.1002/cne.23362. [DOI] [PubMed] [Google Scholar]
- Fuentes-Santamaria V, Alvarado JC, Juiz JM. Long-term interaction between microglial cells and cochlear nucleus neurons after bilateral cochlear ablation. J Comp Neurol. 2012;520:2974–2990. doi: 10.1002/cne.23088. [DOI] [PubMed] [Google Scholar]
- Gehrmann J, Matsumoto Y, Kreutzberg GW. Microglia: intrinsic immuneffector cell of the brain. Brain Res Brain Res Rev. 1995;20:269–287. doi: 10.1016/0165-0173(94)00015-h. [DOI] [PubMed] [Google Scholar]
- Gentschev T, Sotelo C. Degenerative patterns in the ventral cochlear nucleus of the rat after primary deafferentation. An ultra-structural study. Brain Res. 1973;62:37–60. doi: 10.1016/0006-8993(73)90618-5. [DOI] [PubMed] [Google Scholar]
- Gold JR, Bajo VM. Insult-induced adaptive plasticity of the auditory system. Front Neurosci. 2014;8:110. doi: 10.3389/fnins.2014.00110. [DOI] [PMC free article] [PubMed] [Google Scholar]
- Groschel M, Ryll J, Gotze R, Ernst A, Basta D. Acute and long-term effects of noise exposure on the neuronal spontaneous activity in cochlear nucleus and inferior colliculus brain slices. Biomed Res Int. 2014;2014 doi: 10.1155/2014/909260. 909260. [DOI] [PMC free article] [PubMed] [Google Scholar]
- Harrison JM, Feldman ML. Anatomical aspects of the cochlear nucleus and superior olivary complex. Contrib Sens Physiol. 1970;4:95–142. doi: 10.1016/b978-0-12-151804-2.50010-3. [DOI] [PubMed] [Google Scholar]
- Hughes PM, Botham MS, Frentzel S, Mir A, Perry VH. Expression of fractalkine (CX3CL1) and its receptor, CX3CR1, during acute and chronic inflammation in the rodent CNS. Glia. 2002;37:314–327. [PubMed] [Google Scholar]
- Janz P, Illing RB. A role for microglial cells in reshaping neuronal circuitry of the adult rat auditory brainstem after its sensory deafferentation. J Neurosci Res. 2014;92:432–445. doi: 10.1002/jnr.23334. [DOI] [PubMed] [Google Scholar]
- Jeong HK, Ji KM, Kim B, Kim J, Jou I, Joe EH. Inflammatory responses are not sufficient to cause delayed neuronal death in ATP-induced acute brain injury. PLoS One. 2010;5:e13756. doi: 10.1371/journal.pone.0013756. [DOI] [PMC free article] [PubMed] [Google Scholar]
- Jones DR, Casseday JH. Projections of auditory nerve in the cat as seen by anterograde transport methods. Neuroscience. 1979;4:1299–1313. doi: 10.1016/0306-4522(79)90158-1. [DOI] [PubMed] [Google Scholar]
- Kaltenbach JA. The dorsal cochlear nucleus as a contributor to tinnitus: mechanisms underlying the induction of hyperactivity. Prog Brain Res. 2007;166:89–106. doi: 10.1016/S0079-6123(07)66009-9. [DOI] [PubMed] [Google Scholar]
- Kaltenbach JA, Afman CE. Hyperactivity in the dorsal cochlear nucleus after intense sound exposure and its resemblance to tone-evoked activity: a physiological model for tinnitus. Hear Res. 2000;140:165–172. doi: 10.1016/s0378-5955(99)00197-5. [DOI] [PubMed] [Google Scholar]
- Kaltenbach JA, Godfrey DA, Neumann JB, McCaslin DL, Afman CE, Zhang J. Changes in spontaneous neural activity in the dorsal cochlear nucleus following exposure to intense sound: relation to threshold shift. Hear Res. 1998;124:78–84. doi: 10.1016/s0378-5955(98)00119-1. [DOI] [PubMed] [Google Scholar]
- Kaltenbach JA, McCaslin DL. Increases in Spontaneous Activity in the Dorsal Cochlear Nucleus Following Exposure to High Intensity Sound: A Possible Neural Correlate of Tinnitus. 1996;3:57–78. [PMC free article] [PubMed] [Google Scholar]
- Kaltenbach JA, Zhang J, Afman CE. Plasticity of spontaneous neural activity in the dorsal cochlear nucleus after intense sound exposure. Hear Res. 2000;147:282–292. doi: 10.1016/s0378-5955(00)00138-6. [DOI] [PubMed] [Google Scholar]
- Kane EC. Patterns of degeneration in the caudal cochlear nucleus of the cat after cochlear ablation. Anat Rec. 1974;179:67–91. doi: 10.1002/ar.1091790106. [DOI] [PubMed] [Google Scholar]
- Kettenmann H, Kirchhoff F, Verkhratsky A. Microglia: new roles for the synaptic stripper. Neuron. 2013;77:10–18. doi: 10.1016/j.neuron.2012.12.023. [DOI] [PubMed] [Google Scholar]
- Kim DO. Functional riles of the inner- and outer-hair-cell subsytems in the cochlea and brainstem. In: Berlin C, editor. Hearing Science. San Diego, CA: College-Hill Press; 1984. pp. 241–261. [Google Scholar]
- Kim J, Morest DK, Bohne BA. Degeneration of axons in the brainstem of the chinchilla after auditory overstimulation. Hear Res. 1997;103:169–191. doi: 10.1016/s0378-5955(96)00173-6. [DOI] [PubMed] [Google Scholar]
- Kim JJ, Gross J, Morest DK, Potashner SJ. Quantitative study of degeneration and new growth of axons and synaptic endings in the chinchilla cochlear nucleus after acoustic overstimulation. J Neurosci Res. 2004a;77:829–842. doi: 10.1002/jnr.20211. [DOI] [PubMed] [Google Scholar]
- Kim JJ, Gross J, Potashner SJ, Morest DK. Fine structure of degeneration in the cochlear nucleus of the chinchilla after acoustic overstimulation. J Neurosci Res. 2004b;77:798–816. doi: 10.1002/jnr.20213. [DOI] [PubMed] [Google Scholar]
- Kim JJ, Gross J, Potashner SJ, Morest DK. Fine structure of long-term changes in the cochlear nucleus after acoustic overstimulation: chronic degeneration and new growth of synaptic endings. J Neurosci Res. 2004c;77:817–828. doi: 10.1002/jnr.20212. [DOI] [PubMed] [Google Scholar]
- Koehler SD, Pradhan S, Manis PB, Shore SE. Somatosensory inputs modify auditory spike timing in dorsal cochlear nucleus principal cells. Eur J Neurosci. 2011;33:409–420. doi: 10.1111/j.1460-9568.2010.07547.x. [DOI] [PMC free article] [PubMed] [Google Scholar]
- Kraus KS, Mitra S, Jimenez Z, Hinduja S, Ding D, Jiang H, Gray L, Lobarinas E, Sun W, Salvi RJ. Noise trauma impairs neurogenesis in the rat hippocampus. Neuroscience. 2010;167:1216–1226. doi: 10.1016/j.neuroscience.2010.02.071. [DOI] [PMC free article] [PubMed] [Google Scholar]
- Kreutzberg GW. Microglia: a sensor for pathological events in the CNS. Trends Neurosci. 1996;19:312–318. doi: 10.1016/0166-2236(96)10049-7. [DOI] [PubMed] [Google Scholar]
- Kujawa SG, Liberman MC. Adding insult to injury: cochlear nerve degeneration after “temporary” noise-induced hearing loss. J Neurosci. 2009;29:14077–14085. doi: 10.1523/JNEUROSCI.2845-09.2009. [DOI] [PMC free article] [PubMed] [Google Scholar]
- Lawson LJ, Perry VH, Dri P, Gordon S. Heterogeneity in the distribution and morphology of microglia in the normal adult mouse brain. Neuroscience. 1990;39:151–170. doi: 10.1016/0306-4522(90)90229-w. [DOI] [PubMed] [Google Scholar]
- Liberman MC, Kiang NY. Acoustic trauma in cats. Cochlear pathology and auditory-nerve activity. Acta Otolaryngol Suppl. 1978;358:1–63. [PubMed] [Google Scholar]
- Lorente de No R. Anatomy of the eighth nerve. III General plan of structure of the primary cochlear nuclei. Laryngoscope. 1933;43:327–350. doi: 10.1097/00005537-199605000-00004. [DOI] [PubMed] [Google Scholar]
- Luo XG, Ding JQ, Chen SD. Microglia in the aging brain: relevance to neurodegeneration. Mol Neurodegener. 2010;5:12. doi: 10.1186/1750-1326-5-12. [DOI] [PMC free article] [PubMed] [Google Scholar]
- Maroso M, Balosso S, Ravizza T, Iori V, Wright CI, French J, Vezzani A. Interleukin-1beta biosynthesis inhibition reduces acute seizures and drug resistant chronic epileptic activity in mice. Neurotherapeutics. 2011;8:304–315. doi: 10.1007/s13311-011-0039-z. [DOI] [PMC free article] [PubMed] [Google Scholar]
- Michler SA, Illing RB. Acoustic trauma induces reemergence of the growth- and plasticity-associated protein GAP-43 in the rat auditory brainstem. J Comp Neurol. 2002;451:250–266. doi: 10.1002/cne.10348. [DOI] [PubMed] [Google Scholar]
- Morest DK, Bohne BA. Noise-induced degeneration in the brain and representation of inner and outer hair cells. Hear Res. 1983;9:145–151. doi: 10.1016/0378-5955(83)90024-2. [DOI] [PubMed] [Google Scholar]
- Morest DK, Kim J, Bohne BA. Neuronal and transneuronal degeneration of auditory axons in the brainstem after cochlear lesions in the chinchilla: cochleotopic and non-cochleotopic patterns. Hear Res. 1997;103:151–168. doi: 10.1016/s0378-5955(96)00172-4. [DOI] [PubMed] [Google Scholar]
- Morest DK, Kim J, Potashner SJ, Bohne BA. Long-term degeneration in the cochlear nerve and cochlear nucleus of the adult chinchilla following acoustic overstimulation. Microsc Res Tech. 1998;41:205–216. doi: 10.1002/(SICI)1097-0029(19980501)41:3<205::AID-JEMT4>3.0.CO;2-S. [DOI] [PubMed] [Google Scholar]
- Mulders WH, Robertson D. Development of hyperactivity after acoustic trauma in the guinea pig inferior colliculus. Hear Res. 2013;298:104–108. doi: 10.1016/j.heares.2012.12.008. [DOI] [PubMed] [Google Scholar]
- Muller M. Frequency representation in the rat cochlea. Hear Res. 1991;51:247–254. doi: 10.1016/0378-5955(91)90041-7. [DOI] [PubMed] [Google Scholar]
- Muly SM, Gross JS, Morest DK, Potashner SJ. Synaptophysin in the cochlear nucleus following acoustic trauma. Exp Neurol. 2002;177:202–221. doi: 10.1006/exnr.2002.7963. [DOI] [PubMed] [Google Scholar]
- Ogura K, Ogawa M, Yoshida M. Effects of ageing on microglia in the normal rat brain: immunohistochemical observations. Neuroreport. 1994;5:1224–1226. doi: 10.1097/00001756-199406020-00016. [DOI] [PubMed] [Google Scholar]
- Osen KK. Course and termination of the primary afferents in the cochlear nuclei of the cat. An experimental anatomical study. Arch Ital Biol. 1970;108:21–51. [PubMed] [Google Scholar]
- Paxinos G. Chemoarchitectonic atlas of the rat brainstem. San Diego: Academic Press; 1999. [Google Scholar]
- Paxinos G, Watson C. The rat brain, in stereotaxic coordinates. San Diego: Academic Press; 1997. [Google Scholar]
- Perego C, Fumagalli S, De Simoni MG. Temporal pattern of expression and colocalization of microglia/macrophage phenotype markers following brain ischemic injury in mice. J Neuroinflammation. 2011;8:174. doi: 10.1186/1742-2094-8-174. [DOI] [PMC free article] [PubMed] [Google Scholar]
- Ponomarev ED, Shriver LP, Dittel BN. CD40 expression by microglial cells is required for their completion of a two-step activation process during central nervous system autoimmune inflammation. J Immunol. 2006;176:1402–1410. doi: 10.4049/jimmunol.176.3.1402. [DOI] [PubMed] [Google Scholar]
- Rao K, Lund RD. Optic nerve degeneration induces the expression of MHC antigens in the rat visual system. J Comp Neurol. 1993;336:613–627. doi: 10.1002/cne.903360413. [DOI] [PubMed] [Google Scholar]
- Robinson AP, White TM, Mason DW. Macrophage heterogeneity in the rat as delineated by two monoclonal antibodies MRC OX-41 and MRC OX-42, the latter recognizing complement receptor type 3. Immunology. 1986;57:239–247. [PMC free article] [PubMed] [Google Scholar]
- Saunders JC, Dear SP, Schneider ME. The anatomical consequences of acoustic injury: A review and tutorial. J Acoust Soc Am. 1985;78:833–860. doi: 10.1121/1.392915. [DOI] [PubMed] [Google Scholar]
- Schwartz M, Butovsky O, Bruck W, Hanisch UK. Microglial phenotype: is the commitment reversible? Trends Neurosci. 2006;29:68–74. doi: 10.1016/j.tins.2005.12.005. [DOI] [PubMed] [Google Scholar]
- Shore SE, Koehler S, Oldakowski M, Hughes LF, Syed S. Dorsal cochlear nucleus responses to somatosensory stimulation are enhanced after noise-induced hearing loss. Eur J Neurosci. 2008;27:155–168. doi: 10.1111/j.1460-9568.2007.05983.x. [DOI] [PMC free article] [PubMed] [Google Scholar]
- Shu SY, Ju G, Fan LZ. The glucose oxidase-DAB-nickel method in peroxidase histochemistry of the nervous system. Neurosci Lett. 1988;85:169–171. doi: 10.1016/0304-3940(88)90346-1. [DOI] [PubMed] [Google Scholar]
- Streit WJ. Microglia and Alzheimer’s disease pathogenesis. J Neurosci Res. 2004;77:1–8. doi: 10.1002/jnr.20093. [DOI] [PubMed] [Google Scholar]
- Tremblay ME, Majewska AK. A role for microglia in synaptic plasticity? Commun Integr Biol. 2011;4:220–222. doi: 10.4161/cib.4.2.14506. [DOI] [PMC free article] [PubMed] [Google Scholar]
- Van Der Gucht E, Youakim M, Arckens L, Hof PR, Baizer JS. Variations in the structure of the prelunate gyrus in Old World monkeys. Anat Rec A Discov Mol Cell Evol Biol. 2006;288:753–775. doi: 10.1002/ar.a.20350. [DOI] [PMC free article] [PubMed] [Google Scholar]
- Wahlin KJ, Moreira EF, Huang H, Yu N, Adler R. Molecular dynamics of photoreceptor synapse formation in the developing chick retina. J Comp Neurol. 2008;506:822–837. doi: 10.1002/cne.21582. [DOI] [PubMed] [Google Scholar]
- Webster M, Webster DB. Spiral ganglion neuron loss following organ of Corti loss: a quantitative study. Brain Res. 1981;212:17–30. doi: 10.1016/0006-8993(81)90028-7. [DOI] [PubMed] [Google Scholar]
- Wuchert F, Ott D, Rafalzik S, Roth J, Gerstberger R. Tumor necrosis factor-alpha, interleukin-1beta and nitric oxide induce calcium transients in distinct populations of cells cultured from the rat area postrema. J Neuroimmunol. 2009;206:44–51. doi: 10.1016/j.jneuroim.2008.10.010. [DOI] [PubMed] [Google Scholar]
- Xie W, Strong JA, Zhang JM. Early blockade of injured primary sensory afferents reduces glial cell activation in two rat neuropathic pain models. Neuroscience. 2009;160:847–857. doi: 10.1016/j.neuroscience.2009.03.016. [DOI] [PMC free article] [PubMed] [Google Scholar]
- Zeng C, Yang Z, Shreve L, Bledsoe S, Shore S. Somatosensory projections to cochlear nucleus are upregulated after unilateral deafness. J Neurosci. 2012;32:15791–15801. doi: 10.1523/JNEUROSCI.2598-12.2012. [DOI] [PMC free article] [PubMed] [Google Scholar]
- Zhang JS, Kaltenbach JA. Increases in spontaneous activity in the dorsal cochlear nucleus of the rat following exposure to high-intensity sound. Neurosci Lett. 1998;250:197–200. doi: 10.1016/s0304-3940(98)00482-0. [DOI] [PubMed] [Google Scholar]


