

Abstract
Circulating miRNAs are promising biomarkers in oncology but have not yet been implemented in the clinic given the lack of concordance across studies. In order to increase the cross‐studies reliability, we attempted to reduce and to control the circulating miRNA expression variability between patients. First, to maximize profiling signals and to reduce miRNA expression variability, three isolation kits were compared and the NucleoSpin® kit provided higher miRNA concentrations than the other widely used kits. Second, to control inter‐sample variability during the profiling step, the exogenous miRNAs normalization method commonly used for RT‐qPCR validation step was adapted to microarray experiments. Importantly, exogenous miRNAs presented two‐fold lower inter‐sample variability than the widely used endogenous miR‐16‐5p reflecting that the latter is subject to both biological and technical variability. Although Caenorhabditis elegans miRNAs isolation yields were heterogeneous, they correlated to each other and to their geometrical mean across samples. The normalization based on the geometrical mean of three exogenous miRNAs increased the correlation up‐to 0.97 between the microarrays and individual RT‐qPCR steps of circulating miRNAs expression. Overall, this new strategy open new avenue to identify reliable circulating miRNA signatures for translation into clinical practice.
Keywords: Circulating miRNA, Serum, Plasma, Profiling, Normalization, Ovarian cancer
Highlights
NucleoSpin kit offers the highest endogenous miRNA concentrations from serum/plasma.
A common normalization based on exogenous miRNAs for discovery and validation steps.
New strategy to increase both the signature accuracy and the overlap across studies.
1. Introduction
MiRNAs are short endogenous non‐coding RNAs that are regulators of biological functions (Ha and Kim, 2014). The dysregulation of miRNAs expression is related to many human diseases. In oncology, tumor miRNA signatures could be useful for diagnosis/prognosis (Croce, 2009). The presence of miRNAs in cell‐free body fluids (blood, urine, etc) and their stability suggest that circulating miRNAs could be exploited as minimally invasive biomarkers (Cortez et al., 2011). Circulating miRNAs expression profiles were shown to differ between cancer patients and healthy individuals, and to reflect the pattern observed in the tumor tissues, highlighting their potential use as easily detectable tumor biomarkers (Schwarzenbach et al., 2014). They may also help to predict treatment response and recurrence. However, meta‐analysis reported a lack of consistency across different profiling studies (Jarry et al., 2014; Wu et al., 2015). Some issues have yet to be solved to succeed in translating circulating miRNA signature from research to clinical practice.
Methodological heterogeneity affecting several steps (sample preparation, profiling, validation and normalization) could represent a limiting factor for the identification of reliable circulating miRNA signatures (Moldovan et al., 2014; Schwarzenbach et al., 2015; Witwer, 2015). Importantly, the RT‐qPCR validated results could be considered as the only cross studies comparable gold standard. However, the miRNA purification step usually introduces some variability across samples which could be partly related to variations in biofluids composition. Studies have already attempted to reduce isolation variability using silica‐column kits instead of phenol chloroform procedures alone such as Trizol® LS (Moldovan et al., 2014). In addition, other technologies such as anti‐miRNA bead capture have been developed but only detect a limited number of miRNAs (Gillis et al., 2013). Some authors have proposed to control these inter‐sample discrepancies by introducing known quantities of exogenous Caenorhabditis elegans miRNAs at the beginning of the isolation step and this strategy has been since widely used (Mitchell et al., 2008). Many clinical studies employed profiling to identify candidate miRNAs biomarkers and validated their expression using the gold standard RT‐qPCR method. However, the profiling step is subjected to its own variability. This random variability will decrease the true positives and increase false‐positives/‐negatives candidate miRNAs biomarkers. Consequently, only a few miRNAs biomarkers candidates have been validated by the RT‐qPCR. Overall, biased profiles leading to the validation of limited subsets of the miRNAs clinical signature, may explain the poor overlap between independent studies. Optimizations of the biomarker identification and validation processes should allow first to reduce cross sample discrepancies, and second to control the random variability in both profiling and validation steps.
In this study, we proposed to reduce the profiling variability by selecting the isolation kit offering the highest input RNA concentration for microarray profiling and to control the profiling step variability by adapting the exogenous normalization method used during the validation step to the profiling step.
2. Material and methods
2.1. Patient samples
Serum samples were obtained from 6 healthy individual and from 22 patients who were included in miRSA (miRNA serum analysis) clinical study (NCT01391351) approved by the French ethics committee “Nord‐Ouest‐III” [CPP N°2011‐02] and national authorities (AFSSAPS N°B110260‐20). Three plasma, ascites and urine samples were obtained from the Cancer Center F. Baclesse biological collections declared (# DC‐2010‐1243) to the French Ministry of Research. Prior to scientific use of samples and data, subjects were appropriately informed and asked to consent in writing, in compliance with French and European regulations. Serum and plasma were collected respectively on SST‐II and EDTA tubes (BD Vacutainer®, BD, Le‐Pont‐de‐Claix, France). Biofluids were centrifuged twice to remove residual cells and were frozen at −80 °C.
2.2. Exogenous miRNAs
SDS‐PAGE purified synthetic miRNAs (Eurogentec, Liège, Belgium) were stored at −80 °C at a concentration of 20 μM and diluted to 200, 20, 2, 0.2 and 0.02 amol/μL solutions for experiments.
2.3. RNA extraction from biofluids samples
MiRNAs were isolated from samples according to the manufacturers' recommendations using NucleoSpin® miRNA Plasma kit (Macherey‐Nagel, Hoerdt, France), mirVana™ PARIS™ kit (Life Technologies, Saint Aubin, France) and miRNeasy Serum/Plasma kit (Qiagen, Courtaboeuf, France). Three exogenous miRNAs (cel‐miR‐39‐3p, cel‐miR‐54‐3p and cel‐miR 238‐3p), added to biofluids after the denaturation step, were used to assess the extraction yields. The concentrations of cel‐miR‐39‐3p, cel‐miR‐54‐3p and cel‐miR‐238‐3p were respectively scaled at 200, 20 and 2 amol/μL or added at 200 amol/μL (first and last part of the study, respectively) at a consistent volume of 2.5 μL of exogenous RNA solution per 100 μL of biofluid. RNAs were eluted in nuclease‐free water and frozen at −80 °C.
2.4. Total RNA concentration
RNA concentrations were estimated using a Bioanalyzer (Agilent Technologies, Les Ulis, France), or Quant‐it™ RiboGreen® kit (Life Technologies) using 2 μL of eluted RNAs diluted in 100 μL (1/2000 dye TE dilute solution). Fluorescence was measured using a FLUOstar OPTIMA spectrophotometer (BMG Labtech, Champigny sur Marne, France).
2.5. Absolute quantification of miRNAs using RT‐qPCR
MiRNAs were retro‐transcribed using specific stem‐loop primers and microRNA reverse transcription kit. The ID references (Life Technologies) for stem‐loop primer and hydrolysis probes were the following: cel‐miR‐39‐3p (000200), cel‐miR‐54‐3p (001361), cel‐miR‐238‐3p (000248), hsa‐miR‐16‐5p (000391), hsa‐miR‐93‐5p (001090) and hsa‐miR‐486‐5p (001278). 5 μL of isolated RNA were mixed with 10 μL of RT master mix after a two‐fold dilution step. Triplicates with 1.33 μL of cDNA were mixed with 18.7 μL of qPCR master mix (Universal Master Mix II without UNG). Fluorescence and threshold baselines were measured using an Applied ABI Prism 7500 Fast PCR system with the 7500 Software v2.0.6 (Applied Biosystems). Absolute standard curves were performed with 1000, 100, 10, 1 and 0.1 amol quantities of indicated cel‐miRs and hsa‐miRs (see Supplemental Figure 1). We used standard curves to transform Cq to log of quantities, according to the MIQE guidelines (Bustin et al., 2013).
2.6. Extraction yields and endogenous miRNAs concentrations estimation
MiRNA quantities in RNA extracts were calculated on the basis of their concentrations and the kit's elution volumes. Extraction yields for the three cel‐miRs were estimated by dividing the measured miRNA quantities in elutes by their measured added quantities. The geometrical mean of the three different yield factors was used as a global sample yield. Concentration of circulating hsa‐miR‐16‐5p, hsa‐miR‐486‐5p and hsa‐miR‐93‐5p in serum were estimated by dividing the concentrations assessed in the eluates by the global extraction yield and the kit's concentrating factors.
2.7. MicroRNA profiling by microarrays
Microarrays were processed according to manufacturer's recommendations. For each sample, 10 μL of RNAs were labeled with FlashTag™ Biotin HSR RNA Labeling Kit (Genisphere – Affymetrix® UK Ltd, High Wycombe, United Kingdom). Samples were hybridized for 16 h at 48 °C on GeneChip® microRNA 4.0 Array (Affymetrix®) and scanned with a GC30007G scanner (Affymetrix®). Raw data were normalized using the Expression Console (Affymetrix®) with the RMA method, algorithmically based on microarrays spike‐in and called the « standard normalization ». The additional « exogenous normalization » was achieved for each sample by dividing all human miRNAs intensities by the geometrical mean of the three cel‐miRs intensities. Data have been deposited in the NCBI Gene Expression Omnibus database (GSE69341).
2.8. Statistical analysis
Excel software (Microsoft) was used to draw graphs and to run both Student t‐tests under the equally variances hypothesis and Pearson's correlations statistical analysis. Histograms data are the means of three independent experiments ± S.E.M. A P value of <0.05 was considered significant.
3. Results
3.1. The NucleoSpin® miRNA plasma kit offers the highest endogenous miRNA concentrations
We first aimed to obtain the highest miRNA concentrations in RNA eluates to maximize microarray signal intensities using the smallest volume of biofluids which are available in limited amounts in clinical studies. We also sought to purify sufficient quantities of miRNA to perform both microarray experiments and subsequent RT‐qPCR validations. Another important point was also to get ready‐to‐use RNA samples avoiding supplementary steps (concentration, pre‐amplification) that may further increase variability between samples. We compared three commercially available isolation kits of whom two are extensively used in the literature (miRNeasy Serum/Plasma and mirVana™ PARIS™) and the third one which has recently been made available (NucleoSpin® miRNA Plasma).
The concentration of miRNA isolated from given endogenous miRNAs biofluid concentrations depends on starting biofluid volume, isolation yield and final elution volume following the formula: [miRNA]eluate = [miRNA]biofluid × Vbiofluid × yield/Veluate. For given endogenous miRNAs concentrations and isolation yields, miRNeasy and NucleoSpin® kits provided similar biofluid‐to‐RNA concentration factors with 14.3 and 10‐fold, respectively, whereas mirVana™ PARIS™ only concentrated by 3‐fold, according to the manufacturer's recommendations (Table 1).
Table 1.
Characteristics of serum/plasma dedicated miRNA isolation kits used in this study. Serum and plasma samples were extracted with the two most widely used miRNA isolation kits (miRNeasy and mirVana™ PARIS™) and a new available one (NucleoSpin®). The latter presents a higher biofluid volume capacity than the miRNeasy kit and a higher concentration factor, from sample to eluate volumes, than the mirVana™ PARIS™.
| Kits | Sample (μL) | Elution (μL) | Concentration factor | Handling time | Cost per sample |
|---|---|---|---|---|---|
| miRNeasy serum plasma (Qiagen) | 200 | 14 | 14.3 | <45 min | <10 $ |
| NucleoSpin® miRNA plasma (Macherey‐Nagel) | 300 | 30 | 10.0 | <30 min | <5 $ |
| mirVana™ PARIS™ (Life Technologies) | 300 | 100 | 3.0 | <45 min | >10 $ |
To identify the isolation kit offering the highest endogenous miRNAs concentrations, the level of miR‐16‐5p [highly expressed in human serum and plasma (Pritchard et al., 2012)] was measured in RNA eluates using absolute RT‐qPCR. The NucleoSpin® kit provided significantly higher miR‐16‐5p concentration than miRNeasy (P = 0.00085 and P = 0.03, respectively) and mirVana™ PARIS™ (P = 0.00062 and P = 0.0049, respectively) kits from the sera of 6 healthy subjects (Figure 1A) and 6 cancer patients (Figure 1B). Furthermore, miRNeasy kit offers significantly higher miR‐16‐5p concentrations than mirVana™ PARIS™ kit (P = 0.00020 and P = 0.01, respectively) from the same samples. In addition, we did not find any significant difference for miR‐16‐5p relative concentrations between these kits using other biofluids (3 ascites and 3 urinary samples) (see Supplemental Figure S2).
Figure 1.
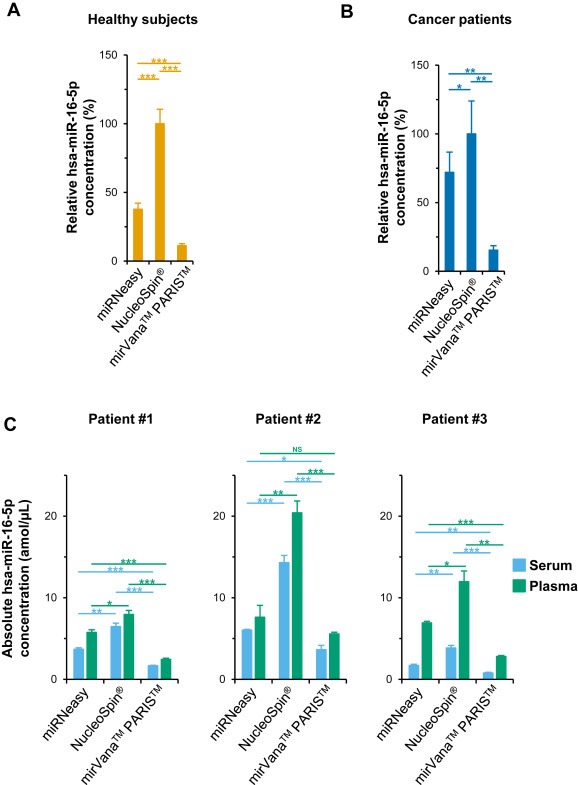
The NucleoSpin ® miRNA plasma kit offers the highest endogenous miRNA concentrations. miR‐16‐5p relative concentrations (to that provided by the NucleoSpin® kit) were measured in RNA extracts from the serum of 6 healthy subjects (A) and 6 ovarian cancer patients (B) using RT‐qPCR. These kits were additionally compared using absolute concentrations of miR‐16‐5p measured in triplicates both in serum and plasma of three ovarian cancer patients (C). Data are means ± S.E.M. and Student t‐tests P values NS, not significant, *P < 0.05, **P < 0.01, ***P < 0.001.
To take into account their reproducibility, for each kit we compared the miR‐16‐5p concentrations using absolute RT‐qPCR in three independent eluates from both serum and plasma of three ovarian cancer patients. We showed that the NucleoSpin® kit yielded significantly higher miRNA concentrations for each sample. Indeed, for serum and plasma samples respectively, it offered [1.8–2.4] and [1.4–2.7] fold higher concentrations than miRNeasy kit, respectively, and provided [3.9–4.9] and [3.2–4.3] fold higher concentrations than mirVana™ PARIS™ kit (Figure 1C). Moreover, in agreement with the miRNA results, the NucleoSpin® kit also purified the highest total RNA concentration for patient 3 (see Supplemental Figure S3).
3.2. Exogenous and endogenous normalizations equally control intra‐sample variability but exogenous normalization offers lower inter‐sample variability
Circulating miRNA expression is usually normalized using exogenous and/or endogenous miRNAs to control isolation variability or both biological and isolation variabilities. Cel‐miR‐39‐3p, cel‐miR‐54‐3p and cel‐miR‐238‐3p exogenous miRNAs were introduced in known quantities at the beginning of RNA isolation to monitor miRNA isolation. To date, although there is no consensus endogenous miRNA, hsa‐miR‐16‐5p and total RNA concentration are widely used in the literature (Moldovan et al., 2014). The equivalence between exogenous and endogenous normalizations has been scarcely assessed. We therefore compared exogenous and endogenous normalizations using eluates provided by the NucleoSpin® kit and absolute RT‐qPCR.
We first compared inter‐sample variability of both exogenous and endogenous miRNAs expression using the serum of 6 healthy subjects and 6 cancer patients. We showed that the coefficient of variation (CV) of the endogenous miR‐16‐5p (25.8% in healthy subjects and 58.7% in cancer patients) was higher than the CV of each exogenous miRNA: cel‐miR‐39‐3p, cel‐miR‐54‐3p, cel‐miR‐238‐3p (9.1%, 14.2% and 6.9% in healthy subjects and 14.9%, 18.6% and 12.1% in cancer patients, respectively) (Figure 2A).
Figure 2.
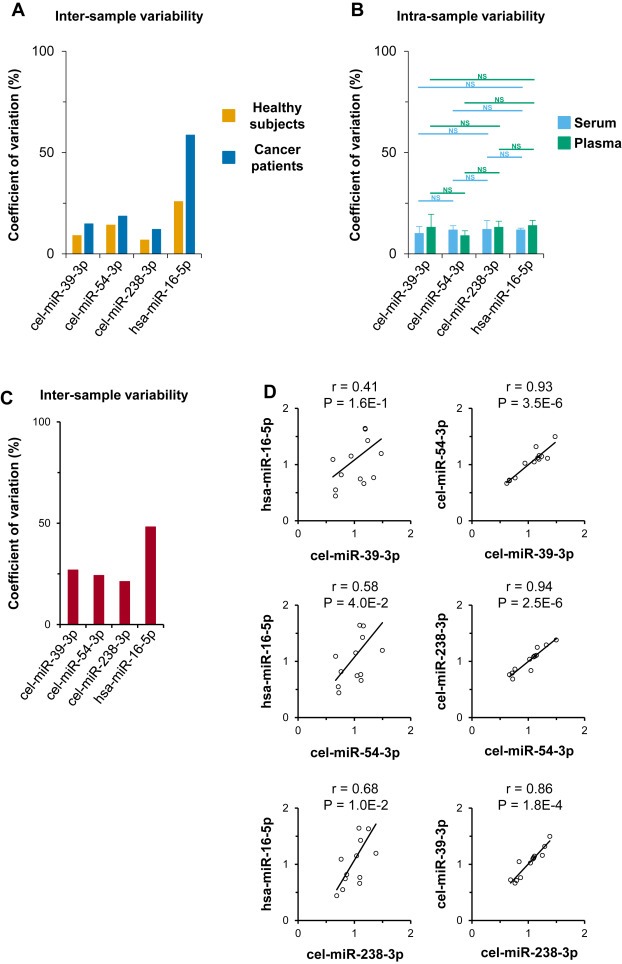
Exogenous and endogenous normalizations equally control intra‐sample variability but exogenous one offers lower inter‐sample variability. Exogenous and endogenous miRNAs RT‐qPCR concentrations isolated by NucleoSpin® kit were compared using their coefficients of variation from the serum of 6 healthy subjects and 6 cancer patients (A), from both serum and plasma of three ovarian cancer patients triplicates (B) and from the serum of 13 ovarian cancer patients (C). Both exogenous and endogenous miRNA concentrations were cross‐correlated from the same 13 serum samples (D). Data are CV, means ± S.E.M, Student t‐tests P values and Pearson‐tests correlations and P values. NS, not significant.
We next studied intra‐sample variability of both exogenous and endogenous miRNAs expression in three independent RNA eluates from both serum and plasma of 3 ovarian cancer patients. There was no significant difference between the CV of endogenous miR‐16‐5p (11.8% in serum; 14.0% in plasma) and the CV of exogenous miRNAs: cel‐miR‐39‐3p, cel‐miR‐54‐3p, cel‐miR‐238‐3p (10.1%, 11.8% and 12.1% in serum; 13.2%, 9.0% and 13.1% in plasma, respectively) (Figure 2B).
Finally, we compared the inter‐sample expression of both exogenous and endogenous miRNAs using the serum of 13 ovarian cancer patients from the miRSA biobank (NCT01391351). As shown previously, the CV of the endogenous miR‐16‐5p concentration (48.2%) was higher than the CV of each exogenous miRNA concentration: cel‐miR‐39‐3p, cel‐miR‐54‐3p, cel‐miR‐238‐3p (27.0%, 24.3% and 21.3%) (Figure 2C). Then we showed that exogenous miRNAs: cel‐miR‐39‐3p, cel‐miR‐54‐3p and cel‐miR‐238‐3p better correlate with one another than with the endogenous miR‐16‐5p (r = 0.41, P = 1.6E‐1; r = 0.58, P = 4.0E‐2; r = 0.68, P = 1.0E‐2, respectively) (Figure 2D). Additionally, measuring total RNA concentration (also used as endogenous normalizer) from the same samples we showed that the CV (102,8%) was higher than the CV of each exogenous miRNA concentration and that this did not correlate significantly with the expression of cel‐miR‐39‐3p (r = 0.04; P = 9.0E‐1), cel‐miR‐54‐3p (r = 0.08; P = 8.0E‐1) and cel‐miR‐238‐3p (r = 0.02; P = 9.4E‐1) (see Supplemental Figure S4A and S4B).
3.3. The geometrical mean of the extraction yields of three exogenous miRNAs is a suitable normalizer
The use of exogenous miRNAs added in precise amounts in the biological samples allows the estimation of miRNA extraction yields after quantification of cel‐miR‐39‐3p, cel‐miR‐54‐3p and cel‐miR‐238‐3p by absolute RT‐qPCR in eluates.
We first assessed the reproducibility of exogenous miRNAs extraction yields with three independent eluates provided by the NucleoSpin® kit from both serum and plasma of 3 ovarian cancer patients. Surprisingly, cel‐miR‐39‐3p was reproducibly isolated with significantly lower yields than cel‐miR‐54‐3p and cel‐miR‐238‐3p from both serum (s) and plasma (p) of each patient (P) (P1s: P = 1.9E‐02 and 2.5E‐04; P1p: P = 1.4E‐02 and 1.4E‐02; P2s: 1.7E‐02 and 2.1E‐02; P2p: 3.3E‐03 and 7.6E‐03; P3s: 5.4E‐04 and 7.8E‐03; P3p: 3.3E‐03 and 2.5E‐03; vs. cel‐miR‐54‐3p and cel‐miR‐238‐3p, respectively), whereas the isolation yields of cel‐miR‐54‐3p and cel‐miR‐238‐3p did not differ significantly (Figure 3A). Additionally, we showed from the same samples that cel‐miR‐39‐3p was also reproducibly isolated with significantly lower yields than cel‐miR‐54‐3p and cel‐miR‐238‐3p using miRNeasy and mirVana™ PARIS™ kits (see Supplemental Figure S5).
Figure 3.
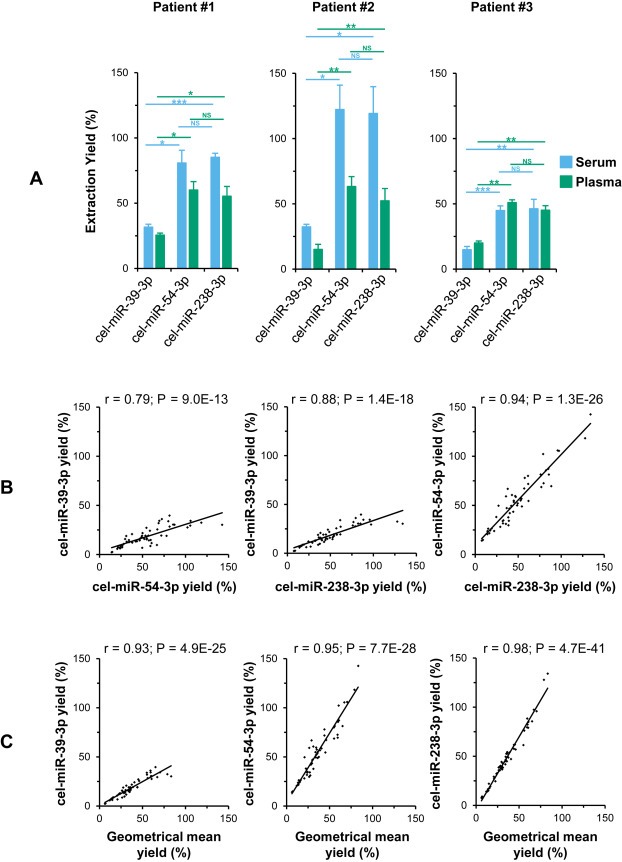
The geometrical mean of the extraction yields of three exogenous miRNAs is a suitable normalizer. Exogenous miRNAs (cel‐miR) extraction yields from 3 cancer serum and plasma triplicates isolations were compared using NucleoSpin® kit (A) knowing added quantities before isolation and using absolute RT‐qPCR. Exogenous miRNAs yields provided by three isolation kits were correlated with one another (B) and with their geometrical means (C). Data are means ± S.E.M, Student‐tests P values and Pearson‐tests correlations and P values. NS, not significant; *, P < 0.05; **, P < 0.01; ***, P < 0.001.
Despite these differences in the recovery yields, we analyzed the three cel‐miRs yields provided by the three miRNA isolation kits on serum and plasma of the three patients in triplicate (54 analysis points). The yields calculated for each miRNAs were well cross‐correlated for cel‐miR‐39‐3p vs. cel‐miR‐54‐3p (r = 0.79), for cel‐miR‐39‐3p vs. cel‐miR‐238‐3p (r = 0.88) and for cel‐miR‐54‐3p vs. cel‐miR‐238‐3p (r = 0.94) (Figure 3B). Since the variability of exogenous miRNA extraction yields may reflect the heterogeneity of endogenous miRNA extraction yields, we postulated that the geometrical mean of the three exogenous miRNA yields may offer the opportunity to estimate the concentrations of endogenous miRNAs. Indeed, the extraction yields of cel‐miRs correlated closely with their geometrical mean (r = 0.93, 0.95 and 0.98 for cel‐miR‐39‐3p, cel‐miR‐54‐3p and cel‐miR‐238‐3p, respectively) (Figure 3C). The geometrical mean of three exogenous miRNAs extraction yields may thus be suitable to normalize sample isolation discrepancies during the validation step of miRNAs biomarkers in clinical studies.
3.4. A common exogenous normalization of both microarray and RT‐qPCR miRNA expression data increases their cross‐correlation
Usually, global approaches are normalized on the basis of global expression and sometimes using endogenous controls. In most studies, the discovery and the validation steps rely on different normalizers that could impact the validation rates of miRNAs candidates. We proposed to normalize profiling data using the geometrical mean of exogenous miRNAs yields which is also suitable for the validation step as previously shown. As a proof of concept of this strategy, we performed microarrays and absolute RT‐qPCR experiments on the same selected 13 independent samples. We measured the expression of two highly expressed miRNAs (miR‐16‐5p and miR‐486‐5p) and one potential miRNA of interest (miR‐93‐5p) described as a circulating biomarker in ovarian cancer (Resnick et al., 2009).
Without exogenous normalizers, microarray data (standard normalization on the basis of global expression levels) correlate significantly with absolute RT‐qPCR concentrations for miR‐486‐5p (r = 0.79; P = 1.4E‐3), but not for miR‐16‐5p (r = 0.52; P = 6.9E‐2) and miR‐93‐5p (r = 0.49; P = 9.2E‐2) (Figure 4 top panel). We went on to show that the use of exogenous normalizers only for absolute RT‐qPCR concentrations measurements did not influence the correlation with microarray data (standard normalization) for miR‐16‐5p (r = 0.52; P = 7.1E‐2) and miR‐486‐5p (r = 0.84; P = 2.9E‐4), although the correlation becomes slightly significant for miR‐93‐5p (r = 0.55; P = 4.9E‐2) (Figure 4 middle panel). Finally, the use of exogenous normalizers for both absolute RT‐qPCR concentrations and microarray data drastically increased the Pearson coefficients for the two highly expressed miRNAs, miR‐16‐5p (r = 0.93; P = 4.4E‐6) and miR‐486‐5p (r = 0.97; P = 5.4E‐8) and moderately for the less expressed miRNA, miR‐93‐5p (r = 0.66; P = 1.4E‐2) (Figure 4 bottom panel). Furthermore, we showed that the use of miR‐16‐5p as a common endogenous normalizer for both absolute RT‐qPCR concentrations and microarray data drastically increased the Pearson coefficients for miR‐486‐5p (r = 0.95; P = 8.9E‐7) and miR‐93‐5p (r = 0.76; P = 2.4E‐3) (see Supplemental Figure S6). However, the use of miR‐16‐5p as an endogenous normalizer only for microarray data did not modify the correlation with absolute RT‐qPCR concentrations normalized with exogenous miRNAs.
Figure 4.
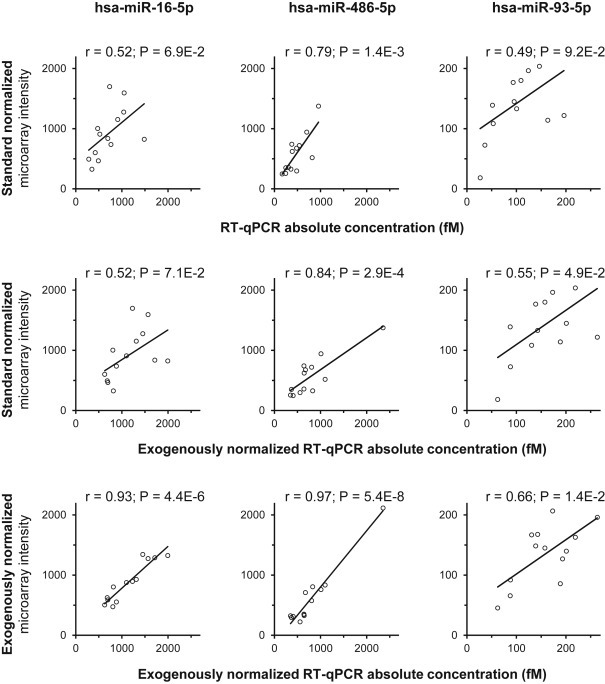
Common exogenous normalization strategy of microarray and RT‐qPCR miRNA expression data increases their cross‐correlation. Standard microarray expressions of miR‐16‐5p, miR‐486‐5p and miR‐93‐5p were correlated with their absolute (top panel) or exogenous normalized (middle panel) RT‐qPCR concentrations, isolated using NucleoSpin® kit from 13 cancer sera. Their exogenous normalized microarray expressions were correlated with their exogenous normalized RT‐qPCR concentrations (bottom panel). Data are Pearson‐tests correlations and P values.
4. Discussion
To date, a poor overlap across studies impairs the validation of circulating miRNA signatures that could be used into clinical practice. Due to variability in miRNA isolation and profiling steps, clinical studies may lead to the identification of biased profiles, of which only subsets of the miRNAs clinical signature could be validated by RT‐qPCR. Here, a new methodology was proposed to reduce and control the inter‐sample variability at the profiling step.
Considering that profiling method reproducibility and sensitivity are related to miRNA concentrations, variability could be reduced using more concentrated miRNA samples. Because RNA concentration protocols and/or pre‐amplification additional steps may introduce some inter‐sample technical variability (Jarry et al., 2014), the choice of an appropriate miRNA isolation kit dedicated to serum/plasma samples remains of importance. Despite the miRNeasy kit presents the highest theoretical concentration factor, our data showed that the NucleoSpin® miRNA plasma kit provides higher endogenous miRNA concentrations and performs as well as the others, when reproducibility is assessed. Using high‐throughput PCR arrays, the NucleoSpin® miRNA plasma kit has been recently described as more efficient than other kits (miRNeasy and Norgen) to isolate serum miRNAs (Monleau et al., 2014) and as presenting the least extraction bias (Tan et al., 2015) in agreement with our individual PCR assays. We provided additional data showing its higher performance on both serum and plasma miRNA isolation using individual absolute RT‐qPCR. Moreover, the NucleoSpin® kit could be processed with less handling time and a lower cost per sample in comparison to the other kits (Table 1). Although this kit remains poorly used, it has already been employed to define miRNA signatures in clinical studies which still remain to be validated (Meng et al., 2015; Müller et al., 2014; Stückrath et al., 2015). Although the three isolation kits tested are dedicated to blood samples, we have shown that they can isolate miRNAs from ascites samples; however, only the miRNeasy and mirVana™ PARIS™ kits seems to be suitable for use on urine samples in contrast to NucleoSpin® miRNA plasma kit. This may be related to its protein precipitation step and the very low protein level in urines.
As previously described (McDonald et al., 2011), we also noticed that the miR‐16‐5p concentrations seem to be higher in plasma than in serum extracts whereas the extraction yields followed inconsistently inversed variations. MiR‐16‐5p is the most expressed miRNA in red blood cells (Pritchard et al., 2012), and hemolysis leads to substantial increase of its serum concentration (Kirschner et al., 2011; McDonald et al., 2011). The presence of a separator gel in the tubes designed for serum processing (but not in EDTA plasma tubes) may lead to a differential hemolytic contamination that is independent of the extraction yields, between serum and plasma samples. The presence of EDTA in plasma tubes could inhibit RNA precipitation, leading to weaker isolation yields, although this effect has not been shown with silica columns (Kim et al., 2012). Whereas some authors suggested that miRNAs are more concentrated in serum than plasma (Moldovan et al., 2014), and the others the contrary (McDonald et al., 2011), it could be interesting to study whether this discrepancy could be related to hemolysis, or other technical artifacts.
Using absolute RT‐qPCR, the three cel‐miRs undergo different extraction yields with all three kits. Surprisingly, cel‐miR‐39‐3p undergoes lower isolation yields than the two others. To our knowledge, the difference in isolation yields across exogenous cel‐miRs has not been reported elsewhere. However, a recent study, using the NucleoSpin® miRNA plasma kit, showed a significant correlation between miRNAs with higher GC content and decreased isolation yields (Monleau et al., 2014). Accordingly, the cel‐miR‐39‐3p has a higher percentage of GC (50.0%) than cel‐miR‐54‐3p (41.7%) and cel‐miR‐238‐3p (43.5%). It was also shown that secondary structures can affect the recovery yield of miRNAs using Trizol reagent (Kim et al., 2012). Using RNA Fold algorithm (Gruber et al., 2008), we noticed that cel‐miR‐39‐3p could adopt a secondary structure with a minimum free energy of −2.20 kcal/mol (ΔG = −2.63 kcal/mol) whereas the other cel‐miRs cannot (ΔG = −0.15 kcal/mol and −0.70 kcal/mol for cel‐miR‐54‐3p and cel‐miR‐238‐3p, respectively), suggesting that cel‐miR‐39‐3p may be less also efficiently recovered using silica columns (see Supplemental Figure 7). However, the isolation yields of the three cel‐miRs are well correlated across blood samples, patients and isolation kits, suggesting that each miRNA exhibits its own yield which stays proportional across samples. We thus proposed to use the geometrical mean of three cel‐miRs as a mean isolation yield to measure cross‐samples variations and to estimate the endogenous miRNA concentrations in biofluids.
We showed that the use of exogenous cel‐miRs presents less variability than strategies based on endogenous components concentration such as the frequently used miR‐16‐5p (Bihrer et al., 2011; Cookson et al., 2012; Schwarzenbach et al., 2015) or total RNA (Liu et al., 2012). These observations are in agreement with the literature suggesting that endogenous RNAs are subjected to multifactorial variations across patients such as inter‐sample heterogeneity and pre‐isolations steps (sampling, freezing, thawing…) (Schwarzenbach et al., 2015, 2014). To validate endogenous normalizers, it would be interesting to show that their increased variability in comparison to exogenous ones is mainly related to the pre‐isolations steps rather than inter‐sample heterogeneity. To date, without consensus on validated endogenous control, their use may have serious impact on the biological data interpretation. Hence, the exogenous normalization represents the best available option to normalize circulating miRNA expression as long as endogenous normalizers have not been validated.
Usually, microarray data are normalized using spiked‐in added in RNA extracts before the fluorescence labeling step (standard normalization) leading to a differential normalization strategy between identification and validation steps. The main goal of this study was to validate a normalization method which could control most of the variability related to the extraction, assay, labeling and profiling steps. Considering that the introduction of exogenous cel‐miRs is suitable in normalizing absolute RT‐qPCR data during the validation step (Mitchell et al., 2008), we proposed to extend their use to normalize high‐throughput approaches. Normalizing microarray miRNA expression using the geometrical mean of three cel‐miRs added at the beginning of the extraction step increased their correlation with absolute RT‐qPCR estimated miRNA concentrations in biofluids, in comparison to standard normalization. This common exogenous normalization strategy between discovery and validation steps may provide less false‐positives/‐negatives miRNA biomarkers candidates. This could therefore improve the clinical studies validation rates and eventually the number of relevant biomarkers. A common endogenous normalization of both microarrays and RT‐qPCR has been previously described using the miR‐3196 as a control on the basis of its apparent cross sample stability. However, among the eight candidate miRNAs identified, five including miR‐486, showed different variations between profiling and validation steps (Ganepola et al., 2014). Therefore, this common normalization of profiling and validation steps based on only one endogenous control (less expressed than miR‐16‐5p) leads to a low validation rate underlining the beneficial aspect of three exogenous normalizers.
Beyond the global correlation improvement, our strategy could reach a correlation coefficient of 0.95 for the highly expressed miRNAs. Otherwise, due to microarray intensity variability, moderately expressed miRNA exhibited lower correlation coefficient than highly expressed miRNAs, but nevertheless its correlation was noticeably improved. This observation strengthened the need of highly concentrated miRNA extracts to reduce the profiling variability.
For this study, we used the last Affymetrix microarray version (GeneChip® miRNA 4.0 Array) which has never been used to profile circulating miRNAs and compared to other profiling methods. It has been reported that Agilent arrays (Human miRNA Microarray Kit, Release 16.0) could be a good alternative to the Affymetrix arrays (GeneChip® miRNA 2.0 Array) on the basis of its accuracy (Mestdagh et al., 2014), but is not suitable for exogenous normalization due to the absence of cel‐miRs probes. The choice of microarrays to profile miRNAs is not consensual and some studies reported low correlations with other profiling methods [i.e. RT‐qPCR arrays and NGS (Pradervand et al., 2010)]. However, in order to establish profiles that can be validated, the cross‐correlation between profiling methods is less important than the correlation between profiling and validation methods across samples. In this regards, we and the others show a good correlation between microarrays and individual RT‐qPCR (Ach et al., 2008). Otherwise, PCR arrays and NGS due to their amplification steps present higher sensitivity but lower specificity than microarrays. Therefore, it could be interesting to study whether our exogenous normalization strategy could be transposed to others profiling methods able to detect exogenous miRNAs. However, in absence of a consensual profiling method to identify circulating miRNAs as biomarkers candidates, our work strengthens the interest of microarrays to establish circulating miRNAs profiles that can be reliably validated.
5. Conclusions
This work proposed a new standardized strategy to increase miRNA concentrations isolated from serum or plasma samples and to analyze their expression measured by both microarrays and absolute RT‐qPCR using a common exogenous normalization. Overall this strategy could improve the correlations level between high‐throughput (discovery phase) and individual (validation phase) approaches to improve the overlap of miRNAs signatures in clinical studies.
Conflict of interest
The authors declare no conflict of interest.
Supporting information
The following are the supplementary data related to this article:
Supplemental Figure 1 Absolute miRNA quantification using standard curves. Absolute RT‐qPCR experiments were carried out using ten‐fold synthetic miRNAs dilutions among four‐log scales. We determined regression lines slopes of miRNA quantities in log10 on quantitative cycles (Cq) and we calculated PCR efficiencies calculated using the formula E = 10−slope −1. Coefficients of correlation were calculated by Pearson‐tests.
Supplemental Figure 2 Comparative analysis of the performance of serum/plasma dedicated miRNA isolation kits to extract miRNAs from other biofluids (ascites and urines samples). The miR‐16‐5p relative concentrations (to that provided by miRNeasy kit) were measured by RT‐qPCR in RNA extracts from the ascites of 3 ovarian cancer patients (A) and the urines of 3 other ovarian cancer patients (B). Data are means ± S.E.M, Student‐tests P values. NS, not significant.
Supplemental Figure 3 NucleoSpin® kit provides the highest total RNA concentration. Total RNA concentration obtained with miRNeasy, NucleoSpin® or mirVana™ PARIS™ kits from patient 3 biofluids measured with the dedicated Small RNA kit using a Bioanalyzer. Data are means of three independent RNA isolations ± S.E.M. NS, not significant, *P < 0.05, **P < 0.01, by Student t‐tests.
Supplemental Figure 4 Exogenous miRNA concentrations offers lower inter‐sample variability than total RNA concentration and they did not correlate. Exogenous miRNAs and total RNA concentrations measured using RT‐qPCR and Quant‐it™ RiboGreen®, respectively from RNA isolated by NucleoSpin® kit, were compared based on their coefficients of variation from the serum of 13 ovarian cancer patients (A) and were cross‐correlated (B). Data are CV, means and Pearson‐tests correlations and P values.
Supplemental Figure 5 Isolation yields of cel‐miR‐39‐3p are significantly lower than cel‐miR‐54‐3p and cel‐miR‐238‐3p with NucleoSpin® and mirVana™ PARIS™ kits. The isolation yields of cel‐miR‐39‐3p, cel‐miR‐54‐3p and cel‐miR‐238‐3p exogenous miRNAs were calculated from the serum and plasma of three ovarian cancer patients in triplicates, using miRNeasy (A) and mirVana™ PARIS™ kits (B). Data are means ± S.E.M, Student‐tests P values. NS, not significant; *, P < 0.05; **, P < 0.01; ***, P < 0.001.
Supplemental Figure 6 Common endogenous normalization strategy of microarray and RT‐qPCR miRNA expression increases their cross‐correlation. From the serum of 13 ovarian cancer patients isolated using NucleoSpin® kit, the microarray expressions of miR‐486‐5p and miR‐93‐5p, normalized according to miR‐16‐5p expression, were correlated with their absolute or exogenous normalized RT‐qPCR concentrations. Data are Pearson‐tests correlations and P values.
Supplemental Figure 7 Predicted secondary structures of C. elegans synthetic miRNAs. The free energy of the thermodynamic ensemble and the minimum free energy of the optimal secondary structures were determined for cel‐miR‐39‐3p, cel‐miR‐54‐3p and cel‐miR‐238‐3p using RNA fold algorithm (Gruber et al., 2008).
Acknowledgments
N.V. is a recipient of a doctoral fellowship from the French Ministry for Higher Education and Research. This work was supported by a grant from ‘l'Ecole de l'Inserm – Liliane Bettencourt’ (to N.V.). This work was supported by the ‘National Institute of Health and Medical’ (Inserm); the ‘French League against Cancer’ (Ligue contre le Cancer, Calvados's and Orne committees); the ‘University of Caen Normandie’ (UNICAEN); the ‘Regional Council of Normandy’ (Conseil Régional de Normandie); the French State; and the European Community (Fonds Européens pour le Développement de la Recherche – FEDER). The figures were prepared to be readily interpreted by readers with impaired color vision using a palette of unambiguous colors (http://jfly.iam.u‐tokyo.ac.jp/color/#pallet).
Supplementary data 1.
1.1.
Supplementary data related to this article can be found at http://dx.doi.org/10.1016/j.molonc.2016.03.005.
Vigneron Nicolas, Meryet-Figuière Matthieu, Guttin Audrey, Issartel Jean-Paul, Lambert Bernard, Briand Mélanie, Louis Marie-Hélène, Vernon Mégane, Lebailly Pierre, Lecluse Yannick, Joly Florence, Krieger Sophie, Lheureux Stéphanie, Clarisse Bénédicte, Leconte Alexandra, Gauduchon Pascal, Poulain Laurent, Denoyelle Christophe, (2016), Towards a new standardized method for circulating miRNAs profiling in clinical studies: Interest of the exogenous normalization to improve miRNA signature accuracy, Molecular Oncology, 10, doi: 10.1016/j.molonc.2016.03.005.
References
- Ach, R.A. , Wang, H. , Curry, B. , 2008. Measuring microRNAs: comparisons of microarray and quantitative PCR measurements, and of different total RNA prep methods. BMC Biotechnol. 8, 69 10.1186/1472-6750-8-69 [DOI] [PMC free article] [PubMed] [Google Scholar]
- Bihrer, V. , Waidmann, O. , Friedrich-Rust, M. , Forestier, N. , Susser, S. , Haupenthal, J. , Welker, M. , Shi, Y. , Peveling-Oberhag, J. , Polta, A. , von Wagner, M. , Radeke, H.H. , Sarrazin, C. , Trojan, J. , Zeuzem, S. , Kronenberger, B. , Piiper, A. , 2011. Serum MicroRNA-21 as marker for necroinflammation in Hepatitis C patients with and without hepatocellular carcinoma. PLoS One. 6, e26971 10.1371/journal.pone.0026971 [DOI] [PMC free article] [PubMed] [Google Scholar]
- Bustin, S.A. , Benes, V. , Garson, J. , Hellemans, J. , Huggett, J. , Kubista, M. , Mueller, R. , Nolan, T. , Pfaffl, M.W. , Shipley, G. , Wittwer, C.T. , Schjerling, P. , Day, P.J. , Abreu, M. , Aguado, B. , Beaulieu, J.-F. , Beckers, A. , Bogaert, S. , Browne, J.A. , Carrasco-Ramiro, F. , Ceelen, L. , Ciborowski, K. , Cornillie, P. , Coulon, S. , Cuypers, A. , De Brouwer, S. , De Ceuninck, L. , De Craene, J. , De Naeyer, H. , De Spiegelaere, W. , Deckers, K. , Dheedene, A. , Durinck, K. , Ferreira-Teixeira, M. , Fieuw, A. , Gallup, J.M. , Gonzalo-Flores, S. , Goossens, K. , Heindryckx, F. , Herring, E. , Hoenicka, H. , Icardi, L. , Jaggi, R. , Javad, F. , Karampelias, M. , Kibenge, F. , Kibenge, M. , Kumps, C. , Lambertz, I. , Lammens, T. , Markey, A. , Messiaen, P. , Mets, E. , Morais, S. , Mudarra-Rubio, A. , Nakiwala, J. , Nelis, H. , Olsvik, P.A. , Pérez-Novo, C. , Plusquin, M. , Remans, T. , Rihani, A. , Rodrigues-Santos, P. , Rondou, P. , Sanders, R. , Schmidt-Bleek, K. , Skovgaard, K. , Smeets, K. , Tabera, L. , Toegel, S. , Van Acker, T. , Van den Broeck, W. , Van der Meulen, J. , Van Gele, M. , Van Peer, G. , Van Poucke, M. , Van Roy, N. , Vergult, S. , Wauman, J. , Tshuikina-Wiklander, M. , Willems, E. , Zaccara, S. , Zeka, F. , Vandesompele, J. , 2013. The need for transparency and good practices in the qPCR literature. Nat. Methods. 10, 1063–1067. 10.1038/nmeth.2697 [DOI] [PubMed] [Google Scholar]
- Cookson, V.J. , Bentley, M.A. , Hogan, B.V. , Horgan, K. , Hayward, B.E. , Hazelwood, L.D. , Hughes, T.A. , 2012. Circulating microRNA profiles reflect the presence of breast tumours but not the profiles of microRNAs within the tumours. Cell. Oncol. (Dordr.). 35, 301–308. 10.1007/s13402-012-0089-1 [DOI] [PubMed] [Google Scholar]
- Cortez, M.A. , Bueso-Ramos, C. , Ferdin, J. , Lopez-Berestein, G. , Sood, A.K. , Calin, G.A. , 2011. MicroRNAs in body fluids—the mix of hormones and biomarkers. Nat. Rev. Clin. Oncol. 8, 467–477. [DOI] [PMC free article] [PubMed] [Google Scholar]
- Croce, C.M. , 2009. Causes and consequences of microRNA dysregulation in cancer. Nat. Rev. Genet. 10, 704–714. 10.1038/nrg2634 [DOI] [PMC free article] [PubMed] [Google Scholar]
- Ganepola, G.A. , Rutledge, J.R. , Suman, P. , Yiengpruksawan, A. , Chang, D.H. , 2014. Novel blood-based microRNA biomarker panel for early diagnosis of pancreatic cancer. World J. Gastrointest. Oncol. 6, 22–33. 10.4251/wjgo.v6.i1.22 [DOI] [PMC free article] [PubMed] [Google Scholar]
- Gillis, A.J.M. , Rijlaarsdam, M.A. , Eini, R. , Dorssers, L.C.J. , Biermann, K. , Murray, M.J. , Nicholson, J.C. , Coleman, N. , Dieckmann, K.-P. , Belge, G. , Bullerdiek, J. , Xu, T. , Bernard, N. , Looijenga, L.H.J. , 2013. Targeted serum miRNA (TSmiR) test for diagnosis and follow-up of (testicular) germ cell cancer patients: a proof of principle. Mol. Oncol. 7, 1083–1092. 10.1016/j.molonc.2013.08.002 [DOI] [PMC free article] [PubMed] [Google Scholar]
- Gruber, A.R. , Lorenz, R. , Bernhart, S.H. , Neuböck, R. , Hofacker, I.L. , 2008. The Vienna RNA websuite. Nucleic Acids Res. 36, W70–W74. 10.1093/nar/gkn188 [DOI] [PMC free article] [PubMed] [Google Scholar]
- Ha, M. , Kim, V.N. , 2014. Regulation of microRNA biogenesis. Nat. Rev. Mol. Cell Biol. 15, 509–524. 10.1038/nrm3838 [DOI] [PubMed] [Google Scholar]
- Jarry, J. , Schadendorf, D. , Greenwood, C. , Spatz, A. , van Kempen, L.C. , 2014. The validity of circulating microRNAs in oncology: five years of challenges and contradictions. Mol. Oncol. 8, 819–829. 10.1016/j.molonc.2014.02.009 [DOI] [PMC free article] [PubMed] [Google Scholar]
- Kim, Y.-K. , Yeo, J. , Kim, B. , Ha, M. , Kim, V.N. , 2012. Short structured RNAs with low GC content are selectively lost during extraction from a small number of cells. Mol. Cell. 46, 893–895. 10.1016/j.molcel.2012.05.036 [DOI] [PubMed] [Google Scholar]
- Kirschner, M.B. , Kao, S.C. , Edelman, J.J. , Armstrong, N.J. , Vallely, M.P. , van Zandwijk, N. , Reid, G. , 2011. Haemolysis during sample preparation alters microRNA content of plasma. PLoS One. 6, e24145 10.1371/journal.pone.0024145 [DOI] [PMC free article] [PubMed] [Google Scholar]
- Liu, A.M. , Yao, T.-J. , Wang, W. , Wong, K.-F. , Lee, N.P. , Fan, S.T. , Poon, R.T.P. , Gao, C. , Luk, J.M. , 2012. Circulating miR-15b and miR-130b in serum as potential markers for detecting hepatocellular carcinoma: a retrospective cohort study. BMJ Open. 2, e000825 10.1136/bmjopen-2012-000825 [DOI] [PMC free article] [PubMed] [Google Scholar]
- McDonald, J.S. , Milosevic, D. , Reddi, H.V. , Grebe, S.K. , Algeciras-Schimnich, A. , 2011. Analysis of circulating microRNA: preanalytical and analytical challenges. Clin. Chem. 57, 833–840. 10.1373/clinchem.2010.157198 [DOI] [PubMed] [Google Scholar]
- Meng, X. , Joosse, S.A. , Müller, V. , Trillsch, F. , Milde-Langosch, K. , Mahner, S. , Geffken, M. , Pantel, K. , Schwarzenbach, H. , 2015. Diagnostic and prognostic potential of serum miR-7, miR-16, miR-25, miR-93, miR-182, miR-376a and miR-429 in ovarian cancer patients. Br. J. Cancer. 113, 1358–1366. 10.1038/bjc.2015.340 [DOI] [PMC free article] [PubMed] [Google Scholar]
- Mestdagh, P. , Hartmann, N. , Baeriswyl, L. , Andreasen, D. , Bernard, N. , Chen, C. , Cheo, D. , D'Andrade, P. , DeMayo, M. , Dennis, L. , Derveaux, S. , Feng, Y. , Fulmer-Smentek, S. , Gerstmayer, B. , Gouffon, J. , Grimley, C. , Lader, E. , Lee, K.Y. , Luo, S. , Mouritzen, P. , Narayanan, A. , Patel, S. , Peiffer, S. , Rüberg, S. , Schroth, G. , Schuster, D. , Shaffer, J.M. , Shelton, E.J. , Silveria, S. , Ulmanella, U. , Veeramachaneni, V. , Staedtler, F. , Peters, T. , Guettouche, T. , Wong, L. , Vandesompele, J. , 2014. Evaluation of quantitative miRNA expression platforms in the microRNA quality control (miRQC) study. Nat. Methods. 11, 809–815. 10.1038/nmeth.3014 [DOI] [PubMed] [Google Scholar]
- Mitchell, P.S. , Parkin, R.K. , Kroh, E.M. , Fritz, B.R. , Wyman, S.K. , Pogosova-Agadjanyan, E.L. , Peterson, A. , Noteboom, J. , O'Briant, K.C. , Allen, A. , Lin, D.W. , Urban, N. , Drescher, C.W. , Knudsen, B.S. , Stirewalt, D.L. , Gentleman, R. , Vessella, R.L. , Nelson, P.S. , Martin, D.B. , Tewari, M. , 2008. Circulating microRNAs as stable blood-based markers for cancer detection. Proc. Natl. Acad. Sci. U. S. A. 105, 10513–10518. 10.1073/pnas.0804549105 [DOI] [PMC free article] [PubMed] [Google Scholar]
- Moldovan, L. , Batte, K.E. , Trgovcich, J. , Wisler, J. , Marsh, C.B. , Piper, M. , 2014. Methodological challenges in utilizing miRNAs as circulating biomarkers. J. Cell. Mol. Med. 18, 371–390. 10.1111/jcmm.12236 [DOI] [PMC free article] [PubMed] [Google Scholar]
- Monleau, M. , Bonnel, S. , Gostan, T. , Blanchard, D. , Courgnaud, V. , Lecellier, C.-H. , 2014. Comparison of different extraction techniques to profile microRNAs from human sera and peripheral blood mononuclear cells. BMC Genomics. 15, 395 10.1186/1471-2164-15-395 [DOI] [PMC free article] [PubMed] [Google Scholar]
- Müller, V. , Gade, S. , Steinbach, B. , Loibl, S. , von Minckwitz, G. , Untch, M. , Schwedler, K. , Lübbe, K. , Schem, C. , Fasching, P.A. , Mau, C. , Pantel, K. , Schwarzenbach, H. , 2014. Changes in serum levels of miR-21, miR-210, and miR-373 in HER2-positive breast cancer patients undergoing neoadjuvant therapy: a translational research project within the Geparquinto trial. Breast Cancer Res. Treat. 147, 61–68. 10.1007/s10549-014-3079-3 [DOI] [PubMed] [Google Scholar]
- Pradervand, S. , Weber, J. , Lemoine, F. , Consales, F. , Paillusson, A. , Dupasquier, M. , Thomas, J. , Richter, H. , Kaessmann, H. , Beaudoing, E. , Hagenbüchle, O. , Harshman, K. , 2010. Concordance among digital gene expression, microarrays, and qPCR when measuring differential expression of microRNAs. BioTechniques. 48, 219–222. 10.2144/000113367 [DOI] [PubMed] [Google Scholar]
- Pritchard, C.C. , Kroh, E. , Wood, B. , Arroyo, J.D. , Dougherty, K.J. , Miyaji, M.M. , Tait, J.F. , Tewari, M. , 2012. Blood cell origin of circulating microRNAs: a cautionary note for cancer biomarker studies. Cancer Prev. Res. (Phila.). 5, 492–497. 10.1158/1940-6207.CAPR-11-0370 [DOI] [PMC free article] [PubMed] [Google Scholar]
- Resnick, K.E. , Alder, H. , Hagan, J.P. , Richardson, D.L. , Croce, C.M. , Cohn, D.E. , 2009. The detection of differentially expressed microRNAs from the serum of ovarian cancer patients using a novel real-time PCR platform. Gynecol. Oncol. 112, 55–59. [DOI] [PubMed] [Google Scholar]
- Schwarzenbach, H. , da Silva, A.M. , Calin, G. , Pantel, K. , 2015. Data normalization strategies for MicroRNA quantification. Clin. Chem. 61, 1333–1342. 10.1373/clinchem.2015.239459 [DOI] [PMC free article] [PubMed] [Google Scholar]
- Schwarzenbach, H. , Nishida, N. , Calin, G.A. , Pantel, K. , 2014. Clinical relevance of circulating cell-free microRNAs in cancer. Nat. Rev. Clin. Oncol. 11, 145–156. 10.1038/nrclinonc.2014.5 [DOI] [PubMed] [Google Scholar]
- Stückrath, I. , Rack, B. , Janni, W. , Jäger, B. , Pantel, K. , Schwarzenbach, H. , 2015. Aberrant plasma levels of circulating miR-16, miR-107, miR-130a and miR-146a are associated with lymph node metastasis and receptor status of breast cancer patients. Oncotarget. 6, 13387–13401. 10.18632/oncotarget.3874 [DOI] [PMC free article] [PubMed] [Google Scholar]
- Tan, G.W. , Khoo, A.S.B. , Tan, L.P. , 2015. Evaluation of extraction kits and RT-qPCR systems adapted to high-throughput platform for circulating miRNAs. Sci. Rep. 5, 9430 10.1038/srep09430 [DOI] [PMC free article] [PubMed] [Google Scholar]
- Witwer, K.W. , 2015. Circulating microRNA biomarker studies: pitfalls and potential solutions. Clin. Chem. 61, 56–63. 10.1373/clinchem.2014.221341 [DOI] [PubMed] [Google Scholar]
- Wu, K. , Li, L. , Li, S. , 2015. Circulating microRNA-21 as a biomarker for the detection of various carcinomas: an updated meta-analysis based on 36 studies. Tumour Biol. – J. Int. Soc. Oncodevelopmental Biol. Med. 36, 1973–1981. 10.1007/s13277-014-2803-2 [DOI] [PubMed] [Google Scholar]
Associated Data
This section collects any data citations, data availability statements, or supplementary materials included in this article.
Supplementary Materials
The following are the supplementary data related to this article:
Supplemental Figure 1 Absolute miRNA quantification using standard curves. Absolute RT‐qPCR experiments were carried out using ten‐fold synthetic miRNAs dilutions among four‐log scales. We determined regression lines slopes of miRNA quantities in log10 on quantitative cycles (Cq) and we calculated PCR efficiencies calculated using the formula E = 10−slope −1. Coefficients of correlation were calculated by Pearson‐tests.
Supplemental Figure 2 Comparative analysis of the performance of serum/plasma dedicated miRNA isolation kits to extract miRNAs from other biofluids (ascites and urines samples). The miR‐16‐5p relative concentrations (to that provided by miRNeasy kit) were measured by RT‐qPCR in RNA extracts from the ascites of 3 ovarian cancer patients (A) and the urines of 3 other ovarian cancer patients (B). Data are means ± S.E.M, Student‐tests P values. NS, not significant.
Supplemental Figure 3 NucleoSpin® kit provides the highest total RNA concentration. Total RNA concentration obtained with miRNeasy, NucleoSpin® or mirVana™ PARIS™ kits from patient 3 biofluids measured with the dedicated Small RNA kit using a Bioanalyzer. Data are means of three independent RNA isolations ± S.E.M. NS, not significant, *P < 0.05, **P < 0.01, by Student t‐tests.
Supplemental Figure 4 Exogenous miRNA concentrations offers lower inter‐sample variability than total RNA concentration and they did not correlate. Exogenous miRNAs and total RNA concentrations measured using RT‐qPCR and Quant‐it™ RiboGreen®, respectively from RNA isolated by NucleoSpin® kit, were compared based on their coefficients of variation from the serum of 13 ovarian cancer patients (A) and were cross‐correlated (B). Data are CV, means and Pearson‐tests correlations and P values.
Supplemental Figure 5 Isolation yields of cel‐miR‐39‐3p are significantly lower than cel‐miR‐54‐3p and cel‐miR‐238‐3p with NucleoSpin® and mirVana™ PARIS™ kits. The isolation yields of cel‐miR‐39‐3p, cel‐miR‐54‐3p and cel‐miR‐238‐3p exogenous miRNAs were calculated from the serum and plasma of three ovarian cancer patients in triplicates, using miRNeasy (A) and mirVana™ PARIS™ kits (B). Data are means ± S.E.M, Student‐tests P values. NS, not significant; *, P < 0.05; **, P < 0.01; ***, P < 0.001.
Supplemental Figure 6 Common endogenous normalization strategy of microarray and RT‐qPCR miRNA expression increases their cross‐correlation. From the serum of 13 ovarian cancer patients isolated using NucleoSpin® kit, the microarray expressions of miR‐486‐5p and miR‐93‐5p, normalized according to miR‐16‐5p expression, were correlated with their absolute or exogenous normalized RT‐qPCR concentrations. Data are Pearson‐tests correlations and P values.
Supplemental Figure 7 Predicted secondary structures of C. elegans synthetic miRNAs. The free energy of the thermodynamic ensemble and the minimum free energy of the optimal secondary structures were determined for cel‐miR‐39‐3p, cel‐miR‐54‐3p and cel‐miR‐238‐3p using RNA fold algorithm (Gruber et al., 2008).