Abstract
Many of the mutagenic or lethal effects of ionization radiation can be attributed to damage caused to the DNA by low-energy electrons. To gain insight on the parameters affecting this process, we measured the low-energy electron (<2 eV) transmission yield through self-assembled monolayers of short DNA oligomers. The electrons that are not transmitted are captured by the layer. Hence, the transmission reflects the capturing efficiency of the electrons by the layer. The dependence of the capturing probability on the base sequence was studied, as was the state of the captured electrons. It is found that the capturing probability scales with the number of G bases in the single-stranded oligomers and depends on their clustering level. Using two-photon photoelectron spectroscopy, we find that, once captured, the electrons do not reside on the bases. Rather, the state of the captured electrons is insensitive to the sequence of the oligomer. Double-stranded DNA does not capture electrons as efficiently as single-stranded oligomers; however, once captured, the electrons are bound more strongly than to the single strands.
Keywords: monolayer, radiation damage, guanine, photoemission
Many of the mutagenic or lethal effects of ionization radiation can be attributed to secondary electrons that are created within 10-15 sec along radiation tracks and spurs and have kinetic energies <20 eV (1, 2). Experimental (3) and theoretical (4–6) studies indicate that electrons with subionization energies play an important role in inducing damage in DNA (7). Our goal in the present work is to determine the structural and chemical elements in the DNA that are governing the electron-capturing process by studying electron transmission through organized adsorbed layers of DNA.
The detailed mechanism for electron–DNA interaction is difficult to address experimentally in vivo, where many parameters affect the electron–DNA interaction and the electron energy is not well defined. Therefore, we investigated the interaction of electrons possessing well defined energy, with monolayers of single-stranded (ss) and double-stranded (ds) DNA oligomers adsorbed on a gold surface. By methodically varying the bases in the oligomers, the effect of each base on the interaction with electrons could be determined, as could the difference between single and double strands. Furthermore, the binding energy of the captured electrons could be determined.
Past findings hint that G bases act as “DNA protectors.” For example, G-rich telomeres found at the ends of chromosomes (8) were shown recently to increase the resistance of DNA to ionizing radiation (9). It is also well accepted that G is the most easily oxidized nucleotide (10, 11). It has been demonstrated also that positive charges can transport over long distances in DNA through multistep hopping between G bases (12, 13). The putative role of G bases as protectors of the genome from electrons with kinetic energies greater than the ionization energy of the bases seems to result from their ability to easily form cations (14, 15). Hence, in our study we specifically concentrated on the role of the G bases in the interaction of the DNA oligomers with the electrons.
Here we present a demonstration of the importance of G bases as electron capturers in a condensed state of the DNA and not in the gas phase. Furthermore, our results indicate that the captured electrons do not reside on the bases and show that ds DNA is more inert to low-energy electrons than the ss DNA.
Materials and Methods
Self-assembled DNA monolayers were prepared according to standard procedure (16, 17) by depositing 3′-thiolated 15-mers of DNA on clean gold substrates. Fifteen-base ss, disulfide (S–S)-protected oligonucleotides (MWG Biotech, Ebersberg, Germany) were suspended in 0.4 M phosphate buffer (pH 7.2). The clean gold slide was covered with the oligomer solution (50 μM) and kept overnight in a clean and controlled humid environment. After deposition, the slides were washed thoroughly.
To form layers of ds DNA, 3′ thiolated ss DNA was hybridized ex situ with its complementary nonthiolated DNA oligomer by combining equal amounts of the two oligomers in 0.4 M phosphate buffer (pH 7.2) and heating the mixture for 10 min at 80°C, followed by slow cooling to room temperature over several hours. Complete hybridization was determined by nondenaturing gel analysis. The hybridized ds oligomers then were deposited by using the same protocol as that for ss DNA oligomers.
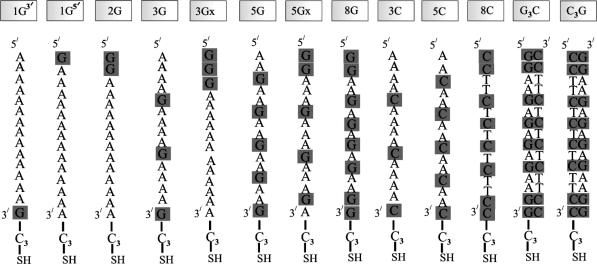
Fig. 1 shows the different DNA oligomers and their corresponding abbreviations used in the current study. Atomic force microscopy, contact-angle measurements, and ellipsometry were used to characterize the monolayers. The thickness of the monolayers consisting of the various ss DNA oligomers was found to be 3.2 ± 0.2 nm, regardless of the sequence of the oligomer, and the thickness of the monolayer made from ds DNA was 3.7 ± 0.2 nm. 32P-labeled DNA oligomers were used to characterize the adsorption quantitatively. For all the different ss DNA oligomers, the monolayer density was found to be n = 1.4 ± 0.4 × 10¹³ molecules per cm2 (as determined by Fuji PhosphorImager analysis). This density is in agreement with a theoretical calculation of the expected density of a closely packed monolayer based on the size of the molecules. The results obtained for the ds DNA oligomers are also consistent with this density. The adsorbed oligomers most likely contain structural water molecules even when placed in an ultra-high-vacuum chamber (18).
Fig. 1.
The different DNA oligomers used in the experiment and their abbreviations. In oligomers 3Gx and 5Gx, the G bases are clustered together. G3C and C3G are ds oligomers bound to the substrate through a propyl-thiol group attached to either the G or C ss oligomer, respectively.
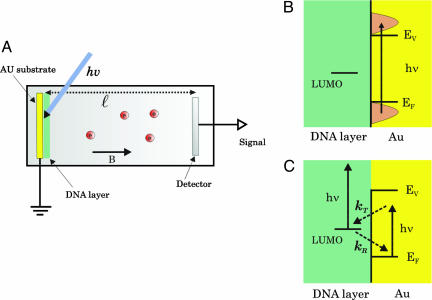
In the experiment (Fig. 2), photoelectrons are ejected from the gold substrate on which the molecules are adsorbed (19). The sample is held in an ultra-high-vacuum chamber [10-9 torr (1 torr = 133 Pa)]. An excimer laser operating at 193 nm (6.4 eV) is used for ejecting the electrons. Its energy is kept very low (20 pJ per pulse, energy density ≈ 2 nJ/cm2) to avoid any nonlinear processes. The sample is exposed to the laser beam for only 20 μsec to avoid UV-radiation damage. The photon energy is above the gold work function (≈5 eV); however, it is less than the ionization potential of the DNA bases (≈8.4 eV) (20). Therefore, all the photoelectrons originate from the metal substrate. They are transmitted through the DNA monolayer to the vacuum, where their energy is measured by a TOF spectrometer. Electrons that are not transmitted are captured in the layer and transferred back to the grounded metal substrate (Fig. 2C). Because of the short lifetime of the captured electrons and the low-laser intensity and repetition rate, the monolayer is not charged by electrons between two laser pulses. This observation was verified by observing a stable electron energy spectrum, which does not vary with time.
Fig. 2.
The experimental system. (A) A scheme of the experimental setup in which  is the length of the TOF tube and B is the magnetic field applied to collimate the electrons. (B) The energetics involved in the single-photon photoelectrons transmission studies. EF and Ev are the Fermi and vacuum levels, respectively. (C) Schematic energy levels involved in the TPPE studies.
Several control experiments were performed to verify the validity of the electron-transmission results. The first experiment checked whether the UV light, used for ejecting the electrons, damages the adsorbed DNA layer. Radiolabeled DNA oligomers were exposed in solution to 193-nm light with an energy density (100 nJ/cm2) 50 times larger and 106-times-longer exposure time (14 sec) than that used in the experiment (2 nJ/cm2 and 20 μsec). By performing gel electrophoresis analysis, no ss breaks could be detected in the DNA.
Second, by monitoring the electron signal as a function of the laser intensity, we could verify that the electrons ejected from the gold were indeed produced by a single photon. The results indicate that there is a linear dependence of the electron signal on the laser flux.
Finally, to probe the effect of the salt (and therefore counter ion) on our measurements, DNA monolayers on gold were prepared from an ethyl-alcohol solution instead of water, and electron-transmission experiments were performed. The results were identical to those obtained for monolayers made from aqueous solutions of DNA.
Detailed characterization and control experiment data are provided in Supporting Text, which is published as supporting information on the PNAS web site.
Results and Discussion
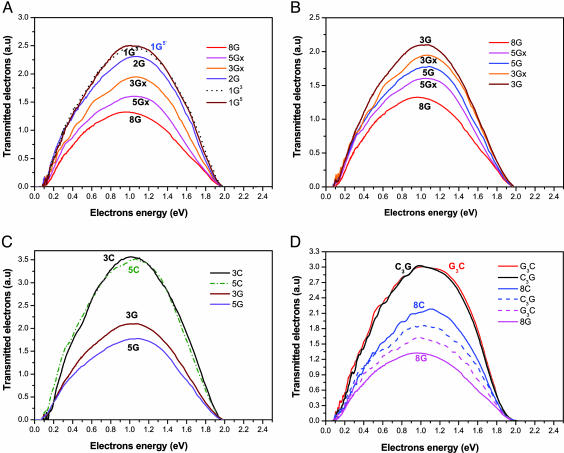
Fig. 3 shows the electron signal versus energy for photoelectrons ejected from the gold substrate and transmitted through monolayers composed of the different ss DNA oligomers. The data in Fig. 3A indicate that the electron-transmission intensity decreases as the fraction of G bases in the DNA oligomer increases. The same transmission efficiency was obtained regardless of whether the single G base was positioned at the 5′ end or 3′ end of the DNA oligomer [farther from (sequence 1G5) or closer to (sequence 1G3) the surface, respectively]. The transmission yield is lower when the G bases are clustered together (oligomers 3Gx and 5Gx; Fig. 3B) than when they are separated by an A base (3G and 5G). In addition, the transmission efficiency was found to be much higher for monolayers made of DNA oligomers consisting of C and A bases, rather than G and A bases (Fig. 3C). The transmission is more efficient through layers made of ds DNA than with the ss one (Fig. 3D). Importantly, the capturing by layers made of ds DNA is by ≈2.3 times less efficient than capturing by a layer made of ss GA-rich oligomers and 1.5 times less efficient than capturing by layers made of ss CT-rich oligomers.
Fig. 3.
Electron transmission spectra. (A) The kinetic energy spectra of photoelectrons transmitted through monolayers made of ss DNA oligomers containing 15 bases with various numbers of G (the rest being A bases). The photon energy is 6.4 eV. The abbreviations of the strand sequences are given in Fig. 1. (B) The effect of clustering of the G bases on the transmission signal. When the G bases are clustered together (3Gx and 5Gx), the transmission yield is reduced compared with the oligomers in which the G is separated by A bases. (C) The kinetic energy spectra of photoelectrons transmitted through monolayers made of various oligomers (see Fig. 1 for the assignment). The transmission through layers made of the 3C and 5C oligomers are compared with 3G and 5G. (D) Kinetic energy spectra of photoelectrons transmitted through layers made of ds DNA (red and black solid lines). For a comparison, the transmission through layers made of ss DNA is shown (8C and 8G). The curves with the dashed lines correspond to the spectra obtained after washing the ds samples with pure water to induce denaturation.
To confirm the effect of the double strand, we washed the samples, after measuring the transmission, extensively with water to denature the ds DNA. After the washing, the transmission efficiency decreased (dashed lines in Fig. 3D), as expected from a ds DNA that had been converted to mainly ss oligomers.
The qualitative description above can become quantitative if one calculates the energy-integrated photoelectron signal. If InG and IAu are the integrated electron transmission signal (Fig. 3) obtained for the nG oligomer and bare gold, respectively, InG = IAu(1 - P), where P = (IAu - InG)/IAu. The energy-integrated capturing probability calculated for each oligomer is shown in Table 1. Within the studied electrons energy range, the capturing probability was found to be energy-independent.
Table 1. The electron-capturing probability.
| Strand | 1G3′ | 1G5′ | 2G | 3G | 3Gx | 5G | 5Gx | 8G | 5C | 3C | G3C | C3G |
|---|---|---|---|---|---|---|---|---|---|---|---|---|
| Capturing probability, % ± 2* | 44 | 43 | 47 | 54 | 57 | 61 | 65 | 71 | 22 | 22 | 31 | 33 |
| Capturing probability, % ± 3† | 44 | 46 | 51 | 51 | 58 | 57 | 64 | 81 | — | — | 66 | 39 |
Obtained from electron transmission studies when the capturing probability is given by (IAu – InG)/IAu, when IAu is the energy-integrated photoelectron signal obtained for bare gold and InG is the integrated electron transmission signal (Fig. 3) obtained for the nG oligomer
The calculated capturing probability is based on the TPPE signal (Fig. 5) and is normalized relative to the signal obtained for 1G3′ oligomer
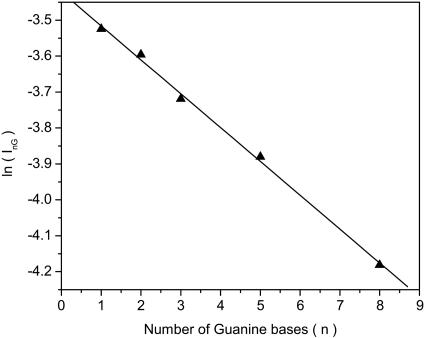
InG can be represented by, InG = IAue-Nn(σG–σA), where N is the number of adsorbed molecules per unit area, and σG and σA are the scattering cross sections for an electron scattered from a G and an A base, respectively. Fig. 4 shows that indeed a plot of ln(InG) versus n produces a good approximation to a straight line. The slope indicates that σG - σA = (67 ± 24) × 10-16 cm2. This difference in cross section is large but not unreasonable for an electron interacting with a molecule possessing a large dipole moment. Boudaiffa et al. (21) measured the cross section for 10- to 50-eV electron damage to DNA by creating DNA strand breaks and obtained values of up to 30 × 10-16 cm2. Because the capture cross section of the electrons is expected to be higher than for the actual breaking of the DNA, the results obtained here are consistent with those discussed in ref. 21.
Fig. 4.
The measured integrated transmission yield (InG) as a function of the number of G bases in the DNA oligomers. The straight line indicates that InG = IAue-Nn(σG–σA) with σG - σA = (67 ± 24) × 10-16 cm2.
To explore the state of the captured electrons on the adsorbed layer, we conducted two-photon photoemission (TPPE) studies (22, 23). In these experiments, electrons are excited in the metal substrate with photon energy below the work function of the substrate. Some of these electrons are transferred to the lowest unoccupied molecular orbital (LUMO) of the adsorbed layer. A second photon is used to eject these electrons from the LUMO to the vacuum, and their kinetic energy, Ek, is measured (Fig. 2C). The kinetic energy, Ek, of the electrons ejected is related to their binding energy Eb by Ek = hν - Eb when hν is the photon energy (3.55 eV).
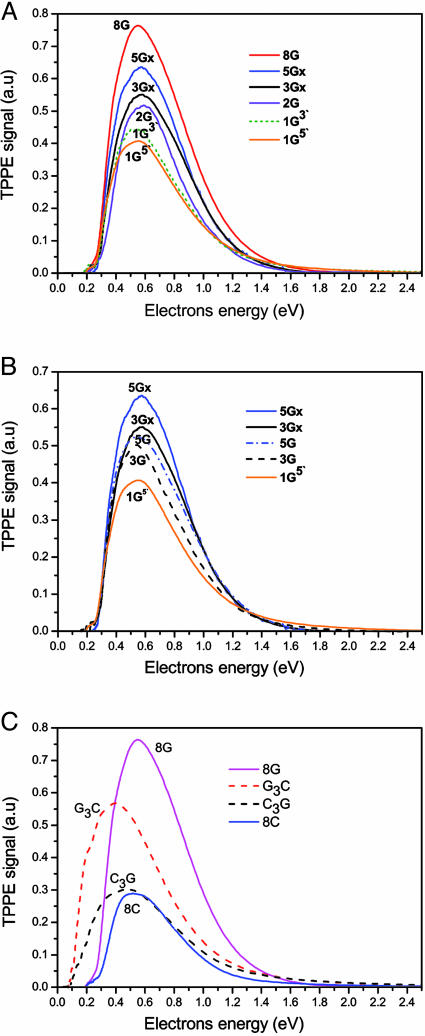
Fig. 5 presents the TPPE spectra observed for DNA layers composed of different oligomers. The TPPE signal depends on the transition probability (kT) (Fig. 2) of the electrons from the metal to the layer and on the lifetime of the electrons residing on the LUMO. This lifetime depends on the relaxation rate of the electrons back to the metal (kR). Hence, an intense TPPE signal means that either the layer captured very efficiently the excited electrons (kT is high) or the lifetime of the electron in the LUMO is very long, allowing for a high transient population. On the other hand, the electron transmission intensity depends only on the capturing probability by the layer. By comparing the results from two different experiments (electron transmission and TPPE) we find that the calculated capturing probability from the electron transmission experiments matches closely with the electron-capture probability calculated from the TPPE experiment (Table 1). Fig. 5A shows that in the case of ss oligomers, the TPPE signal is inversely proportional to the transmission signal in Fig. 3A and proportional to the capturing probability (Table 1). When the G bases are clustered together (oligomers 3Gx and 5Gx), the capturing probability increases (Fig. 5B). This inverse correlation between the transmission and the TPPE signals, for layers made of ss oligomers, means that both results are controlled by the capturing probability of electrons by the layer. Hence, the TPPE signal is controlled by the transmission probability from the metal, kT, and not affected by kR. Hence, the lifetime of the LUMO (which is inversely proportional to kR) must be about the same for all oligomers, which indicates that the LUMO may be the same for all ss oligomers.
Fig. 5.
Kinetic energy spectra of electrons ejected by a TPPE process. The photon energy is 3.55 eV. (A) The TPPE spectra obtained from monolayers made of ss DNA oligomers containing 15 bases with various numbers of G (the rest being A bases). (B) TPPE spectra demonstrating the effect on the electron transmission caused by clustering of the G bases (5Gx and 3Gx) versus them being separated by A bases (5G and 3G). (C) TPPE spectra from layers made of ds DNA (dashed lines) versus layers made from ss oligomers. Note the shift in the peak of the TPPE spectra for the ds layers compared to the ss layers.
The TPPE studies show that for layers made from ss DNA, the energy distribution of the ejected electrons does not depend on the sequence, as can be seen by the similar shape and peak position. This result is consistent with the conclusion that the nature of the LUMO is the same for all ss oligomers, as indicated by the same lifetime. For the ds oligomers, the relative TPPE signal (Fig. 5C)is stronger than expected based on the capturing probability given in Table 1. Hence, the difference between the TPPE spectra of the layers made from ss versus ds oligomers is not due solely to the difference in the capturing probability but also depends on the lifetime of the electrons in the LUMO (kR), i.e., the lifetime of the LUMO in the layers made from ds DNA is longer than those layers made from single strands. This conclusion is supported further by the shape of the TPPE spectra, showing that the electrons on the ds layers are bound more strongly by ≈0.2 eV compared with the electrons bound to the ss layers.
The results show that the number of G bases controls the capturing efficiency of slow electrons. The fact that clustering of G bases are more efficient in electron capturing than G embedded in an A sequence indicates that it is not the A-G combination, rather than solely the G, that affects the capturing. In principle, the high capturing efficiency of a base can arise either from its high electron affinity or from negative ion resonances at energies relevant to that of the transmission electrons. It is important to realize that most quantitative experiments performed thus far on electronic properties of DNA bases, such as ionization potential and electron affinity, were performed mostly in the gas phase and rarely in the condensed phase (3, 20, 24–28). In addition, comparison of theoretical and experimental results shows that the determination of electronic affinity values of the DNA bases is still a matter of controversy (29). Hence, these former experiments are of limited use in our case. Another difficulty is that electronic structure calculations were performed usually on a single base and at most on one base pair. Overall, both former studies and calculations show that G is not distinct from the other bases in terms of its electron affinity.
The one property of G (amino-oxo tautomer) that seems to be relevant to the present results is its very large dipole moment of ≈7 debye (30), which is three times larger than that of A (2.2 debye) and almost twice as large as that of T. However, C (amino-oxy tautomer) also has a high dipole moment, like G, but, unlike G, it has a negative electron affinity (4–6, 31). Hence, one may speculate that G, through its dipole, may act as a gateway for electron capturing. This subject clearly deserves more calculations and experiments.
The results presented here indicate that, once captured, the electron is not localized on one of the bases but instead is either on the sugar phosphate backbone or between the molecules in the monolayer in a nonlocalized state.
The low capturing yield by monolayers made of ds DNA oligomers may result from either the difference in the energetics of their electronic states or simply their better organization. Whereas monolayers made from ss oligomers are expected to form irregular layers because of their less rigid structure, the monolayers made of the ds DNA are more organized because of the rigid and regular structure of the double helix. Numerous studies show that, in general, the capturing of low-energy electrons by well organized and regular monolayers of organic molecules is by far less efficient than in the case of irregular layers (32). Hence, the difference obtained between electron capturing yield by layers made of ss and ds DNA is consistent with the difference in their organization. It is interesting to note that, in vivo, close packing of DNA enhances its protection against radiation damage (33, 34). Despite the fact that our experiments are performed in a very different environment than under the in vivo conditions, the ds DNA layers most likely contain structural water (18) and cations and therefore include all the basic building blocks of DNA in its in vivo environment. Their density is also similar to the one observed in vivo. Hence, our observation relating the organization of the DNA to the reduction of electron capturing suggests that a similar mechanism possibly exists in a biological environment (35).
Supplementary Material
Acknowledgments
This work was partially supported by the Israel Science Foundation.
Author contributions: S.S.D. and R.N. designed research; S.G.R. and S.S.D. performed research; S.G.R. analyzed data; and S.G.R., S.S.D., and R.N. wrote the paper.
This paper was submitted directly (Track II) to the PNAS office.
Abbreviations: ss, single-stranded; ds, double-stranded; TPPE, two-photon photoemission; LUMO, lowest unoccupied molecular orbital.
References
- 1.ICRU Report (International Commission on Radiation Units and Measurements) (1979) (ICRU, Washington, DC), Vol. 31.
- 2.Pilbott, S. M. & LaVerne, J. A. (1995) in Radiation Damage in DNA: Structure/Function Relationships at Early Time, eds. Fuciarelli, A. F. & Zimbrick, J. D. (Battelle, Columbus, OH), pp. 1-12.
- 3.Martin, F., Burrow, P. D., Cai, Z., Coultier, P., Hunting, D. & Sanche, L., (2004) Phys. Rev. Lett. 93, 068101-068104. [DOI] [PubMed] [Google Scholar]
- 4.Barrios, R., Skurski, P. & Simons, J. (2002) J. Phys. Chem. B 106, 7991-7994. [Google Scholar]
- 5.Berdys, J., Skurski, P. & Simons, J. (2004) J. Phys. Chem. B 108, 5800-5805. [Google Scholar]
- 6.Berdys, J., Anusiexicz, I., Skurski, P. & Simons, J. (2004) J. Am. Chem. Soc. 126, 6441-6447. [DOI] [PubMed] [Google Scholar]
- 7.Abdoul-Carime, H. & Sanche, L. (2002) Int. J. Radiat. Biol. 78, 89-99. [DOI] [PubMed] [Google Scholar]
- 8.Williamson, J. R. (1994) Annu. Rev. Biophys. Biomol. Struct. 23, 703-730. [DOI] [PubMed] [Google Scholar]
- 9.Wong, K. K., Chang, S., Weiler, S. R., Ganesan, S., Chaudhuri, J., Zhu, C. M., Artandi, S. E., Rudolph, K. L., Gottlieb, G. J., Chin, L., et al. (2000) Nat. Genet. 26, 85-88. [DOI] [PubMed] [Google Scholar]
- 10.Steenken, S. & Jovanovic, S. V. (1997) J. Am. Chem. Soc. 119, 617-618. [Google Scholar]
- 11.Milligan, J. R., Aguilera, J. A. & Ward, J. F. (2001) Int. J. Radiat. Biol. 77, 1195-1205. [DOI] [PubMed] [Google Scholar]
- 12.Giese, B., Amaudrut, J., Kohler, A. K., Spormann, M. & Wessely, S. (2001) Nature 412, 318-320. [DOI] [PubMed] [Google Scholar]
- 13.Berlin, Y. A., Burin, A. L. & Ratner, M. A. (2001) J. Am. Chem. Soc. 123, 260-268. [DOI] [PubMed] [Google Scholar]
- 14.Heller, A. (2000) Faraday Discuss. Chem. Soc. 116, 1-13. [DOI] [PubMed] [Google Scholar]
- 15.Friedman, K. A. & Heller, A. (2001) J. Phys. Chem. B 105, 11859-11865. [Google Scholar]
- 16.Aqua, T., Naaman, R. & Daube, S. S. (2003) Langmuir 19, 10573-10580. [Google Scholar]
- 17.Petrovykh, D. Y., Kimura-Suda, H., Whitman, L. J. & Tarlov, M. J. (2003) J. Am. Chem. Soc. 125, 5219-5226. [DOI] [PubMed] [Google Scholar]
- 18.Swarts, S. G., Sevilla, M. D., Becker, D., Tokar, C. J. & Wheeler, K. T. (1992) Radiat. Res. 129, 333-344. [PubMed] [Google Scholar]
- 19.Naaman, R., Haran, A., Nitzan, A., Evans, D. & Galperin, M. (1998) J. Phys. Chem. B 102, 3658-3668. [Google Scholar]
- 20.Hush, N. S. & Cheung, A. S. (1975) Chem. Phys. Lett. 34, 11-13. [Google Scholar]
- 21.Boudaiffa, B., Cloutier, P., Hunting, D., Huels, M. A. & Sanche, L. (2002) Radiat. Res. 157, 227-234. [DOI] [PubMed] [Google Scholar]
- 22.Miller, A. D., Bezel, I., Gaffney, K. J., Garrett-Roe, S., Liu, S. H., Szymanski, P. & Harris, C. B. (2002) Science 297, 1163-1166. [DOI] [PubMed] [Google Scholar]
- 23.Hofer, U., Shumay, I. L., Reuss, C., Thomann, U., Wallauer, W. & Fauster, T. (1997) Science 277, 1480-1482. [Google Scholar]
- 24.Nir, E., Grace, L., Brauer, B. & de Vries, M. S. (1999) J. Am. Chem. Soc. 121, 4896-4897. [Google Scholar]
- 25.Wiley, J. R., Robinson, J. M., Ehdaie, S., Chen, E. C. M., Chen, E. S. D. & Wentworth, W. E. (1991) Biochem. Biophys. Res. Commun. 180, 841-845. [DOI] [PubMed] [Google Scholar]
- 26.Chen, E. S. & Chen, E. C. M. (2001) Biochem. Biophys. Res. Commun. 289, 421-426. [DOI] [PubMed] [Google Scholar]
- 27.Periquet, V., Moreau, A., Carles, S., Schermann, J. P. & Desfrancois, C. (2000) J. Electron Spectrosc. Relat. Phenomena 106, 141-151. [Google Scholar]
- 28.Aflatooni, K., Gallup, G. A. & Burrow, P. D. (1998) J. Phys. Chem. A 102, 6205-6207. [Google Scholar]
- 29.Voityuk, A. A., Michel-Beyerle, M.-E. & Rosch, N. (2001) Chem. Phys. Lett. 342, 231-238. [Google Scholar]
- 30.Srivastava, S. K. & Mishra, P. C. (1980) J. Mol. Struct. 65, 199-213. [Google Scholar]
- 31.Dolgounitcheva, O., Zakrzewski, V. G. & Ortiz, J. V. (2001) J. Phys. Chem. A 105, 8782-8786. [Google Scholar]
- 32.Naaman, R. & Vager, Z. (2003) Acc. Chem. Res. 36, 291-299. [DOI] [PubMed] [Google Scholar]
- 33.Newton, G. L., Aguilera, J. A., Ward, J. F. & Fahey, R. C. (1996) Radiat. Res. 145, 776-780. [PubMed] [Google Scholar]
- 34.Spotheimmaurizot, M., Ruiz, S., Sabattier, R. & Charlier, M. (1995) Int. J. Radiat. Biol. 68, 571-577. [DOI] [PubMed] [Google Scholar]
- 35.Minsky, A., Shimoni, E. & Frenkiel-Krispin, D. (2002) Nat. Rev. Mol. Cell Biol. 3, 50-60. [DOI] [PubMed] [Google Scholar]
Associated Data
This section collects any data citations, data availability statements, or supplementary materials included in this article.


