Abstract
Members of the platelet-derived growth factor (PDGF) ligand family are known to play important roles in wound healing and fibrotic disease. We show that both transient and stable expression of PDGF-C results in the development of liver fibrosis consisting of the deposition of collagen in a pericellular and perivenular pattern that resembles human alcoholic and nonalcoholic fatty liver disease. Fibrosis in PDGF-C transgenic mice, as demonstrated by staining and hydroxyproline content, is preceded by activation and proliferation of hepatic stellate cells, as shown by collagen, α-smooth muscle actin and glial fibrillary acidic protein staining and between 8 and 12 months of age is followed by the development of liver adenomas and hepatocellular carcinomas. The hepatic expression of a number of known profibrotic genes, including type β1 TGF, PDGF receptors α and β, and tissue inhibitors of matrix metalloproteinases-1 and -2, increased by 4 weeks of age. Increased PDGF receptor α and β protein levels were associated with activation of extracellular regulated kinase-1 and -2 and protein kinase B. At 9 months of age, PDGF-C transgenic mice had enlarged livers associated with increased fibrosis, steatosis, cell dysplasia, and hepatocellular carcinomas. These studies indicate that hepatic expression of PDGF-C induces a number of profibrotic pathways, suggesting that this growth factor may act as an initiator of fibrosis. Moreover, PDGF-C transgenic mice represent a unique model for the study of hepatic fibrosis progressing to tumorigenesis.
Keywords: fibrogenesis, cancer, hepatic stellate cells
Hepatic fibrosis develops in response to chronic injury, following a common pathway in diverse forms of liver disease. It is characterized by progressive changes in the extracellular matrix (ECM) and in cellular composition and function. Dynamic remodeling of ECM occurs during fibrosis, with a bias toward deposition of fibrillar (type I) collagen within the subendothelial space of Disse (1–3). Although beneficial as a limited wound-healing response, chronic fibrosis disrupts the essential structure of liver sinusoids, impairing the function of the liver and eventually leading to cirrhosis. A key component of the injury response is a mesenchymal cell type known as the hepatic stellate cell (HSC) (4, 5). As a result of liver injury, these cells undergo transformation to a myofibroblast-like phenotype and rapidly proliferate. Myofibroblasts have contractile and migratory properties and are the cell type primarily responsible for ECM deposition in experimental models of rodent fibrosis and human cirrhosis (6–8).
Activated HSC and myofibroblasts produce a number of profibrotic cytokines and growth factors that perpetuate the fibrotic process through paracrine and autocrine effects. Platelet-derived growth factor BB (PDGF-BB) and type β1 TGF (TGFβ1) are two key factors in fibrogenesis (9, 10). Increased expression of both proteins are detected in rodent liver after hepatic injury and in liver biopsies of human cirrhosis (11–16). TGFβ1 treatment of HSC induces collagen synthesis in vitro (16, 17), and in vivo overexpression results in collagen deposition and liver fibrosis (18, 19). Induction of PDGF receptor (PDGFR) β mRNA and protein is one of the earliest events in HSC activation, and the overexpression of this receptor is also associated with liver fibrosis (20, 21). In vivo, PDGF-BB is a potent mitogen for HSC and can also induce the synthesis of several ECM components (22–24). Although TGFβ1 and PDGFR signaling pathways are critical to liver fibrosis, it is not clear how liver injury per se results in the integrated up-regulation of these and other profibrotic molecules.
PDGF-C, a recently identified member of the PDGF ligand family, is a multidomain protein with a C-terminal domain capable of binding to and activating PDGFR (25, 26). In contrast to PDGF-A and -B, which are secreted as bioactive dimers after intracellular processing, the PDGF-C precursor polypeptide is secreted intact from the cell and requires extracellular proteolytic cleavage of the receptor interacting domain to produce the active growth factor, PDGF-CC. PDGF-CC displays receptor preference similar to that of PDGF-AB, binding with high affinity to PDGFR-α/α homodimers and PDGFR-α/β heterodimers but not PDGFR-β/β homodimers (25). The N-terminal domain of PDGF-C is homologous to the extracellular domain of neuropilin-1 and may provide a means of specific localization and/or activation. We previously demonstrated that PDGF-CC stimulated DNA replication in mesenchymal cell types, including stellate cells (25), suggesting that this new member of the PDGF ligand family may play a role in fibrogenesis. To assess the potential role of PDGF-C in HSC activation and in the development of hepatic fibrosis, we generated PDGF-C transgenic (Tg) mice that expressed human PDGF-C driven by the albumin promoter. These mice develop liver fibrosis that is preceded by activation and proliferation of HSCs and is followed by the development of steatosis and hepatocellular carcinomas (HCCs).
Materials and Methods
Generation of PDGF-C Tg Mice. Tg mice were produced by using a 1,058-bp fragment containing the human PDGF-C ORF inserted into a pALB polylinker between the mouse albumin enhancer/proximal promoter (27) with an adjacent 5′ rat insulin II intron and a human growth hormone polyadenylation sequence (28). Twenty-two percent of the pups (24/108 pups) were founders, as identified by PCR on genomic tail DNA by using primers to human PDGF-C or as described (28). Human PDGF-C expression was detected in the livers of the progeny of only one of these founder lines. Mice of this lineage were backcrossed with C57BL/6 mice, and mice of N4 to N6 were used in this study. Heterozygous male and female PDGF-C Tg mice (PDGF-C Tg) were born with the expected Mendelian ratios and showed no obvious abnormalities until 5 months. All animal studies were carried out under approved Institutional Animal Care and Use Committee protocols from both the University of Washington and ZymoGenetics.
Infection with Adenovirus. PDGF-C and control adenoviruses were generated as described (25). Female C57BL/6 mice were injected intravenously with 2 × 10⁹ plaque-forming units of adenovirus encoding either PDGF-C or an equal dose of control adenovirus expressing only GFP. Liver tissue was collected 21 days after infection, fixed, and processed as indicated.
Histology and Immunohistochemistry (IHC). Mouse livers were fixed in 10% neutral buffered formalin or methacarn (60% methanol/30% chloroform/10% acetic acid: vol/vol/vol) overnight, processed to paraffin blocks, sectioned, and stained with hematoxylin/eosin and Masson trichrome by using standard techniques. For transmission electron microscopy, small liver fragments were fixed in 4% glutaraldehyde and then processed by using standard techniques. Oil red O staining was performed on optimal cutting temperature media embedded frozen liver sections by using standard techniques. IHC was performed as described (29, 30) or as indicated by the manufacturer by using antibodies specific for mouse anti-BrdUrd (DAKO), rabbit anti-glial fibrillary acidic protein (GFAP, DAKO), mouse anti-α-smooth muscle actin (α-SMA, clone 1A4, Sigma), and rabbit anti-PDGFRα and -β (Santa Cruz Biotechnology). Detection of the primary antibody was carried out by using the appropriate biotinylated antibody (Vector Laboratories) and the peroxidase DAB kit (Ventana, Tucson, AZ). Nuclear incorporation of BrdUrd into liver cells was used to measure cell proliferation. BrdUrd (50 μg of BrdUrd per gram of mouse) was injected i.p. 2 hours before necropsy with detection of nuclear BrdUrd as described (29). The mouse-on-mouse (M.O.M.) kit (Vector Laboratories) was used to detect labeling of both nonparenchymal cells (NPC) and hepatocytes. Data are represented as the number of BrdUrd-positive cells present in 30–40× fields (1.3 mm2; ≈3,000 hepatocytes).
Determination of PDGF-CC in Serum. Serum levels of PDGF-CC were quantified by using an antibody capture ELISA, as described (31), with two monoclonal antibodies specific for human PDGF-CC, as described (25). This ELISA is specific for cleaved, active growth factor and does not detect mouse PDGF-CC.
Quantification of TGFβ1, PDGFRα, and PDGFRβ and Tissue Inhibitors of Matrix Metalloproteinases (TIMP)-1 and -2 mRNA Levels in Mouse Liver. Liver RNA was prepared by using TRIzol (Ambion, Austin, TX), according to the manufacturer's directions, and quantified by A260 absorbance. Levels of TIMP-1, -2, and -3 and matrix metalloproteinases (MMP)-2 and -7 to -9 were measured by ribonuclease protection assay (BD Biosciences, mMMP template set no. 551277). RNA was reverse-transcribed by using 1 μg of RNA, and the cDNA was then used as a template for a radioactive PCR reaction with either murine primers to TGFβ1 (Ambion) or PDGFRα and -β (32) and a loading control for normalization. Relative changes in TGFβ1, PDGFRα and -β mRNA levels were quantified by using RT-P32-PCR method by using competimers (β-actin or 18S) for normalization as described in the Quantum RNA kit manual (Ambion). The linear ranges for the amplicon of each PCR primer pair were determined. The radioactive PCR products were normalized to either β-actin or 18S, whereas changes in TIMP-1 and -2 mRNA levels were normalized to L32. All RNA analysis was quantified by using phosphorimager analysis (Storm, Molecular Devices). Four or more mice were used per time point of each genotype.
Immunoblotting Analysis. Liver protein lysates were prepared as described and subjected to immunoblot analysis by using standard procedures (33). Protein levels were determined with specific antibodies to PDGFRα (Lab Vision, Fremont, CA), PDGFRβ (Upstate Biotechnology), phospho-extracellular signal-regulated kinase (ERK)-1/-2 (Sigma), and phospho-Akt (Ser-473 and Thr-308) and Akt (Cell Signaling Technology, Beverly, MA).
Determination of Hydroxyproline. Liver samples were enriched for collagen in hot 5% trichloroacetic acid, as described (34). The hydrolyzed amino acids were mixed with 100 nmol of l-α-amino-n-butyric acid (Sigma) and derivatized with 6-aminoquinolyl-N-hydroxysuccinimidyl carbamate (Waters, Milford, MA), according to the manufacturer's instructions. The derivatized hydrolysates were separated by using described methods (35). Hydroxyproline concentration was calculated by comparing the unknown peak area to a standard curve generated from an amino acid standard solution for collagen hydrolysates (Sigma).
Statistical Analysis. Differences were analyzed by comparing samples from Tg mice to WT mice of the same age by using nonparametric analysis (Mann–Whitney or an unpaired t test with Welch's correction). Data are represented as mean ± SEM with the following symbols indicating the level of significance; ***, P ≤ 0.0002; **, P ≤ 0.001; *, P ≤ 0.05. Statistical analysis was performed by using prism software (GraphPad, San Diego).
Results
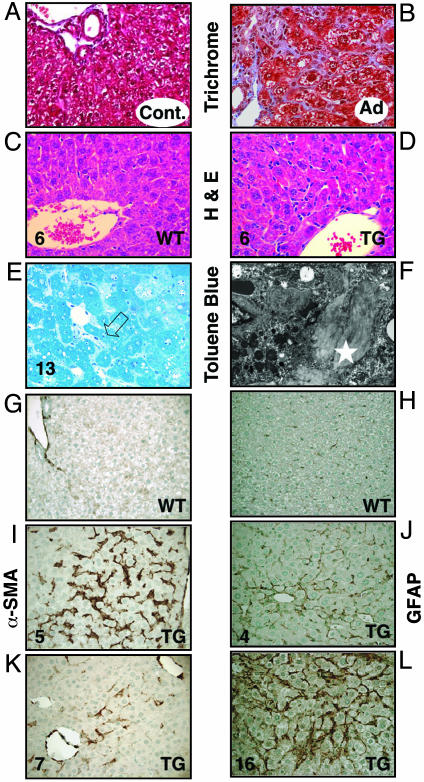
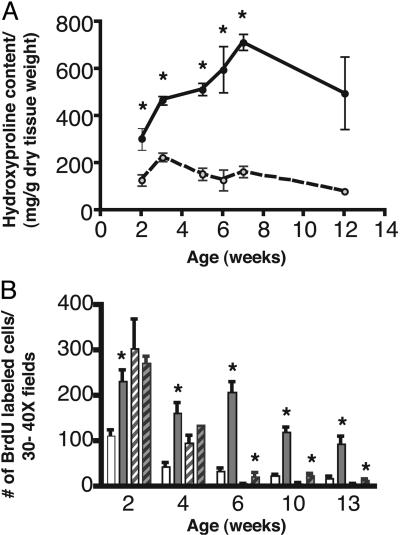
HSC Activation, Proliferation, and Hepatic Fibrosis in Mice After Infection with Adenovirus Expressing PDGF-C and in PDGF-C Tg Mice. By using cultured hepatocytes and activated HSCs, we found PDGF-CC to be a potent mitogen for HSCs with no effect on hepatocytes (Fig. 7 and Supporting Text, which are published as supporting information on the PNAS web site). To determine whether transient expression of PDGF-C caused in vivo activation of HSCs, adenovirus directing the expression of either human PDGF-C or only GFP (control) was injected intravenously into mice and histological samples were prepared 3 weeks later. Robust pericellular collagen deposition was observed in mice treated with PDGF-C compared with GFP (Fig. 1 A and B). Collagen deposition was associated with a marked increase in perisinusoidal cells and of α-SMA staining (Fig. 8, which is published as supporting information on the PNAS web site). To determine whether long-term expression of PDGF-C would lead to hepatic fibrosis, we produced Tg mice with constitutive liver-specific expression of human PDGF-C driven by the mouse albumin enhancer/proximal promoter. Circulating levels of PDGF-CC, measured by an ELISA that detects human PDGF-CC, were highest at 2 weeks of age and decreased by 3-fold at 12 weeks but remained elevated as the mice aged (Fig. 9, which is published as supporting information on the PNAS web site). Human PDGF-CC was not detected in the serum of WT littermates. Morphological changes in the livers of PDGF-C Tg mice were first detectable by 2 weeks but were more prominent between 4 and 6 weeks of age (Fig. 1 C and D). PDGF-C overexpression was associated with both increased numbers of sinusoidal lining cells (Fig. 1D) and deposition of collagen (Fig. 1 E and F). These changes occurred in the absence of liver damage or inflammation. PDGF-C Tg mice did not have elevated levels of serum transaminases within the first 3 months of life, suggesting that the hepatic changes we observed were not associated with overt liver injury (data not shown). At 6 weeks of age, increased collagen deposition was seen within the sinusoids and radiating from central veins. By 13 weeks, the toluene blue staining had a pericellular and perivenular pattern, enveloping small clusters of hepatocytes (Fig. 1E). This pattern of fibrosis resembles human liver disease produced by alcoholic or nonalcoholic fatty liver disease. Thick sections from livers of Tg and WT mice that underwent ultrastructural analysis showed a clear alteration of the sinusoidal spaces with pericellular deposition of fibrillar collagen in the livers of PDGF-C Tg mice (Fig. 1E, open arrow, and Fig. 1F, star). The collagen content of PDGF-C Tg mouse livers was 2- to 5-fold greater than that of WT livers (Fig. 2A), as measured by hydroxyproline levels associated with collagen.
Fig. 1.
Histological analysis of livers from mice infected with adenovirus expressing PDGF-C (A and B) and Tg mice overexpressing PDGF-C (C–L) shows HSC activation, proliferation, and hepatic fibrosis. Twenty-one days after infection with adenovirus expressing GFP only (control, A) or human PDGF-C (B), livers were harvested, fixed in formalin, and stained for collagen content with Masson trichrome. Liver tissue from Tg mice overexpressing PDGF-C or WT littermates was harvested at the indicated times (weeks) and stained for hematoxylin/eosin (C and D). Toluene blue staining of thick sections of livers from PDGF-C Tg at 13 weeks of age (E) demonstrates pericellular and perivenular collagen deposition (open arrow). Transmission electron microscopy of an adjacent area to that shown in E illustrates the fibrillar collagen (F, white star). IHC staining for α-SMA is restricted to vascular smooth muscle cells in WT mouse liver at 5 weeks of age (G), compared with the abundant multifocal expression observed in livers of Tg mice of the same age (I). In 7-week-old Tg mice (K), α-SMA expression decreased. IHC staining for GFAP shows increased expression of this marker in perisinusoidal cells in livers from PDGF-C Tg mice at 4 weeks of age (J) with widespread staining at 16 weeks of age (L) but very little staining in non-Tg mice (H). Original magnification is ×400 in A–D and G–L, ×600 in E, and ×31,000 in F.
Fig. 2.
PDGF-C expression induces collagen production and DNA replication in NPC. (A) Collagen content of Tg (filled circles, solid line) and WT (open circles, dashed line) livers. Data are represented as mean hydroxyproline content ± SEM. (B) BrdUrd labeling of NPC (unfilled bars) and hepatocytes (hatched bars) in Tg (gray bars) and WT (white bars) mice. Mean ± SEM are shown for each group (n = 5). *, P ≤ 0.05 for Tg vs. WT mice.
Collagen deposition in rodent and human fibrosis is associated with activation of HSCs, as detected by markers such as α-SMA and GFAP. Livers from Tg mice had a marked increase in perisinusoidal α-SMA staining by 5 weeks of age (Fig. 1I) compared with WT littermates (Fig. 1G). The staining was first detectable at 3 weeks and decreased after 7 weeks (Fig. 1K). GFAP staining was slightly elevated by 4 weeks of age (Fig. 1J), but widespread perisinusoidal staining was detected by 16 weeks (Fig. 1L). Very little α-SMA or GFAP staining was detected in the parenchyma of WT littermates (Fig. 1 G and H and data not shown).
To determine whether the number of NPC might be increased, BrdUrd was injected 2 h before necropsy to measure DNA replication. NPC DNA replication was elevated 2- to 4-fold in PDGF-C Tg mice at all time points examined compared with WT littermates (Fig. 2B). Hepatocyte DNA replication was not statistically different until 6 weeks of age. At that time, it was 2- to 4-fold higher in Tg mice. Taken together, these data show that hepatic overexpression of PDGF-C induces collagen deposition and activation of HSC, as indicated by increased replication of perisinusoidal cells and α-SMA and GFAP expression. Moreover, PDGF-C expression results in liver fibrosis resembling that seen in some types of human liver disease.
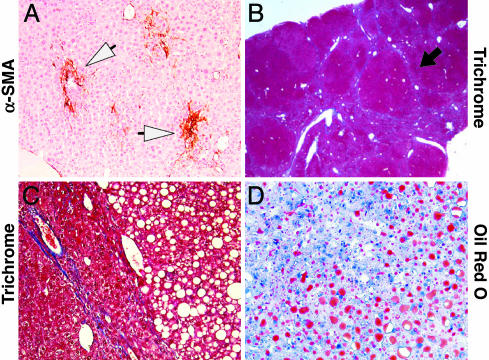
Fibrosis and Steatosis in Livers of Older PDGF-C Tg Mice. As PDGF-C Tg mice age, the hepatic fibrosis becomes more severe, and their livers become enlarged, resulting in liver weight:body weight ratios of 50–75% greater than WT littermates. Although in some Tg mice α-SMA staining was focal (Fig. 3A), in others there was bridging fibrosis that extended between adjacent portal tracts and from portal tracts to central regions (Fig. 3B, black arrow). Thin tracts of collagen surrounded areas of micro- and macrovesicular steatosis (Fig. 3C), as demonstrated by Oil red O staining (Fig. 3D). None of these changes were detected in WT littermates (data not shown).
Fig. 3.
PDGF-C Tg mice develop fibrosis and steatosis by 9 months. The livers from four different 9-month-old Tg mice were fixed and then stained for α-SMA (A), Masson trichrome (B and C), and Oil red O (D), as described in Materials and Methods. Open arrowheads in A highlight the focal staining for α-SMA, and the black arrow in B indicates bridging fibrosis. Original magnification is ×200 in A, ×20 in B, and ×400 in C and D.
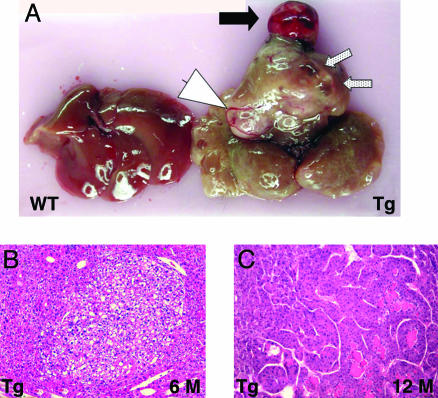
Various striking gross abnormalities were seen in the livers of the PDGF-C Tg mice, including unilocular or multilocular pseudocysts without epithelial lining (Fig. 4A, speckled arrows), angiogenesis (Fig. 4A, arrowhead) and nodules of well differentiated HCCs (Fig. 4A, black arrow). Microscopic examination revealed dysplastic foci or foci of altered hepatocytes by 6–7 months of age (Fig. 4B), and preneoplastic foci were detected in all Tg mice (14 of 14) by 12 months (data not shown; M.M.Y., S.D.H., D.G.G., T.E.P., M.M.O., R.L.B., N.F., and J.S.C., unpublished results); ≈80% (11 of 14) of Tg mice had HCC by 1 year (Fig. 4C and data not shown; M.M.Y., S.D.H., D.G.G., T.E.P., M.M.O., R.L.B., N.F., and J.S.C., unpublished results). Regenerating nodules or classic cirrhosis was not present in the Tg livers. Serum transaminase and alkaline phosphatase levels were mildly elevated at 9 months of age, reflecting a low level of apoptosis detectable in the livers of the Tg mice (data not shown). These data demonstrate that long-term overexpression of PDGF-C results in severe fibrosis, steatosis, and HCC.
Fig. 4.
PDGF-C Tg mice develop HCC. As PDGF-C Tg mice age, their livers become enlarged (A) and show a variety of pathologies, including HCC (black arrow), angiogenesis (white arrow head), and multilocular pseudocysts (speckled arrows). A liver from a WT littermate is shown (Left). Tg mice develop dysplastic foci or foci of altered hepatocytes by 6 months (B), and carcinomas are seen in 12-month-old mice (C). Note the loss of sinusoidal spaces and pseudogland formation in C. Original magnification in B and C is ×100.
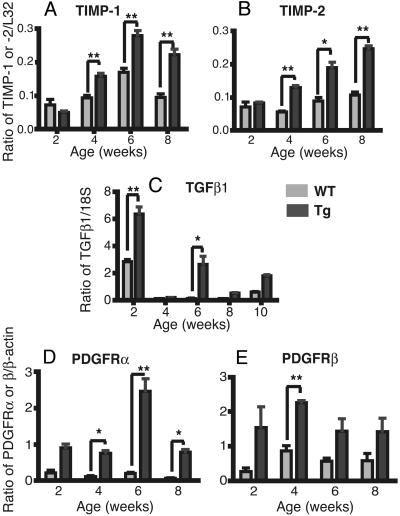
Gene Activation in PDGF-C Tg Mice. To investigate the mechanisms of liver fibrosis in PDGF-C Tg mice, we analyzed the expression of fibrosis-associated genes in Tg and WT animals by using RNA extracted from livers at 2, 4, 6, 8, and 10 weeks of age. We examined the expression of MMP and TIMP by ribonuclease protection assay, whereas TGFβ1, PDGFRα, and PDGFRβ mRNA were measured by RT-PCR. In Tg mice, TIMP-1 and -2 expression was elevated at 4, 6, and 8 weeks compared with WT littermates (Fig. 5 A and B), but the expression of MMP-1, -3, -7, -9, -12 and TIMP-3 was not significantly changed. TGFβ1 expression was elevated at 2, 6, and 10 weeks of age (Fig. 5C). PDGFRβ levels were elevated at 4 weeks, whereas PDGFRα levels were elevated at 4, 6, and 8 weeks (Fig. 5 D and E).
Fig. 5.
Liver TIMP-1 and -2, TGFβ1, and PDGFRα and -β mRNA levels are elevated in younger PDGF-C Tg mice. Ribonuclease protection assay for TIMP-1 (A) and -2 (B) from 2- to 8-week-old Tg (gray bars) and WT (white bars) mice (C). Relative RT-PCR for TGFβ1 mRNA from 2 to 10 weeks of age. Relative RT-PCR for PDGFRα (D) and -β relative (E) from 2–8 weeks of age. Each mRNA is normalized to a loading control, as described in Materials and Methods. Means ± SEM are shown for each group (n = 4). **, P ≤ 0.001; *, P ≤ 0.05 for Tg vs. WT mice.
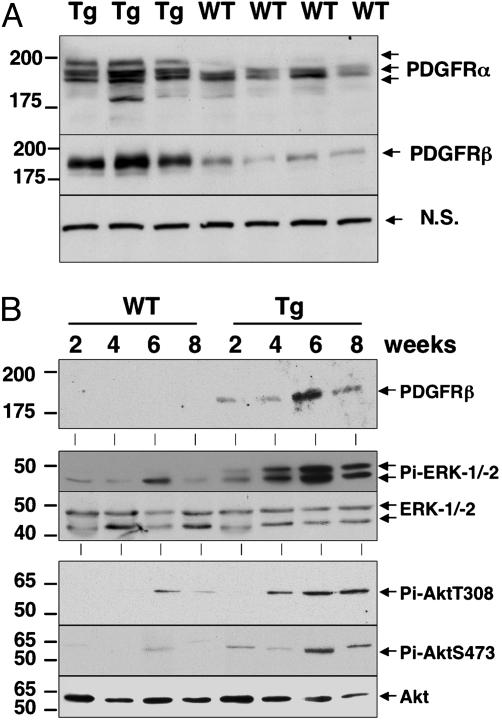
We extended our studies on the PDGFRs by measuring PDGFRα and -β protein levels by immunoblot analysis. Both PDGFRα and -β increased at 4 weeks of age in all Tg mice compared with WT mice (Fig. 6A). The PDGFRα antibody also detected a slower migrating form of PDGFRα, suggesting that the receptor might have undergone posttranslational modifications. To determine the timing of PDGFR induction and whether this induction was associated with activation of intracellular signaling pathways regulated by these receptors, we performed immunoblot analysis for PDGFRβ, active ERK-1/-2, and protein kinase B (PKB)/Akt on protein liver lysates from 2-, 4-, 6-, and 8-week-old PDGF-C Tg and WT mice. Elevated levels of PDGFRβ protein were detected at all time points in Tg mice (Fig. 6B). Phosphorylated and active ERK-1/-2 and PKB/Akt were detected in liver lysates from PDGF-C Tg mice at 4, 6, and 8 weeks of age (Fig. 6B Middle and Bottom), whereas the total unphosphorylated levels of these kinases did not change. Taken together, these results demonstrate that key profibrotic genes, specifically TIMP-1 and -2, PDGFRα and -β, and TGFβ1, were induced in the livers of PDGF-C Tg mice. Importantly, the increase in both PDGFRα and -β indicates that PDGF-C induces its own receptors and activates intracellular signaling pathways involving ERK-1/-2 and PKB/Akt.
Fig. 6.
Increased PDGFRα and -β protein is associated with activated ERK-1/-2 and Akt. Protein lysates were made from livers of Tg and WT mice at the indicated ages, and immunoblot analyses were performed as described in Materials and Methods. (A). Livers from Tg (n = 3) and WT (n = 4) mice at 4 weeks of age contain elevated levels of PDGFRα and -β. A nonspecific band (n.s.) was used as loading control. (B). Elevated levels of PDGFRβ protein are detected at all time points (Top). Phosphospecific antibodies detected active (phosphorylated) ERK-1/-2 (Middle) and Akt (Bottom) in the lysates of PDGF-C Tg mice but not in WT mice. Total levels of ERK-1/-2 and Akt are shown.
Discussion
Hepatic fibrosis, independent of etiology, results from the activation of HSC leading to collagen deposition and disruption of normal metabolic functions of the liver. Although all hepatic cell types contribute to fibrogenesis, HSCs play a critical role in disease progression by regulating ECM deposition and homeostasis. Understanding the sequence of molecular events that activate HSCs, perpetuate the activated phenotype, and result in the transformation of HSCs to myofibroblast-like cells is key to the development of antifibrotic therapies (36–38). Much of our understanding of the activation of HSCs is derived from studies with primary cultures of stellate cells or in vivo studies by using repetitive chemical injury with hepatotoxic agents such as carbon tetrachloride. Genetic models of fibrosis have had limited success, and many have focused on the overexpression of TGFβ (18, 19). Here, we demonstrate that overexpression of PDGF-C causes activation of HSCs, which results in liver fibrosis, steatosis, and HCC. PDGF-C Tg mice develop liver fibrosis consisting of deposition of collagen in a pericellular and perivenular pattern that resembles that observed in human alcoholic and nonalcoholic fatty liver disease. This rodent model of liver fibrosis is unique in that disease progression mirrors the sequence of events that may occur in some types of chronic human liver disease.
Early pericellular and perivenular deposition of collagen was associated with α-SMA staining and proliferation of sinusoidal cells, indicating that activated HSCs are responsible for the fibrosis seen in the PDGF-C Tg mice. By 7–8 weeks of age, a time at which hydroxyproline content is maximal, α-SMA staining had decreased significantly. Interestingly, GFAP, another marker of activated stellate cells, showed different kinetics of expression than α-SMA. GFAP staining was first detectable at 4 weeks and was stronger by 16 weeks. Immunohistochemical staining of both α-SMA and GFAP was found in perisinusoidal cells throughout the parenchyma, but the different timing of their expression suggests that PDGF-C overexpression results in the activation of a diverse population of HSCs and myofibroblasts. This situation is similar to what occurs in human cirrhotic livers and in rodent livers after chemical injury, in which different subpopulations of activated HSCs and myofibroblasts have been described (39–41). An alternative, but less likely, interpretation of these data is that a single population of myofibroblasts express different markers as fibrosis progresses in PDGF-C Tg mice.
PDGF-C is likely to be an initiator of fibrosis, because its overexpression not only results in liver fibrosis but also induces a number of profibrotic genes. Expression of TGFβ1, PDGFRα and -β, and TIMP-1 and -2 was elevated in the livers of the PDGF-C Tg mice. Elevated protein levels of PDGFRα and -β coincide with the proliferation of sinusoidal cells, collagen deposition, and the induction of these genes. These results suggest that PDGF-C overexpression perpetuates the activation of HSCs in vivo by the induction of known profibrotic genes (5, 24, 42). These results are similar to those reported by Ponten et al. (43), who found that PDGF-C overexpression in the heart not only induced genes normally associated with cardiac hypertrophy, such as α-SMA and brain natriuretic peptide, but also resulted in proliferation of fibroblasts, deposition of collagen, and cardiac hypertrophy.
Although it is not known whether liver injury causes increased PDGF-C expression, our preliminary data indicate that PDGF-C expression increases in the livers of mice 24 h after carbon tetrachloride injection (data not shown). It would be interesting to examine other animal models of fibrosis that develop steatosis and HCC, such as that described by Denda et al. (44), to determine whether PDGF-C expression is increased. In liver biopsies from patients with cirrhosis of different etiologies, PDGF-C mRNA is detected in cells in the dense fibrotic bands surrounding regenerating nodules where α-SMA mRNA is also present (data not shown; M.M.Y., S.D.H., D.G.G., T.E.P., M.M.O., R.L.B., N.F., and J.S.C., unpublished results). In contrast, PDGF-CC protein is detected in the cells lining the vessels that surrounded the nodules (data not shown; M.M.Y. S.D.H., D.G.G., T.E.P., M.M.O., R.L.B., N.F., and J.S.C., unpublished results). These data suggest that the pleiotropic effects of PDGF-C may include acting on endothelial cells.
Livers from Tg mice display a number of different abnormalities starting at 5–6 months of age. Although the pathologic changes are heterogeneous, many of the mice show steatosis and/or severe fibrosis, an increase in the size and number of blood vessels, and macroscopic pseudocysts. Foci of altered hepatocytes were detected in ≈50% of Tg mice examined by 6–7 months of age, and ≈80% Tg mice had HCC by 12 months (M.M.Y., S.D.H., D.G.G., T.E.P., M.M.O., R.L.B., N.F., and J.S.C., unpublished results). To date, there is no evidence of HCC metastases in Tg mice. Ongoing studies on the development of HCC in these animals suggest that PDGF-C may use paracrine mechanisms to modulate endothelial cells and perhaps other NPC by inducing other growth factors that act on these liver cells. Endothelial cells stimulated by vascular endothelial growth factor secrete growth factors that enhance hepatocyte survival and stimulate replication (45). It remains to be determined whether PDGF-C acts directly or through paracrine effects to induce tumorigenesis.
Supplementary Material
Acknowledgments
We thank B. Miller, B. Gutierrez, and H. Day for adenovirus generation; J. Lehner, J. Volpone, J. Rosser, and J. Yi for antibody generation; N. Fox for HPLC collagen quantification; C. Jones for mitogenesis assay; K. Mink, C. Meligro, and L. Chin for IHC and tissue processing; C. Meredith and S. Harvey for animal care; K. Bannink for animal models; and H. Blumberg and C. LeCiel for generation of Tg constructs. This work was supported by National Institutes of Health Grants CA-023226 and CA-074131 (to J.S.C., M.M.O., R.L.B., M.M.Y., and N.F.).
Author contributions: J.S.C., S.D.H., D.G.G., and M.S.H. designed research; J.S.C., D.G.G., T.E.P., M.S.H., A.C.H., M.M.O., R.L.B., and M.M.Y. performed research; J.S.C., A.C.H., M.M.O., R.L.B., H.-P.R., and H.S.H. contributed new reagents/analytic tools; J.S.C., S.D.H., D.G.G., T.E.P., M.S.H., A.C.H., M.M.O., R.L.B., H.S.H., M.M.Y., and N.F. analyzed data; and J.S.C., S.D.H., D.G.G., T.E.P., M.S.H., M.M.Y., and N.F. wrote the paper.
Abbreviations: ECM, extracellular matrix; HSC, hepatic stellate cell; PDGF, platelet-derived growth factor; PDGFR, PDGF receptor; Tg, transgenic; IHC, immunohistochemistry; GFAP, glial fibrillary acidic protein; α-SMA, α smooth muscle actin; MMP, matrix metalloproteinase; TIMP, tissue inhibitors of MMP; NPC, nonparenchymal cells; HCC, hepatocellular carcinoma; ERK, extracellular signal-regulated kinase; TGFβ1, type β1 TGF.
References
- 1.Bedossa, P. & Paradis, V. (2003) J. Pathol. 200, 504-515. [DOI] [PubMed] [Google Scholar]
- 2.Rojkind, M., Giambrone, M. A. & Biempica, L. (1979) Gastroenterology 76, 710-719. [PubMed] [Google Scholar]
- 3.Milani, S., Herbst, H., Schuppan, D., Hahn, E. G. & Stein, H. (1989) Hepatology 10, 84-92. [DOI] [PubMed] [Google Scholar]
- 4.Friedman, S. L. (1997) Gastroenterology 112, 1406-1409. [DOI] [PubMed] [Google Scholar]
- 5.Hui, A. Y. & Friedman, S. L. (2003) Exp. Rev. Mol. Med. 2003, 1-23. [DOI] [PubMed] [Google Scholar]
- 6.Lalazar, A., Wong, L., Yamasaki, G. & Friedman, S. L. (1997) Gene 195, 235-243. [DOI] [PubMed] [Google Scholar]
- 7.Rockey, D. C., Boyles, J. K., Gabbiani, G. & Friedman, S. L. (1992) J. Submicrosc. Cytol. Pathol. 24, 193-203. [PubMed] [Google Scholar]
- 8.Burt, A. D., Robertson, J. L., Heir, J. & MacSween, R. N. (1986) J. Pathol. 150, 29-35. [DOI] [PubMed] [Google Scholar]
- 9.Gressner, A. M., Weiskirchen, R., Breitkopf, K. & Dooley, S. (2002) Front. Biosci. 7, d793-d807. [DOI] [PubMed] [Google Scholar]
- 10.Pinzani, M., Marra, F. & Carloni, V. (1998) Liver 18, 2-13. [DOI] [PubMed] [Google Scholar]
- 11.De Bleser, P. J., Niki, T., Rogiers, V. & Geerts, A. (1997) J. Hepatol. 26, 886-893. [DOI] [PubMed] [Google Scholar]
- 12.Bissell, D. M., Wang, S. S., Jarnagin, W. R. & Roll, F. J. (1995) J. Clin. Invest. 96, 447-455. [DOI] [PMC free article] [PubMed] [Google Scholar]
- 13.Abboud, H. E., Grandaliano, G., Pinzani, M., Knauss, T., Pierce, G. F. & Jaffer, F. (1994) J. Cell Physiol. 158, 140-150. [DOI] [PubMed] [Google Scholar]
- 14.Nagy, P., Schaff, Z. & Lapis, K. (1991) Hepatology 14, 269-273. [PubMed] [Google Scholar]
- 15.Nakatsukasa, H., Nagy, P., Evarts, R. P., Hsia, C. C., Marsden, E. & Thorgeirsson, S. S. (1990) J. Clin. Invest. 85, 1833-1843. [DOI] [PMC free article] [PubMed] [Google Scholar]
- 16.Matsuoka, M. & Tsukamoto, H. (1990) Hepatology 11, 599-605. [DOI] [PubMed] [Google Scholar]
- 17.Czaja, M. J., Weiner, F. R., Flanders, K. C., Giambrone, M. A., Wind, R., Biempica, L. & Zern, M. A. (1989) J. Cell Biol. 108, 2477-2482. [DOI] [PMC free article] [PubMed] [Google Scholar]
- 18.Ueberham, E., Low, R., Ueberham, U., Schonig, K., Bujard, H. & Gebhardt, R. (2003) Hepatology 37, 1067-1078. [DOI] [PubMed] [Google Scholar]
- 19.Sanderson, N., Factor, V., Nagy, P., Kopp, J., Kondaiah, P., Wakefield, L., Roberts, A. B., Sporn, M. B. & Thorgeirsson, S. S. (1995) Proc. Natl. Acad. Sci. USA 92, 2572-2576. [DOI] [PMC free article] [PubMed] [Google Scholar]
- 20.Pinzani, M., Milani, S., Grappone, C., Weber, F. L., Jr., Gentilini, P. & Abboud, H. E. (1994) Hepatology 19, 701-707. [DOI] [PubMed] [Google Scholar]
- 21.Wong, L., Yamasaki, G., Johnson, R. J. & Friedman, S. L. (1994) J. Clin. Invest. 94, 1563-1569. [DOI] [PMC free article] [PubMed] [Google Scholar]
- 22.Pinzani, M., Gentilini, A., Caligiuri, A., De Franco, R., Pellegrini, G., Milani, S., Marra, F. & Gentilini, P. (1995) Hepatology 21, 232-239. [PubMed] [Google Scholar]
- 23.Pinzani, M., Gesualdo, L., Sabbah, G. M. & Abboud, H. E. (1989) J. Clin. Invest. 84, 1786-1793. [DOI] [PMC free article] [PubMed] [Google Scholar]
- 24.Friedman, S. L. & Arthur, M. J. (1989) J. Clin. Invest. 84, 1780-1785. [DOI] [PMC free article] [PubMed] [Google Scholar]
- 25.Gilbertson, D. G., Duff, M. E., West, J. W., Kelly, J. D., Sheppard, P. O., Hofstrand, P. D., Gao, Z., Shoemaker, K., Bukowski, T. R., Moore, M., et al. (2001) J. Biol. Chem. 276, 27406-27414. [DOI] [PubMed] [Google Scholar]
- 26.Li, X., Ponten, A., Aase, K., Karlsson, L., Abramsson, A., Uutela, M., Backstrom, G., Hellstrom, M., Bostrom, H., Li, H., et al. (2000) Nat. Cell Biol. 2, 302-309. [DOI] [PubMed] [Google Scholar]
- 27.Pinkert, C. A., Ornitz, D. M., Brinster, R. L. & Palmiter, R. D. (1987) Genes Dev. 1, 268-276. [DOI] [PubMed] [Google Scholar]
- 28.Blumberg, H., Conklin, D., Xu, W. F., Grossmann, A., Brender, T., Carollo, S., Eagan, M., Foster, D., Haldeman, B. A., Hammond, A., et al. (2001) Cell 104, 9-19. [DOI] [PubMed] [Google Scholar]
- 29.Chaisson, M. L., Brooling, J. T., Ladiges, W., Tsai, S. & Fausto, N. (2002) J. Clin. Invest. 110, 193-202. [DOI] [PMC free article] [PubMed] [Google Scholar]
- 30.Taneda, S., Hudkins, K. L., Topouzis, S., Gilbertson, D. G., Ophascharoensuk, V., Truong, L., Johnson, R. J. & Alpers, C. E. (2003) J. Am. Soc. Nephrol. 14, 2544-2555. [DOI] [PubMed] [Google Scholar]
- 31.Hart, C. E., Kraiss, L. W., Vergel, S., Gilbertson, D., Kenagy, R., Kirkman, T., Crandall, D. L., Tickle, S., Finney, H., Yarranton, G., et al. (1999) Circulation 99, 564-569. [DOI] [PubMed] [Google Scholar]
- 32.Matsumoto, K., Hiraiwa, N., Yoshiki, A., Ohnishi, M. & Kusakabe, M. (2002) Biochem. Biophys. Res. Commun. 290, 1220-1227. [DOI] [PubMed] [Google Scholar]
- 33.Campbell, J. S., Prichard, L., Schaper, F., Schmitz, J., Stephenson-Famy, A., Rosenfeld, M. E., Argast, G. M., Heinrich, P. C. & Fausto, N. (2001) J. Clin. Invest. 107, 1285-1292. [DOI] [PMC free article] [PubMed] [Google Scholar]
- 34.Guida, E., Codini, M., Palmerini, C. A., Fini, C., Lucarelli, C. & Floridi, A. (1990) J. Chromatogr. 507, 51-57. [DOI] [PubMed] [Google Scholar]
- 35.van Wandelen, C. & Cohen, S. A. (1997) J. Chromatogr. A 763, 11-22. [Google Scholar]
- 36.Reeves, H. L. & Friedman, S. L. (2002) Front. Biosci. 7, d808-d826. [DOI] [PubMed] [Google Scholar]
- 37.Pinzani, M. & Rombouts, K. (2004) Dig. Liver Dis. 36, 231-242. [DOI] [PubMed] [Google Scholar]
- 38.Bataller, R. & Brenner, D. A. (2001) Semin. Liver Dis. 21, 437-451. [DOI] [PubMed] [Google Scholar]
- 39.Cassiman, D., Libbrecht, L., Desmet, V., Denef, C. & Roskams, T. (2002) J. Hepatol. 36, 200-209. [DOI] [PubMed] [Google Scholar]
- 40.Greenwel, P., Rubin, J., Schwartz, M., Hertzberg, E. L. & Rojkind, M. (1993) Lab. Invest. 69, 210-216. [PubMed] [Google Scholar]
- 41.Ramadori, G. & Saile, B. (2002) Liver 22, 283-294. [DOI] [PubMed] [Google Scholar]
- 42.Hellerbrand, Wang, S. C., Tsukamoto, H., Brenner, D. A. & Rippe, R. A. (1996) Hepatology 24, 670-676. [DOI] [PubMed] [Google Scholar]
- 43.Ponten, A., Li, X., Thoren, P., Aase, K., Sjoblom, T., Ostman, A. & Eriksson, U. (2003) Am. J. Pathol. 163, 673-682. [DOI] [PMC free article] [PubMed] [Google Scholar]
- 44.Denda, A., Kitayama, W., Kishida, H., Murata, N., Tsutsumi, M., Tsujiuchi, T., Nakae, D. & Konishi, Y. (2002) Jpn. J. Cancer Res. 93, 125-132. [DOI] [PMC free article] [PubMed] [Google Scholar]
- 45.LeCouter, J., Moritz, D. R., Li, B., Phillips, G. L., Liang, X. H., Gerber, H. P., Hillan, K. J. & Ferrara, N. (2003) Science 299, 890-893. [DOI] [PubMed] [Google Scholar]
Associated Data
This section collects any data citations, data availability statements, or supplementary materials included in this article.


