

Abstract
Sex chromosomes differentiated from different ancestral autosomes in various vertebrate lineages. Here, we trace the functional evolution of the XY Chromosomes of the green anole lizard (Anolis carolinensis), on the basis of extensive high-throughput genome, transcriptome and histone modification sequencing data and revisit dosage compensation evolution in representative mammals and birds with substantial new expression data. Our analyses show that Anolis sex chromosomes represent an ancient XY system that originated at least ≈160 million years ago in the ancestor of Iguania lizards, shortly after the separation from the snake lineage. The age of this system approximately coincides with the ages of the avian and two mammalian sex chromosomes systems. To compensate for the almost complete Y Chromosome degeneration, X-linked genes have become twofold up-regulated, restoring ancestral expression levels. The highly efficient dosage compensation mechanism of Anolis represents the only vertebrate case identified so far to fully support Ohno's original dosage compensation hypothesis. Further analyses reveal that X up-regulation occurs only in males and is mediated by a male-specific chromatin machinery that leads to global hyperacetylation of histone H4 at lysine 16 specifically on the X Chromosome. The green anole dosage compensation mechanism is highly reminiscent of that of the fruit fly, Drosophila melanogaster. Altogether, our work unveils the convergent emergence of a Drosophila-like dosage compensation mechanism in an ancient reptilian sex chromosome system and highlights that the evolutionary pressures imposed by sex chromosome dosage reductions in different amniotes were resolved in fundamentally different ways.
Sex determination in vertebrates is triggered during development by environmental cues or, genotypically, through the activity of master regulator genes on sex chromosomes, which differentiated from ancestral autosomes during evolution through recombination arrests resulting from chromosomal inversion events (Bachtrog 2013). Sex chromosomes have recently been thoroughly investigated across mammals and birds using large-scale genomics approaches, which provided detailed insights into the origins, differentiation patterns, and functional evolution (including the evolution of dosage compensation mechanisms) for the two distinct male heterogametic (XY) systems in mammals and the common avian female heterogametic (ZW) system (Fig. 1; Julien et al. 2012; Mank 2013; Cortez et al. 2014; Necsulea and Kaessmann 2014; Zhou et al. 2014; Graves 2016). Cytogenetic and individual gene studies suggest an astounding diversity of both ZW and XY sex chromosome systems in other vertebrate lineages (Bachtrog et al. 2014). However, while various studies have shed light on sex chromosome evolution in reptiles and fishes (e.g., Chen et al. 2014; White et al. 2015; Rovatsos et al. 2016; Yin et al. 2016; Rupp et al. 2017), integrated genome-scale investigations of the origins and functional adaptations of vertebrate sex chromosomes outside of mammals and birds remain scarce.
Figure 1.
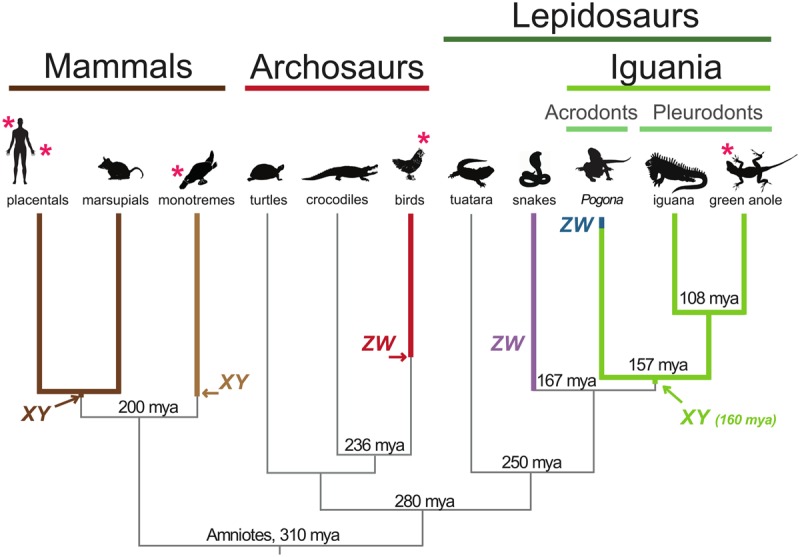
Major amniote lineages and sex chromosome origins. The silhouettes indicate representative species for each group. Ages of main speciation events obtained from TimeTree (www.timetree.org) are indicated (millions of years ago, mya). Arrows indicate previously estimated ages of sex systems origins in amniotes (Cortez et al. 2014) and the age of the Anolis XY system as estimated in this study (see main text and Supplemental Fig. S1). Note that the age of the emergence of the snake ZW system and Pogona ZW system are not precisely known (see main text). Lineages for which RNA-seq data were generated in this study are marked by an asterisk.
The ancestral lineages of mammals and reptiles diverged from the common amniote stem lineage approximately 310 million years ago (Fig. 1; Alfoldi et al. 2011; Wang et al. 2013). Within ancestral reptiles, in turn, the lineage giving rise to extant crocodilians/birds (archosaurs) and turtles diverged from that of other reptiles (lepidosaurs; giving rise to extant lizards, snakes, and tuatara) approximately 280 million years ago (Fig. 1; Alfoldi et al. 2011; Wang et al. 2013). Apart from birds (see above), various sex chromosome systems (both ZW and XY) and temperature-dependent systems have been inferred for extant reptiles through cytogenetic and individual gene studies, suggesting a dynamic evolutionary turnover of sex determination systems in this group of species (O'Meally et al. 2012).
Previous work reported the genome sequence and presence of heteromorphic XY Chromosomes for a key lizard model species—the green anole (Anolis carolinensis) (Fig. 1; Alfoldi et al. 2011). This opened the opportunity to study the functional evolution of an amniote male heterogametic sex chromosome system outside of mammals. The distribution and karyotypic patterns of this XY system within the large Anolis genus and its presence in other (pleurodont) lizards has been established (Rovatsos et al. 2014a,c; Giovannotti et al. 2016), and a recent study made initial suggestions regarding the evolution of dosage compensation in this system based on expression data for green anole tail samples (Rupp et al. 2017). However, a detailed genome-scale investigation of the origins and functional evolution of the Anolis XY system has been lacking.
Results
Generation of transcriptome, genome, and epigenome data for Anolis and other tetrapods
To be able to explore in detail the evolution of the green anole sex chromosomes in the context of those from other amniotes, we generated transcriptomic, genomic, and histone modification data for Anolis and representative tetrapod species (Fig. 1; Methods). For Anolis, we collected transcriptome data using high-throughput strand-specific RNA sequencing (RNA-seq) for 30 adult and 48 embryonic samples (covering most of prehatching development) representing six organs (brain, heart, kidney, liver, testis/ovary) or whole embryos (stage definition is as previously established) (Supplemental Tables S1, S2; Sanger et al. 2008). In addition, we produced high-throughput genomic sequencing (DNA-seq) data for a male and three female anoles. Moreover, following a key observation (see further below), we generated Anolis ChIP-seq (chromatin immunoprecipitation followed by DNA sequencing) data for the histone modification H4K16ac (acetylation of histone H4 on lysine 16), a marker of transcriptional activity (Dion et al. 2005; Shogren-Knaak et al. 2006; Taylor et al. 2013), for eight samples (brain and liver samples from two male and two female individuals, respectively).
Although we and others had previously collected extensive RNA-seq data for representative tetrapods (Brawand et al. 2011; Cortez et al. 2014; Necsulea and Kaessmann 2014; Necsulea et al. 2014), we generated completely new tetrapod data sets for the purpose of this project using the same stranded RNA-seq protocol as employed for Anolis, in order to ensure optimal cross-species comparability in our biological analyses. We thus generated strand-specific RNA-seq data (108 samples) for the corresponding six organs from representatives of the three major mammalian lineages (placental mammals: human, mouse; marsupials: gray short-tailed opossum; monotremes: platypus), a bird (red junglefowl, a nondomesticated chicken), and a frog (Xenopus tropicalis) (Supplemental Tables S1, S2). Finally, for one specific analysis (sex chromosome dating), we generated DNA-seq data for a male Fiji banded iguana (Supplemental Tables S1, S2).
The Anolis Y gene repertoire and sex chromosome origination
To reconstruct the green anole Y gene repertoire, we applied a previous male-female transcriptome/genome subtraction approach (Methods; Cortez et al. 2014). We identified seven Y genes with complete coding sequences and their X counterparts (gametologs), several truncated pseudogenes, and many noncoding RNA sequences (Table 1; Supplemental Table S3). The RTDR1 gene is the only previously reported Y-linked gene in Anolis and was used for sexing individuals (Gamble and Zarkower 2014). Although our procedure might potentially have failed to identify a few genes that are not expressed in tissues and/or developmental stages covered by our data, the small Anolis Y repertoire indicates a dramatic erosion of genes on the anole Y, similar to that reported for other heteromorphic Y/W Chromosomes in amniotes (Cortez et al. 2014; Zhou et al. 2014).
Table 1.
Anolis Y genes
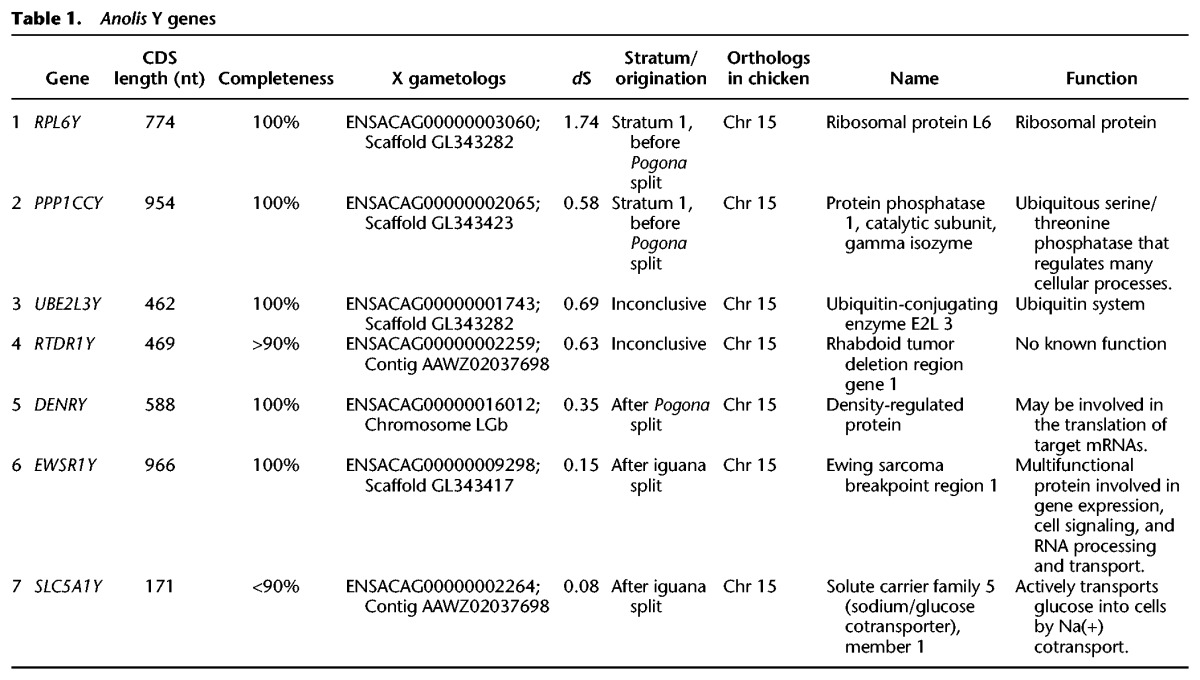
To trace the evolutionary origin of the seven Y genes (i.e., the time at which they began to evolve independently of their X gametologs) and hence of the Anolis sex chromosome system as a whole, we reconstructed phylogenetic trees for the green anole Y and X gametologs and one-to-one (1:1) orthologs from representative tetrapod species (Supplemental Figs S1–S4; Methods). Trees reconstructed with different methods for two genes, RPL6 and PPP1CC, robustly support a divergence of the Y and X clades in the common ancestor of Iguania (Anolis, Fiji banded iguana, and an agamid—the bearded dragon, Pogona vitticeps) (Fig. 1). Reconstructions for the other genes indicate more recent differentiation events (DENR, EWSR1, SLC5A1) or are not fully informative, due to the lack of key outgroup orthologs (RTDR1) or inconclusive branching patterns (UBE2L3) (Table 1; Supplemental Fig. S4).
Together with an analysis of synonymous sequence divergences before and after Y/X differentiation, as well as species divergence time estimates (Methods ; Cortez et al. 2014), our phylogenetic analyses of RPL6Y and PPP1CCY, which likely belong to the first Y stratum, suggest that the Anolis sex chromosome system emerged in the ancestor of all Iguania ≈160 million years ago (95% confidence interval: 149–172 million years) (Supplemental Fig. S1). It therefore has a roughly similar age as both mammalian XY systems and the avian ZW system (Fig. 1). However, we note that the precision of such “absolute” age estimates ultimately relies on fossil calibration points, which may not always be accurate. We also note that it remains possible that our approach failed to detect the actual original Y stratum, either because genes in this stratum are not expressed in tissues/stages covered by our data (see above) or because this stratum was lost during evolution. Therefore, our age estimate might represent a lower bound. In any event, the old phylogenetic age of the Anolis sex chromosomes explains the almost complete erosion of its Y Chromosome (see above) and also implies the loss of the ancestral Iguania XY system and origination of the completely new ZW system in the bearded dragon lineage (Ezaz et al. 2009). This turnover might have been recent, given that the bearded dragon ZW system probably originated only some time before the Pogona species radiation, which started ≈5–7 million years ago (A Georges, pers. comm.).
Our finding of an origination of the Anolis XY system in the common Iguania ancestor (i.e., the common ancestor of pleurodonts and acrodonts [Vidal and Hedges 2009]) is consistent with recent work (Gamble et al. 2014; Rovatsos et al. 2014c) showing that pleurodonts (e.g., Anolis/iguana) share the same XY system, but it is at odds with a modeling study suggesting that the pleurodont XY and acrodont (e.g., bearded dragon) ZW systems evolved independently from an ancestral temperature-dependent system (Gamble et al. 2015). However, we note that it is difficult to infer ancient sex chromosome origins based on current distributions of sex chromosome systems, as was done in Gamble et al. (2014), because of the frequent turnover of sex determination mechanisms, especially in reptiles (O'Meally et al. 2012; Gamble et al. 2015). In contrast, phylogenetic analyses based on the divergence of Y and X gametologs relative to lineage divergence nodes, as presented above, allow for robust phylogenetic dating of sex chromosome differentiation events when branching patterns show strong statistical support.
Y expression evolution
None of the seven Y genes are orthologous to any of the genes known to play roles in the vertebrate sex determination cascade (Table 1; Kashimada and Koopman 2010). Thus, the identification of the Anolis sex determination mechanism warrants further work. Nevertheless, we used the transcriptome data to illuminate the functional evolution of Anolis Y and X gametologs. We compared current XY expression patterns in adult organs to those inferred for their proto-sex chromosomal precursors based on median expression levels of autosomal orthologs in species with different sex chromosome systems. This approach was previously shown to reliably reflect global ancestral expression patterns (Julien et al. 2012; Mank 2013; Cortez et al. 2014; Vicoso and Bachtrog 2015).
The analysis suggests that three of the seven Y genes (PPP1CCY, DENRY, SLC5A1Y) evolved testis-specific expression after sex chromosome differentiation, whereas their X counterparts retained ancestral expression patterns (Supplemental Fig. S5A). One proto-sex chromosome gene, RTDR1, was already gonad-specific and maintained this specificity on both the Y and X in adult males and females. The three remaining Y genes (RPL6Y, UBE2L3Y, EWSR1Y) retained the ancestral expression pattern of ubiquitous expression. Similarly to therian mammals, Y genes in Anolis have lost expression levels during evolution (i.e., when compared to the ancestral expression levels of single proto-sex chromosome alleles) (Supplemental Fig. S5B), likely reflecting the same relaxation of selective constraint that led to the erosion of the Y gene content (Bachtrog 2013; Cortez et al. 2014). Analyses of the developmental data revealed that Anolis Y genes often diverged from their X counterparts in terms of their ontogenetic trajectories and that Y genes are generally more lowly transcribed (Supplemental Fig. S6). Overall, these patterns are consistent with previous observations in other amniotes (Bellott et al. 2014; Cortez et al. 2014): Y genes generally lose expression output with time; certain Y genes evolve male-specific functions in spermatogenesis, whereas others (dosage-sensitive genes) are retained to maintain the ancestral (proto-sex chromosomal) gene dosage together with their X counterparts; the function of ancestral X gametologs is generally preserved.
The evolution of dosage compensation in the green anole and other amniotes
A major consequence of sex chromosome differentiation is the reduction in gene dosage relative to the ancestral autosomal precursors due to the massive gene loss on the Y Chromosome (Fig. 2A,B; Graves 2016). It is thought that mechanisms evolved to compensate for this loss (Fig. 2C–E). In particular, a prevailing theory, originally put forward by Susumu Ohno (Ohno 1967), posits that a twofold up-regulation of the genes on the X Chromosome may generally restore ancestral expression outputs and thus also maintain the balance between X-linked and autosomal gene expression. In addition, unless the up-regulation mechanism is specific to males (like in Drosophila) (Fig. 2E; Conrad and Akhtar 2012), the overabundance of X transcripts in females, which results from the combined activity of the two up-regulated X Chromosomes, would lead to the evolution of a compensation mechanism that involves the inactivation of one of the female X Chromosomes (X Chromosome inactivation, XCI) (Fig. 2C,D).
Figure 2.

Scenarios for dosage compensation after sex chromosome differentiation. (A) Sex chromosomes stem from ordinary pairs of ancestral autosomes, also known as proto-sex chromosomes. (B) Following sex chromosome differentiation and extensive Y gene loss, females retain two active X Chromosomes while males are left with a single active X and a Y Chromosome with only very few remaining ancestral genes (i.e., males effectively retain only one of the ancestral copies for most genes). Several scenarios for how this dosage reduction was compensated have been proposed and/or described; three prominent scenarios are outlined in panels C–E. (C) A twofold up-regulation of all X-linked genes in both sexes is secondarily compensated by the inactivation (black symbols) of one X Chromosome in females (Ohno's hypothesis) (Ohno 1967). This scenario applies to at least several tissues of marsupials (imprinted XCI is present in marsupials) (Fig. 3A; Grant et al. 2012). (D) The expression output of the X Chromosome remains unchanged in both sexes, and one of the female X Chromosomes is secondarily inactivated. This scenario is observed—at least globally and at the transcriptional level—in placentals (Fig. 3A; Julien et al. 2012; Lin et al. 2012; Mank 2013). Note that it is not clear in this scenario how a dosage reduction without expression increase could be tolerated and why random X inactivation evolved in these mammals; i.e., this scenario is shown because it illustrates the currently known placental pattern. Alternative mechanisms (e.g., down-regulation of autosomal partner genes, translational up-regulation) likely contributed to dosage compensation of haploinsufficient genes in this scenario (see main text). (E) Females retained two active X Chromosomes and a male-specific epigenetic mechanism prompted a twofold up-regulation of the X Chromosome in males. This scenario is observed in both Drosophila (Conrad and Akhtar 2012) and Anolis (this study; Conrad and Akhtar 2012).
To assess the extent to which the almost complete loss of Y genes led to the emergence of X dosage compensation mechanisms in the green anole and, for comparison, to revisit dosage compensation evolution across the other amniotes, we first compared current X (Z for chicken) expression levels with ancestral (proto-sex chromosomal) expression levels, which were inferred from expression levels of autosomal orthologs from outgroup species (see also XY gametolog analysis above) (Julien et al. 2012; Mank 2013; Cortez et al. 2014; Vicoso and Bachtrog 2015). Strikingly, the current (median) X expression level in Anolis is statistically indistinguishable from the inferred ancestral level (Fig. 3A). Therefore, the massive gene loss on the anole Y apparently triggered a global twofold X up-regulation. This up-regulation not only restored ancestral expression levels but also led to highly similar median X expression levels between the two sexes in adults and throughout embryonic development (Fig. 3B). However, without additional data (e.g., evidence for XCI or a male-specific chromatin machinery; see details below), it is impossible to distinguish between the two principle scenarios of dosage compensation outlined above; that is, a Drosophila-like scenario, where the X is twofold up-regulated specifically in males, while females simply retained the ancestral expression output through two active X Chromosomes (Fig. 2E), and an alternative scenario where X up-regulation occurs in both sexes and females therefore acquired XCI (Fig. 2C). In both scenarios, the current X expression output is the same in both sexes and similar to ancestral levels.
Figure 3.
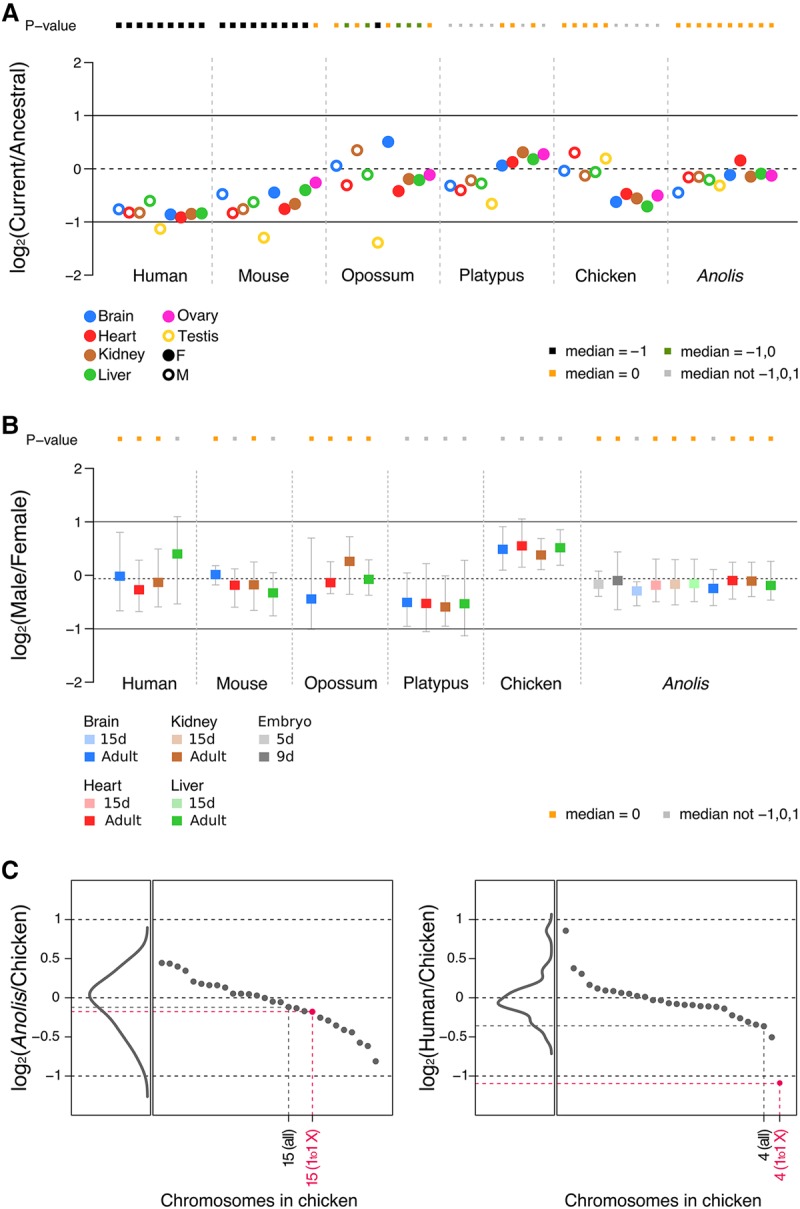
Expression level evolution of X-linked genes across amniotes. (A) Ratios of current expression levels of X-linked genes (median value) and their ancestral expression levels (median value) in four somatic tissues and gonads. Multiple outgroup species were used to calculate the ancestral expression levels (for therians: chicken, platypus, Anolis, Xenopus; for chicken/platypus: mouse, opossum, Anolis, Xenopus; for Anolis: mouse, opossum, chicken, platypus, Xenopus; note: human was not used as an outgroup anywhere, given that no ovary data were available). Full circles represent female tissues, whereas empty circles represent male tissues. Significant differences (Mann-Whitney U test): Benjamini-Hochberg-corrected P < 0.05 of current to ancestral ratios compared to reference values 1, 0, and −1. Orange squares indicate a current to ancestral ratio not significantly different from 0 (i.e., expression levels of X-linked genes have been preserved during evolution). Black squares indicate a current to ancestral ratio not significantly different from −1 but different from other reference values (i.e., expression levels decreased twofold during evolution). Green squares denote a current to ancestral ratio not different from −1 and 0, and gray squares indicate ratios different from −1, 0, and 1. For chicken, Z-linked genes were analyzed. We observe very similar patterns when using chicken or Xenopus as an outgroup (Supplemental Fig. S9). (B) Male to female expression level ratios in four somatic tissues and gonads across amniotes. Error bars indicate maximum and minimum values, excluding outliers. Tests of significance are analogous to those indicated for panel A. All underlying expression values are calculated as FPKM. (C) Median values (across the four somatic organs: brain, heart, liver, kidney) calculated from ratios of current expression levels of Anolis or human genes compared to current expression levels of 1:1 orthologous genes in chicken (the outgroup). Individual gene ratios were grouped following the chromosomal annotation in chicken and the median values for each chromosome are indicated and sorted in descending order (black and pink dots). Density diagrams represent the distribution of median values. In pink: median values for all genes in Chromosomes 4 and 15 of chicken (marked as “all”) and those with only 1:1 orthologous genes in the Anolis and human X Chromosomes (marked as “1to1 X”). Note that genes in chicken Chromosome 4 are only partially corresponding to human X-linked genes, while genes in the Anolis X almost entirely correspond to orthologs in chicken Chromosome 15. See Supplemental Figure S8 for the complete list of used autosomes.
In this context, we would like to compare a previous Anolis study that was based on regenerating tail samples (Rupp et al. 2017) to the present results. First, the authors of that study inferred X dosage compensation patterns in Anolis through comparisons of current expression levels between males and females and between the X and autosomes. This approach may not be optimal (Julien et al. 2012; Mank 2013), given that it assumes that all chromosomes have the same overall expression levels, which is not always the case. Moreover, the relatively small data set used, the use of different pieces of regenerating tails as biological replicates, and the fact that the authors did not focus on the genes that triggered the original dosage compensation response (i.e., genes present on the proto-sex chromosomes) may explain why they—contrary to our study (Fig. 3; Supplemental Fig. S7)—infer incomplete X up-regulation and substantial differences in the extent of up-regulation (i.e., differences in male-to-female or X-to-autosome ratios) across different X portions and the two studied female individuals. Second, while the authors suggest that their results (X up-regulation, inferred from X-to-autosome comparisons) were suggestive of a male-specific mechanism, it is worth noting that gene expression level comparisons alone cannot distinguish between the possibilities of male-specific up-regulation or up-regulation in both sexes followed by XCI in females, as explained above (Fig. 2).
Before we describe a detailed exploration of the Anolis dosage compensation mechanism based on additional epigenomic data, we first report current-to-ancestral expression comparisons for the other species, to put the Anolis up-regulation pattern in perspective. These cross-amniote analyses confirm the previously observed patterns that were based on other (non-strand-specific) data sets (Fig. 3A; Julien et al. 2012; Lin et al. 2012; Mank 2013; Necsulea and Kaessmann 2014; Graves 2016). Namely, the X expression output in placentals is generally only half of the proto-sex chromosomal one, suggesting a lack of global X up-regulation in these mammals (i.e., a pattern consistent with the scenario in Fig. 2D), whereas marsupials, which have the same sex chromosome system (Foster and Graves 1994), show signs of global up-regulation in several tissues. Monotremes and birds show signals of partial up-regulation in the heterogametic sex. We note that the particularly reduced expression levels in the therian testis (Fig. 3A) reflect the effect of meiotic sex chromosome inactivation (MSCI), a mechanism that leads to transcriptional silencing of sex chromosomes in male meiotic germ cells (Turner 2015) and evolved upon sex chromosome differentiation (Potrzebowski et al. 2008; Julien et al. 2012). Importantly, as also previously shown (Julien et al. 2012), autosomes retained ancestral (median) expression levels during evolution. Consequently, the placental X, for example, falls as a clear outlier relative to other chromosomes in the current-to-ancestral gene expression comparisons, contrary to the Anolis X (Fig. 3C; Supplemental Fig. S8). Furthermore, the aforementioned patterns are robust to the choice of outgroup (Supplemental Fig. S9). These control analyses therefore further validate the approach to use autosomal orthologs from outgroup species to assess proto-sex chromosomal expression patterns. They also validate the observation of the striking difference in patterns between placentals (i.e., the lack of global X up-regulation) and the Anolis (Iguania) system (twofold up-regulation), which provides the first unambiguous support for the key aspect of Ohno's dosage compensation hypothesis in vertebrates.
Mechanisms of dosage compensation in the green anole—a Drosophila-like mechanism?
To investigate the mechanism underlying dosage compensation in Anolis, we considered the possibility of a Drosophila-like mechanism by screening for male-biased expression of factors that could underlie such male-specific X up-regulation. The top five most male-biased genes included an interesting gene, APBB1 (also called FE65) (Supplemental Table S4). The encoded protein, APBB1, is a cofactor required by KAT5 (also called TIP60), a histone acetyl transferase from the MYST superfamily, to up-regulate genes by acetylating nucleosomal histones, including residue K16 of histone 4 (Fig. 4A; Stante et al. 2009; Taylor et al. 2013). H4K16 acetylation is crucial for chromatin structure and function in eukaryotes; by hampering nucleosome interactions, it reduces levels of chromatin compaction, facilitating transcription (Dion et al. 2005; Shogren-Knaak et al. 2006; Taylor et al. 2013). APBB1 is 1.5–2 times more highly expressed in males in all Anolis organs, whereas it is not sex-biased in all other species (Fig. 4B). It therefore evolved male-biased expression on the lineage leading to anole lizards, presumably following Iguania sex chromosome differentiation. APBB1 gene expression is not sex-biased in Pogona (Supplemental Fig. S10), which implies that the expression profile of this gene was probably readjusted following the XY sex system loss in this lineage.
Figure 4.

Potential factors of Anolis H4K16 acetylation machinery and APBB1 expression profile in Anolis males and females. (A) Schematic model depicting the up-regulation of gene expression following the histone H4K16 acetylation, catalyzed by the TRRAP-KAT5-APBB1 protein complex. (B) Expression profile of the APBB1 gene in male and female somatic tissues in Anolis and other amniotes.
Notably, in Drosophila melanogaster, X up-regulation is achieved by global acetylation of H4K16 on the X through the MYST family histone acetyl transferase MOF, which is activated by the male-specific cofactor MSL2 (which binds to X-specific sequence motifs) (Hilfiker et al. 1997; Conrad and Akhtar 2012). Our observations for Anolis are therefore reminiscent of the well-characterized male-specific X up-regulation mechanism of fruit flies and raise the intriguing possibility that the Anolis dosage compensation system is not only male-specific, as in Drosophila, but that the systems in these two highly diverged lineages also have similar mechanistic foundations that emerged convergently during evolution.
A Drosophila-like mechanism: male- and X-specific hyperacetylation of chromatin at H4K16 in Anolis
To explore whether histone 4 acetylation is indeed central to the Anolis dosage compensation system, we generated and analyzed H4K16ac ChIP-seq data for brain and liver samples from males and females. We first assessed global features of H4K16ac across the Anolis genome based on input-normalized H4K16ac quantifications. These analyses reveal H4K16ac domains encompassing gene bodies, with signal peaks at transcription start sites (TSS) (Fig. 5; Supplemental Fig. S11). Intergenic regions show significantly lower H4K16ac levels (P < 10−10, Mann-Whitney U test) (Fig. 5C). Importantly, active genes, in particular those with higher expression levels, have higher H4K16ac levels than lowly expressed/inactive genes (P < 10−2, Mann-Whitney U test) (Fig. 5A,B). Together, these data establish H4K16ac as a transcriptional activation mark in Anolis, consistent with the chromatin-modulating roles previously described for other eukaryotes (Dion et al. 2005; Shogren-Knaak et al. 2006; Taylor et al. 2013).
Figure 5.

Features of H4K16ac in Anolis and its relationship with gene expression and genic regions. (A) Heat maps and average profiles showing input-normalized H4K16ac ChIP-seq (FPKM) signals for all Anolis genes sorted by gene expression values (FPKM) in decreasing order (top to bottom). The signal is particularly enriched along the gene body with peaks around TSS for active genes. The data illustrate the clear distinction between active and inactive genes (median curves) and the correlation between H4K16ac activity and gene expression, where ChIP-seq FPKM values tend to decrease with decreasing RNA-seq FPKM values (heat maps). The y-axis scale is the same for both sexes within each tissue. (B) Comparisons of H4K16ac signal distributions between active and inactive genes. (C) H4K16ac signal comparisons between genic and intergenic regions; genic regions include intervals between the TSS and transcription end site plus 2-kb regions upstream of the TSS. Supplemental Figure S11 contains similar plots for all samples. Active genes: FPKM ≥ 1, inactive genes: FPKM < 1. Statistical (Mann-Whitney U) test significance levels: (n.s.) not significant; (*) P ≤ 0.05; (**) P ≤ 0.01; (***) P ≤ 0.001; (****) P ≤ 10−10.
We then set out to compare H4K16ac patterns between males and females. Strikingly, while all autosomes show similar (low) H4K16ac levels in males and females, H4K16ac levels on the X Chromosome are substantially elevated in males relative to females (P < 10−10 Mann-Whitney U test) (Fig. 6; Supplemental Figs. S12A,B, S13), resulting in an average male-to-female acetylation level ratio for the X Chromosome of 1.4 (±0.029) in brain and 1.8 (±0.039) in liver. Notably, X hyperacetylation in males extends to intergenic regions (Supplemental Fig. S12B). Autosomal acetylation levels are very similar between males and females (ratio brain: 0.98 ± 0.004, liver: 1.03 ± 0.004). The fact that H4K16ac levels are slightly higher on the X than on autosomes also in females (Fig. 6; Supplemental Fig. S12A,B) is likely due to the higher proportion of expressed genes on the X (Supplemental Fig. S12C).
Figure 6.

H4K16ac enrichment on the X Chromosome of Anolis males. (A) Genome-wide ChIP-seq profile along autosomes (light colors) and X-linked contigs (dark colors) for Anolis liver. Upper plots show data for the input (i.e., DNA prior to immunoprecipitation), which illustrate that the male X has only approximately half the coverage compared to autosomes and female X, consistent with the hemizygous state of male Anolis sex chromosomes. Lower plots display the input-normalized ChIP-seq signals and show the H4K16ac enrichment on the male X. All chromosomes are scaled to the same length; pink and light blue shaded areas around profile lines correspond to 95% confidence intervals. See Supplemental Figure S13 for the full data set (both organs, all replicates). Contig names correspond to those defined in the original Anolis genome paper (Alfoldi et al. 2011). (LG) Linkage group, (X1) LGb, (X2) GL343282.1, (X3) GL343338.1, (X4) GL343364.1, (X5) GL343417.1, (X6) GL343423.1, (X7) GL343550.1. (B) Comparison of H4K16ac distributions between autosomes and X Chromosomes along genic regions. Significance symbols are defined as in Figure 5. (Rep1) biological replicate 1; (Rep2) biological replicate 2. Comparisons along the whole genome and specifically for intergenic regions are reported in Supplemental Figure S12, A and B.
These results suggest male-specific X up-regulation through X hyperacetylation, whereas they are not compatible with a scenario of twofold up-regulation in both sexes coupled with XCI in females. Namely, even if we simulate with our data a scenario in which the H4K16ac signal in females stems entirely from one transcriptionally active and hyperacetylated X (while the other X is silenced and completely hypoacetylated), H4K16ac levels remain significantly (1.37-fold) higher on the male than female X in the liver (P < 10−5, Mann-Whitney U test) (Supplemental Fig. S14). Consistently, allelic expression analyses based on our bulk tissue RNA-seq data and matched genomic data (Methods) demonstrate that expression levels of the alleles are overall statistically indistinguishable across X genes in all female tissues (Supplemental Fig. S15), which rules out the possibility of imprinted XCI in Anolis. Finally, allelic analyses of single-cell brain transcriptome data and matched genomic data reveal biallelic expression on the female X similar to that on autosomes (Supplemental Fig. S16; Supplemental Table S6), which also excludes the presence of random X inactivation across Anolis cells. Collectively, our analyses thus provide strong support for a dosage compensation mechanism in Anolis that is highly reminiscent of that in Drosophila and involves a male-specific chromatin machinery that yields twofold X up-regulation in males through hyperacetylation at H4K16 exclusively across the X Chromosome.
Discussion
In this study, we describe the origin and functional evolution of the Anolis XY Chromosome system based on comprehensive transcriptome, genome, and epigenome data sets. We found that the Anolis sex chromosomes represent an ancient reptilian system that emerged at least ∼149–172 million years ago in the ancestor of Iguania lizards, which is even earlier than the previously suggested origination in the pleurodont ancestor (Rovatsos et al. 2014c; Gamble et al. 2015). Thus, four major amniote sex chromosome systems might have emerged within a relatively short time span in the Jurassic and/or early Cretaceous Period (Fig. 1; Supplemental Fig. S1; Cortez et al. 2014; this study). While this concurrence may represent a mere coincidence and molecular dating relies on potentially inaccurate fossil calibration points, one might at least speculate that this observation reflects common or similar changes in environmental conditions, which necessitated genotypic rather than temperature-dependent sex determination in various amniotes.
Our functional evolutionary analyses of the green anole sex chromosomes revealed that the evolutionary Y expression dynamics resemble those of Y Chromosomes in mammals (Bellott et al. 2014; Cortez et al. 2014). In particular, while certain Y genes evolved male-specific expression, others (potentially haploinsufficient genes) retained ancestral expression patterns. However, the almost complete erosion of all other Y genes triggered the evolution of a highly efficient dosage compensation system, in which the loss of Y gene copies was compensated by a global twofold up-regulation of ancestral X-linked partners (Figs. 3, 7).
Figure 7.
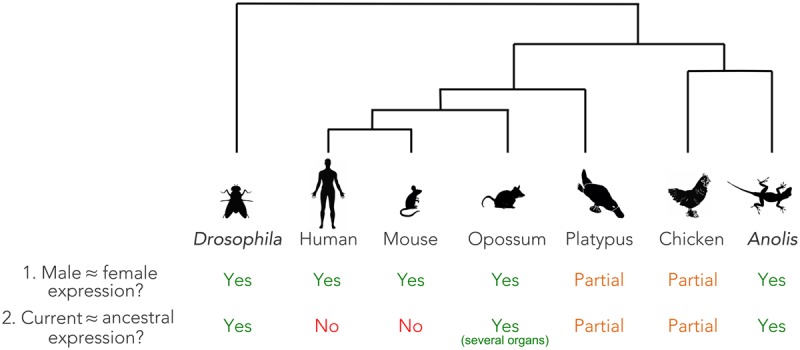
Global patterns of dosage compensation in amniotes and Drosophila. Presence, absence, or partial presence of: (1) similar expression levels of X-linked genes in males and females; (2) maintenance of ancestral expression levels of X-linked genes following sex chromosome differentiation (Y/W decay).
At the same time, we confirmed earlier observations that placentals lack such global up-regulations (Julien et al. 2012; Lin et al. 2012), whereas marsupials show full up-regulation in some tissues and monotremes and birds show partial up-regulation (Figs. 3, 7; Julien et al. 2012). Consequently, there is indeed no sign of global X up-regulation in placentals, contrary to some suggestions based on comparisons of expression levels between the current X and autosomes (Nguyen and Disteche 2006; Deng et al. 2011), an approach that is not well suited to trace evolutionary up-regulation of proto-sex chromosomal genes (Julien et al. 2012), although, notably, other X-to-autosome comparisons also did not reveal global X up-regulation (Xiong et al. 2010). In all species in which ancestral X (Z) transcript levels were not globally restored in all organs, a combination of various alternative mechanisms may have compensated for the dosage reduction of haploinsufficient genes following Y degeneration. These include the transcriptional up-regulation of individual X-linked genes or down-regulation of selected autosomal partners (Julien et al. 2012; Necsulea and Kaessmann 2014); selective preservation of Y genes (Bellott et al. 2014; Cortez et al. 2014); relocalization of XY genes or export of duplicate copies to autosomes (Potrzebowski et al. 2008; Hughes et al. 2015; Carelli et al. 2016); duplication of genes on the X (Julien et al. 2012); and/or X up-regulation at the posttranscriptional (e.g., translational) level (Faucillion and Larsson 2015). A full evaluation of the relative contributions of these mechanisms to sex chromosomal dosage compensation in different lineages requires further work. Such work may then also clarify the actual forces underlying the evolution of chromosome-wide XCI in placentals; given the lack of global X up-regulation (Figs. 2D, 3A), the reasons for the emergence of this secondary dosage compensation mechanism in this mammalian lineage remains enigmatic.
Collectively, our comparative analyses show that the Anolis system represents the only vertebrate case identified to date to solidly and fully support the key component (twofold X up-regulation) of Ohno's original dosage compensation hypothesis (Ohno 1967). However, we note that our data for marsupials indicate that dosage compensation patterns in these mammals also match Ohno's prediction, at least in several organs (Figs. 3A, 7; see also Julien et al. 2012). Intriguingly, we find the Anolis X up-regulation to be specific to males and to be achieved by a male-specific chromatin machinery that leads to global hyperacetylation of H4K16 across the X Chromosome. Our data suggest a key role of the male-biased expression of APBB1 (a cofactor of the MYST histone acetyl transferase KAT5) in this process. The Anolis mechanism is remarkably similar to that of Drosophila, where H4K16 hyperacetylation is also central to X dosage compensation and is mediated by male-specific expression of a MYST histone acetyl transferase cofactor (MSL2). The independent emergences of these two dosage compensation systems in these two highly divergent animal lineages therefore represent a remarkable case of convergent evolution. Future endeavors will uncover mechanistic details of the Anolis system, similarly to the long-standing work on the mechanism of Drosophila melanogaster (Conrad and Akhtar 2012), and hence reveal the extent of convergent evolution between the Anolis and Drosophila systems at a finer molecular scale.
Methods
Transcriptome data generation (bulk tissue samples)
We generated strand-specific RNA-seq libraries (using the Illumina TruSeq Stranded mRNA Library protocol) for a total of 186 samples from the green anole and other representative amniotes (see main text; Supplemental Tables S1, S2). Sample size (minimum one male and one female for each species) was established to have a wide spectrum across amniotes and to capture general male/female sex-specific patterns. Each source RNA was of high quality, as assessed using a Fragment Analyzer machine from Advanced Analytical (RIN median = 9, RQN median = 8; note that some measured RIN/RQN values are low, but manual inspection of the QC data revealed acceptable quality) (Supplemental Table S2). Each library was sequenced on Illumina HiSeq 2500 platforms at the Lausanne Genomic Technologies Facility (https://www.unil.ch/gtf/en/home.html). At least 17 million sequencing reads (100 nt, single-end) were produced for each library (median: 34 million reads) (Supplemental Table S2). Embryonic samples were sexed using the following male-specific primers: UBE2L3Y gene, forward: CCACTTGTGAGAAAGAGTTACAGAATG, reverse: GATATACATACACGAGACTGACAGCTAAC; PPP1CCY gene, forward: CTTTCTGCTAGTTCAAGTTGTTCTTCC, reverse: GAAAATGACAGAGGAGTATCTTTCACC; DENRY gene, forward: AGCATGATGGTCTTACTTCCTTAGGTT, reverse: AATATGTTACAAGAGTGTGTGGTCTCG; RPL6Y forward: TGATCTACACCAGTCGCAACCA, reverse: GCGCTCATACATTGCCTTATGGG. These primers were designed to specifically amplify Y sequences; PCR reactions with female DNA did not show any amplification. Male/female DNA from 10 individuals was extracted using a standard phenol/chloroform protocol. PCRs were performed with JumpStart REDTaq ReadyMix (Sigma-Aldrich) according to the manufacturer's protocol at 61°C for the annealing step. PCR reactions were run on agarose gels, and male-specific DNA bands were extracted and purified using GenElute Agarose Spin Columns (Sigma-Aldrich) and sequenced using standard Sanger sequencing (trace files available at Supplemental_Data.zip). Resulting sequences were confirmed using established Y transcripts.
Transcriptome data generation (single cells)
An adult female green anole (Anolis carolinensis), obtained from a commercial supplier (Aquaterra Shop), was sacrificed by rapid decapitation, and the whole brain was immediately dissected. All procedures were approved by the Interfaculty Biomedical Research Institute of the University of Heidelberg, Germany, in accordance with federal guidelines. Single cells were isolated from whole Anolis brain, using the papain dissociation kit (#LK003150; Worthington Biochemical Corporation) according to the manufacturer's instructions. Briefly, the whole Anolis brain was slightly minced and incubated at 37°C in papain solution for 60 min, under constant agitation. Debris was removed by density gradient centrifugation contained in the papain dissociation kit. Cells were then resuspended in ice cold HBSS solution (#H8264; Sigma-Aldrich) with 0.3% glucose and filtered through a 20-µm cell strainer (#43-50020; pluriSelect Life Science). Cells were processed using the C1 Single-Cell Auto Prep System (Fluidigm Corporation) with the SMARTer Ultra Low RNA Kit (#634833; Takara - Clontech). Cells were counted using Trypan blue staining with the LUNA automated cell counter (#KR-41; Logos Biosystems) and used in a concentration of 700 cells/µL. For loading of an IFC microfluidic chip (#100-5759; Fluidigm Corporation) designed for 5 to 10 µm cells, 6 µL cell suspension and 4 µL C1 suspension reagent were mixed and loaded with the mRNA Seq: Cell Load script. The chip was then inspected, using a bright field microscope, for capture sites that contain a single, viable cell. Doublets and dead cells were in this way excluded from further processing. Lysis, reverse transcription, and cDNA amplification were performed in the C1 system according to the manufacturer's instructions. Subsequent library preparation was done using the Nextera XT DNA Library Preparation Kit (#FC-131-1024; Illumina Inc.) as recommended in the C1 user guide. Library molar concentration was quantified by Qubit Fluorometer (Thermo Fisher Scientific Inc.), and fragment length was assessed using a Bioanalyzer 2100 (Agilent Technologies). In total, eight cells were sequenced on a MiSeq sequencer (Illumina Inc.) using a paired-end protocol (75 nt). Six cells were used for downstream analysis based on the ratio of mitochondrial reads to total genomic reads.
Genome data generation
We generated DNA-seq libraries for one male and three female green anoles (i.e., for the same individuals for which bulk tissue or single-cell RNA-seq data were produced) and a male Fiji banded iguana using the Illumina TruSeq DNA protocol for short insert size (target size 400–450 nt). The paired-end DNA-seq libraries were sequenced on Illumina HiSeq 2500 sequencers (100-nt paired-end reads per genome for bulk tissue RNA-seq analyses and 75-nt paired-end reads for single-cell analyses) (Supplemental Table S2).
Native ChIP-seq data generation
Native chromatin immunoprecipitation (ChIP) was performed as previously described (Pradeepa et al. 2016) with some modifications. Specifically, ∼20 mg of frozen brain and liver tissue sample from Anolis was ground in liquid nitrogen into fine powder. The powder was resuspended in 5 mL of ice-cold buffer 1 containing 0.3 M sucrose in 60 mM KCl, 15 mM NaCl, 5 mM MgCl2, 0.1 mM ethylene glycol-bis N,N,N′,N′-tetraacetic acid (EGTA), 15 mM Tris-HCl (pH 7.5) 0.5 mM Dithiothreitol (DTT), 0.1 mM phenylmethylsulfonyl fluoride (PMSF; Sigma-Aldrich), and 1× protease inhibitor mix (Sigma-Aldrich). The cell suspension was homogenized by manual douncing (tight) for 10 times on ice and then transferred to a 14-mL polypropylene tube and spun down in a swing-out rotor at 6000g for 10 min at 4°C. The supernatant was discarded, and cells were resuspended in 2 mL of ice-cold buffer 1. Then, 2 mL of ice-cold buffer II (buffer 1 + 0.4% [v/v] IGEPAL CA-630 [Sigma-Aldrich]) was added, mixed by pipetting gently, and placed on ice for 10 min. Nuclei were pelleted at 2000g for 3 min at 4°C, then washed with NBR buffer (85 mM NaCl, 5.5% sucrose, 10 mM Tris-HCl [pH 7.5], 3 mM MgCl2, 1.5 mM CaCl2, 0.2 mM PMSF, and 1 mM DTT) and pelleted at 2000g for 3 min at 4°C. Nuclei were resuspended in NBR buffer, supplemented with RNase A (20 µg/mL), and incubated at 20°C for 5 min. Chromatin was fragmented for 30 min at 20°C using 0.133 U/μL microccocal nuclease (MNase, Boehringer units; #N3755-500UN; Sigma-Aldrich; titrated to give predominantly mononucleosomes). Digestion was stopped with the addition of an equal volume of STOP buffer (215 mM NaCl, 10 mM Tris-HCl [pH 8], 20 mM EDTA, 5.5%, sucrose, 2% Triton X-100, 0.2 mM PMSF, 1 mM DTT, 2× protease inhibitors), and digested nuclei were left on ice overnight to release soluble, fragmented chromatin. Chromatin was precleared by centrifugation at 12,000g for 10 min at 4°C, and the soluble chromatin (supernatant) transferred to a fresh tube. Five percent of the released chromatin was retained as input and the remainder incubated for 4 h at 4°C on a rotating wheel with ∼5 µg of H4K16ac antibodies (#07-329; Millipore) precoupled to protein A Dynabeads (#10002D; Life Technologies) in PBS containing 5 mg/mL BSA and 0.1 mM PMSF. Immune complexes bound to beads were washed 5× with wash buffer 1 (150 mM NaCl, 10 mM Tris-HCl [pH 8], 2 mM EDTA, 1% NP40, and 1% sodium deoxycholate) on a rotating wheel for 5 min each and once in room temperature TE buffer for 1 min. Chromatin was released from the beads by incubation with 0.1 M NaHCO3/1% SDS for 30 min at 37°C, and Dynabeads were separated from eluted chromatin using a magnetic rack followed by the addition of proteinase K (100 ug/mL) and Tris [pH 6.8] (100 mM) and incubation at 55°C overnight. The DNA was purified using QIAquick PCR Purification columns (Qiagen) according to the manufacturer's instructions. Five nanograms of input and ChIPed DNA were used to prepare sequencing libraries using a NEBNext Ultra II Library Prep Kit as described by the manufacturer (#E7645S; New England BioLabs). Libraries were sequenced (75-nt, paired-end) using Illumina HiSeq 4000 machines at the Edinburgh Genomics facility (University of Edinburgh).
X Chromosome genes
In the published anole genome sequence, the assembled X Chromosome contains 131 protein-coding genes (Alfoldi et al. 2011; Eckalbar et al. 2013). A large number of additional genes (243 genes) were predicted to be X-linked using a PCR-based approach (Rovatsos et al. 2014b) and based on their orthology to Chromosome 15 of chicken (Rupp et al. 2017). To confirm the X gene repertoire, we assigned unassembled contigs following a previously established procedure to the X Chromosome, taking advantage of the male/female DNA-seq data and differences in read coverage that assigns X-linkage of contigs based on a (twofold) higher read coverage in females compared to males (Cortez et al. 2014). A total set of 313 Anolis X Chromosomal genes was used for all further analyses (Supplemental Table S5).
Assembly of Y-linked transcripts
To assemble Y transcripts in Anolis, we used a subtraction approach previously developed and applied in a mammalian/avian study (Cortez et al. 2014). To further increase the accuracy of the Y transcriptome reconstructions, we established a curated RNA-seq database enriched in Y-specific reads. Specifically, we first removed all reads with ambiguous nucleotides (e.g., N, R, Y) and mapped the remaining RNA-seq reads from male tissues with TopHat2 (v2.0.10) (Kim et al. 2013) to the Anolis carolinensis female reference genome downloaded from the Ensembl database (version 81; www.ensembl.org). Male reads not mapping to the reference genome or mapping with more than two mismatches were labeled and considered in downstream analyses. Next, based on the female RNA-seq data, we constructed a hash of 35-base pair (bp) k-mers following a previous procedure (Akagi et al. 2014). We calculated the frequency of these 35-bp k-mers and removed those showing frequencies below 10; we did not consider rare k-mers as part of the overall signature of the female transcriptome. The use of k-mer hashes has been shown to be very efficient in removing most of the sex-unspecific reads (Carvalho and Clark 2013; Akagi et al. 2014). We then aligned the selected 35-bp k-mers to the male unmapped reads using Bowtie 2 (2.1.0) (Langmead and Salzberg 2012), allowing no mismatches and registering successful alignments. We selected only those male reads showing zero alignments. We assembled the transcriptomes using these putative male-specific reads for male tissues individually and for male tissues combined with Trinity (v2.0.2; default k-mer of 25 bp) (Grabherr et al. 2011). To validate true Y transcripts, we sought to align male and female Illumina genomic reads to all reconstructed transcripts that were longer or equal to 500 bp using BLASTN (Altschul et al. 1990), requiring 100% alignment identities. The aforementioned filters resulted in <10% of the transcripts showing alignments of female genomic reads. The BLASTN searches were also crucial to distinguish between actual male-specific sequences from Anolis and assembly errors or contaminations (e.g., sequences from bacteria, fungi, viruses). As a final Y-transcript validation step, we screened male/female genomic DNA (extracted using a standard phenol/chloroform protocol) using a PCR approach (Cortez et al. 2014). (A list of primer sequences is available in the “Transcriptome data generation” section.)
Reconstruction of Y- and X-linked genes in the Fiji banded iguana
For the Fiji banded iguana, we applied a previously established genomic approach to reconstruct Y and X gametologs (Cortez et al. 2014). This approach seeks to identify orthologous genes of known Y and X genes in a given species on the basis of high-throughput genomic sequencing data. Briefly, we first used BLASTN (Altschul et al. 1990) searches to identify the reads in the high-throughput iguana DNA-seq data (at approximately 15× coverage) with the highest similarity to the Y and X Anolis genes, respectively. The selected reads were assembled with Trinity (Grabherr et al. 2011) to obtain the final sequences. We verified that these reconstructed sequences did not belong to other genes by aligning the Y and X gametologs with the Anolis’ orthologous sequences using MUSCLE (v3.8.31) (Edgar 2004) and by performing BLASTN and BLASTX searches of the reconstructed sequences against sequences in the NCBI GenBank database (www.ncbi.nlm.nih.gov/genbank).
Assignment of Y gene names and X gametologs
To establish Y gene identity and to identify the X gametolog sequences, we searched Ensembl-annotated gene sequences and NCBI GenBank (www.ncbi.nlm.nih.gov/genbank) for the closest homolog using BLASTN and BLASTX (matches were confirmed using visual inspection of sequence alignments). Contigs without any significant match in the databases and without clear open reading frame predictions were considered to be noncoding. We identified coding sequences in the Y transcripts based on MUSCLE (Edgar 2004) and PRANK (Loytynoja and Goldman 2005) alignments using annotated gametologs and orthologous genes. We note that the RNA-seq-based Y transcript reconstructions are expected to usually yield the most frequent isoform for a given Y gene. Functions of Y-linked genes were obtained from genecards (www.genecards.org).
Phylogenetic analysis
First, we aligned coding sequences of Y/X gametologs from Anolis and the Fiji banded iguana to their one-to-one orthologous sequences from Pogona, Elaphe guttata snake, chicken, zebra finch, alligator, Chinese soft-shell turtle, Trachemys scripta turtle, mouse, human, and Xenopus tropicalis using PRANK (Loytynoja and Goldman 2005). One-to-one orthologous sequences were obtained from the Ensembl database (version 81; www.ensembl.org) and the Reptilian Transcriptomes v1.0 and v2.0 database (Tzika et al. 2011, 2015). We used three phylogenetic methods to assess the origin of seven Y/X gametologs and the concatenated stratum 1 gene set (RPL6 and PPP1CC): (1) A Bayesian-based phylogenetic reconstruction using MetaPIGA (Helaers and Milinkovitch 2010) with the GTR model but without invariable sites, 110 replicates with 200 iterations each, trees sampled every five generations. (2) A Bayesian-based reconstruction using MrBayes (Ronquist et al. 2012) with the GTR model, gamma distribution, and invariable sites, 106 generations, sampled every 1000 generations until the average standard deviation of split frequencies converged and was below 0.01 and the PSRF was close to 1 for all parameters. (3) A phylogenetic tree and bootstrapping values using PhyML (Guindon et al. 2010) (parameters: -i gene_file.phy -d nt -q -f m -t e -v e -a e -b 1000 --use median) with estimated site variation, gamma distribution, and 1000 bootstrap replicates. Individual phylogenetic reconstructions for XY gametologs and 1:1 orthologous genes are shown in Supplemental Figures S2–S4.
Nonsynonymous and synonymous substitution analyses
Pairwise alignments of coding sequences of XY gametologs were obtained using PRANK (Loytynoja and Goldman 2005) based on encoded amino acid sequences. dS values were then calculated using codeml (pair-wise option) as implemented in the PAML package (Yang 1997). To assess the age at which the sex chromosome system originated, we followed a previous procedure (Cortez et al. 2014). Specifically, we used the codeml free-ratio model, as implemented in the PAML package (Yang 1997); for the concatenated sequence alignment of stratum 1 genes (RPL6 and PPP1CC), we used Y/X gametologs from Anolis and the Fiji banded iguana and the 1:1 orthologous sequences from the aforementioned tetrapod species. We used the species tree as a reference and applied a bootstrapping method to run the codeml free-ratio model for 100 replicates. We collected the median branch lengths just before (split of E. guttata lineage) and after the stratification (Anolis/iguana split for the Y branches and Pogona split plus Anolis/iguana split for the X branches). The values after the stratification were adjusted (Cortez et al. 2014) because Y sequences accumulate more mutations per generation due to the generally higher mutation rates in males (Wilson Sayres and Makova 2011). To obtain an age estimate of the sex chromosome origin, we compared the branch length before the stratification (i.e., separation of Y and X clades), the adjusted branch lengths after the stratification (Y and X branches have the same length) and the total time that passed between species divergence times; that is, the time that passed between the snake split (median value of 167 million years ago [mya]) and the Pogona split (median value of 157 mya) corresponds to 10 million years. The median species divergence times were retrieved from the TimeTree database (www.timetree.org) (Hedges et al. 2006). TimeTree also provides 95% confident intervals for each divergence time. Therefore, in order to obtain the 95% confident intervals for the sex chromosome origin, we repeated the calculations, but instead of using the median values for the speciation events, we used the maximum and minimum values from the 95% confident intervals: snake split (maximum of 179 mya and minimum of 155 mya) and Pogona split (maximum of 177 mya and minimum of 138 mya).
RNA-seq read mapping and expression analyses
All RNA-seq reads were mapped to genomes from version 77 of Ensembl (Yates et al. 2016) using the GSNAP short-read alignment program (Wu and Nacu 2010). Gene expression estimates of protein-coding genes (fragments per kilobase of transcript per million mapped reads, FPKM) were performed using Cufflinks (v2.2.1) (Trapnell et al. 2013). In case multiple samples from different male/female individuals were available for a given tissue, the median expression was used. Normalization across samples was performed using a previous median scaling procedure (Brawand et al. 2011). The tissue specificity index (TSI) for a given gene was calculated as the expression level (FPKM) in the tissue with the highest expression level divided by the sum of expressions values in all tissues (Julien et al. 2012).
Assessment of allelic expression
For each data set type (i.e., bulk tissue and single-cell), SNPs were assessed in DNA-seq libraries that match the female individuals for which RNA-seq data were produced. Specifically, Bowtie (v1.1.2) was used to align the reads in unpaired mode after removal of low quality reads (Q < 33). Duplicate reads were removed with Picard-tools (v2.6.0). The resulting BAM file was used to call SNPs with SAMtools (v1.3) and BCFtools (v1.3.1). Only SNPs with a genomic coverage of at least five reads and with a ratio of reads supporting the alternative allele between 0.2 and 0.8 were selected. The selected SNPs were then used to compute the expression of different alleles in the X Chromosome. A minimum of five RNA-seq reads covering the SNPs were required in order to include the allele in the distribution. Biallelic SNPs were called using SAMtools and BCFtools call (-m option).
ABPP1 expression profile in Pogona
The genome sequence of Pogona, the corresponding gene annotations, and RNA-seq data from male and female somatic tissues (brain, heart, kidney, liver, and lung) were obtained from the Pogona genome project (Georges et al. 2015). RNA-seq reads from male and female tissues were mapped to the reference genome using HISAT2 (v2.0.2) (Kim et al. 2015). Gene expression estimates and FPKM normalization were performed using Cufflinks (v2.2.1) (Trapnell et al. 2013).
Global expression level comparisons
Comparisons of expression levels between genes on current/ancestral and male/female chromosomes were carried out as previously described (Julien et al. 2012; Cortez et al. 2014). Inferred ancestral expression output values were calculated per single gene copy/allele; that is, the obtained values were divided by 2.
ChiP-seq (H4K16ac) data analyses
All paired-end reads, for the immunoprecipitated and for the input samples, were quality-checked using FastQC (v0.11.5) (http://www.bioinformatics.babraham.ac.uk/projects/fastqc); only positions with a minimum Phred score of 25 were retained. Filtered reads were then mapped to the A. carolinensis reference genome (Ensembl v77) using BWA (v0.7.15) (Li and Durbin 2009). The resulting BAM files were used to obtain coverage estimates (FPKM) along the genome for both the input and the immunoprecipitated samples over a window size of 50 bp; input samples were normalized for GC content using a dedicated protocol (Benjamini and Speed 2012). In order to allow comparisons between different samples and across genomic features (e.g., autosomes vs. sex chromosome, intergenic vs. genic regions), the data were normalized by library size, and all samples were input-normalized by dividing the read counts of ChIPed samples by the read counts in the corresponding input over a window size of 50 bp; these analyses were performed using the stand-alone version of deepTools (v2.4.0) (Ramirez et al. 2016). Statistical analyses and data visualization were achieved using custom scripts in R (v3.3.2) (R Core Team 2016).
Identification of male-biased genes
Male-biased genes were defined as genes having expression levels of FPKM > 5 and consistently showing at least 1.5 times higher expression levels in males than in females in all somatic organs.
Scripts
All the scripts used to produce the present results are available as Supplemental Material (Supplemental_Scripts.zip).
Data access
Raw and processed data sets from this study have been submitted to the NCBI Gene Expression Omnibus (GEO; http://www.ncbi.nlm.nih.gov/geo/) under accession numbers GSE97367 (bulk-tissue RNA-seq, DNA-seq, and ChIP-seq) and GSE100976 (single-cell RNA-seq and DNA-seq) and are part of the BioProject (https://www.ncbi.nlm.nih.gov/bioproject/) PRJNA381064. The Sanger traces of the PCR products used for sexing the embryonic samples are available as supplemental files (Supplemental_Data.zip).
Supplementary Material
Acknowledgments
We thank K. Harshman and the Lausanne Genomics Technology Facility for high-throughput sequencing support; Edinburgh Genomics (University of Edinburgh) for sequencing of ChIP-seq libraries; I. Xenarios and the Vital-IT computational facility for computational support; the Kaessmann group for helpful discussions; and the anonymous reviewers for their insightful and helpful comments on this work. We also acknowledge computational support by the state of Baden-Württemberg through bwHPC and the German Research Foundation (DFG) through grant INST 35/1134-1 FUGG; in particular, our computational work on the bwForCluster was supported by M. Baumann and S. Richling from the Heidelberg University Computational Center (Universitätsrechenzentrum, URZ). P.T. acknowledges generous support from Prof. Cliff Tabin. The overall research project was supported by grants from the European Research Council (Grant: 615253, OntoTransEvol) and Swiss National Science Foundation (Grants: 146474) to H.K., as well as the CONACyT-SEP Basic Science grant (No. 254240) awarded to D.C.
Footnotes
[Supplemental material is available for this article.]
Article published online before print. Article, supplemental material, and publication date are at http://www.genome.org/cgi/doi/10.1101/gr.223727.117.
Freely available online through the Genome Research Open Access option.
References
- Akagi T, Henry IM, Tao R, Comai L. 2014. Plant genetics. A Y-chromosome-encoded small RNA acts as a sex determinant in persimmons. Science 346: 646–650. [DOI] [PubMed] [Google Scholar]
- Alfoldi J, Di Palma F, Grabherr M, Williams C, Kong L, Mauceli E, Russell P, Lowe CB, Glor RE, Jaffe JD, et al. 2011. The genome of the green anole lizard and a comparative analysis with birds and mammals. Nature 477: 587–591. [DOI] [PMC free article] [PubMed] [Google Scholar]
- Altschul SF, Gish W, Miller W, Myers EW, Lipman DJ. 1990. Basic local alignment search tool. J Mol Biol 215: 403–410. [DOI] [PubMed] [Google Scholar]
- Bachtrog D. 2013. Y-chromosome evolution: emerging insights into processes of Y-chromosome degeneration. Nat Rev Genet 14: 113–124. [DOI] [PMC free article] [PubMed] [Google Scholar]
- Bachtrog D, Mank JE, Peichel CL, Kirkpatrick M, Otto SP, Ashman TL, Hahn MW, Kitano J, Mayrose I, Ming R, et al. 2014. Sex determination: why so many ways of doing it? PLoS Biol 12: e1001899. [DOI] [PMC free article] [PubMed] [Google Scholar]
- Bellott DW, Hughes JF, Skaletsky H, Brown LG, Pyntikova T, Cho TJ, Koutseva N, Zaghlul S, Graves T, Rock S, et al. 2014. Mammalian Y chromosomes retain widely expressed dosage-sensitive regulators. Nature 508: 494–499. [DOI] [PMC free article] [PubMed] [Google Scholar]
- Benjamini Y, Speed TP. 2012. Summarizing and correcting the GC content bias in high-throughput sequencing. Nucleic Acids Res 40: e72. [DOI] [PMC free article] [PubMed] [Google Scholar]
- Brawand D, Soumillon M, Necsulea A, Julien P, Csárdi G, Harrigan P, Weier M, Liechti A, Aximu-Petri A, Kircher M, et al. 2011. The evolution of gene expression levels in mammalian organs. Nature 478: 343–348. [DOI] [PubMed] [Google Scholar]
- Carelli FN, Hayakawa T, Go Y, Imai H, Warnefors M, Kaessmann H. 2016. The life history of retrocopies illuminates the evolution of new mammalian genes. Genome Res 26: 301–314. [DOI] [PMC free article] [PubMed] [Google Scholar]
- Carvalho AB, Clark AG. 2013. Efficient identification of Y chromosome sequences in the human and Drosophila genomes. Genome Res 23: 1894–1907. [DOI] [PMC free article] [PubMed] [Google Scholar]
- Chen S, Zhang G, Shao C, Huang Q, Liu G, Zhang P, Song W, An N, Chalopin D, Volff JN, et al. 2014. Whole-genome sequence of a flatfish provides insights into ZW sex chromosome evolution and adaptation to a benthic lifestyle. Nat Genet 46: 253–260. [DOI] [PubMed] [Google Scholar]
- Conrad T, Akhtar A. 2012. Dosage compensation in Drosophila melanogaster: epigenetic fine-tuning of chromosome-wide transcription. Nat Rev Genet 13: 123–134. [DOI] [PubMed] [Google Scholar]
- Cortez D, Marin R, Toledo-Flores D, Froidevaux L, Liechti A, Waters PD, Grutzner F, Kaessmann H. 2014. Origins and functional evolution of Y chromosomes across mammals. Nature 508: 488–493. [DOI] [PubMed] [Google Scholar]
- Deng X, Hiatt JB, Nguyen DK, Ercan S, Sturgill D, Hillier LW, Schlesinger F, Davis CA, Reinke VJ, Gingeras TR, et al. 2011. Evidence for compensatory upregulation of expressed X-linked genes in mammals, Caenorhabditis elegans and Drosophila melanogaster. Nat Genet 43: 1179–1185. [DOI] [PMC free article] [PubMed] [Google Scholar]
- Dion MF, Altschuler SJ, Wu LF, Rando OJ. 2005. Genomic characterization reveals a simple histone H4 acetylation code. Proc Natl Acad Sci 102: 5501–5506. [DOI] [PMC free article] [PubMed] [Google Scholar]
- Eckalbar WL, Hutchins ED, Markov GJ, Allen AN, Corneveaux JJ, Lindblad-Toh K, Di Palma F, Alfoldi J, Huentelman MJ, Kusumi K. 2013. Genome reannotation of the lizard Anolis carolinensis based on 14 adult and embryonic deep transcriptomes. BMC Genomics 14: 49. [DOI] [PMC free article] [PubMed] [Google Scholar]
- Edgar RC. 2004. MUSCLE: multiple sequence alignment with high accuracy and high throughput. Nucleic Acids Res 32: 1792–1797. [DOI] [PMC free article] [PubMed] [Google Scholar]
- Ezaz T, Moritz B, Waters P, Marshall Graves JA, Georges A, Sarre SD. 2009. The ZW sex microchromosomes of an Australian dragon lizard share no homology with those of other reptiles or birds. Chromosome Res 17: 965–973. [DOI] [PubMed] [Google Scholar]
- Faucillion ML, Larsson J. 2015. Increased expression of X-linked genes in mammals is associated with a higher stability of transcripts and an increased ribosome density. Genome Biol Evol 7: 1039–1052. [DOI] [PMC free article] [PubMed] [Google Scholar]
- Foster JW, Graves JA. 1994. An SRY-related sequence on the marsupial X chromosome: implications for the evolution of the mammalian testis-determining gene. Proc Natl Acad Sci 91: 1927–1931. [DOI] [PMC free article] [PubMed] [Google Scholar]
- Gamble T, Zarkower D. 2014. Identification of sex-specific molecular markers using restriction site-associated DNA sequencing. Mol Ecol Resour 14: 902–913. [DOI] [PubMed] [Google Scholar]
- Gamble T, Geneva AJ, Glor RE, Zarkower D. 2014. Anolis sex chromosomes are derived from a single ancestral pair. Evolution 68: 1027–1041. [DOI] [PMC free article] [PubMed] [Google Scholar]
- Gamble T, Coryell J, Ezaz T, Lynch J, Scantlebury DP, Zarkower D. 2015. Restriction site-associated DNA sequencing (RAD-seq) reveals an extraordinary number of transitions among gecko sex-determining systems. Mol Biol Evol 32: 1296–1309. [DOI] [PubMed] [Google Scholar]
- Georges A, Li Q, Lian J, O'Meally D, Deakin J, Wang Z, Zhang P, Fujita M, Patel HR, Holleley CE, et al. 2015. High-coverage sequencing and annotated assembly of the genome of the Australian dragon lizard Pogona vitticeps. Gigascience 4: 45. [DOI] [PMC free article] [PubMed] [Google Scholar]
- Giovannotti M, Trifonov VA, Paoletti A, Kichigin IG, O'Brien PC, Kasai F, Giovagnoli G, Ng BL, Ruggeri P, Cerioni PN, et al. 2016. New insights into sex chromosome evolution in anole lizards (Reptilia, Dactyloidae). Chromosoma 126: 245–260. [DOI] [PubMed] [Google Scholar]
- Grabherr MG, Haas BJ, Yassour M, Levin JZ, Thompson DA, Amit I, Adiconis X, Fan L, Raychowdhury R, Zeng Q, et al. 2011. Full-length transcriptome assembly from RNA-Seq data without a reference genome. Nat Biotechnol 29: 644–652. [DOI] [PMC free article] [PubMed] [Google Scholar]
- Grant J, Mahadevaiah SK, Khil P, Sangrithi MN, Royo H, Duckworth J, McCarrey JR, VandeBerg JL, Renfree MB, Taylor W, et al. 2012. Rsx is a metatherian RNA with Xist-like properties in X-chromosome inactivation. Nature 487: 254–258. [DOI] [PMC free article] [PubMed] [Google Scholar]
- Graves JA. 2016. Evolution of vertebrate sex chromosomes and dosage compensation. Nat Rev Genet 17: 33–46. [DOI] [PubMed] [Google Scholar]
- Guindon S, Dufayard JF, Lefort V, Anisimova M, Hordijk W, Gascuel O. 2010. New algorithms and methods to estimate maximum-likelihood phylogenies: assessing the performance of PhyML 3.0. Syst Biol 59: 307–321. [DOI] [PubMed] [Google Scholar]
- Hedges SB, Dudley J, Kumar S. 2006. TimeTree: a public knowledge-base of divergence times among organisms. Bioinformatics 22: 2971–2972. [DOI] [PubMed] [Google Scholar]
- Helaers R, Milinkovitch MC. 2010. MetaPIGA v2.0: maximum likelihood large phylogeny estimation using the metapopulation genetic algorithm and other stochastic heuristics. BMC Bioinformatics 11: 379. [DOI] [PMC free article] [PubMed] [Google Scholar]
- Hilfiker A, Hilfiker-Kleiner D, Pannuti A, Lucchesi JC. 1997. mof, a putative acetyl transferase gene related to the Tip60 and MOZ human genes and to the SAS genes of yeast, is required for dosage compensation in Drosophila. EMBO J 16: 2054–2060. [DOI] [PMC free article] [PubMed] [Google Scholar]
- Hughes JF, Skaletsky H, Koutseva N, Pyntikova T, Page DC. 2015. Sex chromosome-to-autosome transposition events counter Y-chromosome gene loss in mammals. Genome Biol 16: 104. [DOI] [PMC free article] [PubMed] [Google Scholar]
- Julien P, Brawand D, Soumillon M, Necsulea A, Liechti A, Schutz F, Daish T, Grutzner F, Kaessmann H. 2012. Mechanisms and evolutionary patterns of mammalian and avian dosage compensation. PLoS Biol 10: e1001328. [DOI] [PMC free article] [PubMed] [Google Scholar]
- Kashimada K, Koopman P. 2010. Sry: the master switch in mammalian sex determination. Development 137: 3921–3930. [DOI] [PubMed] [Google Scholar]
- Kim D, Pertea G, Trapnell C, Pimentel H, Kelley R, Salzberg SL. 2013. TopHat2: accurate alignment of transcriptomes in the presence of insertions, deletions and gene fusions. Genome Biol 14: R36. [DOI] [PMC free article] [PubMed] [Google Scholar]
- Kim D, Langmead B, Salzberg SL. 2015. HISAT: a fast spliced aligner with low memory requirements. Nat Methods 12: 357–360. [DOI] [PMC free article] [PubMed] [Google Scholar]
- Langmead B, Salzberg SL. 2012. Fast gapped-read alignment with Bowtie 2. Nat Methods 9: 357–359. [DOI] [PMC free article] [PubMed] [Google Scholar]
- Li H, Durbin R. 2009. Fast and accurate short read alignment with Burrows–Wheeler transform. Bioinformatics 25: 1754–1760. [DOI] [PMC free article] [PubMed] [Google Scholar]
- Lin F, Xing K, Zhang J, He X. 2012. Expression reduction in mammalian X chromosome evolution refutes Ohno's hypothesis of dosage compensation. Proc Natl Acad Sci 109: 11752–11757. [DOI] [PMC free article] [PubMed] [Google Scholar]
- Loytynoja A, Goldman N. 2005. An algorithm for progressive multiple alignment of sequences with insertions. Proc Natl Acad Sci 102: 10557–10562. [DOI] [PMC free article] [PubMed] [Google Scholar]
- Mank JE. 2013. Sex chromosome dosage compensation: definitely not for everyone. Trends Genet 29: 677–683. [DOI] [PubMed] [Google Scholar]
- Necsulea A, Kaessmann H. 2014. Evolutionary dynamics of coding and non-coding transcriptomes. Nat Rev Genet 15: 734–748. [DOI] [PubMed] [Google Scholar]
- Necsulea A, Soumillon M, Warnefors M, Liechti A, Daish T, Zeller U, Baker JC, Grutzner F, Kaessmann H. 2014. The evolution of lncRNA repertoires and expression patterns in tetrapods. Nature 505: 635–640. [DOI] [PubMed] [Google Scholar]
- Nguyen DK, Disteche CM. 2006. Dosage compensation of the active X chromosome in mammals. Nat Genet 38: 47–53. [DOI] [PubMed] [Google Scholar]
- Ohno S. 1967. Sex chromosomes and sex-linked genes. Springer, Berlin. [Google Scholar]
- O'Meally D, Ezaz T, Georges A, Sarre SD, Graves JA. 2012. Are some chromosomes particularly good at sex? Insights from amniotes. Chromosome Res 20: 7–19. [DOI] [PubMed] [Google Scholar]
- Potrzebowski L, Vinckenbosch N, Marques AC, Chalmel F, Jegou B, Kaessmann H. 2008. Chromosomal gene movements reflect the recent origin and biology of therian sex chromosomes. PLoS Biol 6: e80. [DOI] [PMC free article] [PubMed] [Google Scholar]
- Pradeepa MM, Grimes GR, Kumar Y, Olley G, Taylor GC, Schneider R, Bickmore WA. 2016. Histone H3 globular domain acetylation identifies a new class of enhancers. Nat Genet 48: 681–686. [DOI] [PMC free article] [PubMed] [Google Scholar]
- R Core Team. 2016. R: a language and environment for statistical computing. R Foundation for Statistical Computing, Vienna, Austria: http://www.R-project.org/. [Google Scholar]
- Ramirez F, Ryan DP, Gruning B, Bhardwaj V, Kilpert F, Richter AS, Heyne S, Dundar F, Manke T. 2016. deepTools2: a next generation web server for deep-sequencing data analysis. Nucleic Acids Res 44: W160–W165. [DOI] [PMC free article] [PubMed] [Google Scholar]
- Ronquist F, Teslenko M, van der Mark P, Ayres DL, Darling A, Hohna S, Larget B, Liu L, Suchard MA, Huelsenbeck JP. 2012. MrBayes 3.2: efficient Bayesian phylogenetic inference and model choice across a large model space. Syst Biol 61: 539–542. [DOI] [PMC free article] [PubMed] [Google Scholar]
- Rovatsos M, Altmanova M, Pokorna M, Kratochvil L. 2014a. Conserved sex chromosomes across adaptively radiated Anolis lizards. Evolution 68: 2079–2085. [DOI] [PubMed] [Google Scholar]
- Rovatsos M, Altmanova M, Pokorna MJ, Kratochvil L. 2014b. Novel X-linked genes revealed by quantitative polymerase chain reaction in the green anole, Anolis carolinensis. G3 (Bethesda) 4: 2107–2113. [DOI] [PMC free article] [PubMed] [Google Scholar]
- Rovatsos M, Pokorna M, Altmanova M, Kratochvil L. 2014c. Cretaceous park of sex determination: sex chromosomes are conserved across iguanas. Biol Lett 10: 20131093. [DOI] [PMC free article] [PubMed] [Google Scholar]
- Rovatsos M, Vukic J, Altmanova M, Johnson Pokorna M, Moravec J, Kratochvil L. 2016. Conservation of sex chromosomes in lacertid lizards. Mol Ecol 25: 3120–3126. [DOI] [PubMed] [Google Scholar]
- Rupp SM, Webster TH, Olney KC, Hutchins ED, Kusumi K, Wilson Sayres MA. 2017. Evolution of dosage compensation in Anolis carolinensis, a reptile with XX/XY chromosomal sex determination. Genome Biol Evol 9: 231–240. [DOI] [PMC free article] [PubMed] [Google Scholar]
- Sanger TJ, Losos JB, Gibson-Brown JJ. 2008. A developmental staging series for the lizard genus Anolis: a new system for the integration of evolution, development, and ecology. J Morphol 269: 129–137. [DOI] [PubMed] [Google Scholar]
- Shogren-Knaak M, Ishii H, Sun JM, Pazin MJ, Davie JR, Peterson CL. 2006. Histone H4-K16 acetylation controls chromatin structure and protein interactions. Science 311: 844–847. [DOI] [PubMed] [Google Scholar]
- Stante M, Minopoli G, Passaro F, Raia M, Vecchio LD, Russo T. 2009. Fe65 is required for Tip60-directed histone H4 acetylation at DNA strand breaks. Proc Natl Acad Sci 106: 5093–5098. [DOI] [PMC free article] [PubMed] [Google Scholar]
- Taylor GC, Eskeland R, Hekimoglu-Balkan B, Pradeepa MM, Bickmore WA. 2013. H4K16 acetylation marks active genes and enhancers of embryonic stem cells, but does not alter chromatin compaction. Genome Res 23: 2053–2065. [DOI] [PMC free article] [PubMed] [Google Scholar]
- Trapnell C, Hendrickson DG, Sauvageau M, Goff L, Rinn JL, Pachter L. 2013. Differential analysis of gene regulation at transcript resolution with RNA-seq. Nat Biotechnol 31: 46–53. [DOI] [PMC free article] [PubMed] [Google Scholar]
- Turner JM. 2015. Meiotic silencing in mammals. Annu Rev Genet 49: 395–412. [DOI] [PubMed] [Google Scholar]
- Tzika AC, Helaers R, Schramm G, Milinkovitch MC. 2011. Reptilian-transcriptome v1.0, a glimpse in the brain transcriptome of five divergent Sauropsida lineages and the phylogenetic position of turtles. Evodevo 2: 19. [DOI] [PMC free article] [PubMed] [Google Scholar]
- Tzika AC, Ullate-Agote A, Grbic D, Milinkovitch MC. 2015. Reptilian transcriptomes v2.0: an extensive resource for Sauropsida genomics and transcriptomics. Genome Biol Evol 7: 1827–1841. [DOI] [PMC free article] [PubMed] [Google Scholar]
- Vicoso B, Bachtrog D. 2015. Numerous transitions of sex chromosomes in Diptera. PLoS Biol 13: e1002078. [DOI] [PMC free article] [PubMed] [Google Scholar]
- Vidal N, Hedges SB. 2009. The molecular evolutionary tree of lizards, snakes, and amphisbaenians. C R Biol 332: 129–139. [DOI] [PubMed] [Google Scholar]
- Wang Z, Pascual-Anaya J, Zadissa A, Li W, Niimura Y, Huang Z, Li C, White S, Xiong Z, Fang D, et al. 2013. The draft genomes of soft-shell turtle and green sea turtle yield insights into the development and evolution of the turtle-specific body plan. Nat Genet 45: 701–706. [DOI] [PMC free article] [PubMed] [Google Scholar]
- White MA, Kitano J, Peichel CL. 2015. Purifying selection maintains dosage-sensitive genes during degeneration of the threespine stickleback Y chromosome. Mol Biol Evol 32: 1981–1995. [DOI] [PMC free article] [PubMed] [Google Scholar]
- Wilson Sayres MA, Makova KD. 2011. Genome analyses substantiate male mutation bias in many species. Bioessays 33: 938–945. [DOI] [PMC free article] [PubMed] [Google Scholar]
- Wu TD, Nacu S. 2010. Fast and SNP-tolerant detection of complex variants and splicing in short reads. Bioinformatics 26: 873–881. [DOI] [PMC free article] [PubMed] [Google Scholar]
- Xiong Y, Chen X, Chen Z, Wang X, Shi S, Wang X, Zhang J, He X. 2010. RNA sequencing shows no dosage compensation of the active X-chromosome. Nat Genet 42: 1043–1047. [DOI] [PubMed] [Google Scholar]
- Yang Z. 1997. PAML: a program package for phylogenetic analysis by maximum likelihood. Comput Appl Biosci 13: 555–556. [DOI] [PubMed] [Google Scholar]
- Yates A, Akanni W, Amode MR, Barrell D, Billis K, Carvalho-Silva D, Cummins C, Clapham P, Fitzgerald S, Gil L, et al. 2016. Ensembl 2016. Nucleic Acids Res 44: D710–D716. [DOI] [PMC free article] [PubMed] [Google Scholar]
- Yin W, Wang ZJ, Li QY, Lian JM, Zhou Y, Lu BZ, Jin LJ, Qiu PX, Zhang P, Zhu WB, et al. 2016. Evolutionary trajectories of snake genes and genomes revealed by comparative analyses of five-pacer viper. Nat Commun 7: 13107. [DOI] [PMC free article] [PubMed] [Google Scholar]
- Zhou Q, Zhang J, Bachtrog D, An N, Huang Q, Jarvis ED, Gilbert MT, Zhang G. 2014. Complex evolutionary trajectories of sex chromosomes across bird taxa. Science 346: 1246338. [DOI] [PMC free article] [PubMed] [Google Scholar]
Associated Data
This section collects any data citations, data availability statements, or supplementary materials included in this article.