

Abstract
Inflammation plays a central role in the etiology of diabetic nephropathy, a global health issue. We observed a significant reduction in the renal expression of fibroblast growth factor 1, a known mitogen and insulin sensitizer, in patients with diabetic nephropathy and in mouse models implying that fibroblast growth factor 1 possesses beneficial anti-inflammatory and renoprotective activities in vivo. To test this possibility, we investigated the effects of chronic intraperitoneal administration of fibroblast growth factor 1 into both the streptozotocin-induced type 1 diabetes and db/db type 2 diabetes models. Indeed, recombinant fibroblast growth factor 1 significantly suppressed renal inflammation (i.e., cytokines, macrophage infiltration), glomerular and tubular damage, and renal dysfunction in both type 1 and type 2 diabetes mice. Fibroblast growth factor 1 was able to correct the elevated blood glucose levels in type 2 but not in type 1 diabetic mice, suggesting that the anti-inflammatory effect of fibroblast growth factor 1 was independent of its glucose-lowering activity. The mechanistic study demonstrated that fibroblast growth factor 1–mediated inhibition of the renal inflammation in vivo was accompanied by attenuation of the nuclear factor κB and c-Jun N-terminal kinase signaling pathways, further validated in vitro using cultured glomerular mesangial cells and podocytes. Thus, fibroblast growth factor 1 holds great promise for developing new treatments for diabetic nephropathy through countering inflammatory signaling cascades in injured renal tissue.
Keywords: cytokines, diabetic nephropathy, fibrosis, inflammation, mesangial cells
Diabetes mellitus has become a worldwide public health problem. Uncontrolled hyperglycemia in patients with diabetes can lead to a host of diabetic complications including diabetic nephropathy (DN), retinopathy, and neuropathy. DN is a serious and common complication of type 1 diabetes (T1D) and type 2 diabetes (T2D) and leads to end-stage renal disease in as many as 30% of individuals with diabetes.1,2 DN is characterized by glomerular hypertrophy, thickened basement membrane, podocytopenia, increased extracellular matrix protein synthesis/deposition, and fibrosis.1,3,4 The etiology of DN is multifactorial, with hyperglycemia, oxidative stress, advanced glycation end products, and angiotensin II as leading factors, each of which can activate nuclear factor-κB (NF-κB), the master transcription factor controlling the expression of a host of proinflammatory genes.4–8 NF-κB regulates expression of a host of adhesion molecules, proinflammatory cytokines, and chemokines that are associated with chronic inflammation, fibrosis, and tissue remodeling in DN.8,9 In addition, evidence indicates that stress-activated protein kinases (i.e., c-Jun NH2-terminal kinase [JNK] and p38) of the mitogen-activated protein kinase family may contribute significantly to DN progression.7,9,10 In particular, JNK activation is correlated with macrophage interstitial accumulation, fibrosis, and loss of renal function in human subjects with DN and in a rat model of kidney obstruction.11–13 JNK activation is induced by various factors of the diabetic milieu, including hyperglycemia, advanced glycation end-products, angiotensin II, oxidative stress, and proinflammatory cytokines.14–16 Hence, upregulation of proinflammatory signaling pathways is considered to be a key contributor to the progression of DN.7,9
As an autocrine/paracrine regulator, fibroblast growth factor 1 (FGF1) is known to be βmitogenic on cells from a variety of tissue origins including the liver, vasculature, and skin.17–19 Recombinant human FGF1 has been clinically used to facilitate wound/burn repair and ulcer regeneration for decades. Due to its classic mitogenic activity, FGF1 has also therapeutic potential for cardiovascular disorders in coronary artery bypass graft surgery, ischemia, and nerve repair.20–22 Recently, Jonker et al.23 discovered an unexpected metabolic role for FGF1 as a critical transducer of peroxisome proliferator–activated receptor-γ signaling that mediates the proper coupling of nutrient storage to adaptive remodeling of adipose tissue. In a follow-up study, we showed that administration of exogenous FGF1 stimulates glucose uptake in an insulin-dependent fashion and suppresses the hepatic production of glucose to achieve whole-body insulin sensitization in a mouse model of T2D.24 Moreover, FGF1 administration suppresses plasma levels of adrenocorticotropic hormone and corticosterone, reducing lipolysis and hepatic glucose production in a rat model of T1D.25 These findings indicate that FGF1, in addition to its mitogenic activity, is capable of impinging on multiple pathways mediating homeostatic control of normal glycemia.
Several reports have previously implicated FGF1 in kidney pathology.26–28 Importantly, with relevance to our study, FGF1 was shown to be downregulated in renal tissue from diabetic subjects.27 Suh et al.24 observed that long-term treatment of ob/ob mice with FGF1 decreased serum levels of several inflammatory cytokines, including eotaxin, keratinocyte chemoattractant, macrophage inflammatory protein-1β, and interleukin (IL)-3. These findings suggest that FGF1 may have the potential to reduce the severity of inflammatory injury of DN; however, it remains unclear whether the anti-inflammatory effects of FGF1 are dependent on its glucose-lowering capability.
In this study, we investigated the hypothesis that FGF1 can attenuate the development of DN by treating mouse models of T2D (db/db) and T1D with recombinant human FGF1. Our findings indicated that FGF1 significantly reduced renal inflammation, morphologic damage, renal dysfunction, as well as blood glucose levels in T2D mice. Unexpectedly, FGF1 also significantly prevented the renal inflammation and dysfunction, but did not correct hyperglycemia in T1D mice. To our knowledge, this finding is the first direct evidence of the protective effects of FGF1 on DN.
RESULTS
Endogenous levels of FGF1 in diabetic human subjects and mice
Reduced levels of endogenous FGF127 and FGF229 have been previously correlated with disease progression in human T2D and T1D patients. Consistent with the previous literature, we also found that the serum FGF1 concentration (ng/ml) in T2D and T1D human subjects were, respectively, ~45% and ~20% lower than that in the control nondiabetic group (Figure 1a and c). We further tested the serum and kidney tissue levels of FGF1 in T2D and T1D mice. The results showed that the serum FGF1 concentration (ng/ml) in T2D and T1D mice was significantly reduced compared with the nondiabetic control, which is consistent with the observation in the human subjects (Figure 1b and d). Immunofluorescent imaging of renal tissue from T2D and T1D mice also showed reductions in FGF1 expression in both glomeruli and tubules relative to wild-type mice (Figure 1e and f), which was further confirmed by the Western blot analysis (Figure 1g–j). To find out whether the reductions in FGF1 expression is secondary to the failing kidney function, we next measured the serum FGF1 levels of experimental mice at an early stage of diabetes. The data showed that the serum FGF1 levels in both db/db (7 weeks of age) and streptozotocin (STZ)-induced T1D mice (4 weeks after STZ induction) were significantly lower than those in the control nondiabetic group (Supplementary Figure S1A and B). We next carried out immunofluorescent double-staining using FGF1 antibody and cell-type specific markers to identify FGF1-expressing renal cell types in normal C57L/B6 mice. As shown in Supplementary Figure S2A and B, FGF1 expression was detected in 2 major renal cells including smooth muscle actin–positive mesangial cells and Wilms tumor 1–positive podocytes in normal mice. Compared with the normal C57L/B6 mice, in STZ-induced diabetic mice, FGF1 expression was reduced in both mesangial cells and podocytes. However, FGF1 expression was markedly low in the tubular cells of both normal and STZ-induced diabetic mice (Supplementary Figure S2C). In addition, FGF1 was not observed in the infiltrating macrophages in both normal and STZ-induced diabetic mice (Supplementary Figure S2D). The in vivo observations were thus validated in vitro using mesangial cells (SV40) and conditionally immortalized mouse podocytes that were exposed to high glucose (HG). As shown in Supplementary Figure S3, HG incubation for 3 hours significantly inhibited FGF1 expression in these 2 cell lines, consistent with our in vivo results (Supplementary Figure S2A and B).
Figure 1. Endogenous levels of FGF1 in diabetic human subjects and mice.
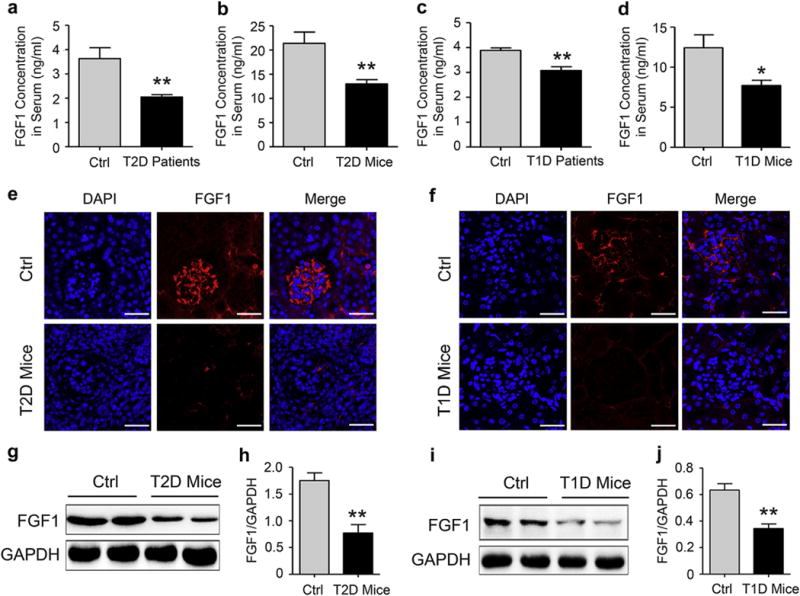
(a) FGF1 concentration in human serum collected from 11 normal human subjects and 6 human subjects with T2D. Data are presented as the mean ± SEM; **P < 0.01 versus normal human subjects. (b) FGF1 concentration in mouse serum from 20-week-old db/m (Ctrl) and db/db (T2D) mice. Data are presented as the mean ± SEM; **P < 0.01 versus Ctrl; N = 9. (c) FGF1 concentration in human serum collected from 7 healthy human subjects and 3 human subjects with T1D. Data are presented as the mean ± SEM; **P < 0.01 versus normal human subjects. (d) FGF1 concentration in mouse serum from 18-week-old C57BL/6 mice (Ctrl) and mice with T1D induced by treatment with STZ for 13 weeks. Data are presented as the mean ± SEM; *P < 0.05 versus Ctrl; N = 9. (e,f) Immunofluorescent detection (red) of FGF1 in kidney tissue isolated from 20-week-old db/m Ctrl and db/db T2D mice (e), normal C57BL/6 mice, and mice with T1D induced by treatment with STZ for 13 weeks (f); shown are representative 6 mice from each group. Bar = 100 μm. (g,h) Representative Western blot analysis and densitometric quantification of FGF1 expression in renal tissue from 20-week-old db/m and db/db mice; data are normalized to GAPDH and presented as mean ± SEM; **P < 0.01 versus the db/m group; N = 6. (i,j) Representative Western blot analysis and densitometric quantification of FGF1 in kidney tissue from normal C57BL/6 mice and mice with T1D induced by treatment with STZ for 13 weeks; data are normalized to GAPDH and presented as mean ± SEM; **P < 0.01 versus normal Ctrl group; N = 6. Ctrl, control; DAPI, 4′,6-diamidino-2-phenylindole; FGF1, fibroblast growth factor 1; GAPDH, glyceraldehyde-3-phosphate dehydrogenase; STZ, streptozotocin; T1D, type 1 diabetes; T2D, type 2 diabetes. To optimize viewing of this image, please see the online version of this article at www.kidney-international.org.
FGF1 prevents DN in db/db T2D mice
Potential protective effects of FGF1 on T2D-related kidney injury were evaluated using a treatment protocol (Figure 2a) in which FGF1 was administered by i.p. injection (0.5 mg/kg body weight) to db/db T2D mice for 8 weeks. The db/db T2D mice had significantly increased blood glucose compared with the control db/m mice (Figure 2b). Consistent with the previous findings,24 FGF1 significantly reduced blood glucose levels in db/db mice (Figure 2b). We tested the level of FGF1 in kidneys of diabetic mice with or without FGF1 treatment. As expected, FGF1 treatment enhanced the level of FGF1 in kidneys of db/db mice, and the renal FGF1 level in FGF1-treated diabetic mice was similar to that in control mice (Supplementary Figure S4A and B). Because albuminuria reflects renal dysfunction at the early stage of DN,30 we measured urinary excretion of albumin levels after treatment for 8 weeks. As shown in Figure 2c, urinary albumin excretion was markedly increased in db/db mice compared with nondiabetic db/m mice, whereas FGF1 treatment significantly decreased the urinary albumin excretion. In addition, FGF1 treatment resulted in minimal changes in body weight (Figure 2d), but significantly reversed the increased mass of kidney in db/db mice (Figure 2e). Serum creatinine and blood urea nitrogen are another 2 hallmarks of renal injury.31 The mean serum creatinine and blood urea nitrogen level of the db/db group was higher than that of the db/m group; however, this diabetes-induced increase in serum creatinine and blood urea nitrogen was significantly attenuated in the FGF1-treated db/db group (Figure 2f and g).
Figure 2. FGF1 prevents DN in db/db T2D mice.
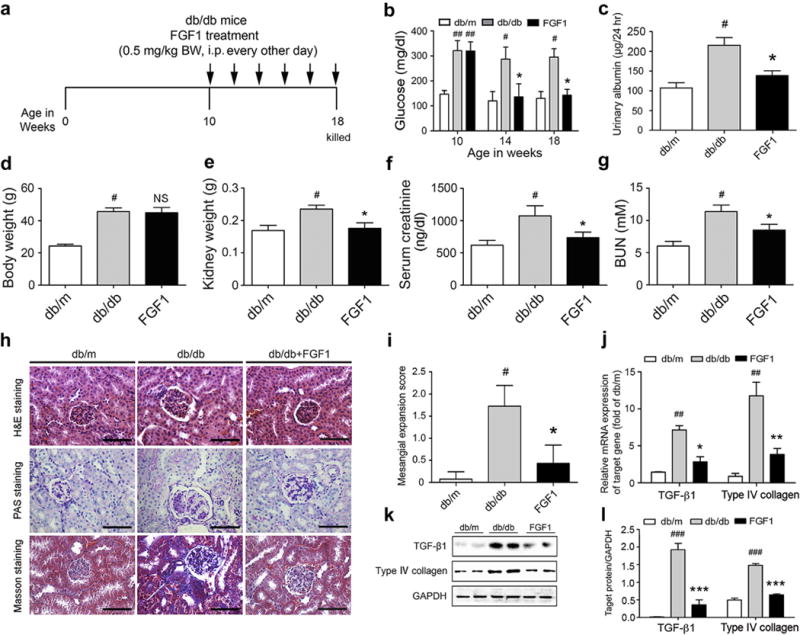
(a) FGF1 treatment protocol for db/db mice. Arrows indicate when mice received i.p. injections of vehicle or FGF1 (0.5 mg/kg BW) for 8 weeks and then were killed at 18 weeks for study. (b,c) Blood glucose level (nonfasted) measured weekly and by 24-hour urinary albumin excretion from db/m, db/db, and db/db+FGF1 groups. The body weight (d), kidney weight (e), serum creatinine (f), and BUN (g) in mice from db/m (control), db/db (T2D), FGF1 (db/db+FGF1) groups. Mice were i.p. injected with 0.5 mg/kg of FGF1 or with physiologic saline every other day for 8 weeks and evaluated for biometric and biochemical parameters. (h) Representative image of renal tissue stained with H&E, PAS (indicating glycogen) for evaluation of mesangial expansion, and Masson trichrome for type IV collagen. Bar = 100 μm. (i) The glomerular mesangial expansion score determined from histology sections shown in (h). (j) Gene expression of TGF-β1 and type IV collagen in renal tissues of db/m, db/db, and db/db+FGF1groups. (k) Western blot analysis of TGF-β1 and type IV collagen in renal tissue of db/m, db/db, and db/db+FGF1 mice. GAPDH expression was used for normalization of protein loading. (l) Quantification of Western blot by densitometric analysis; db/m, db/db, and db/db+FGF1 groups. (b-l) Data are shown as the mean ± SEM; #P < 0.05, ## P < 0.01 and ###P < 0.001 versus db/m control; *P < 0.05, **P < 0.01, and ***P < 0.001 versus db/db mice (N = 7–9). BUN, blood urea nitrogen; BW, body weight; DN, diabetic nephropathy; FGF1, fibroblast growth factor 1; GAPDH, glyceraldehyde-3-phosphate dehydrogenase; H&E, hematoxylin and eosin; NS, not significant; PAS, periodic acid–Schiff; T2D, type 2 diabetes; TGF-β1, transforming growth factor β. To optimize viewing of this image, please see the online version of this article at www.kidney-international.org.
Hematoxylin and eosin and polysaccharide matrix deposition (periodic acid–Schiff) staining demonstrated that, compared with the db/m mice, the db/db mice had notable glomerular hypertrophy and mesangial matrix expansion, whereas the mesangial expansion and hypertrophic changes were markedly reduced in FGF1 treatment groups (Figure 2h and i). Masson trichrome (blue) revealed significant increases in renal fibrosis in db/db mice, whereas these renal changes were not observed in FGF1-treated db/db mice (Figure 2h and Supplementary Figure S5A). The electron microscope images also showed that FGF1 treatment prevented diabetes-induced glomerular injury, such as disruption of podocyte foot processes and basement membrane thickening (Supplementary Figure S5C and E). Consistent with our histologic findings, the mRNA expression levels of the profibrotic molecules transforming growth factor (TGF) β1 and type IV collagen were significantly elevated in the kidneys of db/db mice compared with db/m control mice; however, FGF1 treatment prevented these increases (Figure 2j). Moreover, FGF1 treatment induced parallel decreases in the protein expression of the profibrotic markers in renal tissue (Figure 2k and l).
FGF1 prevents DN in STZ-induced T1D mice
Next, we investigated the effects of FGF1 on DN in STZ-induced T1D mice that were treated with FGF1 for 3 months according to the treatment protocol (Figure 3a). Results showed that a significantly increased level of blood glucose developed in the mice with STZ induction, indicating that in the model of T1D (Figure 3b), however, FGF1 treatment did not reduce the elevated blood glucose level in the T1D mice (Figure 3b), consistent with previous report.24 Similar to db/db mice, FGF1 treatment compensates for the decreased FGF1 level in the STZ-induced diabetic kidney (Supplementary Figure S4C and D). Similarly, FGF1 was able to decrease the T1D-induced elevated urinary albumin level (Figure 3c), kidney-body weight ratio, and serum creatinine and blood urea nitrogen levels (Figure 3d–f). Hematoxylin and eosin staining of kidney tissue from STZ-induced T1D mice showed pathologic changes in glomeruli (Figure 3g), indicative of mesangial expansion (Figure 3h), accompanied by increased periodic acid–Schiff and renal fibrosis (Masson trichrome stain) (Figure 3g and Supplementary Figure S5B). However, in T1D mice treated with FGF1, these STZ-induced histopathologic alterations were significantly reduced (Figure 3g and h and Supplementary Figure S5B). Electron microscopic evaluation of glomeruli from the T1D mouse kidney indicated similar ultrastructural podocytic disruptions and basement membrane thickening, as observed in the T2D mouse kidney tissue, and FGF1 treatment prevented these ultrastructural changes (Supplementary Figure S5D and F). Similar to findings from T2D mice, increased mRNA and protein levels of the profibrotic markers TGF-β1 and collagen IV were observed in kidney tissue from T1D mice, but these increases were significantly decreased by FGF1 treatment (Figure 3i–k).
Figure 3. FGF1 prevents DN in STZ-induced T1D mice.
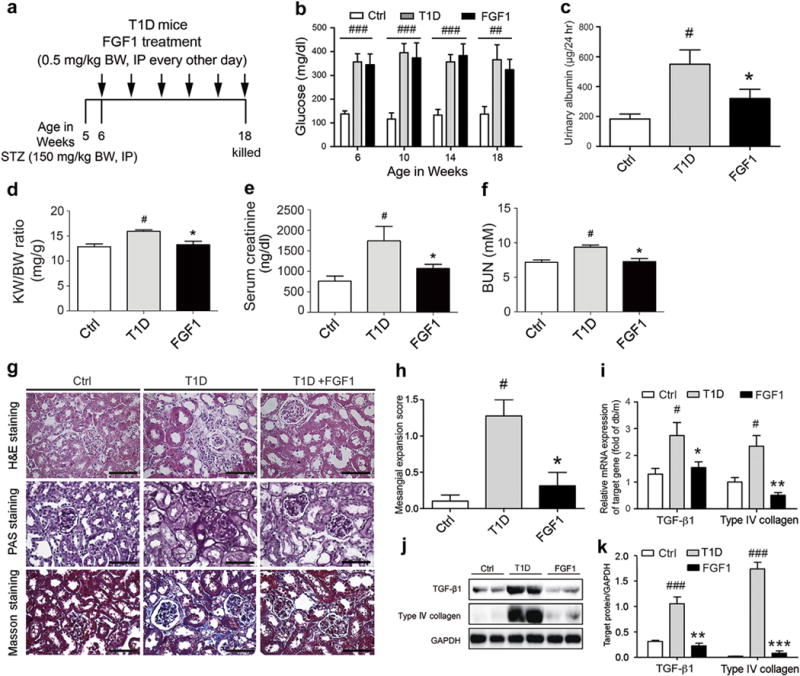
(a) FGF1 treatment protocol for mice with T1D. Arrows indicate that mice received i.p. injections of vehicle or FGF1 (0.5 mg/kg BW) for 12 weeks and then were killed at 18 weeks for study. (b,c) Blood glucose level (nonfasted) measured weekly and 24-hour urinary albumin excretion from the normal control (Ctrl), T1D, and T1D+FGF1 groups. The kidney-BW ratio (d), serum creatinine (e), and BUN (f) in mice from the Ctrl, T1D, and FGF1 (T1D+FGF1) groups. Mice received i.p. injections of 0.5 mg/kg of FGF1 or physiologic saline every other day for 12 weeks and were evaluated for biometric and biochemical parameters. Data are shown as the mean ± SEM; #P < 0.05 versus vehicle control; *P < 0.05 versus T1D mice (N = 7–9). (g) Representative images of renal tissue stained with H&E, PAS (indicating glycogen) for evaluation of mesangial expansion, and Masson trichrome for type IV collagen. Bar 100 = μm. (h) The glomerular mesangial expansion score determined from histology sections. (i) Gene expression of transforming growth factor β1 and type IV collagen in renal tissue from the Ctrl, T1D, and T1D+FGF1 groups. (j) Western blot analysis of TGF-β1 and type IV collagen in renal tissue from the Ctrl, T1D, and T1D+FGF1 groups. GAPDH expression was used for normalization of protein loading. (k) Quantification of Western blot by densitometric analysis. (b-k) Data are shown as the mean ± SEM; #P < 0.05, ##P < 0.01, and ###P < 0.001 versus Ctrl; *P < 0.05, **P < 0.01, and ***P < 0.001 versus T1D mice (N = 7–9). BUN, blood urea nitrogen; BW, body weight; Ctrl, control; FGF1, fibroblast growth factor 1; GAPDH, glyceraldehyde-3-phosphate dehydrogenase; H&E, hematoxylin and eosin; KW, kidney weight; PAS, periodic acid–Schiff; STZ, streptozotocin; T1D, type 1 diabetes; TGF-1β, transforming growth factor 1β. To optimize viewing of this image, please see the online version of this article at www.kidney-international.org.
In summary, FGF1 exhibited comparable abilities in attenuating renal tissue injury in both T1D and T2D mouse models, but could only normalize high blood glucose levels in T2D mice. These results indicated that FGF1 likely ameliorates the DN via a mechanism independent of its insulin-sensitizing effects.
FGF1 prevents diabetes-induced renal inflammation in both T1D and T2D
Inflammation is believed to be a crucial factor in the pathogenesis of DN.9 We investigated the hypothesis that the protective action of FGF1 against DN is attributed to its anti-inflammatory capability. Consistent with previous reports,9,24 our findings indicated that the db/db (T2D) mice exhibited high levels of TNF-β and IL-6 in serum protein and renal tissue content of mRNA, whereas FGF1 treatment significantly reduced the levels of these inflammatory mediators (Figure 4a–d). Moreover, protein and mRNA expression levels of plasminogen activator inhibitor-1 and monocyte chemotactic protein-1 were significantly elevated in the kidney tissue of db/db mice compared with db/m control mice, whereas this increased expression of inflammatory mediators was markedly inhibited by FGF1 (Supplementary Figure S6A and B). Immunohistochemical stain (Figure 4e) and Western blot analysis (Figure 4f) indicated that FGF1 effectively prevented increases in F4/80+ macrophage infiltration and CD68 protein expression in the renal tissue of db/db mice. The transcriptional factor NF-κB is a master regulator of inflammation, controlling the expression of hundreds of proinflammatory genes and playing a fundamental role in innate immune and inflammation.32 We determined the regulation by FGF1 on the nuclear translocation of the NF-κB p65 subunit, which reflects NF-κ B activation.33 Compared with the normal control, the nuclear p65 protein level was increased in renal tissue of db/db mice, whereas FGF1 administration markedly reduced this increased nuclear translocation (Figure 4g). The c-Jun N-terminal kinases are other key regulators of inflammation and are important upstream regulators of transcription factors in a variety of cell types.34,35 Therefore, we examined whether FGF1 treatment modulates JNK activity in diabetic mice. In renal tissue of db/db mice, JNK phosphorylation (indicating activation) was increased; however, FGF1 treatment prevented increased JNK phosphorylation (Figure 4g).
Figure 4. FGF1 prevents diabetes-induced renal inflammation in both T2D and T1D.
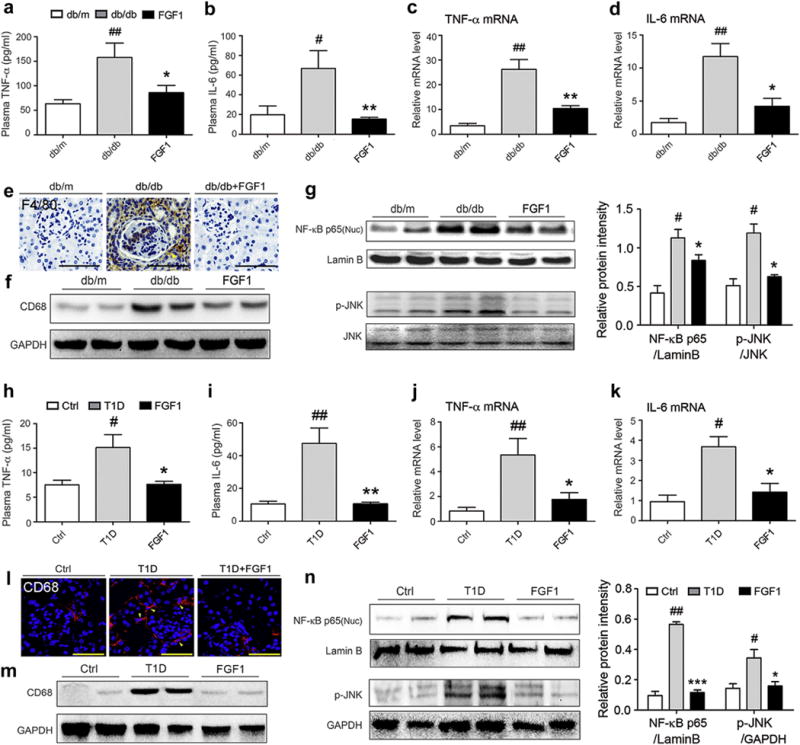
(a,b) Plasma concentrations of inflammatory cytokines IL-6 and TNF-α in db/m, db/db, and db/db+FGF1 groups; db/db mice were treated with FGF1 (0.5 mg/kg body weight) for 8 weeks. Plasma from untreated db/db mice and their littermates (db/m) served as controls. (c,d) mRNA level of TNF-α and IL-6 in renal tissue of the db/m, db/db, and db/db+FGF1 groups. (a–d) Data are shown as the mean ± SEM; #P < 0.05, ##P < 0.01 versus db/m control; *P < 0.05, **P < 0.01 versus db/db mice (N = 7–9). (e) The renal macrophage infiltration in the db/m, db/db, and db/db+FGF1 groups was evaluated by immunohistochemical detection of F4/80. Bar = 50 μm. (f) Shown is a representative Western blot analysis of CD68 in renal tissue of the db/m, db/db, and db/db+FGF1 groups. (g) The activation of NF-κB and JNK was determined from the db/m, db/db, and db/db+FGF1 groups. Left panel: representative Western blot analysis of the nuclear content of NF-κB (p65), loading control lamin B, phosphorylated JNK, and total JNK in renal tissue; right panel: quantification of Western blot by densitometric analysis. Data are shown as the mean ± SEM; #P < 0.05 versus db/m control; *P < 0.05 versus db/db mice (N = 5). (h,i) Plasma concentrations of IL-6 and TNF-α in the Ctrl, T1D, and T1D+FGF1 groups; T1D mice were treated with FGF1 (0.5 mg/kg body weight) for 12 weeks. (j,k) mRNA level of TNF-α and IL-6 in renal tissue of the Ctrl, T1D, and T1D+FGF1 groups. (h–k) Data are shown as the mean ± SEM; #P < 0.05, ##P < 0.01 versus db/m control; *P < 0.05, **P < 0.01 versus db/db mice (N = 7–9). (l) The renal macrophage infiltration in the Ctrl, T1D, and T1D+FGF1 groups was determined by immunofluorescent detection for CD68 (red dots). Bar = 50 μm. (m) Representative Western blot analysis of CD68 content in renal tissue from the corresponding experimental groups. (n) The activation of NF-κB and JNK was determined from the Ctrl, T1D, and T1D+FGF1 groups. Left panel: Representative Western blot analysis of nuclear content of NF-κB (p65), phosphorylated JNK, and respective loading controls lamin B and GADPH in renal tissue. Right panel: Quantification of Western blot by densitometric analysis. Data are shown as the mean ± SEM; #P < 0.05, ##P < 0.01 versus Ctrl; *P < 0.05, ***P < 0.001 versus T1D mice (N = 5). Ctrl, control; FGF1, fibroblast growth factor 1; GAPDH, glyceraldehyde-3-phosphate dehydrogenase; IL-6, interleukin-6; NF-κB, nuclear factor-κB; TNF-α, tumor necrosis factor-α. To optimize viewing of this image, please see the online version of this article at www.kidney-international.org.
Consistent with the results in db/db mice, FGF1 also significantly reduced the renal inflammation in STZ-induced T1D mice. As shown in Figure 4h–k and Supplementary Figure S6C and D, FGF1 treatment significantly inhibited the increased levels of TNF-α, IL-6, plasminogen activator inhibitor-1, and monocyte chemotactic protein-1 in T1D mice. Similarly, FGF1 reduced the extent of CD68+ macrophage infiltration and abrogated the increased CD68 protein expression in kidney tissue of T1D mice (Figure 4l and m). Nuclear NF-κB p65 protein level as well as JNK phosphorylation was increased in renal tissue of STZ-induced T1D mice; however, FGF1 administration markedly abolished both of these increases (Figure 4N). These results indicated that FGF1 significantly reduced renal inflammation in both T2D and T1D mice, which is associated with the inhibition of JNK and NF-κB activation.
FGF1 prevents HG–induced inflammatory responses by suppressing HG-induced activation of JNK and NF-κB in renal cells
Because intraglomerular mesangial cells are often used to investigate DN36 and show high FGF1 expression (Supplementary Figure S2A), at first we used an experimental in vitro model of HG-challenged glomerular mesangial cells to evaluate the anti-inflammatory activity of FGF1. TGF-β1 is known to be largely responsible for fibrosis in the diabetic kidney37 as well as an important inflammatory mediator in the pathogenesis of DN. Mesangial cells were pretreated with FGF1 (1, 10, or 100 ng/ml) for 2 hours, followed by treatment with HG (25 mM) for an additional 24 hours. The results showed that the dramatic upregulation of TGF-β1 gene expression at both mRNA and protein levels in mesangial cells was induced by HG stimulation (Supplementary Figure S7A and B), which was accompanied by a significant increase in mRNA expression of the proinflammatory cytokines TNF-α, IL-6, and IL-12 (Figure 5a–c). However, FGF1 pretreatment prevented the HG-induced increases of TGF-β1 and the inflammatory cytokines in a dose-dependent manner (Supplementary Figure S7A and B and Figure 5a–c). These data indicate that FGF1 is a potent inhibitor of HG-induced overexpression of inflammatory cytokines in mesangial cells, providing further evidence of its anti-inflammatory capability.
Figure 5. FGF1 prevents HG–induced inflammatory responses in renal mesangial cells.
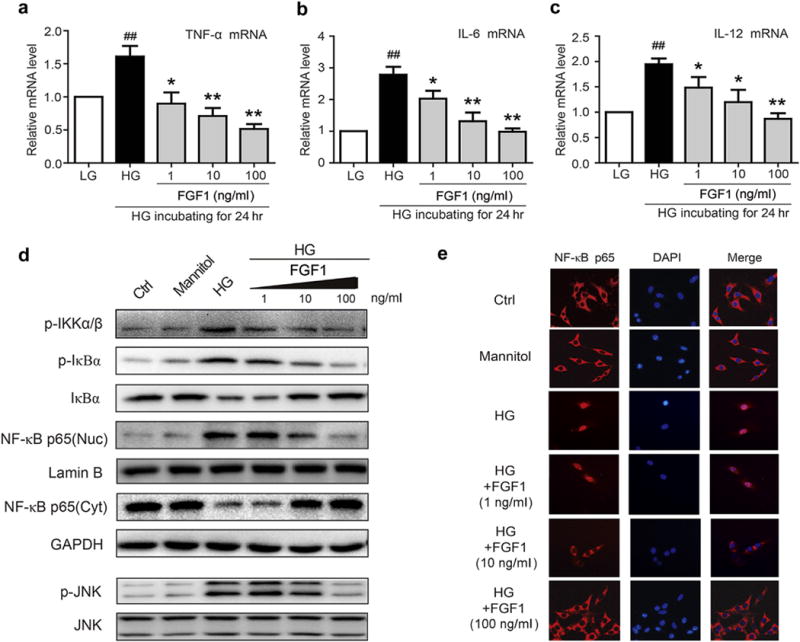
(a–c) Mesangial cells were pretreated with FGF1 (1, 10, or 100 ng/ml) for 2 hours, followed by treatment with HG (25 mM) for an additional 24 hours, and mRNA of proinflammatory cytokines, TNF-β, IL-6, and IL-12 determined by reverse transcriptase polymerase chain reaction; values normalized to the housekeeping gene GAPDH and reported as the mean ± SEM. ##P < 0.01 versus LG control; *P < 0.05, **P <.01 versus HG; N = 3. (d) Effects of FGF1 pretreatment (1, 10, or 100 ng/ml for 1 hour) of mesangial cells on HG-induced (2 hours) activation of NF-κB and JNK. (e) Immunofluorescent localization of NF-κB p65 subunit (red) in mesangial cells: Ctrl, mannitol (osmotic control), HG, HG+FGF1 with the indicated concentration; nuclei stained with fluorescent DAPI (blue). Ctrl, control; DAPI, 4′,6-diamidino-2-phenylindole; FGF1, fibroblast growth factor 1; GAPDH, glyceraldehyde-3-phosphate dehydrogenase; HG, high glucose; JNK, c-Jun N-terminal kinase; LG, low glucose; NF-κB, p-JNK, phosphorylation of c-Jun N-terminal kinase; RT-PCR, reverse transcriptase polymerase chain reaction; TNF-α, tumor necrosis factor-α. To optimize viewing of this image, please see the online version of this article at www.kidney-international.org.
Inflammation is a key driving factor in the pathogenesis of DN, and NF-κB is a central regulator controlling expression of a host of proinflammatory genes encoding cytokines, growth factors, and adhesion molecules.8 In the classic activation of NF-κB, the phosphorylation and activation of upstream IKK (inhibitor of NF-κB [IκB] kinase) are required to phosphorylate and degrade κB that is bound with NF-κB in the cytoplasm, thereby releasing the NF-κB p65 subunit for translocation to the nucleus.7,8 To pursue the anti-inflammatory mechanism, we first determined the effects of FGF1 in the regulation of the NF-κB activation cascade in mesangial cells. Our results indicated that HG treatment for 2 hours increased phosphorylation of IKKα/β and the phosphorylation and degradation of IκBα, whereas FGF1 pretreatment dose-dependently reduced the HG-induced IKKα/β phosphorylation and IκB phosphorylation and degradation. Moreover, FGF1 dose-dependently reduced the HG-induced increases of nuclear NF-κB p65 levels and concomitant decreases of cytosolic NF-κB p65 levels (Figure 5d). Immunofluorescent localization of NF-κB confirmed the Western blot data in that FGF1 prevented the HG-induced nuclear translocation of the p65 subunit in dose-dependent manner (Figure 5e). Mannitol, as an osmotic control for HG, did not activate JNK or NF-κB (Figure 5d and e). We also determined the effects of FGF1 in the regulation of JNK, an important upstream regulator of transcription factors.38 The importance of JNK in the regulation of the HG-induced inflammatory responses in mesangial cells was confirmed by use of the JNK-specific inhibitor SP600125. We found that SP600125 significantly inhibited the HG-induced increased TNF-α mRNA expression, JNK phosphorylation, IκB degradation, and NF-κB p65 nuclear translocation (Supplementary Figure S7C and D). Similarly, in mesangial cells with FGF1 pretreatment, the HG-induced JNK phosphorylation was inhibited in a dose-dependent manner (Figure 5d).
In addition to the mesangial cells, the podocytes were also found to express FGF1 at high levels, and therefore we evaluated the anti-inflammatory activity of FGF1 on podocytes by pretreating them with FGF1 (1, 10, or 100 ng/ml) for 2 hours, followed by exposure to HG (25 mM) for an additional 24 hours, respectively. FGF1 dose-dependently inhibited the HG-induced expression of proinflammatory cytokines TNF-β and IL-6 in podocytes (Figure 6a and b). The immunoblotting data showed that FGF1 pretreatment was able to dose-dependently reduce the HG-induced IKKα/β phosphorylation and IκB phosphorylation and degradation (Figure 6c), and the immunofluorescent localization of NF-κB also showed that FGF1 prevented the HG-induced nuclear translocation of the p65 subunit (Figure 6d). Not deviating from the data obtained from mesangial cells, the HG-induced JNK phosphorylation was inhibited by FGF pretreatment in a dose-dependent manner in podocytes (Supplementary Figure S6C).
Figure 6. FGF1 prevents HG-induced inflammatory responses in podocytes.
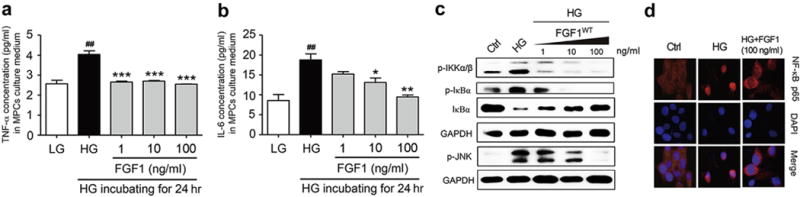
(a,b) The expression of proinflammatory cytokines (TNF-α and IL-6) determined by enzyme-linked immunosorbent assay in murine podocyte cells (MPCs) that have been pretreated with FGF1 (1, 10, or 100 ng/ml) for 2 hours, followed by treatment with HG (25 mM) for an additional 24 hours; values reported as mean ± SEM, ##P < 0.01 versus LG, *P < 0.05, **P < 0.01, and ***P < 0.001 versus HG (N = 3). (c) Effects of FGF1 pretreatment (1, 10, or 100 ng/ml for 1 hour) of MPCs on HG-induced (2 hours) activation of IKKα/β and JNK. (d) Immunofluorescent localization of NF-κB p65 subunit (red) in MPCs: Ctrl, mannitol (osmotic control), HG, HG+FGF1 (100 ng/ml); nuclei stained with fluorescent DAPI (blue). Ctrl, control; DAPI, 4′,6-diamidino-2-phenylindole; FGF1, fibroblast growth factor 1; GAPDH, glyceraldehyde-3-phosphate dehydrogenase; HG, high glucose; p-IKKα/β; JNK, c-Jun N-terminal kinase; IL-6, interleukin-6; LG, low glucose; NF-κB, nuclear factor-κB; p-IKKα/β, phosphorylation of inhibitor of nuclear factor kappa-B kinase subunit alpha/beta; p-JNK, phosphorylation of c-Jun N-terminal kinase; TNF-α, tumor necrosis factor-α. To optimize viewing of this image, please see the online version of this article at www.kidney-international.org.
FGF1 suppresses TNF-α–induced activation of JNK and NF-κB signaling in mesangial cells
In the in vivo setting of DN, mesangial cells and other cells of the kidney are exposed to a wide array of inflammatory mediators (e.g., cytokines) in addition to high levels of glucose, of which most if not all can activate NF-κB.8,9 We determined the anti-inflammatory effects of FGF1 on TNF-α–activated mesangial cells. Our results indicated that TNF-α treatment for 30 minutes increased phosphorylation of JNK and IκB phosphorylation, which was accompanied by IκBα degradation and NF-κB p65 nuclear translocation (Supplementary Figure S8). However, FGF1 pretreatment effectively inhibited the TNF-α–induced activation of JNK and NF-κB signaling (Supplementary Figure S8). Not surprisingly, treatment with SP600125 in a parallel experimental group resulted in similar inhibition of the TNF-α–induced activation of JNK and NF-κB signaling (Supplementary Figure S8). The findings suggest that the anti-inflammatory activity of FGF1 appears to be protective against an array of extracellular inflammatory stimuli.
DISUSSION
DN, a major microvascular complication of both T1D and T2D, is an important cause of end-stage renal disease. In this study, we demonstrated that FGF1 treatment decreased urinary albumin excretion and mitigated the glomerulosclerosis that was likely primarily attributed to the reduced renal inflammation in mouse model of T1D or T2D.
FGF1 and related isoforms are well established as proliferative agents, and, as such, the prevailing direction in FGF research has focused on the biological processes of transformation, mitosis, and cellular development. Nonetheless, a collection of biochemical reports emerged early in the past decade suggesting potential links of FGFs to metabolic homeostasis. The role of FGF1 in adaptive adipose remodeling was recently reported in which a high-fat diet given to mice deficient in FGF1 led to an aggressive diabetic phenotype, suggesting a physiologic role for this growth factor in managing a metabolic challenge.23 These gene-based studies were confirmed by pharmacologic studies using biosynthetic FGF1. In particular, Suh et al.24 found that pharmacologically relevant FGF1 doses (0.5 mg/kg) to T2D mouse models (i.e., ob/ob or db/db) with impaired insulin sensitivity led to impressive changes in several measures of metabolism in which blood glucose was nearly normalized and long-lasting (35 days). The kidney is the main target organ involved in the major complications caused by diabetes mellitus.39 We asked the important question of whether FGF1 could ameliorate kidney complications in diabetes as well as normalizing the metabolic activity. We found that FGF1 is expressed in the renal tissues of normal control mice, and both T1D and T2D led to downregulation of FGF1 in the kidney (Figure 1e and f). Additionally, we observed that FGF1 was expressed in DN-related cell types, including mesangial cells and podocytes at high levels and to a very low extent in tubular epithelial cells but was not expressed in macrophages (Supplementary Figure S2) and that it mediates the anti-inflammatory actions on mesangial cells and in podocytes (Figures 5 and 6). Taken together, we speculate that these 2 cell types primarily contribute to the renoprotective effects of FGF1 in DN mice.
Further, we found that FGF1 treatment enhanced the level of FGF1 in kidneys of both STZ-induced mice and db/db mice, and the renal FGF1 level in FGF1-treated diabetic mice was similar to that in control mice (Supplementary Figure S4A–D). Consistent with this notion, i.p. injected recombinant FGF1 protein showed the highest distribution in the kidney among all organs tested (Supplementary Figure S4E). These results indicate that FGF1 may play an important role in DN. In this study, our results clearly showed that FGF1 significantly improved kidney function and reduced the pathologic severity of DN in db/db mice (Figure 2). However, surprisingly, we observed that FGF1 ameliorated DN in STZ-induced T1D mice (Figure 3), without any effect on the glucose level of T1D mice (Figure 3b). These data indicated that the protective effect of FGF1 on DN occurred independently of its glucose-lowering activity. We also noted that the glucose-lowering effect of FGF1 will benefit its renoprotection in T2D; however, the degree of improvement of kidney damage was similar in db/db mice and STZ-induced mice despite different effects of FGF1 on blood glucose levels. Thus, we speculate that the anti-inflammatory effect of FGF1 is as strong and able to block renal inflammation in STZ-induced mice, resulting in similar renoprotective effects in both models.
Among the many potential pathogenic mechanisms responsible for the development of diabetic kidney disease, the inflammation mechanism is recognized as a central factor driving the pathogenesis of DN.7,9,40 Our mouse models of T2D and T1D presented with a robust inflammatory profile of the kidney, indicated by upregulated expression of proinflammatory cytokines such as TNF-α and IL-6 as well macrophage infiltration, all of which were significantly inhibited by FGF1 (Figure 4). Thus, FGF1 ameliorated DN in both T1D and T2D mice, which is associated with its anti-inflammatory actions and not through exerting its insulin sensitization activity and impinging on glucose homeostasis.
Among the intracellular signaling systems that regulate inflammatory and immune responses, NF-κB is of particular important because it is recognized to be the master transcription factor controlling expression of a host of proinflammatory genes.7 Moreover, multiple factors of the diabetic milieu (i.e., hyperglycemia, oxidative stress, advanced glycation end-products, and angiotensin II) can activate NF-κB.8,32 Our findings confirm that activation of NF-κB occurred in kidney tissue of T2D and T1D mice, as indicated by increased nuclear translocation of the NF-κB p65 subunit and degradation of IκBα, and importantly, FGF1 prevented NF-κB activation. Direct treatment of glomerular mesangial cells and podocytes with HG also activated NF-κB, and FGF1 effectively prevented the HG-induced activation (Figures 5 and 6). This suggested that in the diabetic environment, NF-κB could be activated in multiple cell types, indicating that the anti-inflammatory actions of FGF1 are strongly linked to transcriptional suppression of the NF-κB pathway. HG-induced inflammation further induces renal cell injury and final apoptosis. As expected, we noticed that the podocyte apoptosis induced by 24-hour incubation with HG could be ameliorated by FGF1 treatment in a dose-dependent manner (Supplementary Figure S9).
In addition to NF-κB, HG can also activate JNK,41 which is an important player in inflammation and regulates the transcription of a number of inflammatory cytokines.35,42 We observed that not only HG activated JNK in mesangial cells, podocytes, tubular cells, and macrophages, but renal tissue from T2D and T1D presented with activated JNK as well, and FGF1 prevented JNK activation in each of those cases. Although JNK can function as an upstream regulator of transcription factors,38 it is not clear whether the NF-κB activation was a consequence of JNK activation in our experimental models. Our observation that the JNK inhibitor SP600125 prevented the TNF-α–induced activation of NF-κB suggests that JNK acted as upstream of NF-κB. This also suggests that the anti-inflammatory action of FGF1 was through inhibition of JNK in the early stages of a sequential pathway to inhibit NF-κB (Figure 7). However, it remains to be determined whether JNK regulation of NF-κB was by a direct or indirect interaction. An alternative anti-inflammatory mechanism regulated by FGF1 is activation or preservation of the phosphatidylinositol-3′-kinase/AKT signaling.24,43 In diabetes, JNK is known to decrease AKT activation, thereby promoting insulin resistance.44 Conceivably, FGF1 may act to prevent the loss of AKT activation in kidney tissue of the T2D and T1D mice. However, the specific role of AKT in countering the inflammation remains unclear, and it is a limitation of the current study. In addition, FGF1 is a ligand for FGF receptors 1–4. It is very difficult to define which FGF receptors play a role (or a more important role) in the anti-inflammatory and renal protective effects of FGF1. This is another limitation of this work. We will further investigate the role of FGF receptors in the pathogenesis and development of DN in the future.
Figure 7. A working model of the potential protection mechanism of fibroblast growth factor 1 against diabetic nephropathy.
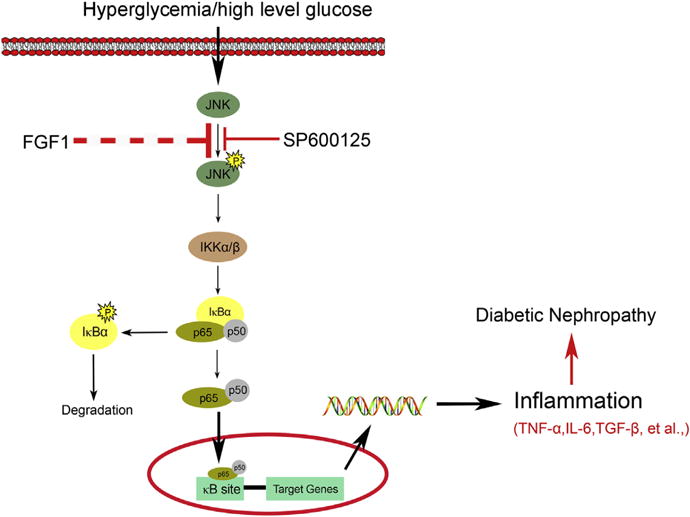
FGF1, fibroblast growth factor 1; IL-6, interleukin-6; JNK, c-Jun NH2-terminal kinase; TGF-β, transforming growth factor-β; TNF-α, tumor necrosis factor-α.
In summary, our findings indicated that FGF1 was highly effective in preventing the development of DN and activation of inflammatory signaling cascades in renal tissue of T2D and T1D mouse models, which was independent of its glucose-lowering activity. This corresponded to the anti-inflammatory effects of FGF1 in its ability to prevent the HG-induced inflammatory responses. We conclude that because FGF1 is already in clinical trials (e.g., for wound/burn repair, ulcer regeneration, and spinal cord injury repair), it can be considered as an attractive therapeutic target to prevent the development of DN in both T1D and T2D.
METHODS
Protein expression and purification
The cDNA fragment encoding full-length wild-type human FGF1 (residues 1–155) was subcloned into the expression vector pET30a using the cloning sites NdeI and HindIII. Competent BL21 (DE3) Escherichia coli cells were transformed with an expression construct for FGF1 and were cultured at 37 °C to an A600 of 0.8 (Beckman DU530 UV-visible spectrometer, San Diego, CA) and induced with 1-mM isopropyl-L-thio-B-D-galactopyranoside (IPTG) for 4 hours. The cells were then lysed using the Emulsiflex-C3 (Avestin, Inc., Ottawa, Ontario, Canada) high-volume homogenizer, and the FGF1 was first purified by heparin affinity chromatography (GE Health-care, Little Chalfont, UK) followed by size-exclusion chromatography (Superdex-100, GE Healthcare). The protein purity was estimated to be >98% based on 12% sodium dodecylsulfate-polyacrylamide gel electrophoresis analysis. As previously reported, size-exclusion chromatography has been used for separating endo-toxin from proteins and plasmid DNA,45 so it means that size-exclusion chromatography is an available method that could be applied to eliminate endotoxin. In this study, we further tested the endotoxin in our experimental samples using the tachypleus amebocyte lysate method, as previously reported,46 and the results showed that the amount of endotoxin in our protein samples is ~3.2 endotoxin unit/mg, which is significantly less than the US Food and Drug Administration requirements.
Animals and experiment protocol
Eight-week-old male db/db (C57BLKS/J-leprdb/ leprdb) mice and their nondiabetic db/m littermates and male C57BL/6 mice 5 weeks old were purchased from the Model Animal Research Center of Nanjing University (Nanjing, China). The animals were acclimatized to the laboratory before use. For T2D, the db/db mice were i.p. injected with FGF1 (0.5 mg/kg body weight) every other day for 8 weeks from 10 weeks of age. The db/m and db/db control groups received 0.9% physiologic saline on the same schedule as the control groups. For the T1D mice model, diabetes was induced in C57BL/6 mice by a single i.p. injection of 150 mg/kg STZ (Sigma-Aldrich, St. Louis, MO) diluted in 0.1 M citrate buffer (pH 4.5), whereas the control animals received the same volume of citrate buffer. At 7 days, mice with a blood glucose level ≥300 mg/dl were diagnosed as T1D mice. Next, STZ-induced T1D mice were treated with FGF1 for 12 weeks at a dose of 0.5 mg/kg every other day. During the experiment, all mice were housed in a controlled environment (22 ± 2° C, 50%–60% humidity, 12-hour light/dark cycle, lights on at 7 AM) with free access to food and water. Blood glucose levels and body weight were measured weekly. The plasma glucose levels were measured using the Precision G Blood Glucose Testing System (Abbott Laboratories, Abbott Park, IL).
At the time that the mice were killed, blood and tissue samples were harvested and processed for various studies. The mice were placed in individual metabolic cages for 24-hour urine collection. Blood was collected from the right ventricle using a heparin-containing syringe with a needle at the time of death. Blood glucose, total triglyceride, blood urea nitrogen, serum creatinine, and daily urinary albumin excretion were measured by an automatic biochemical analyzer (Hitachi Auto Analyzer 7020, Hitachi Co. Ltd., Tokyo, Japan). All experiments were conducted in accordance with the National Institutes of Health guidelines and with approval of the Wenzhou Medical University Institutional Animal Care and Use Committee.
FGF1 assay
Human subjects
Eleven normal human subjects, 6 subjects with diagnosed type 2 diabetic nephropathy, and 3 subjects with diagnosed type 1 diabetic nephropathy were recruited for blood draws (Supplementary Table S1). Human blood sampling had been performed as part of routine clinical diagnostic investigation. These investigations were conducted in accordance with the principles of the Declaration of Helsinki and were approved by the Research Ethics Committee of Wenzhou Medical University after informed consent was obtained from the patients. The collected blood samples were placed in a serum separator tube and allowed to clot for 2 hours at room temperature. The samples were centrifuged for 20 minutes at ~1000g, and the serum collected by aspiration. For determination of FGF1 content, the serum was initially diluted 150-fold with 0.01 M phosphate-buffered saline (PBS) (pH = 7.0–7.2) and was assayed using a human FGF1 enzyme-linked immunosorbent assay kit (Cloud-Clone Corp., Houston, TX) in accordance to the manufacturer’s protocol, and absorbance measured at 450 nm.
Mice
Blood samples were collected from 9 each of the 20-week-old db/m mice, 20-week-old and 7-week-old db/db (T2D) mice, 18-week-old normal C57BL/6 mice, and T1D mice induced by treatment with STZ for 13 weeks and 4 weeks, respectively. The samples were placed into an EP tube and allowed to clot overnight at 4 °C. The samples were centrifuged for 10 minutes at ~3000g, and the serum collected by aspiration. For FGF1 determination, the serum was diluted 100-fold with 0.01 M PBS (pH 7.0–7.2) and was assayed using FGF1 Mouse ELISA kit in accordance to the manufacturer’s protocol, and absorbance measured at 450 nm.
Cells
Mesangial cells podocytes were cultured in 60-mm plates (1×10⁵ cells per plate with 1 mL PRMI-1640 medium) and incubated overnight at 37 °C in a 5% CO2-humidified air. Cells were HG incubated (25 mM D-glucose) for 3 hours. The medium was collected and diluted 5-fold with 0.01 mol/l PBS (pH = 7.0–7.2) and assayed using mouse FGF1 enzyme-linked immunosorbent assay kit (Cloud-Clone Corp.), in accordance to the manufacturer’s protocol, and absorbance measured at 450 nm.
Tissue distribution of FGF1 by i.p. injection in SD rats
FGF1 was marked with isotope labeling. Thirty Wistar rats were randomly divided into 5 groups, with half male and half female rats, and were administered 0.5 mg/kg FGF1 by i.p. injection. Protein concentration was measured in the kidney, liver, heart, spleen, muscle, pancreas, lung, stomach, brain, testis, plasma, and uterus samples at 0, 1, 2, 4, 8, and 16 hours after injection. Those tissue samples were weighed and homogenized with a tissue balance and a homogenizer, respectively. Two hundred microliters of 10% tricarboxylic acid were added to the tissue samples, which were centrifuged for 10 minutes at 4000 rpm, after which the supernatant was discarded. The radioactivity of the precipitate was determined by a gamma counter. Plasma drug concentration was detected as previously reported.47
Histopathology, immunohistochemistry, and immunofluorescence
The kidney tissue samples were harvested for pathologic examination, and some sections were fixed overnight in 4% paraformaldehyde and embedded in paraffin. After deparaffinization and rehydration, the paraffin sections (5 μm) were stained with Masson trichrome, Sirius red, hematoxylin and eosin, respectively, according to the manufacturer’s instructions. Glomerular mesangial expansion was scored semiquantitatively, whereby the percentage of mesangial matrix occupying each glomerulus was rated on a scale from 0 to 4 as follows: 0, 0%; 1, <25%; 2, 25% to 50%; 3, 50% to 75%; and 4, >75%.40
For immunohistochemistry, after deparaffinization and rehydration, the kidney tissue slides were treated with 3% H2O2 for 10 minutes and with 1% bovine serum albumin in PBS for 30 minutes, and incubated overnight at 4 °C with anti-FGF1 antibody (Abcam, [Cambridge, UK] ab207321, 1:200; anti-CD68 antibody (Abcam, ab955, 1:200); or anti-F4/80 antibody (Abcam, ab6640; 1:100). For immunofluorescence, the slides were incubated with Alexa Fluor– labeled secondary antibody (Abcam, ab150075, 1:500) for 1 hour at 37 °C, and the cell nuclei were stained with 4′,6-diamidino-2-phenylindole (Beyotime, Beijing, China) for 10 minutes.
For immunofluorescent double-staining, frozen sections (5 μm thick) of renal tissue were washed 3 times with PBS at room temperature, and each wash was carried out for 5 minutes. Slides were blocked using 5% bovine serum albumin for 30 minutes and then incubated overnight at 4 °C with both FGF1 antibody (Abcam, ab207321, 1:200) and an antibody of a specific marker (anti-smooth muscle actin, Abcam, ab7817, 1:200; anti-Wilms tumor 1 [Novus Biologicals, Littleton, CO], NBP2-44607, 1:200); and anti-aquaporin 1 [Santa Cruz Biotechnology, Inc., Dallas, TX, sc-32737, 1:200; anti-CD68 from Abcam, ab955, 1:200), respectively. Slides were then correspondingly incubated with 2 kinds of secondary antibody (TRITC-labeled antibody from Abcam, ab6786, 1:500; Alexa Fluor–labeled antibody from Abcam, ab150075, 1:500) at 37 °C for 1 hour, and washed by PBS for 4 times. The cell nuclei was stained with 4′,6-Diamidino-2-phenylindole for 10 minutes, and all stained sections were viewed by fluorescent confocal microscopy (Nikon, Tokyo, Japan).
Transmission electron microscopy
Mice were perfused with 2.5% glutaraldehyde in 0.1 M sodium phosphate buffer at pH 7.4. Kidneys were removed, cut into small pieces, and immersed in 2.5% glutaraldehyde containing 1% tannic acid in 0.1 M phosphate buffer for 2 hours at 4 °C. They were postfixed with 1% osmium tetroxide, dehydrated, and embedded in epoxy resin. Ultrathin sections were stained with uranyl acetate and lead citrate and examined under a Philips CM10 electron microscope (Eindhoven, the Netherlands). The average podocyte foot process width was FPW = (π/4) (Σ glomerular basement membrane length/ Σ number of foot process).48
Cell culture
Mesangial cells (SV40 MES 13, ATCC-CRL-1927) were obtained from American Type Culture Collection (ATCC, Manassas, VA). The cells were maintained at 37 °C under humidified 5% CO2 in Dulbecco’s modified Eagle’s medium (Gibco, Eggenstein, Germany) containing 5.5 mM D-glucose (low glucose [LG]) supplemented with 10% fetal bovine serum (Gibco, Grand Island, NY), 100 U/ml penicillin, and 100 U/ml streptomycin. For experimental setup, cells were grown to subconfluence and subsequently made quiescent in serum-free LG Dulbecco’s modified Eagle’s medium for 24 hours before changing to the experimental medium (serum free). Dulbecco’s modified Eagle’s medium with 5.5 mM D-glucose with the addition of 19.5 mM D-mannitol served as an osmotic control. Cells were then stimulated with 25 mM glucose (HG) or 1 μg/ml TNF-α with or without pretreatment with different concentrations of FGF1 (1, 10, 100 ng/ml) or SP600125 (10 μM) at 37 °C.
Mouse podocytes (a gift from Dr. Stuart Shankland, University of Washington) are a conditionally immortalized cell line. Podocytes were grown in collagen I (BD Biosciences)–coated Primaria plates (VWR, Chicago, IL) in RPMI (Roswell Park Memorial Institute medium) 1640 medium (Sigma-Aldrich) containing 10% heat-inactivated FBS (Gibco) with interferon gamma (50 U/ml) at 33 °C. Cell differentiation was promoted by incubation at 37 °C without interferon gamma for 10 to 12 days. Podocytes were placed in RPMI with reduced FBS (0.5%) for 1 day before exposure to experimental conditions in the same media. Cells were then stimulated with 25 mM glucose (HG) with or without pretreatment with different concentrations of FGF1 (1, 10, 100 ng/ml) at 37 °C.
RNA extraction, cDNA synthesis, and quantitative reverse transcription polymerase chain reaction
Total RNA was extracted from renal tissue and cultured cells with TRIzol reagent (Invitrogen, Shanghai, China) and further purified using RNeasy Mini Kit (Qiagen, Valencia, CA). Reverse transcription and quantitative polymerase chain reaction were carried out using a 2-step M-MLV Platinum SYBR Green Qpcr SuperMix-UDG kit (Invitrogen). To normalize for differences in the amount of total RNA added to each reaction, we performed amplification of glyceraldehyde 3-phosphate dehydrogenase as an endogenous control. The primers were synthesized by Invitrogen (Invitrogen).
Western blot analysis
Lysate homogenates of renal tissues or cells were prepared, and Western blotting was performed, as previously described unless otherwise indicated.49 Each nitrocellulose membrane was incubated with antibodies to phospho–JNK (4668, 1:1000, Cell Signaling Technology, Danvers, MA), NF-κB p65 (sc-7151, 1:500, Santa Cruz Biotechnology), phospho-IκB (sc-8404, 1:500, Santa Cruz Biotechnology), IκB (sc-371, 1:500, Santa Cruz Biotechnology), IKKα/β (sc-7607, 1:500, Santa Cruz Biotechnology), phospho-IKKα/β (sc-2697, 1:500, Santa Cruz Biotechnology), laminin B (sc-6216, 1:500, Santa Cruz Biotechnology), FGF1 (Abcam, 1:2000), or glyceraldehyde 3-phosphate dehydrogenase (1:5,000, Santa Cruz Biotechnology). The immunoreactive bands were then detected by incubating with secondary antibody (sc-2004, Santa Cruz Biotechnology) conjugated with horseradish peroxidase and visualized using enhanced chemiluminescence reagents (Bio-Rad, Hercules, CA). All Western blots were repeated at least 3 times. The density of the immunoreactive bands was quantified using ImageJ software (NIH, Bethesda, MD). For densitometric quantification of JNK, the total amount of both 46 kD JNK1 and 54kD JNK2 was calculated.
Assay of cellular NF-κB p65 translocation
Immediately after stimulation, cells were fixed with 4% paraformaldehyde and permeabilized with 100% methanol at −20 °C for 5 minutes. After fixation and permeabilization, cells were washed twice with PBS containing 1% bovine serum albumin and then incubated with primary antibodies for transcription factor p65 (Santa Cruz Biotechnology, 1:200) overnight at 4 °C, followed by tetramethylrhodamine-labeled secondary antibody (1:500, Abcam). Then the cells were counterstained with 4′,6-diamidino-2-phenylindole for 10 minutes. The stained cells were viewed under a fluorescence microscope (original magnification ×400, Nikon, Japan).
Terminal deoxynucleotidyl transferase–mediated deoxyuridine-triphosphate nick end-labeling assay
The paraffin samples (5 μm) were removed from the sections with xylene, rehydrated in graded alcohol series, subjected to antigen retrieval in 0.01 M citrate buffer (pH 6.0) by microwaving, and then placed in 3% hydrogen peroxide in methanol for 30 minutes at room temperature. Sections were then incubated with 20 mg/ml proteinase K for 15 minutes. The sections were washed several times in PBS and then incubated with terminal deoxynucleotidyl transferase enzyme, fluorescein-deoxyuridine-triphosphate, and TUNEL (terminal deoxynucleotidyl transferase-mediated deoxyuridine-triphosphate nick end-labeling assay) extract (1:24:25) at 37 °C for 1 hour (Beyotime). Then the sections were viewed under the Nikon fluorescence microscope (original magnification ×400).
Statistical analysis
The in vitro experiments were performed 3 times with triplicate samples for each individual experiment. Data obtained from the animal study were obtained from 7 to 9 mice. All data were expressed as the mean ± SEM and subjected to analysis of variance and the Student t test using the statistical software NASDAQ (SPSS Inc., Chicago, IL). Statistical significance was set at P < 0.05, P < 0.01, and P < 0.001.
Supplementary Material
Figure S1. The serum FGF1 levels of experimental mice at an early stage of diabetes. (A) FGF1 concentration in mouse serum from 7-week-old db/m and db/db (T2D) mice. Data are presented as the mean ± SEM. **P < 0.01 versus db/m (N=9). (B) FGF1 concentration in mouse serum from 9-week-old C57BL/6 mice and T1D mice induced by treatment with STZ for 4 weeks. Data are presented as the mean ± SEM; ***P < 0.001 versus Ctrl, N = 9. Ctrl, control; FGF1, fibroblast growth factor 1; STZ, streptozotocin; T1D, type 1 diabetes; T2D, type 2 diabetes.
Figure S2. The immunofluorescent double-staining for FGF1 and different cell type–specific markers in renal tissue of normal C57L/B6 mice and STZ-induced diabetic mice. (A) Immunofluorescent double-staining for FGF1 (green color) and SMA (red color), which was used as a cell marker of mesangial cells in renal tissue. (B) Immunofluorescent double-staining for FGF1 and Wilms tumor 1, which was used as a cell marker of podocytes in renal tissues. (C) Immunofluorescent double-staining for FGF1 and aquaporin 1, which was used as a cell marker of tubular epithelial cells in renal tissues. (D) Immunofluorescent double-staining for FGF1 and CD68 (red color), which was used as a cell marker of macrophages in renal tissue. Overlapping staining (yellow color) is indicated by arrowheads in merged images. The renal tissue was isolated from normal C57BL/6 mice and T1D mice induced by treatment with STZ for 13 weeks, respectively; shown are representative images of 3 mice from each group. Bar = 50 μm. AQP1, aquaporin 1; Ctrl, control; DAPI, 4′,6-diamidino-2- phenylindole; FGF1, fibroblast growth factor 1; SMA, smooth muscle actin; STZ, streptozotocin; T1D, type 1 diabetes; WT1, Wilms tumor 1.
Figure S3. The expression of FGF1 in the cultured cells exposed to low or high glucose. (A) Mesangial cells. (B) Mouse podocytes. Data are presented as the mean ± SEM. *P < 0.05, **P < 0.01 versus Ctrl, N = 3. Ctrl, control; FGF1, fibroblast growth factor 1; HG, high glucose; MPC, mouse podocyte; SV40, mesangial cells.
Figure S4. The levels of FGF1 in kidneys of diabetic mice with or without FGF1 treatment. (A,B) Representative Western blot analysis and densitometric quantification of FGF1 expression in renal tissue from 20-week-old db/m, db/db, and db/db+FGF1 mice; data are normalized to GAPDH and presented as mean ± SEM. ##P < 0.01, ###P < 0.001 versus db/m group; **P < 0.01, ***P < 0.001 versus db/db group, N = 6. (C,D) Representative Western blot analysis and densitometric quantification of FGF1 in renal tissue from normal C57BL/6 (Ctrl), T1D, and T1D+FGF1 mice; data are normalized to GAPDH and presented as mean ± SEM. #P < 0.05, ###P < 0.001 versus Ctrl group; *P < 0.01, *** P < 0.001 versus T1D group, N = 6. (E) The tissue distribution of FGF1 examined in Sprague Dawley (SD) rats. Values are presented as mean ± SEM, N = 10. Ctrl, control; FGF1, fibroblast growth factor 1; GAPDH, glyceraldehyde-3-phosphate dehydrogenase; T1DM, type 1 diabetes mellitus.
Figure S5. (A,B) Densitometric quantification of renal fibrosis and electron micrographs of renal tissue from the experimental mice. The quantitative assessment of renal fibrosis calculated from Masson trichrome–stained kidneys in db/db (A) and T1D (B) mice. The assessment of renal fibrosis was quantified using ImageJ software (NIH, Bethesda, MD). Data are presented as the mean ± SEM; ##P < 0.01 versus nondiabetic control; **P < 0.01 versus diabetic mice, N = 3. (C,D) Ultrastructure of glomeruli of db/m (control), db/db (T2D), FGF1 (db/db+FGF1) groups (C) and of control (Ctrl), T1D, and FGF1 (T1D+FGF1) groups (D). Disruption and irregular podocyte foot process (blue arrows) and basement membrane thickening (red arrows) observed in db/db (C) and T1D (D) mice were suppressed by treatment with FGF1. Original magnification × 20,000; bar = 1 μm. (E,F) Analysis of podocyte foot process effacement in the type 2 diabetes groups (db/m, db/db, db/db+FGF1) (E), and T1D groups (Ctrl, T1D, T1D+FGF1) (F). Data are presented as the mean ± SEM; #P < 0.05, ##P <0.01 versus nondiabetic control; *P < 0.05 versus diabetic mice, N = 3. Ctrl, control; FGF1, fibroblast growth factor 1; T1D, type 1 diabetes.
Figure S6. Effects of fibroblast growth factor 1 (FGF1) on plasminogen activator inhibitor-1 (PAI-1) and monocyte chemoattractant protein-1 (MCP-1) in renal tissue of experimental mice. (A) Representative Western blot analysis accompanied by densitometric quantification of PAI-1 and MCP-1 from renal tissue of db/m (Ctrl), db/db (T2D), and FGF1 (db/db+FGF1) groups. (B) The corresponding mRNA of PAI-1 and MCP-1 from renal tissue of the same groups. (C,D) Parallel evaluation of kidney tissue from Ctrl, T1D, and FGF1 (T1D+FGF1) groups for protein (D) and mRNA (E). Data are presented as the mean ± SEM; #P < 0.05, ##P < 0.01, and ###P < 0.001 versus nondiabetic control; *P < 0.05, **P < 0.01, and ***P < 0.001 versus diabetic mice, N = 7–9. Ctrl, control; GAPDH, glyceraldehyde-3-phosphate dehydrogenase; T1DM, type 1 diabetes mellitus.
Figure S7. Effects of FGF1 and JNK-specific inhibitor SP600125 on high glucose (HG)-induced inflammation in mesangial cells. (A,B) Glomerular mesangial cells were pretreated with FGF1 (1, 10, or 100 ng/ml) for 2 hours, followed by treatment with HG 25 mM for an additional 24 hours and (A) mRNA and (B) Western blot analysis for TGF-β1 were determined. Data are presented as the mean ± SEM. ###P < 0.001 versus LG (low glucose control); *P < 0.05 and **P < 0.01 versus HG group; N = 3. (C,D) Glomerular mesangial cells were pretreated with SP600125 (10 μM), followed by treatment with HG, 25 mM for an additional 24 hours, and cells were collected for the following determination: (C) TNF-α mRNA from LG, HG, and SP600125 (HG+SP600125) treatment groups. Data shown as the mean ± SEM; #P < 0.05 versus LG; **P < 0.01 versus HG group, N = 3; (D) Western blot analysis for JNK phosphorylation (p-JNK), unphosphorylated JNK as loading control; IκBα degradation, GAPDH as loading control; nuclear NF-κB p65 subunit, lamin B as loading control. FGF1, fibroblast growth factor 1; GAPDH, glyceraldehyde-3-phosphate dehydrogenase; HG, high glucose; LG, low glucose; NF-κB, nuclear factor κB; TGFβ1, transforming growth factor β1; TNF-α, tumor necrosis factor α.
Figure S8. Effects of FGF1 and SP600125 on TNF-α–induced signaling. TNF- α induced (1 μg/ml for 30 minutes) activation of NF-κB and JNK in mesangial cells pretreated with FGF1 (1, 10, or 100 ng/ml for 1 hour) or SP600125 (10 μM for 1 hour). The nuclear and cytosolic NF-κB p65 subunit were detected by Western blot using the respective lamin B and GAPDH as loading controls. Cyt, cytosolic; FGF, fibroblast growth factor 1; GAPDH, glyceraldehyde-3-phosphate dehydrogenase; NF-κB, nuclear factor-κB; Nuc, nuclear; TNF-α, tumor necrosis factor- α.
Figure S9. Effect of FGF1 on ameliorating podocyte apoptosis. (A) Representative images of a TUNEL assay showing the podocyte apoptosis induced by 24-hour incubation with HG (25 mM) could be ameliorated by treatment with FGF1 in a dose-dependent manner. (B) TUNEL staining quantification by counting the apoptotic cells out of the total cells in each image. Data are presented as the mean ± SEM. ##P < 0.01 versus Ctrl. *P < 0.05 and **P < 0.01 versus HG group; N = 5. Ctrl, control; FGF, fibroblast growth factor 1; HG, high glucose; TUNEL, transferase-mediated dUTP nick end-labeling.
Table S1. Clinical information in diabetic subjects with diabetic nephropathy and nondiabetic normal subjects.
Acknowledgments
This work was supported by grants from the Natural Science Foundation of China 81473261 (to ZH), 81622043 (to GL), and 81570744 (to GZ), Key Project from Science Technology Department of Zhejiang Province 2016C03G2090419 (to ZH), Natural Science Foundation of Zhejiang Province LQ15H310005 (to LS), and LQ17H070001 (to LF).
Footnotes
DISCLOSURE
All the authors declared no competing interests.
AUTHOR CONTRIBUTIONS
GL, LS, ZC, YQ, JX, LZ, QL, GZ, and ZH researched the data. GL, LS, YT, MM, XL, and ZH contributed to the initial discussion and design of the project. GL, MM, and ZH wrote the manuscript. ZH is the guarantor of this work and as such had full access to all the data in the study and takes responsibility for the integrity of the data and the accuracy of the data analysis.
SUPPLEMENTARY MATERIAL
Supplementary material is linked to the online version of the paper at www.kidney-international.org.
References
- 1.Fioretto P, Mauer M. Diabetic nephropathy: diabetic nephropathy-challenges in pathologic classification. Nat Rev Nephrol. 2010;6:508–510. doi: 10.1038/nrneph.2010.96. [DOI] [PubMed] [Google Scholar]
- 2.Tervaert TW, Mooyaart AL, Amann K, et al. Pathologic classification of diabetic nephropathy. J Am Soc Nephrol. 2010;21:556–563. doi: 10.1681/ASN.2010010010. [DOI] [PubMed] [Google Scholar]
- 3.Lim A. Diabetic nephropathy - complications and treatment. Int Jnl Nephrol Renovasc Dis. 2014;7:361–381. doi: 10.2147/IJNRD.S40172. [DOI] [PMC free article] [PubMed] [Google Scholar]
- 4.Kanwar YS, Sun L, Xie P, et al. A glimpse of various pathogenetic mechanisms of diabetic nephropathy. Annu Rev Pathol. 2011;6:395–423. doi: 10.1146/annurev.pathol.4.110807.092150. [DOI] [PMC free article] [PubMed] [Google Scholar]
- 5.Singh DK, Winocour P, Farrington K. Oxidative stress in early diabetic nephropathy: fueling the fire. Nat Rev Endocrinol. 2011;7:176–184. doi: 10.1038/nrendo.2010.212. [DOI] [PubMed] [Google Scholar]
- 6.Ruggenenti P, Cravedi P, Remuzzi G. The RAAS in the pathogenesis and treatment of diabetic nephropathy. Nat Rev Nephrol. 2010;6:319–330. doi: 10.1038/nrneph.2010.58. [DOI] [PubMed] [Google Scholar]
- 7.Navarro-Gonzalez JF, Mora-Fernandez C, Muros de Fuentes M, et al. Inflammatory molecules and pathways in the pathogenesis of diabetic nephropathy. Nat Rev Nephrol. 2011;7:327–340. doi: 10.1038/nrneph.2011.51. [DOI] [PubMed] [Google Scholar]
- 8.Sanz AB, Sanchez-Nino MD, Ramos AM, et al. NF-kappaB in renal inflammation. J Am Soc Nephrol. 2010;21:1254–1262. doi: 10.1681/ASN.2010020218. [DOI] [PubMed] [Google Scholar]
- 9.Navarro-Gonzalez JF, Mora-Fernandez C. The role of inflammatory cytokines in diabetic nephropathy. J Am Soc Nephrol. 2008;19:433–442. doi: 10.1681/ASN.2007091048. [DOI] [PubMed] [Google Scholar]
- 10.Rane MJ, Song Y, Jin S, et al. Interplay between Akt and p38 MAPK pathways in the regulation of renal tubular cell apoptosis associated with diabetic nephropathy. Am J Physiol Renal Physiol. 2010;298:F49–F61. doi: 10.1152/ajprenal.00032.2009. [DOI] [PMC free article] [PubMed] [Google Scholar]
- 11.Ma FY, Flanc RS, Tesch GH, et al. A pathogenic role for c-Jun amino-terminal kinase signaling in renal fibrosis and tubular cell apoptosis. J Am Soc Nephrol. 2007;18:472–484. doi: 10.1681/ASN.2006060604. [DOI] [PubMed] [Google Scholar]
- 12.de Borst MH, Prakash J, Sandovici M, et al. c-Jun NH2-terminal kinase is crucially involved in renal tubulo-interstitial inflammation. J Pharmacol Exp Ther. 2009;331:896–905. doi: 10.1124/jpet.109.154179. [DOI] [PubMed] [Google Scholar]
- 13.Zhong Z, Davidescu A, Ehren I, et al. C-peptide stimulates ERK1/2 and JNK MAP kinases via activation of protein kinase C in human renal tubular cells. Diabetologia. 2005;48:187–197. doi: 10.1007/s00125-004-1602-5. [DOI] [PubMed] [Google Scholar]
- 14.Solinas G, Karin M. JNK1 and IKKbeta: molecular links between obesity and metabolic dysfunction. FASEB J. 2010;24:2596–2611. doi: 10.1096/fj.09-151340. [DOI] [PubMed] [Google Scholar]
- 15.Weston CR, Davis RJ. The JNK signal transduction pathway. Curr Opin Cell Biol. 2007;19:142–149. doi: 10.1016/j.ceb.2007.02.001. [DOI] [PubMed] [Google Scholar]
- 16.Sabio G, Davis RJ. cJun NH2-terminal kinase 1 (JNK1): roles in metabolic regulation of insulin resistance. Trends Biochem Sci. 2010;35:490–496. doi: 10.1016/j.tibs.2010.04.004. [DOI] [PMC free article] [PubMed] [Google Scholar]
- 17.Kan M, Huang JS, Mansson PE, et al. Heparin-binding growth factor type 1 (acidic fibroblast growth factor): a potential biphasic autocrine and paracrine regulator of hepatocyte regeneration. Proc Natl Acad Sci U S A. 1989;86:7432–7436. doi: 10.1073/pnas.86.19.7432. [DOI] [PMC free article] [PubMed] [Google Scholar]
- 18.Nabel EG, Yang ZY, Plautz G, et al. Recombinant fibroblast growth factor-1 promotes intimal hyperplasia and angiogenesis in arteries in vivo. Nature. 1993;362:844–846. doi: 10.1038/362844a0. [DOI] [PubMed] [Google Scholar]
- 19.Wiedlocha A, Falnes PO, Rapak A, et al. Stimulation of proliferation of a human osteosarcoma cell line by exogenous acidic fibroblast growth factor requires both activation of receptor tyrosine kinase and growth factor internalization. Mol Cell Biol. 1996;16:270–280. doi: 10.1128/mcb.16.1.270. [DOI] [PMC free article] [PubMed] [Google Scholar]
- 20.Gonçalves LM. Fibroblast growth factor-mediated angiogenesis for the treatment of ischemia. Lessons learned from experimental models and early human experience. Portuguese J Cardiol. 1998;17(Suppl 2):II11–II20. [PubMed] [Google Scholar]
- 21.Banai S, Jaklitsch MT, Casscells W, et al. Effects of acidic fibroblast growth factor on normal and ischemic myocardium. Circ Res. 1991;69:76–85. doi: 10.1161/01.res.69.1.76. [DOI] [PubMed] [Google Scholar]
- 22.Wu JC, Huang WC, Tsai YA, et al. Nerve repair using acidic fibroblast growth factor in human cervical spinal cord injury: a preliminary Phase I clinical study. J Neurosurg Spine. 2008;8:208–214. doi: 10.3171/SPI/2008/8/3/208. [DOI] [PubMed] [Google Scholar]
- 23.Jonker JW, Suh JM, Atkins AR, et al. A PPARgamma-FGF1 axis is required for adaptive adipose remodelling and metabolic homeostasis. Nature. 2012;485:391–394. doi: 10.1038/nature10998. [DOI] [PMC free article] [PubMed] [Google Scholar]
- 24.Suh JM, Jonker JW, Ahmadian M, et al. Endocrinization of FGF1 produces a neomorphic and potent insulin sensitizer. Nature. 2014;513:436–439. doi: 10.1038/nature13540. [DOI] [PMC free article] [PubMed] [Google Scholar]
- 25.Perry RJ, Lee S, Ma L, et al. FGF1 and FGF19 reverse diabetes by suppression of the hypothalamic-pituitary-adrenal axis. Nat Commun. 2015;6:6980. doi: 10.1038/ncomms7980. [DOI] [PMC free article] [PubMed] [Google Scholar]
- 26.Rossini M, Cheunsuchon B, Donnert E, et al. Immunolocalization of fibroblast growth factor-1 (FGF-1), its receptor (FGFR-1), and fibroblast-specific protein-1 (FSP-1) in inflammatory renal disease. Kidney Int. 2005;68:2621–2628. doi: 10.1111/j.1523-1755.2005.00734.x. [DOI] [PubMed] [Google Scholar]
- 27.Baelde HJ, Eikmans M, Doran PP, et al. Gene expression profiling in glomeruli from human kidneys with diabetic nephropathy. Am J Kidney Dis. 2004;43:636–650. doi: 10.1053/j.ajkd.2003.12.028. [DOI] [PubMed] [Google Scholar]
- 28.Cuevas P, Martinez-Coso V, Fu X, et al. Fibroblast growth factor protects the kidney against ischemia-reperfusion injury. Eur J Med Res. 1999;4:403–410. [PubMed] [Google Scholar]
- 29.Yeboah J, Sane DC, Crouse JR, et al. Low plasma levels of FGF-2 and PDGF-BB are associated with cardiovascular events in type II diabetes mellitus (diabetes heart study) Dis Markers. 2007;23:173–178. doi: 10.1155/2007/962892. [DOI] [PMC free article] [PubMed] [Google Scholar]
- 30.Dronavalli S, Duka I, Bakris GL. The pathogenesis of diabetic nephropathy. Nat Clin Pract Endocrinol Metab. 2008;4:444–452. doi: 10.1038/ncpendmet0894. [DOI] [PubMed] [Google Scholar]
- 31.Barutta F, Corbelli A, Mastrocola R, et al. Cannabinoid receptor 1 blockade ameliorates albuminuria in experimental diabetic nephropathy. Diabetes. 2010;59:1046–1054. doi: 10.2337/db09-1336. [DOI] [PMC free article] [PubMed] [Google Scholar]
- 32.Karin M, Greten FR. NF-kappaB: linking inflammation and immunity to cancer development and progression. Nat Rev Immunol. 2005;5:749–759. doi: 10.1038/nri1703. [DOI] [PubMed] [Google Scholar]
- 33.Wan F, Lenardo MJ. The nuclear signaling of NF-kappaB: current knowledge, new insights, and future perspectives. Cell Res. 2010;20:24–33. doi: 10.1038/cr.2009.137. [DOI] [PMC free article] [PubMed] [Google Scholar]
- 34.Han MS, Jung DY, Morel C, et al. JNK expression by macrophages promotes obesity-induced insulin resistance and inflammation. Science. 2013;339:218–222. doi: 10.1126/science.1227568. [DOI] [PMC free article] [PubMed] [Google Scholar]
- 35.Liu G, Rondinone CM. JNK: bridging the insulin signaling and inflammatory pathway. Curr Opin Investig Drugs. 2005;6:979–987. [PubMed] [Google Scholar]
- 36.Pourghasem M, Shafi H, Babazadeh Z. Histological changes of kidney in diabetic nephropathy. Caspian J Intern Med. 2015;6:120–127. [PMC free article] [PubMed] [Google Scholar]
- 37.Border WA, Yamamoto T, Noble NA. Transforming growth factor beta in diabetic nephropathy. Diabetes Metab Rev. 1996;12:309–339. doi: 10.1002/(SICI)1099-0895(199612)12:4<309::AID-DMR171>3.0.CO;2-A. [DOI] [PubMed] [Google Scholar]
- 38.Manning AM, Davis RJ. Targeting JNK for therapeutic benefit: from junk to gold? Nat Rev Drug Discov. 2003;2:554–565. doi: 10.1038/nrd1132. [DOI] [PubMed] [Google Scholar]
- 39.Remuzzi G, Benigni A, Remuzzi A. Mechanisms of progression and regression of renal lesions of chronic nephropathies and diabetes. J Clin Invest. 2006;116:288–296. doi: 10.1172/JCI27699. [DOI] [PMC free article] [PubMed] [Google Scholar]
- 40.Kang YS, Lee MH, Song HK, et al. CCR2 antagonism improves insulin resistance, lipid metabolism, and diabetic nephropathy in type 2 diabetic mice. Kidney Int. 2010;78:883–894. doi: 10.1038/ki.2010.263. [DOI] [PubMed] [Google Scholar]
- 41.Stan D, Calin M, Manduteanu I, et al. High glucose induces enhanced expression of resistin in human U937 monocyte-like cell line by MAPK- and NF-κB-dependent mechanisms; the modulating effect of insulin. Cell Tissue Res. 2011;343:379–387. doi: 10.1007/s00441-010-1092-3. [DOI] [PubMed] [Google Scholar]
- 42.Bage T, Lindberg J, Lundeberg J, et al. Signal pathways JNK and NF-kappaB, identified by global gene expression profiling, are involved in regulation of TNFalpha-induced mPGES-1 and COX-2 expression in gingival fibroblasts. BMC Genomics. 2010;11:241. doi: 10.1186/1471-2164-11-241. [DOI] [PMC free article] [PubMed] [Google Scholar]
- 43.Nies VJ, Sancar G, Liu W, et al. Fibroblast Growth Factor Signaling In Metabolic Regulation. Front Endocrinol (Lausanne) 2015;6:193. doi: 10.3389/fendo.2015.00193. [DOI] [PMC free article] [PubMed] [Google Scholar]
- 44.Chen Q, Xu T, Li D, et al. JNK/PI3K/Akt signaling pathway is involved in myocardial ischemia/reperfusion injury in diabetic rats: effects of salvianolic acid A intervention. Am J Transl Res. 2016;8:2534–2548. [PMC free article] [PubMed] [Google Scholar]
- 45.Ongkudon CM, Chew JH, Liu B, et al. Chromatographic removal of endotoxins: a bioprocess engineer’s perspective. ISRN Chromatogr. 2012;2012:9. [Google Scholar]
- 46.Chen D. A new method for the analysis of bacterial endotoxins in ultrapure paraffin oil. J Anal Methods Chem. 2014;2014:575246. doi: 10.1155/2014/575246. [DOI] [PMC free article] [PubMed] [Google Scholar]
- 47.Huang Z, Lu M, Zhu G, et al. Acceleration of diabetic-wound healing with PEGylated rhaFGF in healing-impaired streptozocin diabetic rats. Wound Repair Regen. 2011;19:633–644. doi: 10.1111/j.1524-475X.2011.00722.x. [DOI] [PubMed] [Google Scholar]
- 48.van den Berg JG, van den Bergh Weerman MA, et al. Podocyte foot process effacement is not correlated with the level of proteinuria in human glomerulopathies. Kidney Int. 2004;66:1901–1906. doi: 10.1111/j.1523-1755.2004.00964.x. [DOI] [PubMed] [Google Scholar]
- 49.Song L, Zhu Y, Wang H, et al. A solid-phase PEGylation strategy for protein therapeutics using a potent FGF21 analog. Biomaterials. 2014;35:5206–5215. doi: 10.1016/j.biomaterials.2014.03.023. [DOI] [PubMed] [Google Scholar]
Associated Data
This section collects any data citations, data availability statements, or supplementary materials included in this article.
Supplementary Materials
Figure S1. The serum FGF1 levels of experimental mice at an early stage of diabetes. (A) FGF1 concentration in mouse serum from 7-week-old db/m and db/db (T2D) mice. Data are presented as the mean ± SEM. **P < 0.01 versus db/m (N=9). (B) FGF1 concentration in mouse serum from 9-week-old C57BL/6 mice and T1D mice induced by treatment with STZ for 4 weeks. Data are presented as the mean ± SEM; ***P < 0.001 versus Ctrl, N = 9. Ctrl, control; FGF1, fibroblast growth factor 1; STZ, streptozotocin; T1D, type 1 diabetes; T2D, type 2 diabetes.
Figure S2. The immunofluorescent double-staining for FGF1 and different cell type–specific markers in renal tissue of normal C57L/B6 mice and STZ-induced diabetic mice. (A) Immunofluorescent double-staining for FGF1 (green color) and SMA (red color), which was used as a cell marker of mesangial cells in renal tissue. (B) Immunofluorescent double-staining for FGF1 and Wilms tumor 1, which was used as a cell marker of podocytes in renal tissues. (C) Immunofluorescent double-staining for FGF1 and aquaporin 1, which was used as a cell marker of tubular epithelial cells in renal tissues. (D) Immunofluorescent double-staining for FGF1 and CD68 (red color), which was used as a cell marker of macrophages in renal tissue. Overlapping staining (yellow color) is indicated by arrowheads in merged images. The renal tissue was isolated from normal C57BL/6 mice and T1D mice induced by treatment with STZ for 13 weeks, respectively; shown are representative images of 3 mice from each group. Bar = 50 μm. AQP1, aquaporin 1; Ctrl, control; DAPI, 4′,6-diamidino-2- phenylindole; FGF1, fibroblast growth factor 1; SMA, smooth muscle actin; STZ, streptozotocin; T1D, type 1 diabetes; WT1, Wilms tumor 1.
Figure S3. The expression of FGF1 in the cultured cells exposed to low or high glucose. (A) Mesangial cells. (B) Mouse podocytes. Data are presented as the mean ± SEM. *P < 0.05, **P < 0.01 versus Ctrl, N = 3. Ctrl, control; FGF1, fibroblast growth factor 1; HG, high glucose; MPC, mouse podocyte; SV40, mesangial cells.
Figure S4. The levels of FGF1 in kidneys of diabetic mice with or without FGF1 treatment. (A,B) Representative Western blot analysis and densitometric quantification of FGF1 expression in renal tissue from 20-week-old db/m, db/db, and db/db+FGF1 mice; data are normalized to GAPDH and presented as mean ± SEM. ##P < 0.01, ###P < 0.001 versus db/m group; **P < 0.01, ***P < 0.001 versus db/db group, N = 6. (C,D) Representative Western blot analysis and densitometric quantification of FGF1 in renal tissue from normal C57BL/6 (Ctrl), T1D, and T1D+FGF1 mice; data are normalized to GAPDH and presented as mean ± SEM. #P < 0.05, ###P < 0.001 versus Ctrl group; *P < 0.01, *** P < 0.001 versus T1D group, N = 6. (E) The tissue distribution of FGF1 examined in Sprague Dawley (SD) rats. Values are presented as mean ± SEM, N = 10. Ctrl, control; FGF1, fibroblast growth factor 1; GAPDH, glyceraldehyde-3-phosphate dehydrogenase; T1DM, type 1 diabetes mellitus.
Figure S5. (A,B) Densitometric quantification of renal fibrosis and electron micrographs of renal tissue from the experimental mice. The quantitative assessment of renal fibrosis calculated from Masson trichrome–stained kidneys in db/db (A) and T1D (B) mice. The assessment of renal fibrosis was quantified using ImageJ software (NIH, Bethesda, MD). Data are presented as the mean ± SEM; ##P < 0.01 versus nondiabetic control; **P < 0.01 versus diabetic mice, N = 3. (C,D) Ultrastructure of glomeruli of db/m (control), db/db (T2D), FGF1 (db/db+FGF1) groups (C) and of control (Ctrl), T1D, and FGF1 (T1D+FGF1) groups (D). Disruption and irregular podocyte foot process (blue arrows) and basement membrane thickening (red arrows) observed in db/db (C) and T1D (D) mice were suppressed by treatment with FGF1. Original magnification × 20,000; bar = 1 μm. (E,F) Analysis of podocyte foot process effacement in the type 2 diabetes groups (db/m, db/db, db/db+FGF1) (E), and T1D groups (Ctrl, T1D, T1D+FGF1) (F). Data are presented as the mean ± SEM; #P < 0.05, ##P <0.01 versus nondiabetic control; *P < 0.05 versus diabetic mice, N = 3. Ctrl, control; FGF1, fibroblast growth factor 1; T1D, type 1 diabetes.
Figure S6. Effects of fibroblast growth factor 1 (FGF1) on plasminogen activator inhibitor-1 (PAI-1) and monocyte chemoattractant protein-1 (MCP-1) in renal tissue of experimental mice. (A) Representative Western blot analysis accompanied by densitometric quantification of PAI-1 and MCP-1 from renal tissue of db/m (Ctrl), db/db (T2D), and FGF1 (db/db+FGF1) groups. (B) The corresponding mRNA of PAI-1 and MCP-1 from renal tissue of the same groups. (C,D) Parallel evaluation of kidney tissue from Ctrl, T1D, and FGF1 (T1D+FGF1) groups for protein (D) and mRNA (E). Data are presented as the mean ± SEM; #P < 0.05, ##P < 0.01, and ###P < 0.001 versus nondiabetic control; *P < 0.05, **P < 0.01, and ***P < 0.001 versus diabetic mice, N = 7–9. Ctrl, control; GAPDH, glyceraldehyde-3-phosphate dehydrogenase; T1DM, type 1 diabetes mellitus.
Figure S7. Effects of FGF1 and JNK-specific inhibitor SP600125 on high glucose (HG)-induced inflammation in mesangial cells. (A,B) Glomerular mesangial cells were pretreated with FGF1 (1, 10, or 100 ng/ml) for 2 hours, followed by treatment with HG 25 mM for an additional 24 hours and (A) mRNA and (B) Western blot analysis for TGF-β1 were determined. Data are presented as the mean ± SEM. ###P < 0.001 versus LG (low glucose control); *P < 0.05 and **P < 0.01 versus HG group; N = 3. (C,D) Glomerular mesangial cells were pretreated with SP600125 (10 μM), followed by treatment with HG, 25 mM for an additional 24 hours, and cells were collected for the following determination: (C) TNF-α mRNA from LG, HG, and SP600125 (HG+SP600125) treatment groups. Data shown as the mean ± SEM; #P < 0.05 versus LG; **P < 0.01 versus HG group, N = 3; (D) Western blot analysis for JNK phosphorylation (p-JNK), unphosphorylated JNK as loading control; IκBα degradation, GAPDH as loading control; nuclear NF-κB p65 subunit, lamin B as loading control. FGF1, fibroblast growth factor 1; GAPDH, glyceraldehyde-3-phosphate dehydrogenase; HG, high glucose; LG, low glucose; NF-κB, nuclear factor κB; TGFβ1, transforming growth factor β1; TNF-α, tumor necrosis factor α.
Figure S8. Effects of FGF1 and SP600125 on TNF-α–induced signaling. TNF- α induced (1 μg/ml for 30 minutes) activation of NF-κB and JNK in mesangial cells pretreated with FGF1 (1, 10, or 100 ng/ml for 1 hour) or SP600125 (10 μM for 1 hour). The nuclear and cytosolic NF-κB p65 subunit were detected by Western blot using the respective lamin B and GAPDH as loading controls. Cyt, cytosolic; FGF, fibroblast growth factor 1; GAPDH, glyceraldehyde-3-phosphate dehydrogenase; NF-κB, nuclear factor-κB; Nuc, nuclear; TNF-α, tumor necrosis factor- α.
Figure S9. Effect of FGF1 on ameliorating podocyte apoptosis. (A) Representative images of a TUNEL assay showing the podocyte apoptosis induced by 24-hour incubation with HG (25 mM) could be ameliorated by treatment with FGF1 in a dose-dependent manner. (B) TUNEL staining quantification by counting the apoptotic cells out of the total cells in each image. Data are presented as the mean ± SEM. ##P < 0.01 versus Ctrl. *P < 0.05 and **P < 0.01 versus HG group; N = 5. Ctrl, control; FGF, fibroblast growth factor 1; HG, high glucose; TUNEL, transferase-mediated dUTP nick end-labeling.
Table S1. Clinical information in diabetic subjects with diabetic nephropathy and nondiabetic normal subjects.