

Summary
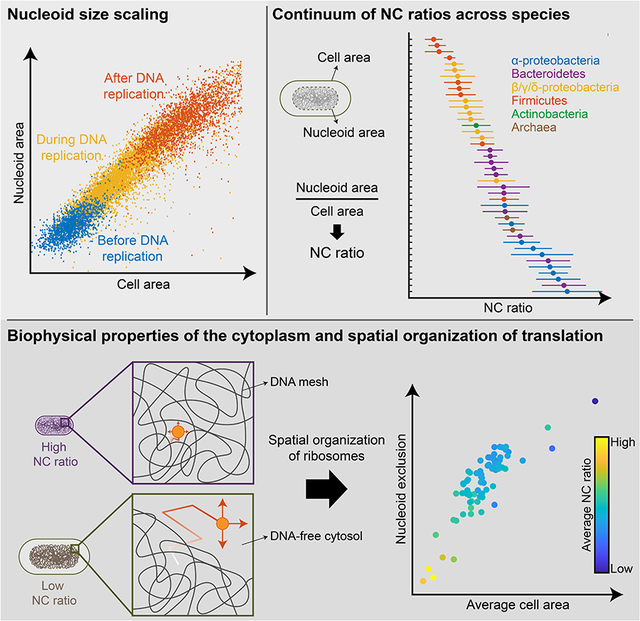
The scaling of organelles with cell size is thought to be exclusive to eukaryotes. Here, we demonstrate that similar scaling relationships hold for the bacterial nucleoid. Despite the absence of a nuclear membrane, nucleoid size strongly correlates with cell size, independent of changes in DNA amount and across various nutrient conditions. This correlation is observed in diverse bacteria, revealing a near-constant ratio between nucleoid and cell size for a given species. As in eukaryotes, the nucleocytoplasmic ratio in bacteria varies greatly among species. This spectrum of nucleocytoplasmic ratios is independent of genome size, and instead appears linked to the average population cell size. Bacteria with different nucleocytoplasmic ratios have a cytoplasm with different biophysical properties, impacting ribosome mobility and localization. Together, our findings identify new organizational principles and biophysical features of bacterial cells, implicating the nucleocytoplasmic ratio and cell size as determinants of the intracellular organization of translation.
Keywords: Nucleoid, nucleocytoplasmic ratio, scaling properties, cell size, ribosome mobility, intracellular organization
Graphical Abstract
In brief
Different bacterial species have different, characteristic nucleocytoplasmic ratios, impacting the biophysical properties of the cytosol and the spatial distribution of translation machinery
Introduction
The spatial organization of the cell has a profound effect on various cellular processes from bacteria to humans (Bisson-Filho et al., 2018; Diekmann and Pereira-Leal, 2013; Harold, 2005; Surovtsev and Jacobs-Wagner, 2018). In eukaryotic cells, a distinctive feature of intracellular organization is the nucleus, a membrane-enclosed organelle that harbors most of the cell′s genetic material. The nuclear envelope hereby spatially confines the genetic material and physically separates transcription and translation. While the sizes of cells and nuclei vary considerably among species and tissues, there is a remarkable linear size scaling relationship between the cell and the nucleus for a given cell type, which was first reported over 100 years ago (Conklin, 1912; Woodruff, 1913). Correlations between cell size and nuclear size are not only widespread among eukaryotic cells but also robust to genetically-and nutritionally-induced cell size perturbations (Jorgensen et al., 2007; Neumann and Nurse, 2007). This scaling property results in a constant ratio between nuclear and cellular volumes, also known as the karyoplasmic or nucleocytoplasmic (NC) ratio (Wilson, 1925). Why cells maintain a specific NC ratio is generally not well understood, though alterations in NC ratios have been associated with aging and diseases such as cancer (Capell and Collins, 2006; Chow et al., 2012; Prokocimer et al., 2009; Zink et al., 2004). The sizes of other cellular components such as nucleoli, vacuoles, mitotic spindles, centrosomes and mitochondria have also been shown to scale with cell size in various eukaryotic cell types (Levy and Heald, 2012; Marshall, 2015; Reber and Goehring, 2015). As such, these scaling properties are believed to be unique to eukaryotes.
In bacteria, the chromosomal DNA typically occupies a subcellular region called the nucleoid (Kellenberger et al., 1958; Mason and Powelson, 1956). Recently, we showed that the average size of the nucleoid scales with the average size of the cell across ~4,000 gene-deletion mutants of Escherichia coli (Campos et al., 2018). In addition, nucleoid size and cell size in E. coli correlate at the single-cell level, at least under specific growth conditions (Junier et al., 2014; Paintdakhi et al., 2016). An intuitive explanation for these observations may be linked to differences in DNA amount. Even under nutrient-poor conditions, DNA replication happens during a large part of the cell cycle, such that larger cells tend to contain more DNA. This is exacerbated in nutrient-rich conditions under which E. coli displays overlapping DNA replication cycles (Cooper and Helmstetter, 1968). This leads to a continuous increase in DNA content from cell birth to division. Recent work with mutants of altered cell widths further suggests that the amount of DNA in such rapidly growing cells is directly coupled to cell volume (Shi et al., 2017). However, whether the scaling of nucleoid size with cell size is exclusively linked to changes in DNA content remains to be established. It is also currently unclear whether a scaling relationship between nucleoid and cell size is robust across growth conditions or widespread among bacteria. At the same time, it is unclear whether the size of the nucleoid or the volume fraction it occupies within the cell has any physiological consequence. We address all of these unknowns below.
Results
Nucleoid size scaling is robust across a wide range of cell sizes in E. coli
Given that different nutrient conditions give rise to cells of different sizes (Pierucci, 1978; Schaechter et al., 1958), we used phase contrast and fluorescence microscopy to examine how cell size variation in exponentially growing E. coli may affect nucleoid size across 30 nutrient conditions (M9 medium supplemented with different carbon sources ± casamino acids and thiamine, see Table S1). Cell contours were detected and curated in an automated fashion using the open-source software package Oufti (Paintdakhi et al., 2016) and a support vector machine model (see STAR Methods). For each condition, the areas of thousands of cells were quantified from the cell contours (Figure 1A and S1A). DAPI-stained nucleoids were detected using the objectDetection module of Oufti, from which we extracted the total area occupied by the DAPI signal (Figure 1A). Since estimation of the nucleoid area can vary with the chosen objectDetection parameters (e.g., contour rigidity and relative signal threshold), we used the same parameter values across growth conditions.
Figure 1. Nucleoid size scaling is robust across a wide range of E. coli cell sizes.

A. Phase contrast and DAPI images of E. coli cells (CJW6324) grown in liquid cultures of M9 medium supplemented with 0.2% mannose (M9mann) or 0.2% glucose, 0.1% casamino acids and 1 μg/ml thiamine (M9gluCAAT) at 37 °C. The images were processed with Oufti to identify the contours of the cells (green) and nucleoids (purple, insets).
B. Density contour plots showing the strong correlation between cell area and nucleoid area for individual CJW6324 cells grown in the indicated growth media (for a full description of the growth media, see Table S1). The contour lines represent the 0.10, 0.25, 0.50 and 0.75 probability envelopes of the data.
C. Bar graph showing the power-law scaling exponent extracted from the slope of the linear fit in the log-log plot (dotted line in insets) between cell area and nucleoid area for the indicated growth media. Colors correspond to those used in Figure 1B. Insets: density contour plots on a log-log scale for E. coli cells (CJW6324) grown in M9mann or M9gluCAAT. The contour lines represent the 0.10, 0.25, 0.50 and 0.75 probability envelopes of the data.
D. Scatter plot of the average cell area versus the average nucleoid area for the indicated growth conditions. Inset: scatter plot of the average cell area versus the average NC ratio for the same growth conditions. Error bars indicate 95% confidence intervals.
See also Figures S1, S2 and S3.
Using this methodology, we observed a strong correlation (Kendall correlation τ ≥ 0.77) between the cell area and nucleoid area of individual cells within all 30 tested growth conditions (Figure 1B). Nucleoid area and cell area scaled linearly, as confirmed by a power-law exponent (slope of the linear fit on the log-log plot) close to 1 in all conditions (Figure 1C). This isometric scaling relationship implies that nucleoid area and cell area are directly proportional and increase in size at the same rate (Huxley, 1924). Our results also show that the nucleoid size scaling property is robust across a wide range of growth rates, with doubling times varying from ~40 min to ~4 h (Figure S1B). For each condition, the nucleocytoplasmic (NC) ratio (nucleoid area divided by cell area) was independent of the total or normalized intensity of the DAPI signal per cell (Figures S2A and S2B), and was therefore unaffected by variations in DAPI staining efficiency. Moreover, we observed identical scaling relationships between nucleoid and cell area for nucleoids labeled with an mCherry or CFP fusion to a subunit of the nucleoid-associated HU complex (Figures S3A–S3C). The scaling between the cell area and the total nucleoid area was preserved in filamentous cells obtained by treatment with cephalexin (Figure S3D), a drug that inhibits cells division without affecting growth and DNA replication (Boye and Lobner-Olesen, 1991; Rolinson, 1980). The scaling relationship in these filamentous cells was almost indistinguishable from that in untreated cells (Figure S3D). These observations indicate that nucleoid size scaling occurs independently of cell division and persists across a wide range of cell sizes and growth conditions.
At the population level, we also observed a strong correlation (τ = 0.85) between the mean cell area and the mean nucleoid area of untreated cells across the tested 30 growth conditions (Figure 1D). This relationship was robust to variations in the objectDetection parameter that sets the rigidity of the nucleoid contours (from smooth to highly irregular) (Figure 1D vs. Figure S2C). Interestingly, in all cases, the relationship between average nucleoid area and average cell area was not perfectly linear, as the average NC ratio (calculated by dividing the nucleoid area by the cell area for each cell and averaging the obtained NC ratios across all cells) slightly decreased with increasing average cell size (Figure 1D, inset). This small decrease, which will be addressed later, was not a consequence of differences in growth medium osmolality (Figure S1C), which can cause variations in nucleoid morphology (Cagliero and Jin, 2013).
Nucleoid size scaling is independent of DNA replication
We next investigated whether changes in DNA content underlie the scaling of nucleoid size with cell size by using nutrient-poor growth conditions. In such environments, E. coli cells display discrete cell cycle periods, known as the B, C, and D periods, corresponding to cell-cycle phases before, during, and after DNA replication, respectively (Cooper and Helmstetter, 1968). If DNA replication was solely responsible for nucleoid size scaling, we would expect to observe a correlation between nucleoid and cell size only during the C period, and not during the B and D periods when the DNA amount does not change. As cell size and the DAPI signal intensity did not provide sufficient resolution to distinguish between cells in the B, C, and D periods (Figure S3E), we used a strain producing a SeqA-mCherry fusion. SeqA associates with newly replicated DNA by transiently binding hemi-methylated GATC sites (Brendler et al., 1995; Lu et al., 1994; Slater et al., 1995). When fluorescently tagged (Adiciptaningrum et al., 2015; Helgesen et al., 2015; Molina and Skarstad, 2004; Wallden et al., 2016) (Figure 2A), SeqA forms bright fluorescent foci that trail the replication forks during DNA replication (C period). In the absence of DNA replication (B and D periods), SeqA-mCherry displays diffuse nucleoid-associated fluorescence. By quantifying the relative area of the SeqA-mCherry signal and combining this information with cell area measurements, we were able to identify three distinct groups of cells—corresponding to the B, C, and D cell cycle periods—in populations growing under various nutrient-poor conditions (Figures 2A and S3F). Surprisingly, we found a strong correlation of nucleoid area with cell area for all three periods (Figures 2B and S3F). The correlations and slopes were the strongest in the C period under all 11 tested nutrient-poor conditions, but both remained significant during the B and D periods (Figures 2B, S3F and S3G). Apart from these small differences between cell cycle periods, we observed similar average NC ratios for each period within a growth condition (Figure S3G). These results indicate that the scaling between nucleoid and cell size occurs independently of DNA replication.
Figure 2. Nucleoid size scaling with cell size does not depend on DNA replication.

A. Density scatter plot (left) and density contour plot (right) of cell area versus the relative SeqA-mCherry signal area of E. coli cells (CJW6324) grown in M9gly medium. The gray scale in the density scatter plot indicates the relative density of dots (cells) in a given area of the chart. This plot was used to identify cells in the B, C and D cell cycle periods found under these growth conditions. The contour lines represent the 0.10, 0.25, 0.50 and 0.75 probability envelopes of the data. Insets: representative images of the subcellular SeqA-mCherry signal in a specific cell cycle period.
B. Density contour plots of cell area versus nucleoid area for cells in B, C and D periods based on the analysis shown in panel A. The contour lines represent the 0.10, 0.25, 0.50 and 0.75 probability envelopes of the data. The nucleoid was detected by DAPI staining. See also Figure S3.
C. Frequency distributions of genome equivalents per cell for the indicated strains after a replication run-out experiment, performed 90 min after temperature shift from 30 to 37 °C. Wild-type cells grown in M9gly undergo a single cycle of DNA replication per division cycle and were included as a control to estimate the DAPI intensities corresponding to 1 and 2 genome equivalents.
D. Representative fluorescence images of dnaC2 cells (strain CJW6370, growing in M9gluCAAT) producing HU-mCherry after a shift to a restrictive temperature (37 °C).
E. Plot showing the average nucleoid area per cell area bin for HU-mCherry-labeled dnaC2 cells at 37 °C. Cells (n = 12268) from different time points (90–300 min) following temperature shift were combined into one dataset and grouped into bins based on their cell areas. Shown are the average nucleoid area and standard deviation (SD) of each cell area bin. The solid grey line indicates the expected relationship between nucleoid and cell area based on the scaling observed under permissive conditions (30 °C). The dotted lines indicate the 99% confidence interval (CI) of the fit.
To confirm this unexpected conclusion, we used temperature-sensitive dnaC2 mutant cells producing an HU-mCherry fusion to visualize the nucleoids. Upon shift to the restrictive temperature, these cells fail to initiate new rounds of DNA replication and complete ongoing replication rounds in under 60 min (Carl, 1970; Withers and Bernander, 1998). As a result, they divide into single-chromosome-containing cells, which continue to elongate without dividing or replicating their DNA. We found that 90 min after a shift to the restrictive temperature (37 °C), the average cell size of the dnaC2 population began increasing, indicative of complete DNA replication arrest. Consistent with this notion, rifampicin run-out experiments at the 90-min timepoint confirmed that dnaC2 cells harbor a single chromosome, unlike the parent strain under the same conditions (Figure 2C). Therefore, we quantified the size of both cells and nucleoids from 90 min to 300 min post temperature shift. Remarkably, the size of the nucleoid increased with cell size over an almost 4-fold range before reaching a plateau in long cells (Figures 2D and 2E). Before reaching this limit, the scaling relationship in the absence of DNA replication was similar to that observed under the permissive temperature (30 °C) when DNA replication occurs (Figure 2E). Together, these observations demonstrate that nucleoid size scaling occurs irrespective of changes in DNA content.
The nucleoid size scaling property is conserved in Caulobacter crescentus, but with a different NC ratio
To examine whether a scaling relationship between nucleoid and cell size is observed in other bacteria, we imaged C. crescentus cells producing mCherry-labeled HU and CFP-labeled DnaN. DnaN is the β-sliding clamp of the DNA polymerase, which, when fluorescently labeled, forms foci during DNA replication but otherwise displays a disperse distribution (Arias-Cartin et al., 2017; Collier and Shapiro, 2009; Fernandez-Fernandez et al., 2013). By quantifying the signal area of DnaN-CFP, we were able to readily identify cells in distinct cell-cycle periods (Figure 3A). As with E. coli (Figure 2B), we observed a strong scaling relationship between nucleoid size and cell size in cells in the B and D periods (Figure 3B), indicating that nucleoid size scaling occurs even in the absence of DNA replication. Nucleoid size determination in C. crescentus was independent of mCherry signal intensity (Figure S4A) and insensitive to the nucleoid labeling method (Figure S4B). Scaling was maintained in defined (M2G) and complex (PYE) growth media (Figure S4B), as well as in mutants with altered cell sizes and morphologies (Figures S4C and S4D), such as FtsZ-depleted, ΔrodZ and Δhfq cells (Alyahya et al., 2009; Irnov et al., 2017; Wang et al., 2001).
Figure 3. Nucleoid size scaling is also observed in C. crescentus, a bacterium with a different NC ratio.

All contour lines represent the 0.10, 0.25, 0.50 and 0.75 probability envelopes of the data.
A. Density contour plot of cell area versus the relative DnaN-CFP signal area of C. crescentus cells (CJW5969) grown in M2G. This plot was used to identify cells in the B, C and D cell cycle periods. Insets: representative images of the subcellular DnaN-CFP signal in a specific cell cycle period.
B. Density contour plots of cell area versus nucleoid area for cells in panel A. The nucleoid was detected by HU-mCherry labeling.
C. Density contour plots of cell area versus NC ratio for E. coli (CJW6324) and C. crescentus (CJW5969) cells grown in M9gly and M2G, respectively. The nucleoid was detected by DAPI staining for E. coli and by HU-mCherry labeling for C. crescentus.
See also Figure S4.
Nucleoid size scaled with cell size in both E. coli and C. crescentus. However, their NC ratios were very different (Figure 3C). This is consistent with observations that the nucleoid spreads through most of the cell in C. crescentus whereas E. coli displays DNA-free regions (Jensen and Shapiro, 1999; Kellenberger et al., 1958). The large NC ratio in C. crescentus was not due to PopZ-mediated attachment of the chromosome to the cell poles (Bowman et al., 2008; Ebersbach et al., 2008), as it was maintained in the ΔpopZ mutant (Figure S4D and S4E).
Nucleoid size scaling across bacterial phyla reveals a continuum of NC ratios
The scaling relationship between nucleoid and cell size is likely a common bacterial feature, as we observed isometric scaling in over 35 species from different phyla or classes (Figures 4A, 4B and S5A). Each investigated species displayed a constant, specific NC ratio (Figure 4C). To avoid measurement biases, we used the same Oufti parameters to identify the nucleoid contour of all cells in this dataset. As with E. coli and C. crescentus, we confirmed that the NC ratio was not affected by the intensity of the DNA signal (Figure S6A and S6B). We also observed no correlation between the average DNA signal intensity and the average NC ratio (Figure S6C). The various species were generally grown in complex media described in the literature or recommended by the provider. In some cases, we examined different growth conditions. For example, we imaged Bacteroides thetaiotaomicron (B. theta) grown in vitro in both complex (TYG) and defined (GMM) media, or in vivo in mono-associated gnotobiotic mice. For the latter, the samples were obtained from the cecum and feces. These different growth conditions revealed differences in cell sizes but, in all cases, nucleoid size scaled with cell size at the single-cell level (Figure 4A).
Figure 4. Nucleoid size scaling across bacterial species from different phyla reveals a continuum of NC ratios.

A. Density contour plots of cell area versus nucleoid area for fixed cell populations from different bacterial species. The contour lines represent the 0.10, 0.25, 0.50 and 0.75 probability envelopes of the data. When different growth conditions were examined for the same species, the growth medium is indicated next to the species name. Contours of the same color indicate affiliation to the same phylum or class. The DNA dye used for nucleoid labeling for each species is detailed in the STAR Methods.
B. Frequency distribution of power-law scaling exponents between cell area and nucleoid area for all the included species.
C. Average NC ratio (with error bars representing the standard deviation) for all the included species.
D. Density contour plots of cell area versus nucleoid area for live H. volcanii cells grown in YPC and CAB medium. The contour lines represent the 0.10, 0.25, 0.50 and 0.75 probability envelopes of the data. The nucleoid was detected by SYBR green staining.
See also Figures S5 and S6.
The name “nucleoid” (nucleus-like) comes from the early observation that the bacterial chromosome occupies a distinct intracellular region (Kellenberger et al., 1958; Mason and Powelson, 1956), as exemplified by the organization of the γ-proteobacterium E. coli (Figure 1A). The near-cell-filling organization of the chromosome in the α-proteobacterium C. crescentus is usually ignored or thought of as an exception (Campos and Jacobs-Wagner, 2013; Surovtsev and Jacobs-Wagner, 2018). Analysis of the average NC ratios across our panel of diverse species revealed that high average NC ratios (i.e., near-cell-filling nucleoids) can be found not only in other α-proteobacteria but also in some Bacteroidetes (Figure 4C). Furthermore, there was no subdivision of the analyzed bacteria into discrete lower and higher NC ratio categories. Instead, we observed a continuum of average NC ratios across species (Figure 4C). To extend these observations even further, we also imaged the archaeon Haloferax volcanii. This halophilic organism changes its cell shape across growth conditions, from pleiomorphic in rich medium (YPC) to more rod-like in casamino acids medium (CAB) (Duggin et al., 2015). Under both growth conditions (Figure S5A), we observed strong isometric scaling between nucleoid area and cell area at the single-cell level (Figure 4D). This suggests that the size scaling between the DNA organelle and the cell is observed across all three domains of life.
While sorting species based on their average NC ratios revealed some phylogenetic clustering (Figure 4C), phylum association was not necessarily predictive of NC ratio. For example, α-proteobacteria generally had a higher NC ratio than proteobacteria from the β, γ, or δ classes (Figure 4C). Bacteroidetes provided a striking example of distinct chromosome organization within a phylum. Cellulophaga algicola displayed a high NC ratio, characteristic of (almost) cell-filling DNA, whereas Parabacteroides distasonis exhibited a considerably lower NC ratio and clear DNA-free regions (Figures 4C and S5A). These results indicate that the intracellular organization of the chromosome is an evolvable feature that varies significantly between species without strict phylogenetic determinants.
The average NC ratio negatively correlates with the average cell size
Given this surprisingly large spectrum of average NC ratios among species, we wondered whether certain cellular characteristics are associated with a given NC ratio. We found no correlation between genome size and average NC ratio (or average nucleoid area, or cell area), despite a ~3-fold difference in genome size between the included species (Figure S5B). Growth rate was also a poor predictor of NC ratios. Fast-growing species such as E. coli (in LB), Bacillus subtilis (in LB) and B. theta (in TYG medium), which have doubling times of ~20 to ~30 min at 37 °C (Eley et al., 1985; Taheri-Araghi et al., 2015; Weart et al., 2007) displayed a wide range of NC ratios, whereas the NC ratio of the slower-growing Myxococcus xanthus (in CYE medium), which has a doubling time of ~4 h (Sun et al., 1999), was similar to that of E. coli growing in LB.
We did, however, observe a striking power law between the average cell area and the average nucleoid area (Figure 5A). This non-linear relationship was characterized by a scaling exponent of 0.6, as shown in the log-log plot. As a consequence, we also observed a strong negative relationship between the average NC ratio and the average cell area that could be described by a power law with a scaling exponent of −0.4 (Figure 5B). These power laws indicate that the average cell size of a species is highly predictive of the average nucleoid area (τ = 0.75) and thus average NC ratio (τ = −0.65). We also observed strong relationships between other morphological descriptors and the NC ratio (Figure S6D). Remarkably, the E. coli data from cultures grown under 30 different nutrient conditions (Figure 1D) almost perfectly followed the power-law scaling obtained with the different species (Figures 5A and 5B, insets). Thus, the negative relationship between average NC ratio and average cell size observed under varying growth conditions (Figure 1D, inset) appears to be a consequence of a more general scaling law between these two population-level characteristics.
Figure 5. The average NC ratio is linked to the average cell size.

For all plots, error bars indicate 95% confidence intervals. Linear fits on the log-log plots are indicated as dotted lines together with the obtained slope (i.e., the power-law scaling exponent).
A. Scatter plot of average cell area versus average nucleoid area for all the included species. Abbreviated species names are indicated next to the corresponding datapoint; see Key Resources Table for a full name description. Inset: same relationship on a log-log scale.
B. Scatter plot of average NC ratio versus average cell area for all the included species. Inset: same relationship on a log-log scale.
The cytoplasm of bacteria with different NC ratios displays different biophysical properties
What are the physiological implications of a high or low NC ratio? We speculated that DNA might affect the dynamics, and thereby the organization, of large cellular components whose diffusion may be impeded by the DNA meshwork. In bacteria with low NC ratios like E. coli, large objects may be able to more freely diffuse in DNA-free regions. In contrast, motion may be limited in bacteria with high NC ratios like C. crescentus where the DNA spreads throughout most of the cytoplasm. To test this idea, we conducted experiments using genetically-encoded GFP-μNS particles, which are useful probes to interrogate the biophysical properties of the bacterial cytoplasm (Parry et al., 2014), in E. coli and C. crescentus. These probes derive from a mammalian reovirus protein that assembles into spherical objects (Broering et al., 2005; Broering et al., 2002). Once fused to GFP, they form fluorescent particles that increase in signal intensity and absolute size with increased GFP-μNS synthesis (Parry et al., 2014). We tracked GFP-μNS particles from three bins of particles of similar intensity (and, consequently, size) in both E. coli and C. crescentus (Figures 6A and S7A, Movies S1 and S2). Comparison of the ensemble-averaged mean squared displacements (MSDs) for particles belonging to these bins revealed drastic differences in probe dynamics between the two species (Figure 6B and Figure S7B). GFP-μNS particles in C. crescentus, independent of their size range, displayed significantly lower mobility than in E. coli. Diffusion measurements of free GFP are similar in these two species (Elowitz et al., 1999; Montero Llopis et al., 2012), indicating that a difference in cytoplasmic viscosity cannot explain these observations. Instead, these observations support the notion that different NC ratios can lead to different biophysical properties of the cytoplasm, affecting the mobility of large cytoplasmic objects.
Figure 6. The intracellular mobility of large objects displays non-linear dynamics and is different between E. coli and C. crescentus.

A. Frequency distributions of GFP-μNS spot intensities in E. coli (CJW6723, n = 2142) and C. crescentus (CJW6917, n = 2279) cells. E. coli cells were grown in M9gly and C. crescentus cells in M2G. Three bins of GFP-μNS particles with similar intensities and thus sizes are indicated in color.
B. Ensemble-averaged MSDs of GFP-μNS particles (belonging to the intensity bins highlighted in panel A) in E. coli cells (n = 1208, 600 and 200 for bins 1, 2 and 3, respectively) and C. crescentus cells (n = 837, 984 and 374 for bins 1, 2 and 3, respectively). Lighter-colored lines indicate 95% confidence intervals.
C. Ensemble-averaged MSDs of fluorescently-labeled ribosomes in E. coli (CJW6768, M9glyCAAT) and C. crescentus (CJW5156, M2G) at different acquisition frame intervals. For each frame interval, > 1248 trajectories were collected. Only the first four points of the MSDs are shown for each frame interval. Error bars indicate 95% confidence intervals.
D. Same as in panel C, except that ensemble-averaged MSDs from rifampicin-treated cells (2 h incubation with 50 and 200 μg/ml of rifampicin for C. crescentus and E. coli, respectively) were added for comparison. For each frame interval, > 2535 trajectories were collected in rifampicin-treated cells. For these MSDs, only the first six points are shown for the 10 ms and 50 ms frame intervals. The color scheme for the frame intervals is the same as in panel C. Error bars indicate 95% confidence intervals.
E. Plot showing the apparent diffusion coefficients calculated from the aforementioned MSDs as a function of the frame interval.
F. Same data as in panel C, but on a log-log scale. Line with a slope of 1 was added for comparison.
G. Ensemble analysis showing average ribosomal fluorescence recovery over time (up to 450 s) of cephalexin-treated E. coli cells (CJW4677) and FtsZ-depleted C. crescentus cells (CJW3821) following photobleaching of about half the cell. Errors bars indicate standard deviation. For each species, ribosomal recovery was quantified across a cell segment of 3 μm in 6 cells.
H. Representative plots showing the evolution of the ribosomal fluorescence recovery over time (up to 450 s) along the length of a cephalexin-treated E. coli cell (CJW4677) and an FtsZ-depleted C. crescentus cell (CJW3821) following photobleaching of about half of the cell. The dotted line shows the fluorescence profile prior to bleaching.
See also Figure S7.
Ribosome dynamics differ in bacteria with different NC ratio
What large cytoplasmic components may be impacted by differences in NC ratio? Under the conditions we used, GFP-μNS particles have reported sizes between 50 and 200 nm (Parry et al., 2014), a similar size range as polysomes (Brandt et al., 2009), which are mRNAs loaded with multiple ribosomes (Miller et al., 1970; Warner et al., 1962). If polysome mobility is impacted by the DNA meshwork and the fraction of cellular space it occupies, it may explain a currently unresolved discrepancy in mRNA localization in the literature. Fluorescence in situ hybridization (FISH) microscopy experiments on several mRNAs in C. crescentus suggest that these mRNAs remain close to their corresponding gene loci throughout most of their lifetime (Montero Llopis et al., 2010). In contrast, a genome-wide FISH study in E. coli revealed no spatial enrichment of mRNAs near the corresponding chromosomal regions (Moffitt et al., 2016). Because translation starts on nascent mRNAs, polysomes are expected to form within the nucleoid. However, in E. coli, the low NC ratio creates DNA-free regions in which polysomes may potentially more freely diffuse once they escape the DNA meshwork, leading to their dispersion. Conversely, the high NC ratio of C. crescentus might prevent the escape of polysomes from the DNA meshwork.
To test this hypothesis, we used photoactivated localization microscopy to track ribosomes in both E. coli and C. crescentus. For this, we used a fluorescent protein fusion to the ribosomal subunit protein RplA. In both cases, the fusion replaced the wild-type copy of the ribosomal gene at its native chromosomal locus (Lim et al., 2014; Sanamrad et al., 2014). As the majority of ribosomes (~75–80%) are engaged in translation in both organisms (Forchhammer and Lindahl, 1971; Lin et al., 2004; Montero Llopis et al., 2012; Phillips et al., 1969; Varricchio and Monier, 1971), most of our trajectories likely reflected polysome dynamics. Importantly, we acquired data at five different frame intervals (between 10 and 200 ms). We reasoned that polysomes diffusing in a DNA meshwork may experience local caging behaviors, as observed for probes diffusing in gels (Brangwynne et al., 2009; Cai et al., 2011; Guo et al., 2014; Wong et al., 2004). Tracking at multiple frame rates may reveal such non-linear dynamics (Bronstein et al., 2009; Hajjoul et al., 2013). This approach differs from previous single-molecule ribosome tracking experiments in which molecule mobility was characterized based on data acquired at a single timeframe (Bakshi et al., 2012; Bayas et al., 2018; Sanamrad et al., 2014; Zhu et al., 2019).
For both E. coli and C. crescentus, we constructed individual MSDs for each frame interval (> 1248 trajectories per frame interval, Figure S7C), and then stitched together the first four points of these MSDs to generate combined MSD plots (Figure 6C). These MSDs revealed that polysomes in C. crescentus displayed lower mobility than those in E. coli, especially at the longer (subsecond) timescales (Figure 6C). The difference in MSDs was not due to polysomes “experiencing” cell membrane confinement sooner in C. crescentus because of its smaller size than E. coli, as higher MSD values were obtained in both organisms following treatment with the transcription initiation inhibitor rifampicin (Figures 6D and S7D). Rifampicin treatment results in mRNA depletion, thus converting all polysomes into faster, free ribosomes (Blundell and Wild, 1971) that explore more cellular space in the same amount of time (Figures 6D and S7D). This finding demonstrates that at the subsecond timescale, cell size does not limit polysome mobility in either organism, and that cell confinement is not responsible for the observed mobility difference between the two species.
In these types of experiments, an apparent diffusion coefficient (Da) is usually extracted from the slope of the first few time lags of the MSD plot using the equation MSD = 4Datα (Bouchaud and Georges, 1990). This is done under the implicit assumption that diffusion is approximately normal under the considered timescale (anomalous exponent α ~1). The extracted Da value is then typically assumed to be time-independent and meaningful at other timescales. However, the change in slope across time intervals in the combined MSD plots suggests that this assumption is incorrect for polysomes (Figure 6C). This is evident from the striking dependency of Da on the timeframe used (Figure 6E). In both E. coli and C. crescentus, Da decreased with longer timescales and the difference in Da between these organisms increased with increasing time intervals (Figure 6E). In addition, the log-log MSD plots revealed that the slope, which is commonly used to extract α (as MSD(t) ∝ tα (Bouchaud and Georges, 1990)), is not only smaller than 1, but is also consistently lower in C. crescentus in comparison to E. coli (Figure 6F). These results indicate that ribosomes, the majority of which are found within polysomes, display non-linear dynamics and are much more confined in the high NC ratio bacterium C. crescentus than in the low NC ratio bacterium E. coli.
In single-molecule tracking experiments, the frame interval is usually very short (< 200 ms) for technical reasons. However, the lifetime of most bacterial mRNAs is on the minute timescale (Chen et al., 2015; Kristoffersen et al., 2012; Moffitt et al., 2016; Redon et al., 2005). Given the time-dependency of ribosome dynamics, we anticipated that the difference in spatial exploration of ribosomes between E. coli and C. crescentus would be even more apparent at the physiologically relevant timescale of minutes. This is indeed what we observed in fluorescence recovery after photobleaching (FRAP) microscopy experiments (Figures 6G and 6H). To minimize the effects of cell geometry and photobleaching location on the observed fluorescence recovery, we used filamentous cells that were unable to divide due to cephalexin treatment (E. coli) or FtsZ depletion (C. crescentus), as routinely done (Elowitz et al., 1999; Montero Llopis et al., 2012). In these filamentous cells, the NC ratio remained the same as in normal sized cells (Figures S3D, S4C and S4D). Due to the heterogenous distribution of the ribosomal signal in E. coli, we were unable to quantify ribosome diffusion with a simple one-or two-state diffusion model, but we did observe clear differences in ribosomal fluorescence recovery between the two species (Figures 6G and 6H, Movies S3 and S4). E. coli cells showed significant (> 70%) fluorescence recovery at the photobleaching location after 450 s while C. crescentus cells recovered little (< 25%) of their prebleached fluorescence intensity within the same time frame (Figures 6G and 6H).
Intracellular organization of translation is associated with the NC ratio and cell size
The decreased mobility of polysomes in C. crescentus is consistent with the notion that the near-cell-filling nucleoid impedes polysome motion in this species. In E. coli, on the other hand, polysomes display higher mobility likely because they can diffuse more freely and accumulate in DNA-free regions once they escape the DNA meshwork. This raises the intriguing possibility that the difference in NC ratio and its impact on ribosome mobility contribute to the striking difference in spatial organization of ribosomes and thus translation between these two organisms. In E. coli, as in other bacteria with low NC ratios like Bacillus subtilis and Lactococcus lactis, ribosomes are enriched in the nucleoid-free regions of the cytoplasm (Azam et al., 2000; Bakshi et al., 2012; Lewis et al., 2000; Robinow and Kellenberger, 1994; van Gijtenbeek et al., 2016), resulting in partial segregation of transcription and translation. In C. crescentus and Sinorhizobium meliloti, two bacteria with high NC ratios, a large physical separation of ribosomes and DNA is not observed, as both are found throughout the cytoplasm (Bayas et al., 2018; Montero Llopis et al., 2010).
If the NC ratio does indeed affect the spatial organization of translation, we may expect to already see changes in ribosome localization in E. coli cells grown in different nutritional environments that lead to small variations in NC ratios (Figure 1D, inset). To test this expectation, we used E. coli strains carrying a fluorescent protein fusion (msfGFP or mEos2) to a ribosomal protein (RplA or RpsB). These strains were grown under a broad range of growth conditions that result in slightly varying NC ratios. Although nucleoid exclusion of ribosomes was observed in all strains under each growth condition, the exclusion was more pronounced in cells with smaller average NC ratios (see examples in Figure 7A). We quantified the average nucleoid exclusion of ribosomes by calculating the signal correlation factor (SCF), a metric that measures the correlation between two fluorescent signals (see STAR Methods). An SCF of 1, 0 and −1 indicates that the two signals display perfect co-localization, independent localization and exclusion, respectively. We restricted the calculation of SCF to a specific “correlation area” within individual cells (Figure S7E) to minimize the effects of cell size and geometry on the correlation (see STAR Methods). This quantification across 26 growth media with varying NC ratios confirmed the gradual increase (τ = 0.63) in ribosome exclusion with decreasing NC ratio, as evidenced by the more negative average SCF values (Figure 7B). This resulted in a strong negative correlation (τ = −0.56) between the average SCF and the average cell area across the conditions for E. coli cells (Figure 7B) given the negative correlation between average NC ratio and average cell size (Figure 1D).
Figure 7. The spatial organization of ribosomes in bacteria is linked to the average NC ratio and the average cell size.

A. Top, representative fluorescence images of E. coli cells (CJW6769) grown in M9gly or M9gluCAAT. Bottom, fluorescence intensity profiles of DAPI and RpsB-mEos2 signals for these cells.
B. Scatter plots of average SCF versus average NC ratio (left) or versus average cell area (right) for E. coli cells producing RpsB-mEos2 (CJW6769), RplA-msfGFP (CJW7020) or RpsB-msfGFP (CJW7021) fusions, grown in the indicated growth media (for a full description of the growth media, see Table S1). The SCF was calculated by comparing the correlation between the DAPI and the ribosomal signals for the indicated strains. Error bars indicate 95% confidence intervals.
C. Representative phase contrast and fluorescence images of E. coli cells (CJW4677) after the FISH procedure, highlighting the correspondence between the use of RplA-GFP and FISH (targeting 16S ribosomal RNA with the Cy5-labeled EUB338 probe) for visualizing ribosome localization. Cells were grown in M9glyCAAT.
D. Fluorescence intensity profiles of DAPI, RplA-GFP, and rRNA FISH (Cy5-EUB338) signals of E. coli cells (CJW4677) indicated in panel C.
E. Frequency distributions of SCF values between the rRNA FISH (Cy5-EUB338), RplA-GFP, and DAPI signals.
F. Scatter plots of average SCF versus average NC ratio (left) or versus average cell area (right). The SCF was calculated by comparing the correlation between the DAPI and the rRNA FISH (Cy5-EUB338) signals for the indicated species. Included are the E. coli data described in panel B, after correction for the fixation effect on the SCF values (see STAR Methods, indicated by ** in the legend). Error bars indicate 95% confidence intervals.
See also Figure S7.
Given the continuum of NC ratios among diverse species (Figure 4C), we may also expect to see differences in ribosome localization among species with varying NC ratios. To examine this possibility, we performed FISH microscopy on 11 different species using a Cy5-labeled EUB338 probe complementary to the 5′ domain of 16S rRNA (Amann et al., 1990). This probe is complementary to the majority of eubacterial species sequenced and provides a method to visualize bulk ribosome localization in diverse species. As a control, we first performed SCF quantification for an E. coli strain producing fluorescently labeled ribosomes. This test revealed that cell fixation, a necessary step of the FISH procedure, slightly affects ribosome localization, thereby artificially increasing the SCF value (Figure S7F). Despite this caveat, we still observed nucleoid exclusion of ribosomes and strong colocalization between the ribosome signals obtained from the fluorescent labeling (using RplA-GFP) and the FISH procedure (using Cy5-EUB338) at the single-cell and population levels (Figures 7C–7E), validating our FISH method. For the 11 species tested, we found that the SCF obtained by FISH correlates positively with the average NC ratio and thus negatively with the average cell area (Figure 7F). In other words, the greater the average size of the species, the smaller its average NC ratio and the more ribosomes were excluded from the nucleoid. These relationships were conserved not only across species but also across various nutritional growth conditions. This is shown by the multi-media E. coli data falling within the same trend as the multi-species data (Figure 7F), once the live-cell measurements were adjusted for the fixation effect on SCF values (Figure S7F). Altogether, our findings suggest a continuum of ribosome organization across bacteria and identify the average NC ratio and cell size of a species in a given growth medium as good predictors of how this bacterium spatially organizes translation.
Discussion
Although the first reports of scaling relationships in eukaryotes between the size of subcellular components and that of the cell date back more than 100 years (Conklin, 1912; Marshall, 2015; Wilson, 1925; Woodruff, 1913), this phenomenon has remained largely unexplored in bacteria. Here, we demonstrate that nucleoid size strongly scales with cell size in exponentially growing cultures across a wide range of cell sizes, growth conditions and species (Figures 1, 2, 3, 4, S3 and S4). Despite the apparently conserved nature of nucleoid size scaling, we found a continuum of NC ratios across species (Figure 4C), which can be predicted from the average cell size of the bacterial population (Figure 5B). We highlight important biological implications of having a different NC ratio for the mobility and localization of larger particles such as polysomes (Figures 6 and 7), thereby implicating the NC ratio and cell size as important determinants of the intracellular organization of bacterial translation (Figure 7).
In eukaryotes, the size scaling of membrane-less organelles has been linked to phase transitions (Brangwynne, 2013). For example, evidence suggests that the formation of the nucleolus is driven by a liquid-liquid phase separation and its scaling with cell size is the direct result of the nucleolus component concentration remaining constant during cell growth (Brangwynne et al., 2011; Uppaluri et al., 2016; Weber and Brangwynne, 2015). This is because the cell synthesizes nucleolus components at the same rate as it expands its cytoplasmic volume. A similar mechanism cannot, however, explain how nucleoid size scales with cell size without changes in DNA content (Figures 2B, 2E, 3B and S3F). This is in line with findings in yeast cells in which an increase in DNA amount does not directly lead to an increase in nuclear size (Jorgensen et al., 2007; Neumann and Nurse, 2007). Instead, nuclear structural components, nucleocytoplasmic transport and nuclear envelope expansion have all been implicated in regulating nuclear size in eukaryotes (Hara and Merten, 2015; Jevtic et al., 2014; Kume et al., 2017; Levy and Heald, 2010). The fact that the scaling of the DNA organelle extends to bacteria (and at least one archaeon), which lack a nuclear envelope, indicates that this property is an ancient and basic cellular feature. It also implies that this scaling arises regardless of the way the genome is packaged into the cell (i.e., independently of a nuclear membrane or histones). In this context, bacteria offer attractive model systems for studying how the DNA itself, and not just the nuclear membrane, follows this scaling principle.
Although nucleoid size scaling is widespread among bacteria, the resulting NC ratios vary considerably (Figure 4C). Here again, this is similar to what is observed in eukaryotes where the NC ratio varies greatly among cell types (Ganguly et al., 2016; Jevtic and Levy, 2015; Jorgensen et al., 2007; Kume et al., 2017; Lim et al., 2015; Neumann and Nurse, 2007; Novakova et al., 2016). We found no link between NC ratio and chromosome size or growth rate of a given species (Figure S5B). Instead, we discovered a remarkable relationship between the average cell size of a population and its average NC ratio, as the latter strongly correlated with morphological metrics that reflect average cell size (Figures 5B and S6D). Although the relationship is strongest for the average cell area and volume, the strong correlations with other size-related variables (average cell width, length, surface-area-to-volume ratio) currently preclude us from associating the NC ratio with a specific morphological feature. It is important to note that while the relationship between average cell size and average NC ratio has predictive value at the population level, it does not extend to the single-cell level. This is evident from the maintenance of the NC ratio over the course of a cell cycle (Figure 1) and is further exemplified by the fact that an overlap in cell size between C. crescentus and E. coli does not lead to an overlap in NC ratio at the single-cell level (Figure 3C). These findings indicate that although a general relationship between average cell size and the NC ratio exists, the latter is controlled by factors other than cell size at the single-cell level.
Importantly, our work suggests that differences in NC ratio among species and across growth conditions (Figures 1D and 4C) have physiological implications. By comparing the motion of ribosomes in E. coli and C. crescentus, we found that their mobility is significantly decreased in cells with high NC ratios. Given that cytoplasmic viscosity is similar in E. coli and C. crescentus based on GFP diffusion measurements (Elowitz et al., 1999; Montero Llopis et al., 2012), this reduction likely arises because the diffusion of polysomes is impeded by the DNA meshwork. This difference was most pronounced on longer timescales due to the time-dependent properties of ribosome motion (Figures 6C–6H). These non-linear dynamics of polysomes suggest that the DNA affects the biophysical properties of the bacterial cytoplasm. Polysomes and other similarly sized objects likely experience local caging when they encounter the DNA mesh. An implication of such non-linear dynamics is that apparent diffusion coefficients become timescale-dependent variables. As a result, their interpretation without considering physiologically relevant timescales and the α value can be misleading. At short frame rates, polysomes may not diffuse far enough to be “aware” that they are within a DNA meshwork. As a result, the calculated Da value in E. coli and C. crescentus may be relatively close to each other, consistent with previous determinations (Bakshi et al., 2012; Bayas et al., 2018; Sanamrad et al., 2014). This could lead to the interpretation that ribosome dynamics are the same in these organisms. We show that this is true only at the millisecond timescale, a timescale at which polysomes primarily experience protein crowding, which is similar in the two species (Elowitz et al., 1999; Montero Llopis et al., 2012). As the timescale increases, the calculated Da values decrease as polysomes increasingly experience the DNA mesh. This highlights the non-linear biophysical properties of the bacterial cytoplasm and stresses the importance of making diffusion measurements at different length-and timescales.
The decrease in diffusibility over time is most dramatic in C. crescentus (Figure 6E) where, unlike in E. coli, polysomes cannot escape the DNA meshwork because it fills most of the cell. By themselves, the differences in ribosome mobility in E. coli and C. crescentus could be attributed to other factors (e.g., fraction of nascent vs. mature mRNAs) than a difference in NC ratio between the two species. However, the decreased mobility of genetically encoded GFP-μNS particles in C. crescentus (in comparison to E. coli) supports our interpretation that different NC ratios give rise to different physical properties of the cytoplasm and have widespread implications for large cellular components and their associated processes. The reduction of polysome mobility in C. crescentus explains why mRNAs remain in close proximity to their corresponding gene loci in this organism (Montero Llopis et al., 2010). In E. coli, on the other hand, polysomes would be able to escape the nucleoid due to the lower NC ratio, after which their increased mobility would lead to a more dispersed mRNA localization, as recently shown (Moffitt et al., 2016). Based on this interpretation, we anticipate that the NC ratio of a given bacterium, together with the lifetime of the mRNA, will dictate whether protein synthesis from this mRNA primarily occurs near the gene locus where the mRNA was transcribed, or away from it.
In eukaryotes, the term cytosol is used to designate the part of the cytoplasm that is not held by organelles. We propose that a similar distinction can be made in bacteria. Even without a membrane-enforced separation, the nucleoid (organelle) provides a distinct biophysical environment from the DNA-free region of the cytoplasm (cytosol). The spectrum of NC ratios across species (Figure 4C) suggests that the cytosolic fraction of a bacterial cell is far from fixed, and is instead an evolvable feature. Although the NC ratio depends on the growth conditions for a given species, the actual fluctuations between conditions are small in comparison to the entire spectrum observed across species (Figure 5B, inset). This observation may reflect unappreciated evolutionary constraints on intracellular organization and cell size for a given bacterial species.
STAR Methods
CONTACT FOR REAGENT AND RESOURCE SHARING
Further information and requests for resources and reagents should be directed to and will be fulfilled by the Lead Contact, Christine Jacobs-Wagner (Christine.Jacobs-Wagner@yale.edu).
EXPERIMENTAL MODEL AND SUBJECT DETAILS
Bacterial strains and growth conditions
Construction of strains and plasmids is detailed in Table S2.
To obtain steady-state growth conditions, cells were first inoculated in the appropriate growth medium and grown to stationary phase in culture tubes. Cells were subsequently re-inoculated into fresh medium by diluting them 1/10000 or more, and grown until they reached an optical density at 600 nm (OD600) of 0.1–0.3 (depending on the growth medium and organism) before sampling for microscopy.
E. coli cells were grown in LB medium (30°C), gut microbiota medium (GMM; 30°C) (Goodman et al., 2011) or M9 medium (37°C) supplemented with 0.2% carbon source and, in certain instances, with 0.1% casamino acids and 1 μg/ml thiamine (CAAT). C. crescentus cells were grown at 30°C either in PYE medium or M2G medium. Sinorhizobium meliloti (30°C), Pseudomonas syringae (30°C), Janthinobacterium lividum (25°C), and Burkholderia thailandensis (30°C) were grown in LB medium. Rhizobium leguminosarum, Agrobacterium tumefaciens, Asticcacaulis excentricus, Chryseobacterium indologenes, Brevundimonas subvibrioides, Brevundimonas bacteroides, and Brevundimonas diminuta were grown at 30°C in PYE medium. Vibrio harveyi and Vibrio fischeri were grown at 30°C in LBS medium. Myxococcus xanthus and Flavobacterium johnsoniae were grown at 30°C in CYE medium. Hirschia rosenbergii was grown at 30°C in marine broth medium (Difco, Fisher Scientific). Cellulophaga algicola was grown at 30°C in DSMZ Medium 172. Cytophaga hutchinsonii was grown at 25°C in CYE medium supplemented with 1% glucose. Bacillus subtilis, Bacillus megaterium, Lysinibacillus sphaericus, and Paenibacillus polymyxa were grown at 30°C in nutrient broth medium. Haloferax volcanii was grown at 42°C in YPC medium and at 37°C in CAB medium. Bacteroides ovatus, Bacteroides thetaiotaomicron, Bacteroides xylanisolvens, Parabacteroides distasonis, Chromobacterium violaceum, Providencia alcalifaciens, Roseburia intesinalis, Anaerostipes sp., Clostridium boltae, Clostridium hathewayi, Lactobacillus reuteri, and Collinsella aerofaciens were grown at 37 °C in GMM (Goodman et al., 2011). B. theta was also grown at 37 °C in TYG medium (Bacic and Smith, 2008). Fixed B. theta cells isolated from the cecum and fecal matter of monocultured mice were a kind gift of the Andrew Goodman laboratory (Yale University). All cells that were grown in GMM or TYG medium were cultured anaerobically. The exact composition of all growth media is detailed in Table S1.
Cephalexin treatment of E. coli cells was performed by first growing the cells in the indicated growth medium as described above. Steady-state cultures were subsequently exposed to cephalexin (50 μg/ml) for a period of time corresponding to about two doublings of an unexposed population (1 to 6 h, depending on the growth medium) and then imaged. For FtsZ depletion in C. crescentus, CJW3821 cells carrying ftsZ under the xylose-inducible promoter were grown to an OD660 of ~0.1 at 30°C in PYE medium containing 0.3% xylose for proper FtsZ synthesis. Cells were then spun down (5000 × g for 5 min) and washed with fresh PYE containing no xylose. FtsZ depletion was then performed by growing cells in PYE at 30°C for 3–6 h.
METHOD DETAILS
Microscopy
Unless otherwise indicated, cells were imaged on agarose (1%) pads supplemented with the appropriate growth medium. For most experiments live cells were used, except for Figures 4A and 5 for which cells were first fixed with 4% formaldehyde and for Figures 7C–7F for which cells were fixed and permeabilized for FISH microscopy (see below).
Phase contrast and epifluorescence imaging was performed on a Nikon Ti-E microscope equipped with a 100× Plan Apo 1.45 NA phase contrast oil objective (Carl Zeiss), an Orca-Flash4.0 V2 142 CMOS camera (Hamamatsu), and a Spectra × light engine (Lumencor). The microscope was controlled by the Nikon Elements software. The following Chroma filter sets were used to acquire fluorescence images: DAPI (excitation ET350/50×, dichroic T400lp, emission ET460/50m), CFP (excitation ET436/20×, dichroic T455lp, emission ET480/40m), GFP (excitation ET470/40×, dichroic T495lpxr, emission ET525/50m), YFP (excitation ET500/20×, dichroic T515lp, emission ET535/30m), mCherry/TexasRed (excitation ET560/40×, dichroic T585lpxr, emission ET630/75m) and Cy5.5 (excitation ET650/45×, dichroic T685lpxr, emission ET720/60m). Specialized microscopy setups used for FRAP experiments and single-particle or single-molecule tracking are detailed below.
Rifampicin run-out experiments
These experiments were performed to demonstrate the absence of DNA replication in dnaC2 cells (CJW6370) 90 min after the shift to the restrictive temperature. CJW6370 cells were grown at 30 °C in M9gluCAAT to exponential phase, shifted to 37 °C for 90 min and then treated for 3 h with 30 μg/ml cephalexin and 300 μg/ml rifampicin prior to overnight fixation in 70% ethanol at 4 °C. Cells were washed twice with phosphate-buffered saline (PBS, 8.0 g/l NaCl, 0.2 g/l KCl, 1.44 g/l Na2HPO4 and 0.24 g/l KH2PO4) and then stained with DAPI (1 μg/ml) prior to imaging on a PBS-containing agarose pad. Simultaneously, cells from the parent strain (MG1655) were subjected to the same growth protocol to contrast their number of ongoing replication cycles with that of dnaC2 cells. As E. coli cells display non-overlapping rounds of DNA replication in nutrient-poor conditions such as M9gly (Figures 2A and S3F), this condition was included as a control to estimate the DAPI intensities corresponding to 1 and 2 genome equivalents.
GFP-μNS experiments
For GFP-μNS experiments in E. coli, we used a published protocol (Parry et al., 2014). Briefly, E. coli strain CJW6723 was grown at 30 °C in M9gly to an OD600 = 0.05–0.1. The synthesis of GFP-μNS was induced by the addition of 200–500 μM IPTG for 60–120 min. After induction, cells were spun down (5000 × g for 5 min) and washed with fresh M9gly medium and grown for at least 60 min to allow for GFP maturation. For experiments in C. crescentus, strain CJW6917 was grown at 30 °C in M2G to an OD660 = 0.05–0.1. GFP-μNS synthesis was induced by the addition of 0.3% xylose to the medium for 30–120 min. After induction, cells were spun down and washed with fresh M2G medium and grown for at least 60 min to allow for GFP maturation. Cells were then spotted on 1.5% agarose pads containing M9gly (E. coli) or M2G (C. crescentus) and imaged every 2 s at 30 °C.
Photoactivated localization and single-molecule tracking experiments
For photoactivated localization microscopy and single-molecule (ribosome) tracking, cover slips and glass slides were washed in the following manner: sonication in 1 M KOH (15 min), sonication in milliQ H2O (15 min) and sonication in 70% ethanol (15 min) with 3–5 milliQ H2O rinses between wash solution changes. Cleaned glass slides and cover slips were then dried with pressured air. Cells were spotted on an agarose pad made with M9glyCAAT for E. coli or M2G for C. crescentus. Imaging was performed with an objective heat ring set at 30 °C. All images were acquired on an N-STORM microscope (Nikon) equipped with a CFI Apo TIRF 100× oil immersion objective (NA 1.49), lasers (Agilent Technologies) emitting at 405 nm (0–0.5%) and 561 nm (15–100%), and a built-in Perfect Focus system. Raw single-molecule data were taken at a frame rate of 100 to 5 frames per second in a field of view of 128 × 128 pixels with an Andor iXon X3 DU 897 EM-CCD camera (Andor Technology). Exposure time was kept constant at 10 ms for all experiments. Rifampicin treatment was performed by exposing cells to 200 μg/ml (E. coli) or 50 μg/ml (C. crescentus) rifampicin for 2 h in liquid culture before sampling and imaging.
Fluorescence recovery after photobleaching experiments
For the FRAP experiments, filamentous cells (generated either by a 2 h treatment with 50 μg/ml cephalexin for E. coli or a 3–6 h FtsZ depletion in C. crescentus) were spotted on 1.5% agarose pads with M9glyCAAT or PYE. Cells were imaged at room temperature (~22 °C) with a Nikon E80i microscope equipped with 100× Plan Apo 1.45 NA phase contrast objective and an Andor iXonEM+ DU-897 camera controlled by the Metamorph software. Fluorescence photobleaching was performed using a Photonic Instrument Micropoint laser system at 488 nm. Cells were imaged once before photobleaching, then bleached (for ~0.5 s), and subsequently imaged at equal intervals (3–6 s for 450 s depending on whether E. coli or C. crescentus was imaged).
Fluorescence in situ hybridization experiments
For FISH experiments, E. coli cells were grown in LB medium at 30 °C, C. crescentus cells were grown in PYE medium at 30 °C, and the other bacterial species were grown as described above. FISH was performed similarly to previous methods described by our laboratory (Kim and Jacobs-Wagner, 2018; Montero Llopis et al., 2010). Briefly, exponentially growing cells (OD600 < 0.3) were transferred to a fixing solution (4% formaldehyde and 30 mM sodium phosphate buffer (1 M NaH2PO4 and 1 M Na2HPO4, pH 7.4), final concentration) for 15 min at room temperature followed by 30 min on ice. The samples were spun down (5000 × g for 3 min) and washed in PBS treated with diethyl pyrocarbonate (DEPC) 3 times. The cell pellets were resuspended in DEPC-treated PBS and adhered to poly-L-lysine-coated coverslips. Cells were then lysed with 70% ethanol for 5 min at room temperature. Pre-hybridization was then performed with a 40% formamide, 2× saline-sodium citrate solution (SSC, 300 mM NaCl, 30 mM sodium citrate, pH 7.0) containing 0.2 mM vanadyl ribonucleoside complex (VRC) for 2 h at 37 °C. Immediately afterwards, hybridization was performed with EUB338 (5′-GCTGCCTCCCGTAGGAGT-3′, 5′-monolabeled with Cy5) in a solution containing 4 nM EUB338, 40% formamide, 2× SSC, 0.2 mM VRC, 10% dextran sulfate, 0.1% bovine serum albumin, and 0.4 mg/ml E. coli tRNA. Hybridization proceeded for 16 h at 37 °C and was then washed 5 × with wash solution (50 % formamide, 2× SSC) and 10× with DEPC-treated PBS. Finally, 1 μg/ml DAPI was added to the coverslip, which was then mounted on a glass slide for imaging.
DNA dye labeling
For live cells, the nucleoid was visualized by incubating 1 μg/ml DAPI with cells in their growth medium for 10 min. Due to a lack of labeling efficiency with DAPI in live cells of some of the species that were studied, all species for Figure 4 and 5 (with the exception of E. coli in different conditions) were fixed using the same fixation procedure as for the FISH experiments (4 % formaldehyde solution for 15 min at room temperature and 30 min on ice). They were then washed three times with 1 × PBS and spun down at 5000 × g. Fixed A. excentricus, A. tumefaciens, B. subvibrioides, C. algicola, C. hutchinsonii, H. rosenbergii, B. bacteroides, B. diminuta, C. indologenes, F. johnsoniae, M. xanthus, P. syringae, R. leguminosarum, S. meliloti and C. crescentus were stained with 1 × SYBR Green. Fixed B. theta, B. ovatus, V. harveyi and P. distasonis were stained with 1 μg/ml DAPI. Fixed B. megaterium, C. violaceum, J. lividum, V. fischeri, B. subtilis, B. thailandensis, E. coli, Anaerostipes sp., B. xylanisolvens, C. aerofaciens, C. hathewayi, L. reuteri, P. alcalifaciens, R. intestinalis, C. boltae, L. sphaericus and P. polymyxa were stained with 1 μg/ml Hoechst 33342. Live H. volcanii cells were stained with 1 × SYBR Green.
Image processing
Cell outlines were generated using the open-source image analysis software Oufti (Paintdakhi et al., 2016). Nucleoids were detected using Oufti’s objectDetection module. Parameters for nucleoid detection were optimized based on their overall performance across species. Since estimation of the nucleoid area can vary with the chosen parameter values, we used the same nucleoid detection parameters for all image datasets (Manual background threshold = 0.2; Background subtraction method = 3; Background subtraction threshold = 0.1; Background filter size = 8; Smoothing range (pixels) = 3; Magnitude of LOG filter = 0.1; Sigma of PSF = 1.62; Fraction of object in cell = 0.4; Minimum object area = 50), with a single exception (see below). Note that irregularities in nucleoid shape, which are more prominent under nutrient-rich growth conditions, may potentially bias the determination of NC ratios by overestimating the nucleoid area. Importantly, if such a bias were indeed to be present, the NC ratios would be expected to increase with increasing cell sizes as these cells typically display more irregular nucleoid shapes (Figure 1A). Since we observe the opposite relationship (Figures 1C and 5B), this potential bias is unlikely to affect our findings or conclusions.
One experiment required optimizing our nucleoid detection pipeline. Elongation of dnaC2 cells under restrictive conditions (related to Figures 2C–E) led to a decrease in the fraction of nucleoid-bound HU-mCherry signal. To overcome this, we used an adjusted nucleoid detection function: Nucleoid_Detection_High_Background.m that uses MATLAB built-in functions to threshold and identify nucleoids within Oufti cell meshes (see Supplemental Information for the code).
SeqA-mCherry signal information was added to E. coli cell lists using the MATLAB function Add_SeqA_Area.m. DnaN-CFP information was added to C. crescentus cell lists using the MATLAB function Add_DnaN_Area.m.
Support Vector Machine model for curation of cell outlines
In similar fashion as before (Campos et al., 2018), we used an automated approach to identify poor and incorrect cell detections across our datasets. We trained a support vector machine (SVM) model based on 11 normalized phase-contrast features: cell length, cell volume, integrated phase signal, mean cell contour intensity, minimum cell contour intensity, maximum curvature of cell contour, minimum inflated cell contour intensity, mean intensity gradient across the cell contour, maximum variability in contour intensity, mean variability in contour intensity and maximum cell pixel intensity. We visually scored 20265 cells and used 30% of them (6080 cells) to train the SVM model. The model was evaluated using a k-fold cross-validation approach, leading to a generalized misclassification rate of 9.9%. We used the remaining 70% of the dataset (14185 cells) to validate the model. The SVM classifier achieves a balanced classification rate of 90.9% and features an AUROC of 0.9640. The SVM model underperformed for species (e.g., C. crescentus) and mutants (e.g., dnaC2 at the restrictive temperature) with morphologies that deviated significantly from E. coli’s typical rod shape. Therefore, in these instances, we resorted to visual inspection and curation of the obtained cell contours.
Growth rate measurements
Growth rates were measured in 96-well plates in a Synergy2 microplate reader (BioTek). Cultures were first grown to stationary phase and re-inoculated into 150 μl fresh medium (1/300). Cultures were subsequently grown for 60 h at 37 °C with OD600 measurements every 4 min. The maximal growth rate was extracted from the obtained growth curves by fitting the Gompertz function (Zwietering et al., 1990).
Osmolality measurements
Osmolality of growth media was measured using a Precision Systems 6002 Touch Micro OSMETTE-osmometer, which uses the freezing point method for osmolality measurements. All measurements were conducted in duplicate.
QUANTIFICATION AND STATISTICAL ANALYSIS
Cellular characteristics
Properties of individual cells (cell and nucleoid dimensions, DAPI fluorescence intensity, fluorescent marker behavior, etc.) were extracted from cell lists obtained from Oufti using the MATLAB function Extract_Cell_Properties.m. Morphological features (e.g., cell length, width, area, and volume) were determined by summing the dimensions of each individual segment of the cell mesh identified by Oufti. See https://oufti.org/ for more details.
Correlation coefficients
Kendall correlation coefficients between variables were calculated using MATLAB’s built-in corr function.
Unconstrained linear fits
Unconstrained linear fits were performed using MATLAB′s built-in polyfit function.
Nucleoid exclusion of ribosomes
The extent of ribosome exclusion was determined by calculating the signal correlation factor (SCF) between the DNA and ribosome signals. For each individual cell, the SCF was calculated by examining a specific “correlation area”, corresponding to an intracellular region determined by two user-specified parameters. The restriction of the calculation to this area was required to ensure optimal correlation calculations for cells with different shapes and sizes as the smaller cytoplasmic volume at the cell poles and the cell periphery leads to a general decrease in fluorescent signal which, in turn, artificially generates positive biases in the calculation of the SCF. The first parameter was the number of pixels, starting from the cell poles, to exclude from the calculation. The second parameter was the number of pixels, starting from the cell centerline, to include in the calculation. Together, these parameters defined the correlation region for which the correlation between pixel values was determined. Different combinations of these two parameters were scanned for each growth condition and species, and parameters were chosen by finding the minimal average SCF. The minimal average SCF was selected to avoid the positive SCF biases introduced by the cell poles and periphery. The following MATLAB functions were used for this analysis:, Pixel_Correlation_Parallel.m, Cell_Pixel_Correlation.m, Cell_Projection.m, Pixel_Correlation_Multiple_Experiments_Scan.m, Extract_Cell_Pixels.m, and Taylor_Smooth.m.
In Figure 7F, to compare the SCF results obtained for E. coli by live-cell imaging with the SCF values obtained for different species by FISH microscopy, the live-cell SCF values (Figure 7B) were adjusted for the artificial increase in SCF values caused by cell fixation. Specifically, the average increase in SCF (0.225) observed after fixation of E. coli cells with 4% formaldehyde (Figure S7F) was added to the average SCF values obtained in live cells.
Mean squared displacements of GFP-μNS particles
Cell meshes obtained from Oufti were used to limit particle localization to the region within cells and prevent spurious trajectory linking between cells. Particle localization was performed using the function uNS_Particle_Tracking.m to fit a 2D Gaussian to filtered images.
Mean squared displacements of single ribosomal particles
Particle locations determined using the uTrack package (Jaqaman et al., 2008) were linked into trajectories based on a previously described algorithm (Crocker and Grier, 1996). Briefly, the most likely trajectories were constructed by minimizing the sum of squared particle displacements between two consecutive frames. Trajectories of lengths smaller than five displacements were removed. Mean squared displacements (MSD) at various time delays were then calculated from individual trajectories. For each frame interval, an ensemble-averaged MSD was obtained by averaging individual MSD curves weighted by the corresponding trajectory lengths. For each MSD curve, the slope was determined by fitting the three smallest time delays using least squares regression and by further dividing by a factor of 4 to obtain the apparent diffusion coefficient Da. Due to the short average trajectory length, only the three smallest time delays were used to ensure reliable determination of these values.
DATA AND SOFTWARE AVAILABILITY
All raw data related to nucleoid size scaling (underlying Figures 1, 2, 3, 4, 5, S1, S2, S3, S4, S5 and S6) is provided in Table S4. All computer code is provided in Supplemental Data 1 and can also be found at https://github.com/JacobsWagnerLab/published.
Supplementary Material
A. Representative phase contrast and DAPI images of E. coli cells (CJW6324) grown in liquid cultures of M9 medium supplemented with the indicated carbon source and other chemicals (CAAT: 0.1% casamino acids and 1 μg/ml thiamine) at 37 °C. For a full description of the growth media, see Table S1. Cell contours (green) were generated using Oufti.
B. Bar graph showing the average doubling times of cultures when growing in exponential phase in the indicated growth media. Errors bars indicate the standard deviation between three independent biological replicates. Colors correspond to those used in Figure 1B.
C. Scatter plot of growth medium osmolality versus average NC ratio for E. coli cells (CJW6324) grown in the media indicated in panel B. The color scheme corresponds to the one shown in panel B. Error bars indicate 95% confidence intervals.
Data S1. Related to STAR Methods. Computer code used for the analyses in this study. Individual code files are provided for each analysis, including nucleoid detection, extracting cell properties, and calculating cellular areas. More information is provided in each file′s “About” section.
A. Representative phase-contrast and DAPI images of the indicated species grown in media detailed in the STAR Methods section. The images were processed using Oufti to identify the contours of cells (green) and stained nucleoids (purple). All cells were fixed with 4% formaldehyde, except for H. volcanii, which was imaged live because live-cell imaging resulted in more consistent DNA staining.
B. Scatter plot showing the lack of correlation between genome size and the average NC ratio (left), the average nucleoid area (middle) or the average cell volume (right) for the different species.
All contour lines represent the 0.10, 0.25, 0.50 and 0.75 probability envelopes of the data.
A. Density contour plots showing the lack of correlation between normalized DNA signal intensity (total signal intensity divided by the cell area) and NC ratio for the indicated species.
B. Density contour plots showing the lack of correlation between total DNA signal intensity and NC ratio for the indicated species.
C. Scatter plot showing the lack of correlation between the average NC ratio and the average normalized DNA signal intensity for all included species. Abbreviated species names are indicated next to the corresponding datapoint; see Key Resources Table for a full name description.
D. Scatter plots of average NC ratio versus average cell volume, average cell width, length and surface-area-to-volume ratio (SA/V) for all included species.
A. Randomly picked trajectories of GFP-μNS particles belonging to each of the size/intensity bins indicated in Figure 6A. E. coli (CJW6723) and C. crescentus (CJW6917) cells were grown in M9gly and M2G, respectively.
B. Same plot as Figure 6B on a log-log scale. Lighter-colored lines indicate 95% confidence intervals.
C. Ensemble-averaged MSDs of fluorescently-labeled ribosomes in E. coli (CJW6768) grown in M9glyCAAT and C. crescentus (CJW5156) grown in M2G acquired at different frame intervals. Each column corresponds to the indicated frame interval. Error bars indicate 95% confidence intervals. The aspect ratio between the x-axis (time delay) and y-axis (MSD) values was preserved across panels to facilitate comparison across acquisition-time intervals.
D. Same plots as Figure 6D on a log-log scale. Error bars indicate 95% confidence intervals. Line with a slope of 1 was added for comparison.
E. Schematic showing the area used for calculating the signal correlation factor (SCF). Two parameters define the “correlation area” to ensure optimal SCF calculations for cells with different shapes and sizes. The first parameter is the number of pixels, starting from the cell poles, to exclude from the calculation. The second parameter is the number of pixels, starting from the cell centerline, to include in the calculation. The SCF is calculated as the Pearson correlation between the pixel values of the two signals within this correlation area.
F. Left, frequency distribution of SCF values between nucleoid and ribosome signals in E. coli cells (CJW4677) after treatment with the indicated concentrations of formaldehyde for 15 min at room temperature followed by 30 min on ice for fixation. The nucleoid was detected by DAPI staining and the ribosome was visualized using the GFP fusion to the ribosomal protein RplA. Cells were grown in M9glyCAAT. Right, average SCF values for nucleoid and ribosome signals for the populations of cells shown in panel B.
Table S1. Related to Figure 1 and 7, and STAR Methods. Growth medium composition.
Table S3. Related to STAR Methods. Oligonucleotides used in this study.
The movie shows a time-lapse sequence of a GFP-μNS particle moving in an E. coli cell (CJW6723) grown in M9gly at 30 °C. The time-lapse sequence is shown as an overlay of fluorescence images (green) with the corresponding phase contrast images. The spot intensity (hence size) of the GFP-μNS particle is comparable to that of the GFP-μNS particle in the C. crescentus cell in Movie S2.
The movie shows a time-lapse sequence of a GFP-μNS particle moving in a C. crescentus cell (CJW6917) grown in M2G at 30 °C. The time-lapse sequence is shown as an overlay of fluorescence images (green) with the corresponding phase contrast images. The spot intensity (hence size) of the GFP-μNS particle is comparable to that of the GFP-μNS particle in the E. coli cell in Movie S1.
The movie shows a representative time-lapse sequence of the evolution of the ribosomal fluorescence recovery over time (up to 450 s) along the length of a cephalexin-treated E. coli cell (CJW4677) following photobleaching of about half of the cell.
The movie shows a representative time-lapse sequence of the evolution of the ribosomal fluorescence recovery over time (up to 450 s) along the length of an FtsZ-depleted cephalexin-treated C. crescentus cell (CJW3821) following photobleaching of about half of the cell.
Table S2. Related to STAR Methods. Construction of strains and plasmids used in this study.
Table S4. Related to Figures 1, 2, 3, 4, 5, S1, S2, S3, S4, S5 and S6. Raw data underlying figures.
Figure S2. Related to Figure 1. Variability in DNA content and DAPI staining efficiency do not affect NC ratio measurements in E. coli.
All contour lines represent the 0.10, 0.25, 0.50 and 0.75 probability envelopes of the data.
A. Density contour plots showing the lack of correlation between the NC ratio and the normalized DAPI signal intensity (total intensity divided by cell area) for CJW6324 cells grown in the indicated growth media.
B. Density contour plots showing the lack of correlation between total DAPI signal intensity and NC ratio for CJW6324 cells grown in the indicated growth media.
C. Scatter plots of the average cell area versus the average nucleoid area across growth conditions (color coded as in panels A and B) for different smoothing range values. The smoothing range is the Oufti objectDetection parameter that sets the rigidity of the nucleoid contours. The results for a smoothing range of 3 are shown in Figure 1D; this is the smoothing range value used for all other nucleoid detection analyses described in this study. Note that the smoothing range value changes the estimated nucleoid area (with smaller smoothing range values resulting in smaller nucleoid areas), but the trend with average cell size across nutritional conditions remains similar.
Figure S3. Related to Figures 1 and 2. The nucleoid-labeling method does not affect NC ratio measurements and nucleoid scaling occurs independently of cell division and DNA replication.
A. Density contour plots showing the strong correlation between cell area and nucleoid area for the different strains and nucleoid-labeling methods. The contour lines represent the 0.10, 0.25, 0.50 and 0.75 probability envelopes of the data. E. coli cells producing fluorescent fusions to the α or β HU subunit (CJW5556 producing HupA-mCherry and CJW4656 producing HupB-CFP) were grown in M9glyCAAT and either stained with 1 mM DAPI or not. For DAPI-stained cultures, nucleoid areas were determined using both the DAPI signal (first column) and the signal from the fluorescently-labeled HU (second column). For cultures not stained with DAPI, only the HU-CFP or HU-mCherry fluorescent signal was used (third column). As a reference, the relationship between cell area and nucleoid area for wild-type E. coli MG1655 cells grown in the same conditions and stained with DAPI is shown in blue (fourth column).
B. Average NC ratio (with error bars representing the standard deviation) for experiments shown in panel A.
C. Scatter plot of nucleoid area (measured using DAPI signal) versus nucleoid area (measured using fluorescently-labeled HU) for individual cells. Dotted red lines represent the identity lines, which indicate a perfect agreement between the two signals.
D. Plot showing the average nucleoid area per cell area bin for untreated and cephalexin-treated E. coli cells (CJW4677) grown in the indicated growth media and stained with DAPI. Error bars represent the standard deviation of the nucleoid area for each cell area bin.
E. Density scatter plot of relative cell age versus total DAPI signal of E. coli cells (CJW6324, n = 71488) grown in M9gly. Relative cell age was calculated by ordering cells according to their cell area and using the relationship described by Wold et al. (1994). Using this methodology, the overlap in cell size between cells in the B, C and D cell-cycle periods (see Figure 2B) leads to an almost monotonous increase in total DAPI intensity with cell age. This precludes the use of this method for identifying cells in different cell-cycle periods. The gray scale indicates the relative density of dots (cells) in a given area of the chart. Red dots indicate the mean total DAPI intensity values for cell age bins whereas the error bars show the standard deviations.
F. Density contour plots of cell area versus nucleoid area for CJW6324 cells in B, C, and D periods in the indicated growth media. The contour lines represent the 0.10, 0.25, 0.50 and 0.75 probability envelopes of the data. The nucleoid was detected by DAPI staining.
G. Left, bar graph showing the average NC ratio of CJW6324 cells in the B, C, or D cell-cycle periods. The cells were grown in the indicated growth media. Right, bar graph showing the slope of an unconstrained linear fit between cell area and nucleoid area for the cells shown in panel F.
Figure S4. Related to Figure 3. Robust nucleoid size scaling in C. crescentus.
All contour lines represent the 0.10, 0.25, 0.50 and 0.75 probability envelopes of the data.
A. Density contour plots showing the lack of correlation between the NC ratio and the total mCherry intensity (left) and between the NC ratio and the normalized mCherry intensity (right) for C. crescentus cells (CJW5806) producing an mCherry fusion to the HU subunit HU2. Cells were grown in M2G and the nucleoid area was determined using the HU-mCherry fluorescent signal.
B. Density contour plots of cell area versus nucleoid area for wild-type CB15N cells grown in M2G or PYE. The nucleoid was detected by DAPI staining.
C. Density contour plots showing the strong correlation between cell area and nucleoid area for the indicated CB15N-derived strains. All cells, whether FtsZ-depleted (CJW3821) or carrying a ΔrodZ (CJW1842) or Δhfq (CJW5477) deletion, were grown in PYE and the nucleoid was detected by DAPI staining. For FtsZ depletion, CJW3821 cells grown in PYE that contained xylose (0.3%) were washed and resuspended into PYE lacking xylose to inhibit ftsZ expression. Cells were imaged 3–6 h after cell resuspension. The nucleoid was detected by DAPI staining.
D. Average NC ratio (with error bars representing the standard deviation) for all strains and experiments included in this figure.
E. Density contour plots showing the strong correlation between cell area and nucleoid area for cells carrying a popZ deletion (CJW2238). The cells were grown in M2G because growth in PYE results in severe cell filamentation and loss of viability (Bowman et al., 2008; Ebersbach et al., 2008). The nucleoid was detected by DAPI staining.
KEY RESOURCES TABLE
| REAGENT or RESOURCE | SOURCE | IDENTIFIER |
|---|---|---|
| Bacterial, Archaeal and Virus Strains | ||
| Agrobacterium tumefaciens 3101 (Rhizobium radiobacter) | Savithramma Dinesh-Kumar | CJW501 (At) |
| Anaerostipes sp. | Andrew Goodman | N/A (As) |
|
Asticcacaulis excentricus ATCC 15261 |
Jeanne S. Poindexter | CJW960 (Ae) |
| Bacillus megaterium ATCC 14581 | ATCC Bacteriology Collection | CJW5752 (Bm) |
| Bacillus subtilis subsp. subtilis str. NCIB 3610 | Wade Winkler | CJW5495 (Bs) |
| Bacteroides ovatus | Andrew Goodman | N/A (Bt) |
| Bacteroides thetaiotaomicron | Andrew Goodman | N/A (Bo) |
| Bacteroides xylanisolvens | Andrew Goodman | N/A (Bx) |
| Brevundimonas bacteroides | Pamela Brown | CJW5566 (Brb) |
| Brevundimonas diminuta | Pamela Brown | CJW5571 (Brd) |
| Brevundimonas subvibrioides | Pamela Brown | CJW5565 (Brs) |
| Burkholderia thailandensis E264 | Peter Greenberg | CJW5484 (But) |
| Caulobacter crescentus CB15N | (Evinger and Agabian, 1977) | (Cc) |
| C. crescentus CB15N rodZ::Himar1 | (Alyahya et al., 2009) | CJW1842 |
| C. crescentus CB15N popZ::omega | (Ebersbach et al., 2008) | CJW2238 |
| C. crescentus CB15N ftsZ::Pxyl-ftsZ rplA::pL1-GFPC-1 | (Montero Llopis et al., 2012) | CJW3821 |
| C. crescentus CB15N rplA::pL1-dendra2 | (Lim et al., 2014) | CJW5156 |
| C. crescentus CB15N hfq::tet | (Irnov et al., 2017) | CJW5477 |
| C. crescentus CB15N hu2::pCHYC2-hu2' | (Arias-Cartin et al., 2017) | CJW5806 |
| C. crescentus CB15N hu2::pCHYC2-hu2' dnaN::pCFPC1-dnaNend' | (Arias-Cartin et al., 2017) | CJW5969 |
| C. crescentus CB15N xylX::pXyl-egfp-μNS-kan | This work | CJW6917 |
| Cellulophaga algicola IC166T | Mark McBride | DSM14237 (Ca) |
| Chromobacterium violaceum | Jo Handelsman | N/A (Cv) |
| Chryseobacterium indologenes | Jo Handelsman | CJW4422 (Ci) |
| Clostridium boltae | Andrew Goodman | N/A (Cb) |
| Clostridium hathewayi | Andrew Goodman | N/A (Ch) |
| Collinsella aerofaciens | Andrew Goodman | N/A (Coa) |
| Cytophaga hutchinsonii ATCC 33406 (glucose-adapted) | Mark McBride (Zhu and McBride, 2014) |
CJW5842 (Cyh) |
| Escherichia coli MG1655 | (Guyer et al., 1981) | (Ec) |
| E. coli MG1655 hupB::hupB-cfp | This work | CJW4656 |
| E. coli MG1655 rplA::rplA-gfp | This work | CJW4677 |
| E. coli BW25113 hupA::hupA-mcherry | (Paintdakhi et al., 2016) | CJW5556 |
| E. coli MG1655 seqA::seqA-mcherry ftsZ::ftsZ-venusSW | This work | CJW6324 |
| E. coli MG1655 dnaC2 hupA::hupA-mcherry | This work | CJW6370 |
| E. coli MG1655 PlacOAYZ::Plac-gfp-μNS hupA::hupA-mcherry | This work | CJW6723 |
| E. coli BW25993 rplA::rplA-meos2 | (Sanamrad et al., 2014) | CJW6768 |
| E. coli BW25993 rpsB::rpsB-meos2 | (Sanamrad et al., 2014) | CJW6769 |
| E. coli MG1655 rplA::rplA-msfgfp | This work | CJW7020 |
| E. coli MG1655 rpsB::rpsB-msfgfp | This work | CJW7021 |
| Flavobacterium johnsoniae ATCC 17061T | Mark McBride | CJW5841 (Fj) |
| Haloferax volcanii DS2 | Ethan Garner | N/A (Hv) |
| Hirschia rosenbergii | Pamela Brown | CJW5574 (Hr) |
| Janthinobacterium lividum | Jo Handelsman | CJW4423 (Jl) |
| Myxococcus xanthus DZF1 | David Zusman | CJW5485 (Mx) |
| Lactobacillus reuteri | Andrew Goodman | N/A (Lr) |
| Lysinibacillus sphaericus ATCC 4525 | ATCC Bacteriology Collection | CJW5751 (Ls) |
| Paenibacillus polymyxa ATCC 7070 | ATCC Bacteriology Collection | CJW5750 (Pp) |
| Parabacteroides distasonis | Andrew Goodman | N/A (Pd) |
| Providencia alcalifaciens | Andrew Goodman | N/A (Pa) |
| Pseudomonas syringae pv. syringae B728a | Steven Lindow | CJW410 (Ps) |
| Rhizobium leguminosarum bv. trifolii R200 | Nora Ausmees | CJW355 (Rl) |
| Roseburia intestinalis | Andrew Goodman | N/A (Ri) |
| Sinorhizobium meliloti 1021 | Jacques Batut | CJW356 (Sm) |
| Vibrio fischeri ES114 | Eric Stabb | CJW5630 (Vf) |
| Vibrio harveyi BB120 | Bonnie Bassler | CJW5482 (Vh) |
| Chemicals, Peptides, and Recombinant Proteins | ||
| Agarose | AmericBio | Cat#AB00972–00500 |
| Cephalexin hydrate | Sigma Aldrich | Cat#C4895 |
| 4',6-Diamidine-2'-phenylindole dihydrochloride (DAPI) fluorescent dye | Thermo Fisher Scientific | Cat#D1306 |
| DpnI restriction enzyme | New England Biolabs | Cat#R0176S |
| Hoechst 33342 fluorescent dye | Thermo Fisher Scientific | Cat#H3570 |
| KpnI restriction enzyme | New England Biolabs | Cat#R0142S |
| NheI restriction enzyme | New England Biolabs | Cat#R0131S |
| Phusion high-fidelity polymerase | New England Biolabs | Cat#M0530S |
| SYBR Green fluorescent dye | Thermo Fisher Scientific | Cat#S7564 |
| T5 exonuclease | New England Biolabs | Cat#M0363S |
| Taq DNA ligase | New England Biolabs | Cat#M0208L |
| Oligonucleotides | ||
| Primers for strain construction | This work, Integrated DNA Technologies |
See Table S3 |
| Recombinant DNA | ||
| pKD13-ftsZ-venusSW-lpxC-FRT-kan-FRT-secM' | This work | N/A |
| pKD3-mCherry | This work | N/A |
| Software and Algorithms | ||
| ImageJ | (Collins, 2007) | https://imagej.nih.gov/ij/ |
| MATLAB | Mathworks | https://www.mathworks.com/ |
| Oufti | (Paintdakhi et al., 2016) | https://oufti.org/ |
Highlights.
Nucleoid size scales with cell size in bacteria, even without changes in DNA content
The nucleocytoplasmic (NC) ratio varies with the average cell size of the species
The NC ratio impacts the biophysical properties of the cytoplasm
The spatial organization of ribosomes is linked to the average cell size and NC ratio
Acknowledgements
We thank Drs. Nora Ausmees, Jacques Batut, Steven Lindow, Savithramma Dinesh-Kumar, Jeanne S. Poindexter, Jo Handelsman, Bonnie Bassler, Peter Greenberg, David Zusman, Wade Winkler, Pamela Brown, Eric Stabb, Mark McBride, and Andrew Goodman, as well as the ATCC Bacteriology collection and the Yale E. coli Genetic Stock Center, for providing strains used in this work. We are also grateful to Drs. Ethan Garner and Alexandre Bisson for providing the H. volcanii strain and the YPC growth medium used in this work. We would also like to thank Drs. Andrew Goodman and Bentley Lim for sharing fixed B. theta cells harvested from monocolonized mice, and Dr. Michael Zimmerman for providing strains and for his help with setting up anaerobic growth experiments. We also thank the Jacobs-Wagner laboratory for fruitful discussions and for critical reading of the manuscript. This work was partly supported by the National Institutes of Health (R01 GM065835 to C.J.-W.). S.K.G. was partly funded by a fellowship from the Belgian American Education Foundation (B.A.E.F.). C.J.-W. is an investigator of the Howard Hughes Medical Institute.
Footnotes
Publisher's Disclaimer: This is a PDF file of an unedited manuscript that has been accepted for publication. As a service to our customers we are providing this early version of the manuscript. The manuscript will undergo copyediting, typesetting, and review of the resulting proof before it is published in its final citable form. Please note that during the production process errors may be discovered which could affect the content, and all legal disclaimers that apply to the journal pertain.
Declaration of Interests
The authors declare no competing interests.
References
- Adiciptaningrum A, Osella M, Moolman MC, Cosentino Lagomarsino M, and Tans SJ (2015). Stochasticity and homeostasis in the E. coli replication and division cycle. Sci Rep 5, 18261. [DOI] [PMC free article] [PubMed] [Google Scholar]
- Alyahya SA, Alexander R, Costa T, Henriques AO, Emonet T, and Jacobs-Wagner C (2009). RodZ, a component of the bacterial core morphogenic apparatus. Proc Natl Acad Sci U S A 106, 1239–1244. [DOI] [PMC free article] [PubMed] [Google Scholar]
- Amann RI, Binder BJ, Olson RJ, Chisholm SW, Devereux R, and Stahl DA (1990). Combination of 16S rRNA-targeted oligonucleotide probes with flow cytometry for analyzing mixed microbial populations. Appl Environ Microbiol 56, 1919–1925. [DOI] [PMC free article] [PubMed] [Google Scholar]
- Arias-Cartin R, Dobihal GS, Campos M, Surovtsev IV, Parry B, and Jacobs-Wagner C (2017). Replication fork passage drives asymmetric dynamics of a critical nucleoid-associated protein in Caulobacter. EMBO J 36, 301–318. [DOI] [PMC free article] [PubMed] [Google Scholar]
- Azam TA, Hiraga S, and Ishihama A (2000). Two types of localization of the DNA-binding proteins within the Escherichia coli nucleoid. Genes Cells 5, 613–626. [DOI] [PubMed] [Google Scholar]
- Bacic MK, and Smith CJ (2008). Laboratory maintenance and cultivation of bacteroides species. Curr Protoc Microbiol Chapter 13, Unit 13C 11. [DOI] [PMC free article] [PubMed] [Google Scholar]
- Bakshi S, Siryaporn A, Goulian M, and Weisshaar JC (2012). Superresolution imaging of ribosomes and RNA polymerase in live Escherichia coli cells. Mol Microbiol 85, 21–38. [DOI] [PMC free article] [PubMed] [Google Scholar]
- Bayas CA, Wang J, Lee MK, Schrader JM, Shapiro L, and Moerner WE (2018). Spatial organization and dynamics of RNase E and ribosomes in Caulobacter crescentus. Proc Natl Acad Sci U S A 115, E3712–E3721. [DOI] [PMC free article] [PubMed] [Google Scholar]
- Berger M, Farcas A, Geertz M, Zhelyazkova P, Brix K, Travers A, and Muskhelishvili G (2010). Coordination of genomic structure and transcription by the main bacterial nucleoid-associated protein HU. EMBO Rep 11, 59–64. [DOI] [PMC free article] [PubMed] [Google Scholar]
- Bisson-Filho AW, Zheng J, and Garner E (2018). Archaeal imaging: leading the hunt for new discoveries. Mol Biol Cell 29, 1675–1681. [DOI] [PMC free article] [PubMed] [Google Scholar]
- Blundell MR, and Wild DG (1971). Altered ribosomes after inhibition of Escherichia coli by rifampicin. Biochem J 121, 391–398. [DOI] [PMC free article] [PubMed] [Google Scholar]
- Bouchaud JP, and Georges A (1990). Anomalous Diffusion in Disordered Media-Statistical Mechanisms, Models and Physical Applications. Phys Rep 195, 127–293. [Google Scholar]
- Bowman GR, Comolli LR, Zhu J, Eckart M, Koenig M, Downing KH, Moerner WE, Earnest T, and Shapiro L (2008). A polymeric protein anchors the chromosomal origin/ParB complex at a bacterial cell pole. Cell 134, 945–955. [DOI] [PMC free article] [PubMed] [Google Scholar]
- Boye E, and Lobner-Olesen A (1991). Bacterial growth control studied by flow cytometry. Res in Microbiol 142, 131–135. [DOI] [PubMed] [Google Scholar]
- Brandt F, Etchells SA, Ortiz JO, Elcock AH, Hartl FU, and Baumeister W (2009). The native 3D organization of bacterial polysomes. Cell 136, 261–271. [DOI] [PubMed] [Google Scholar]
- Brangwynne CP (2013). Phase transitions and size scaling of membrane-less organelles. J Cell Biol 203, 875–881. [DOI] [PMC free article] [PubMed] [Google Scholar]
- Brangwynne CP, Koenderink GH, MacKintosh FC, and Weitz DA (2009). Intracellular transport by active diffusion. Trends Cell Biol 19, 423–427. [DOI] [PubMed] [Google Scholar]
- Brangwynne CP, Mitchison TJ, and Hyman AA (2011). Active liquid-like behavior of nucleoli determines their size and shape in Xenopus laevis oocytes. Proc Natl Acad Sci U S A 108, 4334–4339. [DOI] [PMC free article] [PubMed] [Google Scholar]
- Brendler T, Abeles A, and Austin S (1995). A protein that binds to the P1 origin core and the oriC 13mer region in a methylation-specific fashion is the product of the host seqA gene. EMBO J 14, 4083–4089. [DOI] [PMC free article] [PubMed] [Google Scholar]
- Broering TJ, Arnold MM, Miller CL, Hurt JA, Joyce PL, and Nibert ML (2005). Carboxyl-proximal regions of reovirus nonstructural protein muNS necessary and sufficient for forming factory-like inclusions. J Virol 79, 6194–6206. [DOI] [PMC free article] [PubMed] [Google Scholar]
- Broering TJ, Parker JS, Joyce PL, Kim J, and Nibert ML (2002). Mammalian reovirus nonstructural protein microNS forms large inclusions and colocalizes with reovirus microtubule-associated protein micro2 in transfected cells. J Virol 76, 8285–8297. [DOI] [PMC free article] [PubMed] [Google Scholar]
- Bronstein I, Israel Y, Kepten E, Mai S, Shav-Tal Y, Barkai E, and Garini Y (2009). Transient anomalous diffusion of telomeres in the nucleus of mammalian cells. Phys Rev Lett 103, 018102. [DOI] [PubMed] [Google Scholar]
- Cagliero C, and Jin DJ (2013). Dissociation and re-association of RNA polymerase with DNA during osmotic stress response in Escherichia coli. Nucleic Acids Res 41, 315–326. [DOI] [PMC free article] [PubMed] [Google Scholar]
- Cai LH, Panyukov S, and Rubinstein M (2011). Mobility of Nonsticky Nanoparticles in Polymer Liquids. Macromolecules 44, 7853–7863. [DOI] [PMC free article] [PubMed] [Google Scholar]
- Campos M, Govers SK, Irnov I, Dobihal GS, Cornet F, and Jacobs-Wagner C (2018). Genomewide phenotypic analysis of growth, cell morphogenesis, and cell cycle events in Escherichia coli. Mol Syst Biol 14, e7573. [DOI] [PMC free article] [PubMed] [Google Scholar]
- Campos M, and Jacobs-Wagner C (2013). Cellular organization of the transfer of genetic information. Curr Opin Microbiol 16, 171–176. [DOI] [PMC free article] [PubMed] [Google Scholar]
- Capell BC, and Collins FS (2006). Human laminopathies: nuclei gone genetically awry. Nat Rev Genet 7, 940–952. [DOI] [PubMed] [Google Scholar]
- Carl PL (1970). Escherichia coli mutants with temperature-sensitive synthesis of DNA. Mol Gen Genet 109, 107–122. [DOI] [PubMed] [Google Scholar]
- Chen H, Shiroguchi K, Ge H, and Xie XS (2015). Genome-wide study of mRNA degradation and transcript elongation in Escherichia coli. Mol Syst Biol 11, 781. [DOI] [PMC free article] [PubMed] [Google Scholar]
- Cherepanov PP, and Wackernagel W (1995). Gene disruption in Escherichia coli: TcR and KmR cassettes with the option of Flp-catalyzed excision of the antibiotic-resistance determinant. Gene 158, 9–14. [DOI] [PubMed] [Google Scholar]
- Chow KH, Factor RE, and Ullman KS (2012). The nuclear envelope environment and its cancer connections. Nat Rev Cancer 12, 196–209. [DOI] [PMC free article] [PubMed] [Google Scholar]
- Collier J, and Shapiro L (2009). Feedback control of DnaA-mediated replication initiation by replisome-associated HdaA protein in Caulobacter. J Bacteriol 191, 5706–5716. [DOI] [PMC free article] [PubMed] [Google Scholar]
- Collins TJ (2007). ImageJ for microscopy. Biotechniques 43, 25–30. [DOI] [PubMed] [Google Scholar]
- Conklin EG (1912). Cell size and nuclear size. J Exp Zool 12, 1–98. [Google Scholar]
- Cooper S, and Helmstetter CE (1968). Chromosome replication and the division cycle of Escherichia coli B/r. J Mol Biol 31, 519–540. [DOI] [PubMed] [Google Scholar]
- Crocker JC, and Grier DG (1996). Methods of digital video microscopy for colloidal studies. J Colloid Interf Sci 179, 298–310. [Google Scholar]
- Datsenko KA, and Wanner BL (2000). One-step inactivation of chromosomal genes in Escherichia coli K-12 using PCR products. Proc Natl Acad Sci U S A 97, 6640–6645. [DOI] [PMC free article] [PubMed] [Google Scholar]
- Diekmann Y, and Pereira-Leal JB (2013). Evolution of intracellular compartmentalization. Biochem J 449, 319–331. [DOI] [PubMed] [Google Scholar]
- Duggin IG, Aylett CH, Walsh JC, Michie KA, Wang Q, Turnbull L, Dawson EM, Harry EJ, Whitchurch CB, Amos LA, et al. (2015). CetZ tubulin-like proteins control archaeal cell shape. Nature 519, 362–365. [DOI] [PMC free article] [PubMed] [Google Scholar]
- Ebersbach G, Briegel A, Jensen GJ, and Jacobs-Wagner C (2008). A self-associating protein critical for chromosome attachment, division, and polar organization in caulobacter. Cell 134, 956–968. [DOI] [PMC free article] [PubMed] [Google Scholar]
- Eley A, Greenwood D, and O’Grady F (1985). Comparative growth of Bacteroides species in various anaerobic culture media. J Med Microbiol 19, 195–201. [DOI] [PubMed] [Google Scholar]
- Elowitz MB, Surette MG, Wolf PE, Stock JB, and Leibler S (1999). Protein mobility in the cytoplasm of Escherichia coli. J Bacteriol 181, 197–203. [DOI] [PMC free article] [PubMed] [Google Scholar]
- Evinger M, and Agabian N (1977). Envelope-associated nucleoid from Caulobacter crescentus stalked and swarmer cells. J Bacteriol 132, 294–301. [DOI] [PMC free article] [PubMed] [Google Scholar]
- Fernandez-Fernandez C, Grosse K, Sourjik V, and Collier J (2013). The beta-sliding clamp directs the localization of HdaA to the replisome in Caulobacter crescentus. Microbiology 159, 2237–2248. [DOI] [PMC free article] [PubMed] [Google Scholar]
- Forchhammer J, and Lindahl L (1971). Growth rate of polypeptide chains as a function of the cell growth rate in a mutant of Escherichia coli 15. J Mol Biol 55, 563–568. [DOI] [PubMed] [Google Scholar]
- Ganguly A, Bhattacharjee C, Bhave M, Kailaje V, Jain BK, Sengupta I, Rangarajan A, and Bhattacharyya D (2016). Perturbation of nucleo-cytoplasmic transport affects size of nucleus and nucleolus in human cells. FEBS Lett 590, 631–643. [DOI] [PubMed] [Google Scholar]
- Gibson DG, Young L, Chuang RY, Venter JC, Hutchison CA 3rd, and Smith HO (2009). Enzymatic assembly of DNA molecules up to several hundred kilobases. Nat Methods 6, 343–345. [DOI] [PubMed] [Google Scholar]
- Goodman AL, Kallstrom G, Faith JJ, Reyes A, Moore A, Dantas G, and Gordon JI (2011). Extensive personal human gut microbiota culture collections characterized and manipulated in gnotobiotic mice. Proc Natl Acad Sci U S A 108, 6252–6257. [DOI] [PMC free article] [PubMed] [Google Scholar]
- Guo M, Ehrlicher AJ, Jensen MH, Renz M, Moore JR, Goldman RD, Lippincott-Schwartz J, Mackintosh FC, and Weitz DA (2014). Probing the stochastic, motor-driven properties of the cytoplasm using force spectrum microscopy. Cell 158, 822–832. [DOI] [PMC free article] [PubMed] [Google Scholar]
- Guyer MS, Reed RR, Steitz JA, and Low KB (1981). Identification of a sex-factor-affinity site in E. coli as gamma delta. Cold Spring Harb Symp Quant Biol 45 Pt 1, 135–140. [DOI] [PubMed] [Google Scholar]
- Hajjoul H, Mathon J, Ranchon H, Goiffon I, Mozziconacci J, Albert B, Carrivain P, Victor JM, Gadal O, Bystricky K, et al. (2013). High-throughput chromatin motion tracking in living yeast reveals the flexibility of the fiber throughout the genome. Genome Res 23, 1829–1838. [DOI] [PMC free article] [PubMed] [Google Scholar]
- Hara Y, and Merten CA (2015). Dynein-Based Accumulation of Membranes Regulates Nuclear Expansion in Xenopus laevis Egg Extracts. Dev Cell 33, 562–575. [DOI] [PubMed] [Google Scholar]
- Harold FM (2005). Molecules into cells: specifying spatial architecture. Microbiol Mol Biol Rev 69, 544–564. [DOI] [PMC free article] [PubMed] [Google Scholar]
- Helgesen E, Fossum-Raunehaug S, Saetre F, Schink KO, and Skarstad K (2015). Dynamic Escherichia coli SeqA complexes organize the newly replicated DNA at a considerable distance from the replisome. Nucleic Acids Res 43, 2730–2743. [DOI] [PMC free article] [PubMed] [Google Scholar]
- Huxley JS (1924). Constant differential growth ratios and their significance. Nature 114, 895–896. [Google Scholar]
- Irnov I, Wang Z, Jannetty ND, Bustamante JA, Rhee KY, and Jacobs-Wagner C (2017). Crosstalk between the tricarboxylic acid cycle and peptidoglycan synthesis in Caulobacter crescentus through the homeostatic control of alpha-ketoglutarate. PLoS Genet 13, e1006978. [DOI] [PMC free article] [PubMed] [Google Scholar]
- Jaqaman K, Loerke D, Mettlen M, Kuwata H, Grinstein S, Schmid SL, and Danuser G (2008). Robust single-particle tracking in live-cell time-lapse sequences. Nat Methods 5, 695–702. [DOI] [PMC free article] [PubMed] [Google Scholar]
- Jensen RB, and Shapiro L (1999). The Caulobacter crescentus smc gene is required for cell cycle progression and chromosome segregation. Proc Natl Acad Sci U S A 96, 10661–10666. [DOI] [PMC free article] [PubMed] [Google Scholar]
- Jevtic P, Edens LJ, Vukovic LD, and Levy DL (2014). Sizing and shaping the nucleus: mechanisms and significance. Curr Opin Cell Biol 28, 16–27. [DOI] [PMC free article] [PubMed] [Google Scholar]
- Jevtic P, and Levy DL (2015). Nuclear size scaling during Xenopus early development contributes to midblastula transition timing. Curr Biol 25, 45–52. [DOI] [PMC free article] [PubMed] [Google Scholar]
- Jorgensen P, Edgington NP, Schneider BL, Rupes I, Tyers M, and Futcher B (2007). The size of the nucleus increases as yeast cells grow. Mol Biol Cell 18, 3523–3532. [DOI] [PMC free article] [PubMed] [Google Scholar]
- Junier I, Boccard F, and Espeli O (2014). Polymer modeling of the E. coli genome reveals the involvement of locus positioning and macrodomain structuring for the control of chromosome conformation and segregation. Nucleic Acids Res 42, 1461–1473. [DOI] [PMC free article] [PubMed] [Google Scholar]
- Kellenberger E, Ryter A, and Sechaud J (1958). Electron microscope study of DNA-containing plasms. II. Vegetative and mature phage DNA as compared with normal bacterial nucleoids in different physiological states. J Biophys Biochem Cytol 4, 671–678. [DOI] [PMC free article] [PubMed] [Google Scholar]
- Kim S, and Jacobs-Wagner C (2018). Effects of mRNA Degradation and Site-Specific Transcriptional Pausing on Protein Expression Noise. Biophys J 114, 1718–1729. [DOI] [PMC free article] [PubMed] [Google Scholar]
- Kristoffersen SM, Haase C, Weil MR, Passalacqua KD, Niazi F, Hutchison SK, Desany B, Kolsto AB, Tourasse NJ, Read TD, et al. (2012). Global mRNA decay analysis at single nucleotide resolution reveals segmental and positional degradation patterns in a Gram-positive bacterium. Genome Biol 13, R30. [DOI] [PMC free article] [PubMed] [Google Scholar]
- Kume K, Cantwell H, Neumann FR, Jones AW, Snijders AP, and Nurse P (2017). A systematic genomic screen implicates nucleocytoplasmic transport and membrane growth in nuclear size control. PLoS Genet 13, e1006767. [DOI] [PMC free article] [PubMed] [Google Scholar]
- Levy DL, and Heald R (2010). Nuclear size is regulated by importin alpha and Ntf2 in Xenopus. Cell 143, 288–298. [DOI] [PMC free article] [PubMed] [Google Scholar]
- Levy DL, and Heald R (2012). Mechanisms of intracellular scaling. Annu Rev Cell Dev Biol 28, 113–135. [DOI] [PubMed] [Google Scholar]
- Lewis PJ, Thaker SD, and Errington J (2000). Compartmentalization of transcription and translation in Bacillus subtilis. EMBO J 19, 710–718. [DOI] [PMC free article] [PubMed] [Google Scholar]
- Lim CS, Kim ES, Kim JY, Hong ST, Chun HJ, Kang DE, and Cho BR (2015). Measurement of the Nucleus Area and Nucleus/Cytoplasm and Mitochondria/Nucleus Ratios in Human Colon Tissues by Dual-Colour Two-Photon Microscopy Imaging. Sci Rep 5, 18521. [DOI] [PMC free article] [PubMed] [Google Scholar]
- Lim HC, Surovtsev IV, Beltran BG, Huang F, Bewersdorf J, and Jacobs-Wagner C (2014). Evidence for a DNA-relay mechanism in ParABS-mediated chromosome segregation. Elife 3, e02758. [DOI] [PMC free article] [PubMed] [Google Scholar]
- Lin B, Thayer DA, and Maddock JR (2004). The Caulobacter crescentus CgtAC protein cosediments with the free 50S ribosomal subunit. J Bacteriol 186, 481–489. [DOI] [PMC free article] [PubMed] [Google Scholar]
- Lobner-Olesen A, Slominska-Wojewodzka M, Hansen FG, and Marinus MG (2008). DnaC inactivation in Escherichia coli K-12 induces the SOS response and expression of nucleotide biosynthesis genes. PLoS One 3, e2984.f. [DOI] [PMC free article] [PubMed] [Google Scholar]
- Lu M, Campbell JL, Boye E, and Kleckner N (1994). SeqA: a negative modulator of replication initiation in E. coli. Cell 77, 413–426. [DOI] [PubMed] [Google Scholar]
- Marceau AH, Bahng S, Massoni SC, George NP, Sandler SJ, Marians KJ, and Keck JL (2011). Structure of the SSB-DNA polymerase III interface and its role in DNA replication. EMBO J 30, 4236–4247. [DOI] [PMC free article] [PubMed] [Google Scholar]
- Marshall WF (2015). Subcellular size. Cold Spring Harb Perspect Biol 7. [DOI] [PMC free article] [PubMed] [Google Scholar]
- Mason DJ, and Powelson DM (1956). Nuclear division as observed in live bacteria by a new technique. J Bacteriol 71, 474–479. [DOI] [PMC free article] [PubMed] [Google Scholar]
- Miller OL Jr., Hamkalo BA, and Thomas CA Jr. (1970). Visualization of bacterial genes in action. Science 169, 392–395. [DOI] [PubMed] [Google Scholar]
- Moffitt JR, Pandey S, Boettiger AN, Wang S, and Zhuang X (2016). Spatial organization shapes the turnover of a bacterial transcriptome. Elife 5, e13065. [DOI] [PMC free article] [PubMed] [Google Scholar]
- Molina F, and Skarstad K (2004). Replication fork and SeqA focus distributions in Escherichia coli suggest a replication hyperstructure dependent on nucleotide metabolism. Mol Microbiol 52, 1597–1612. [DOI] [PubMed] [Google Scholar]
- Montero Llopis P, Jackson AF, Sliusarenko O, Surovtsev I, Heinritz J, Emonet T, and Jacobs-Wagner C (2010). Spatial organization of the flow of genetic information in bacteria. Nature 466, 77–81. [DOI] [PMC free article] [PubMed] [Google Scholar]
- Montero Llopis P, Sliusarenko O, Heinritz J, and Jacobs-Wagner C (2012). In vivo biochemistry in bacterial cells using FRAP: insight into the translation cycle. Biophys J 103, 1848–1859. [DOI] [PMC free article] [PubMed] [Google Scholar]
- Moore DA, Whatley ZN, Joshi CP, Osawa M, and Erickson HP (2017). Probing for Binding Regions of the FtsZ Protein Surface through Site-Directed Insertions: Discovery of Fully Functional FtsZ-Fluorescent Proteins. J Bacteriol 199, e00553–16. [DOI] [PMC free article] [PubMed] [Google Scholar]
- Neumann FR, and Nurse P (2007). Nuclear size control in fission yeast. J Cell Biol 179, 593–600. [DOI] [PMC free article] [PubMed] [Google Scholar]
- Novakova L, Kovacovicova K, Dang-Nguyen TQ, Sodek M, Skultety M, and Anger M (2016). A Balance between Nuclear and Cytoplasmic Volumes Controls Spindle Length. PloS One 11, e0149535. [DOI] [PMC free article] [PubMed] [Google Scholar]
- Paintdakhi A, Parry B, Campos M, Irnov I, Elf J, Surovtsev I, and Jacobs-Wagner C (2016). Oufti: an integrated software package for high-accuracy, high-throughput quantitative microscopy analysis. Mol Microbiol 99, 767–777. [DOI] [PMC free article] [PubMed] [Google Scholar]
- Parry BR, Surovtsev IV, Cabeen MT, O’Hern CS, Dufresne ER, and Jacobs-Wagner C (2014). The bacterial cytoplasm has glass-like properties and is fluidized by metabolic activity. Cell 156, 183–194. [DOI] [PMC free article] [PubMed] [Google Scholar]
- Phillips LA, Hotham-Iglewski B, and Franklin RM (1969). Polyribosomes of Escherichia coli. II. Experiments to determine the in vivo distribution of polysomes, ribosomes and ribosomal subunits. J Mol Biol 45, 23–38. [DOI] [PubMed] [Google Scholar]
- Pierucci O (1978). Dimensions of Escherichia coli at various growth rates: model for envelope growth. J Bacteriol 135, 559–574. [DOI] [PMC free article] [PubMed] [Google Scholar]
- Prokocimer M, Davidovich M, Nissim-Rafinia M, Wiesel-Motiuk N, Bar DZ, Barkan R, Meshorer E, and Gruenbaum Y (2009). Nuclear lamins: key regulators of nuclear structure and activities. J Cell Mol Med 13, 1059–1085. [DOI] [PMC free article] [PubMed] [Google Scholar]
- Reber S, and Goehring NW (2015). Intracellular Scaling Mechanisms. Cold Spring Harb Perspect Biol 7, a019067. [DOI] [PMC free article] [PubMed] [Google Scholar]
- Redon E, Loubiere P, and Cocaign-Bousquet M (2005). Role of mRNA stability during genome-wide adaptation of Lactococcus lactis to carbon starvation. J Biol Chem 280, 36380–36385. [DOI] [PubMed] [Google Scholar]
- Robinow C, and Kellenberger E (1994). The bacterial nucleoid revisited. Microbiol Rev 58, 211–232. [DOI] [PMC free article] [PubMed] [Google Scholar]
- Rolinson GN (1980). Effect of beta-lactam antibiotics on bacterial cell growth rate. J Gen Microbiol 120, 317–323. [DOI] [PubMed] [Google Scholar]
- Sanamrad A, Persson F, Lundius EG, Fange D, Gynna AH, and Elf J (2014). Single-particle tracking reveals that free ribosomal subunits are not excluded from the Escherichia coli nucleoid. Proc Natl Acad Sci U S A 111, 11413–11418. [DOI] [PMC free article] [PubMed] [Google Scholar]
- Schaechter M, Maaloe O, and Kjeldgaard NO (1958). Dependency on medium and temperature of cell size and chemical composition during balanced grown of Salmonella typhimurium. J Gen Microbiol 19, 592–606. [DOI] [PubMed] [Google Scholar]
- Shi H, Colavin A, Bigos M, Tropini C, Monds RD, and Huang KC (2017). Deep Phenotypic Mapping of Bacterial Cytoskeletal Mutants Reveals Physiological Robustness to Cell Size. Curr Biol 27, 3419–3429. [DOI] [PubMed] [Google Scholar]
- Slater S, Wold S, Lu M, Boye E, Skarstad K, and Kleckner N (1995). E. coli SeqA protein binds oriC in two different methyl-modulated reactions appropriate to its roles in DNA replication initiation and origin sequestration. Cell 82, 927–936. [DOI] [PubMed] [Google Scholar]
- Sun H, Yang Z, and Shi W (1999). Effect of cellular filamentation on adventurous and social gliding motility of Myxococcus xanthus. Proc Natl Acad Sci U S A 96, 15178–15183. [DOI] [PMC free article] [PubMed] [Google Scholar]
- Surovtsev IV, and Jacobs-Wagner C (2018). Subcellular Organization: A Critical Feature of Bacterial Cell Replication. Cell 172, 1271–1293. [DOI] [PMC free article] [PubMed] [Google Scholar]
- Taheri-Araghi S, Bradde S, Sauls JT, Hill NS, Levin PA, Paulsson J, Vergassola M, and Jun S (2015). Cell-size control and homeostasis in bacteria. Curr Biol 25, 385–391. [DOI] [PMC free article] [PubMed] [Google Scholar]
- Thanbichler M, Iniesta AA, and Shapiro L (2007). A comprehensive set of plasmids for vanillate-and xylose-inducible gene expression in Caulobacter crescentus. Nucleic Acids Res 35, e137. [DOI] [PMC free article] [PubMed] [Google Scholar]
- Uehara T, Dinh T, and Bernhardt TG (2009). LytM-domain factors are required for daughter cell separation and rapid ampicillin-induced lysis in Escherichia coli. J Bacteriol 191, 5094–5107. [DOI] [PMC free article] [PubMed] [Google Scholar]
- Uppaluri S, Weber SC, and Brangwynne CP (2016). Hierarchical Size Scaling during Multicellular Growth and Development. Cell Rep 17, 345–352. [DOI] [PubMed] [Google Scholar]
- van Gijtenbeek LA, Robinson A, van Oijen AM, Poolman B, and Kok J (2016). On the Spatial Organization of mRNA, Plasmids, and Ribosomes in a Bacterial Host Overexpressing Membrane Proteins. PLoS Genet 12, e1006523. [DOI] [PMC free article] [PubMed] [Google Scholar]
- Varricchio F, and Monier R (1971). Ribosome patterns in Escherichia coli growing at various rates. J Bacteriol 108, 105–110. [DOI] [PMC free article] [PubMed] [Google Scholar]
- Wallden M, Fange D, Lundius EG, Baltekin O, and Elf J (2016). The Synchronization of Replication and Division Cycles in Individual E. coli Cells. Cell 166, 729–739. [DOI] [PubMed] [Google Scholar]
- Wang Y, Jones BD, and Brun YV (2001). A set of ftsZ mutants blocked at different stages of cell division in Caulobacter. Mol Microbiol 40, 347–360. [DOI] [PubMed] [Google Scholar]
- Warner JR, Rich A, and Hall CE (1962). Electron Microscope Studies of Ribosomal Clusters Synthesizing Hemoglobin. Science 138, 1399–1403. [DOI] [PubMed] [Google Scholar]
- Weart RB, Lee AH, Chien AC, Haeusser DP, Hill NS, and Levin PA (2007). A metabolic sensor governing cell size in bacteria. Cell 130, 335–347. [DOI] [PMC free article] [PubMed] [Google Scholar]
- Weber SC, and Brangwynne CP (2015). Inverse size scaling of the nucleolus by a concentration-dependent phase transition. Curr Biol 25, 641–646. [DOI] [PMC free article] [PubMed] [Google Scholar]
- Wilson EB (1925). The Karyoplasmic Ratio In The Cell in Development and Heredity (New York: The Macmillan Company; ), pp. 727–733. [Google Scholar]
- Withers HL, and Bernander R (1998). Characterization of dnaC2 and dnaC28 mutants by flow cytometry. J Bacteriol 180, 1624–1631. [DOI] [PMC free article] [PubMed] [Google Scholar]
- Wold S, Skarstad K, Steen HB, Stokke T, and Boye E (1994). The initiation mass for DNA replication in Escherichia coli K-12 is dependent on growth rate. EMBO J 13, 2097–2102 [DOI] [PMC free article] [PubMed] [Google Scholar]
- Wong IY, Gardel ML, Reichman DR, Weeks ER, Valentine MT, Bausch AR, and Weitz DA (2004). Anomalous diffusion probes microstructure dynamics of entangled F-actin networks. Phys Rev Lett 92, 178101. [DOI] [PubMed] [Google Scholar]
- Woodruff LL (1913). Cell size, nuclear size and the nucleo-cytoplasmic relation during the life of a pedigreed race of oxytricha fallax. J Exp Zool 15, 1–22. [Google Scholar]
- Zhu Y, and McBride MJ (2014). Deletion of the Cytophaga hutchinsonii type IX secretion system gene sprP results in defects in gliding motility and cellulose utilization. Appl Microbiol Biotechnol 98, 763–775. [DOI] [PubMed] [Google Scholar]
- Zhu Y, Mohapatra S, and Weisshaar JC (2019). Rigidification of the Escherichia coli cytoplasm by the human antimicrobial peptide LL-37 revealed by superresolution fluorescence microscopy. Proc Natl Acad Sci U S A 116, 1017–1026. [DOI] [PMC free article] [PubMed] [Google Scholar]
- Zink D, Fischer AH, and Nickerson JA (2004). Nuclear structure in cancer cells. Nat Rev Cancer 4, 677–687. [DOI] [PubMed] [Google Scholar]
- Zwietering MH, Jongenburger I, Rombouts FM, and van ‘t Riet K (1990). Modeling of the bacterial growth curve. Appl Environ Microbiol 56, 1875–1881. [DOI] [PMC free article] [PubMed] [Google Scholar]
Associated Data
This section collects any data citations, data availability statements, or supplementary materials included in this article.
Supplementary Materials
A. Representative phase contrast and DAPI images of E. coli cells (CJW6324) grown in liquid cultures of M9 medium supplemented with the indicated carbon source and other chemicals (CAAT: 0.1% casamino acids and 1 μg/ml thiamine) at 37 °C. For a full description of the growth media, see Table S1. Cell contours (green) were generated using Oufti.
B. Bar graph showing the average doubling times of cultures when growing in exponential phase in the indicated growth media. Errors bars indicate the standard deviation between three independent biological replicates. Colors correspond to those used in Figure 1B.
C. Scatter plot of growth medium osmolality versus average NC ratio for E. coli cells (CJW6324) grown in the media indicated in panel B. The color scheme corresponds to the one shown in panel B. Error bars indicate 95% confidence intervals.
Data S1. Related to STAR Methods. Computer code used for the analyses in this study. Individual code files are provided for each analysis, including nucleoid detection, extracting cell properties, and calculating cellular areas. More information is provided in each file′s “About” section.
A. Representative phase-contrast and DAPI images of the indicated species grown in media detailed in the STAR Methods section. The images were processed using Oufti to identify the contours of cells (green) and stained nucleoids (purple). All cells were fixed with 4% formaldehyde, except for H. volcanii, which was imaged live because live-cell imaging resulted in more consistent DNA staining.
B. Scatter plot showing the lack of correlation between genome size and the average NC ratio (left), the average nucleoid area (middle) or the average cell volume (right) for the different species.
All contour lines represent the 0.10, 0.25, 0.50 and 0.75 probability envelopes of the data.
A. Density contour plots showing the lack of correlation between normalized DNA signal intensity (total signal intensity divided by the cell area) and NC ratio for the indicated species.
B. Density contour plots showing the lack of correlation between total DNA signal intensity and NC ratio for the indicated species.
C. Scatter plot showing the lack of correlation between the average NC ratio and the average normalized DNA signal intensity for all included species. Abbreviated species names are indicated next to the corresponding datapoint; see Key Resources Table for a full name description.
D. Scatter plots of average NC ratio versus average cell volume, average cell width, length and surface-area-to-volume ratio (SA/V) for all included species.
A. Randomly picked trajectories of GFP-μNS particles belonging to each of the size/intensity bins indicated in Figure 6A. E. coli (CJW6723) and C. crescentus (CJW6917) cells were grown in M9gly and M2G, respectively.
B. Same plot as Figure 6B on a log-log scale. Lighter-colored lines indicate 95% confidence intervals.
C. Ensemble-averaged MSDs of fluorescently-labeled ribosomes in E. coli (CJW6768) grown in M9glyCAAT and C. crescentus (CJW5156) grown in M2G acquired at different frame intervals. Each column corresponds to the indicated frame interval. Error bars indicate 95% confidence intervals. The aspect ratio between the x-axis (time delay) and y-axis (MSD) values was preserved across panels to facilitate comparison across acquisition-time intervals.
D. Same plots as Figure 6D on a log-log scale. Error bars indicate 95% confidence intervals. Line with a slope of 1 was added for comparison.
E. Schematic showing the area used for calculating the signal correlation factor (SCF). Two parameters define the “correlation area” to ensure optimal SCF calculations for cells with different shapes and sizes. The first parameter is the number of pixels, starting from the cell poles, to exclude from the calculation. The second parameter is the number of pixels, starting from the cell centerline, to include in the calculation. The SCF is calculated as the Pearson correlation between the pixel values of the two signals within this correlation area.
F. Left, frequency distribution of SCF values between nucleoid and ribosome signals in E. coli cells (CJW4677) after treatment with the indicated concentrations of formaldehyde for 15 min at room temperature followed by 30 min on ice for fixation. The nucleoid was detected by DAPI staining and the ribosome was visualized using the GFP fusion to the ribosomal protein RplA. Cells were grown in M9glyCAAT. Right, average SCF values for nucleoid and ribosome signals for the populations of cells shown in panel B.
Table S1. Related to Figure 1 and 7, and STAR Methods. Growth medium composition.
Table S3. Related to STAR Methods. Oligonucleotides used in this study.
The movie shows a time-lapse sequence of a GFP-μNS particle moving in an E. coli cell (CJW6723) grown in M9gly at 30 °C. The time-lapse sequence is shown as an overlay of fluorescence images (green) with the corresponding phase contrast images. The spot intensity (hence size) of the GFP-μNS particle is comparable to that of the GFP-μNS particle in the C. crescentus cell in Movie S2.
The movie shows a time-lapse sequence of a GFP-μNS particle moving in a C. crescentus cell (CJW6917) grown in M2G at 30 °C. The time-lapse sequence is shown as an overlay of fluorescence images (green) with the corresponding phase contrast images. The spot intensity (hence size) of the GFP-μNS particle is comparable to that of the GFP-μNS particle in the E. coli cell in Movie S1.
The movie shows a representative time-lapse sequence of the evolution of the ribosomal fluorescence recovery over time (up to 450 s) along the length of a cephalexin-treated E. coli cell (CJW4677) following photobleaching of about half of the cell.
The movie shows a representative time-lapse sequence of the evolution of the ribosomal fluorescence recovery over time (up to 450 s) along the length of an FtsZ-depleted cephalexin-treated C. crescentus cell (CJW3821) following photobleaching of about half of the cell.
Table S2. Related to STAR Methods. Construction of strains and plasmids used in this study.
Table S4. Related to Figures 1, 2, 3, 4, 5, S1, S2, S3, S4, S5 and S6. Raw data underlying figures.
Figure S2. Related to Figure 1. Variability in DNA content and DAPI staining efficiency do not affect NC ratio measurements in E. coli.
All contour lines represent the 0.10, 0.25, 0.50 and 0.75 probability envelopes of the data.
A. Density contour plots showing the lack of correlation between the NC ratio and the normalized DAPI signal intensity (total intensity divided by cell area) for CJW6324 cells grown in the indicated growth media.
B. Density contour plots showing the lack of correlation between total DAPI signal intensity and NC ratio for CJW6324 cells grown in the indicated growth media.
C. Scatter plots of the average cell area versus the average nucleoid area across growth conditions (color coded as in panels A and B) for different smoothing range values. The smoothing range is the Oufti objectDetection parameter that sets the rigidity of the nucleoid contours. The results for a smoothing range of 3 are shown in Figure 1D; this is the smoothing range value used for all other nucleoid detection analyses described in this study. Note that the smoothing range value changes the estimated nucleoid area (with smaller smoothing range values resulting in smaller nucleoid areas), but the trend with average cell size across nutritional conditions remains similar.
Figure S3. Related to Figures 1 and 2. The nucleoid-labeling method does not affect NC ratio measurements and nucleoid scaling occurs independently of cell division and DNA replication.
A. Density contour plots showing the strong correlation between cell area and nucleoid area for the different strains and nucleoid-labeling methods. The contour lines represent the 0.10, 0.25, 0.50 and 0.75 probability envelopes of the data. E. coli cells producing fluorescent fusions to the α or β HU subunit (CJW5556 producing HupA-mCherry and CJW4656 producing HupB-CFP) were grown in M9glyCAAT and either stained with 1 mM DAPI or not. For DAPI-stained cultures, nucleoid areas were determined using both the DAPI signal (first column) and the signal from the fluorescently-labeled HU (second column). For cultures not stained with DAPI, only the HU-CFP or HU-mCherry fluorescent signal was used (third column). As a reference, the relationship between cell area and nucleoid area for wild-type E. coli MG1655 cells grown in the same conditions and stained with DAPI is shown in blue (fourth column).
B. Average NC ratio (with error bars representing the standard deviation) for experiments shown in panel A.
C. Scatter plot of nucleoid area (measured using DAPI signal) versus nucleoid area (measured using fluorescently-labeled HU) for individual cells. Dotted red lines represent the identity lines, which indicate a perfect agreement between the two signals.
D. Plot showing the average nucleoid area per cell area bin for untreated and cephalexin-treated E. coli cells (CJW4677) grown in the indicated growth media and stained with DAPI. Error bars represent the standard deviation of the nucleoid area for each cell area bin.
E. Density scatter plot of relative cell age versus total DAPI signal of E. coli cells (CJW6324, n = 71488) grown in M9gly. Relative cell age was calculated by ordering cells according to their cell area and using the relationship described by Wold et al. (1994). Using this methodology, the overlap in cell size between cells in the B, C and D cell-cycle periods (see Figure 2B) leads to an almost monotonous increase in total DAPI intensity with cell age. This precludes the use of this method for identifying cells in different cell-cycle periods. The gray scale indicates the relative density of dots (cells) in a given area of the chart. Red dots indicate the mean total DAPI intensity values for cell age bins whereas the error bars show the standard deviations.
F. Density contour plots of cell area versus nucleoid area for CJW6324 cells in B, C, and D periods in the indicated growth media. The contour lines represent the 0.10, 0.25, 0.50 and 0.75 probability envelopes of the data. The nucleoid was detected by DAPI staining.
G. Left, bar graph showing the average NC ratio of CJW6324 cells in the B, C, or D cell-cycle periods. The cells were grown in the indicated growth media. Right, bar graph showing the slope of an unconstrained linear fit between cell area and nucleoid area for the cells shown in panel F.
Figure S4. Related to Figure 3. Robust nucleoid size scaling in C. crescentus.
All contour lines represent the 0.10, 0.25, 0.50 and 0.75 probability envelopes of the data.
A. Density contour plots showing the lack of correlation between the NC ratio and the total mCherry intensity (left) and between the NC ratio and the normalized mCherry intensity (right) for C. crescentus cells (CJW5806) producing an mCherry fusion to the HU subunit HU2. Cells were grown in M2G and the nucleoid area was determined using the HU-mCherry fluorescent signal.
B. Density contour plots of cell area versus nucleoid area for wild-type CB15N cells grown in M2G or PYE. The nucleoid was detected by DAPI staining.
C. Density contour plots showing the strong correlation between cell area and nucleoid area for the indicated CB15N-derived strains. All cells, whether FtsZ-depleted (CJW3821) or carrying a ΔrodZ (CJW1842) or Δhfq (CJW5477) deletion, were grown in PYE and the nucleoid was detected by DAPI staining. For FtsZ depletion, CJW3821 cells grown in PYE that contained xylose (0.3%) were washed and resuspended into PYE lacking xylose to inhibit ftsZ expression. Cells were imaged 3–6 h after cell resuspension. The nucleoid was detected by DAPI staining.
D. Average NC ratio (with error bars representing the standard deviation) for all strains and experiments included in this figure.
E. Density contour plots showing the strong correlation between cell area and nucleoid area for cells carrying a popZ deletion (CJW2238). The cells were grown in M2G because growth in PYE results in severe cell filamentation and loss of viability (Bowman et al., 2008; Ebersbach et al., 2008). The nucleoid was detected by DAPI staining.
Data Availability Statement
All raw data related to nucleoid size scaling (underlying Figures 1, 2, 3, 4, 5, S1, S2, S3, S4, S5 and S6) is provided in Table S4. All computer code is provided in Supplemental Data 1 and can also be found at https://github.com/JacobsWagnerLab/published.