Abstract
Neurofibromatosis type 1 (NF1) is a common tumor predisposition syndrome in which glioma is one of the prevalent tumors. Gliomagenesis in NF1 results in a heterogeneous spectrum of low- to high-grade neoplasms occurring during the entire lifespan of patients. The pattern of genetic and epigenetic alterations of glioma that develops in NF1 patients and the similarities with sporadic glioma remain unknown. Here, we present the molecular landscape of low- and high-grade gliomas in patients affected by NF1 (NF1-glioma). We found that the predisposing germline mutation of the NF1 gene was frequently converted to homozygosity and the somatic mutational load of NF1-glioma was influenced by age and grade. High-grade tumors harbored genetic alterations of TP53 and CDKN2A, frequent mutations of ATRX associated with Alternative Lengthening of Telomere, and were enriched in genetic alterations of transcription/chromatin regulation and PI3 kinase pathways. Low-grade tumors exhibited fewer mutations that were over-represented in genes of the MAP kinase pathway. Approximately 50% of low-grade NF1-gliomas displayed an immune signature, T lymphocyte infiltrates, and increased neo-antigen load. DNA methylation assigned NF1-glioma to LGm6, a poorly defined Isocitrate Dehydrogenase 1 wild-type subgroup enriched with ATRX mutations. Thus, the profiling of NF1-glioma defined a distinct landscape that recapitulates a subset of sporadic tumors.
Reporting Summary.
Further information on research design is available in the Nature Research Reporting Summary linked to this article.
NF1 is a common autosomal dominant disorder that results in the most frequent tumor predisposition syndrome. NF1 affects an estimated 100,000 people in the USA (1 in 3,000 individuals)1,2. Individuals with NF1 suffer from a wide range of clinical manifestations caused by the increased risk of malignant and non-malignant conditions compared with the general population3.
NF1 is caused by germline mutations in the NF1 tumor suppressor gene, which encodes a GTPase-activating protein called neurofibromin that functions as a negative regulator of the RAS oncoprotein. Neurofibromin regulates cell growth and survival through several downstream signaling effectors by accelerating the conversion of active GTP-bound RAS to its inactive GDP-bound form. Thus, loss of neurofibromin expression, as seen in tumors associated with NF1, is predicted to lead to increased cell growth and survival through hyperactivation of RAS4.
Recent genome-wide sequencing studies have revealed that sporadic malignancies including sporadic gliomas (both lower grade glioma and glioblastoma, GBM) have haploinsufficient or nullizygous loss of NF1, indicating that NF1 functions as a somatic tumor suppressor in the general population5.
NF1 patients are predisposed to develop brain tumors, and gliomas are seen in 15–20% of individuals with NF16,7. Approximately 15% of children with NF1 develop optic pathway, low-grade gliomas8. NF1 patients are also prone to developing non-optic gliomas, more frequently later in life, which manifest with a spectrum of histological subtypes including high-grade gliomas9. Although the predisposition to develop central nervous system tumors in patients with NF1 is well recognized, the molecular features of gliomas occurring in patients with NF1 have remained obscure, preventing development and application of novel therapeutic approaches. It is also unclear whether NF1-gliomas recapitulate the molecular profiles of the subtypes recently identified in sporadic gliomas10.
Here, we report a comprehensive analysis of NF1-gliomas. We define distinct features of low- and high-grade tumors in children and adults and describe a comparative evaluation of genomic features in syndromic NF1 and sporadic gliomas.
Results
Overview of cohort characteristics.
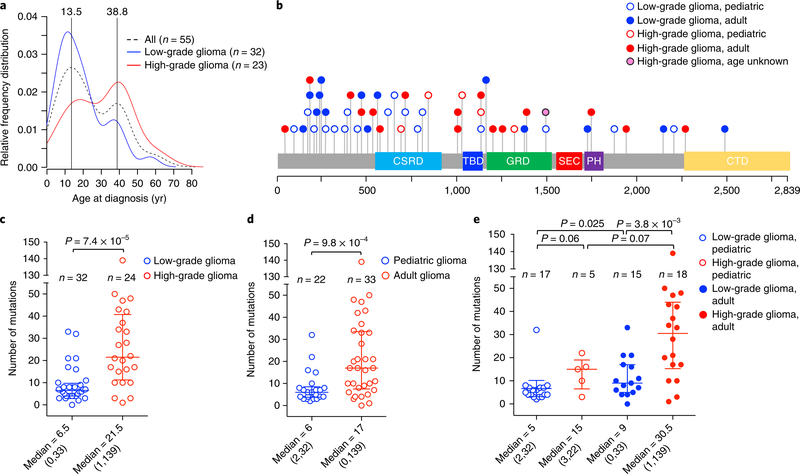
The tumor cohort analyzed in this study is composed of 59 glioma samples from 56 patients (33 females and 23 males) who met the clinical criteria of NF111. Tumor samples were from 22 children (age range, 2–15 years) and 33 adults (age range, 18–63 years), plus one patient lacking age information, and were classified as low grade (grades I and II, n = 35, 59%) and high grade (grades III and IV, n = 24, 41%; see Supplementary Table 1). The frequency distribution of patient age exhibited two main modes at 13.5 and 38.8 years, respectively. Children developed mostly low-grade tumors (17 of 22 or 77% of pediatric gliomas were low grade) and high-grade gliomas occurred primarily in adults (18 of 23 or 78% of high-grade tumors were observed in adults; see Fig. 1a). Age and grade distribution of our cohort is consistent with the notion that NF1-gliomas are primarily benign during childhood, whereas malignant gliomagenesis occurs later in life12,13.
Fig. 1 |. Analysis of germline and somatic mutations in NF1-glioma patients.
a, The relative frequency distribution of age at diagnosis is represented by density plot: the overall distribution of NF1-glioma patients (dashed black line, n = 55) by age identifies two peaks, 13.5 and 38.8 years. Low-grade gliomas (blue line, n = 32) occur more frequently in children, while high-grade gliomas (red line, n = 23) are diagnosed more frequently in adults. b, Germline mutations in the NF1 gene identified in NFI-glioma patients by WES. The spectrum of NF1 germline variants (SNVs and indels) is represented with each mutation shown only once per patient. We identified NF1 germline pathogenic mutation in 51 of 56 (91%) patients. Patients no. 47 and no. 52 had one additional pathogenic germline mutation. c, Scatter plot showing the number of somatic mutations (SNVs and indels) occurring in low-grade and high-grade NFI-glioma (low-grade glioma, n = 32; high-grade glioma, n = 24; P = 7.4×10⁻⁵, two-sided Mann-Whitney-Wilcoxon (MWW) test). d, Scatter plot showing the number of somatic mutations occurring in patients younger than 16 years (pediatric, n = 22) or older than 18 years (adult, n = 33; P = 9.8×10⁻⁴, two-sided MWW test). Mutations in the patient of unknown age were not included in the analysis. e, Scatter plot showing the number of mutations according to grade and age (low-grade glioma, pediatric, n = 17; high-grade glioma, pediatric, n = 5; low-grade glioma, adult, n = 15; high-grade glioma, adult, n = 18). Mutations in the patient of unknown age were not included in the analysis. P = 3.8×10⁻³, high-grade versus low-grade adult gliomas; P = 0.025, adult versus pediatric low-grade gliomas; P = 0.06, low-grade versus high-grade pediatric gliomas; P = 0.07, pediatric versus adult high-grade gliomas (two-sided MWW test). Scatter plots show median and interquartile range. Median and range of mutations are reported below each plot.
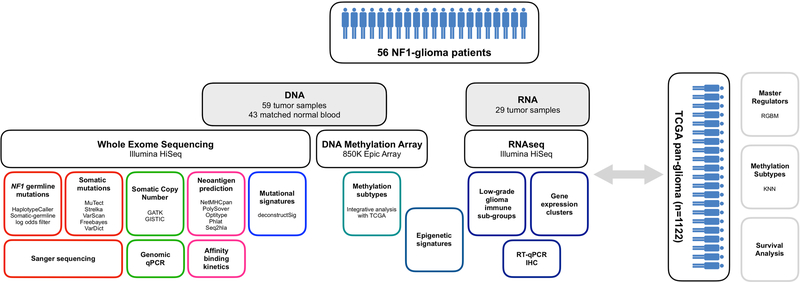
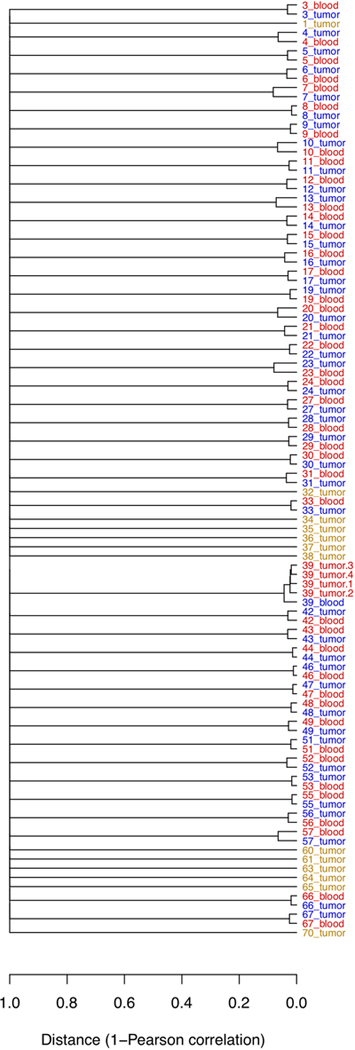
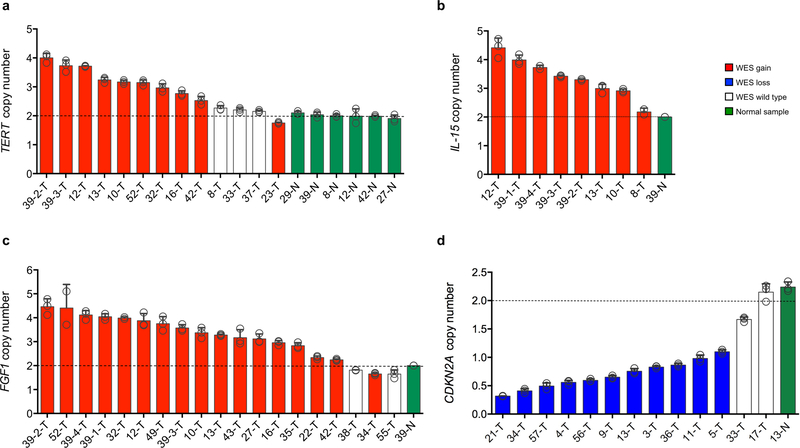
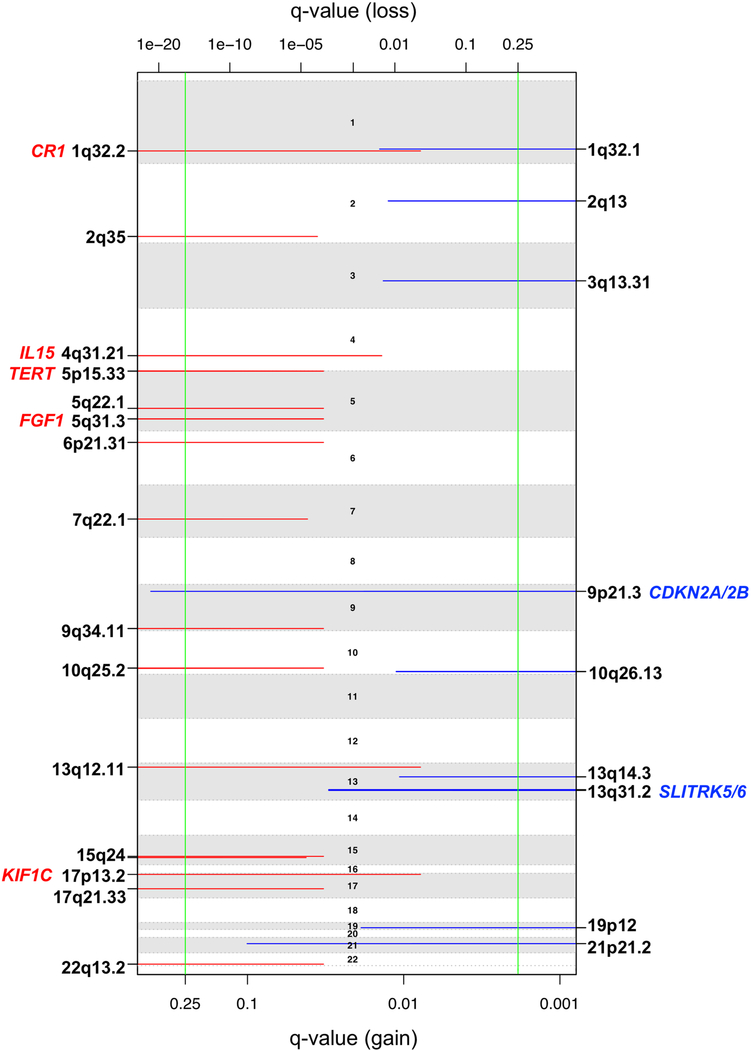
Whole exome sequencing (WES) was performed for the 59 NF1-glioma samples and matched blood DNA (available from 43 patients) and was used to call germline and somatic single nucleotide variants (SNVs), small insertions and deletions (indels), and copy number variations (CNVs) as previously described14–20 (see also Methods and Extended Data Fig. 1). A dendrogram resulting from a ‘fingerprint’ analysis built from depth-dependent correlation models of allele fractions of known single nucleotide polymorphisms (SNPs) to identify samples from the same individual21 confirmed the matching of normal blood and glioma tissue for each paired sample (Extended Data Fig. 2). We validated each class of germline and somatic DNA sequence alterations discovered by WES through secondary assays. Germline and somatic SNVs were confirmed by Sanger sequencing of matched blood and tumor DNA. Across variant types, we validated 93% of SNVs that are therefore referred to as verified variants (Supplementary Table 2). We determined the functional effects of each missense mutation and in-frame indel by applying a pathogenicity prediction platform including eight independent algorithms (four evaluating missense mutations and four evaluating indels; see Methods and Supplementary Tables 2-4). Recurrent WES-detected somatic CNVs were estimated by GISTIC2.0 and confirmed by qPCR of genomic DNA (CNV validation rate: 96%; see Extended Data Fig. 3a-d). We also carried out messenger RNA expression analysis from RNA sequencing of 29 tumors and DNA methylation of 31 tumors. A summary of the assays performed and case-assay overlap is presented in Supplementary Table 1.
The landscape of germline NF1 gene mutations in glioma patients.
To determine the pattern and frequency of the predisposing NF1 gene mutations in patients who developed glioma, we analyzed blood DNA by WES. We also inferred the germline status of NF1 mutations from the analysis of tumor-only samples using a recently described computational approach that models the allele frequency of genomic events under different scenarios accounting for copy number events, minor and major alleles, and clonality (Supplementary Table 3a,b)22. We found germline mutations inactivating the NF1 gene (typically truncating and frameshift) in 51 of the 56 (91%) patients analyzed. All mutation details are summarized in Supplementary Table 3a, b. The 91% NF1 germline mutation rate is within the highest frequencies previously reported in NF1 patients by several studies that have used multiple and highly sensitive assays for NF1 mutation detection (typically 83–95%)23–26. Among the identified NF1 germline mutations, 32 variants had previously been reported in NF1 patients (http://www.hgmd.cf.ac.uk)27, whereas 19 are new pathogenic variants. We did not find pathogenic germline variants in genes previously implicated in NF1-like syndromes (SPRED1, BRAF, CBL, GNAS, HRAS, KRAS, MAP2K1, MAP2K2, MLH1, MSH2, MSH6, NF2, NRAS, PMS2, PTPN11, RAF1, RASA2, RIT1, SHOC2, SOS1, SOS2)28‘29. The comparative analysis of blood and glioma DNA revealed that the variant allele frequency of the constitutive NF1 gene mutations increased, resulting in loss of heterozygosity in the majority of tumors (Supplementary Table 3a,b). The spectrum of NF1 mutations in patients who developed gliomas did not cluster into specific domains of the NF1 protein and the distribution of mutations was not related to patient age or tumor grade (Fig. 1b). These findings are in agreement with the broad distribution of germline mutations of the NF1 gene previously reported in unselected NF1 patients3,25. They also indicate that the probability of developing a brain tumor is not dependent on particular patterns of NF1 gene mutations in the patient’s germline. We found that, in addition to the pathogenic NF1 germline variant, seven tumors harbored a second NF1 somatic mutation (Supplementary Table 3a,b). This finding is consistent with previous studies that reported frequent somatic NF1 mutations in neurofibromas from NF1 patients26,30–34. We used four of seven tumor samples for which DNA or RNA was available to amplify a single fragment that included both germline and somatic mutations, cloned the amplified genomic or complementary DNA, and sequenced individual clones. As expected, we found that multiple clones for each tumor contained only the germline or somatic mutation, indicating that the two mutations reside on different alleles (Supplementary Table 5).
The landscape of somatic genomic alterations cooperating with NF1 for glioma development.
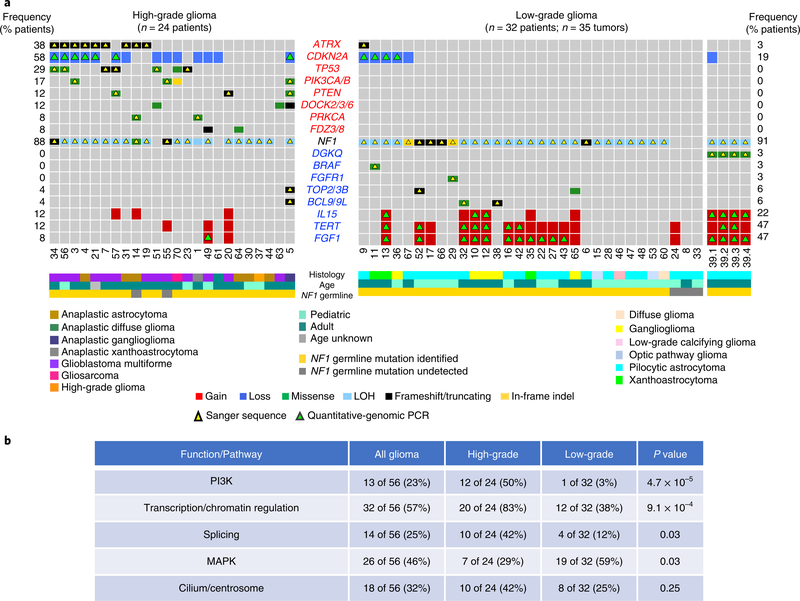
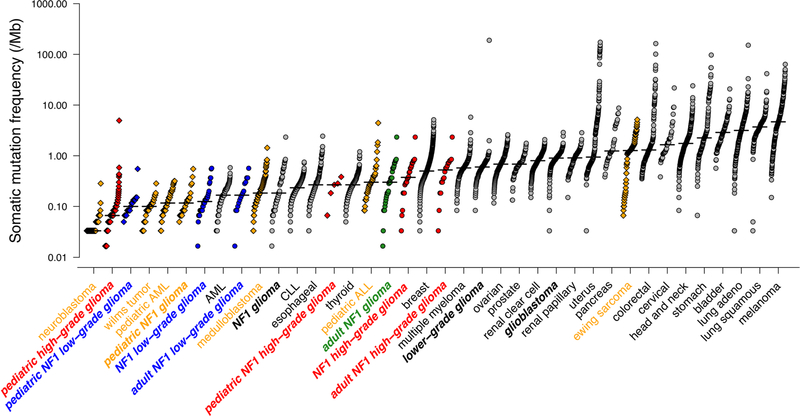
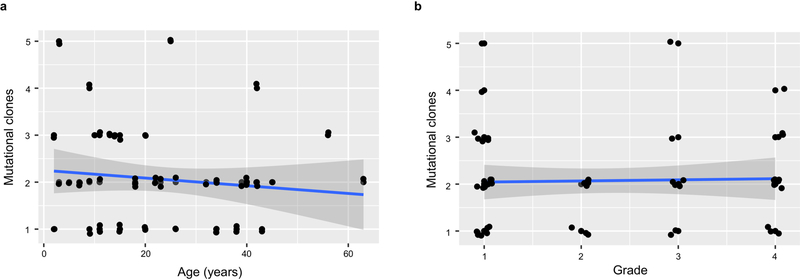
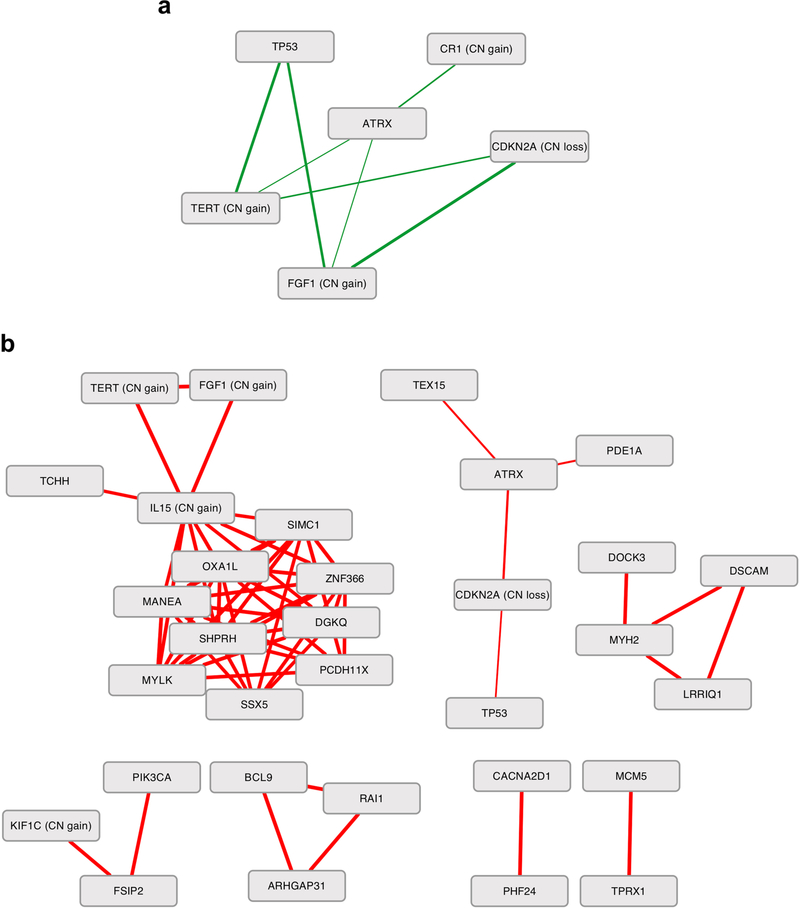
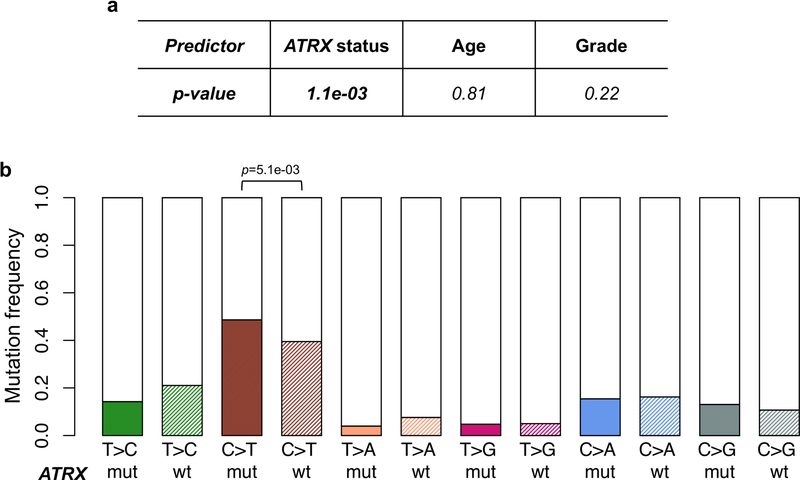
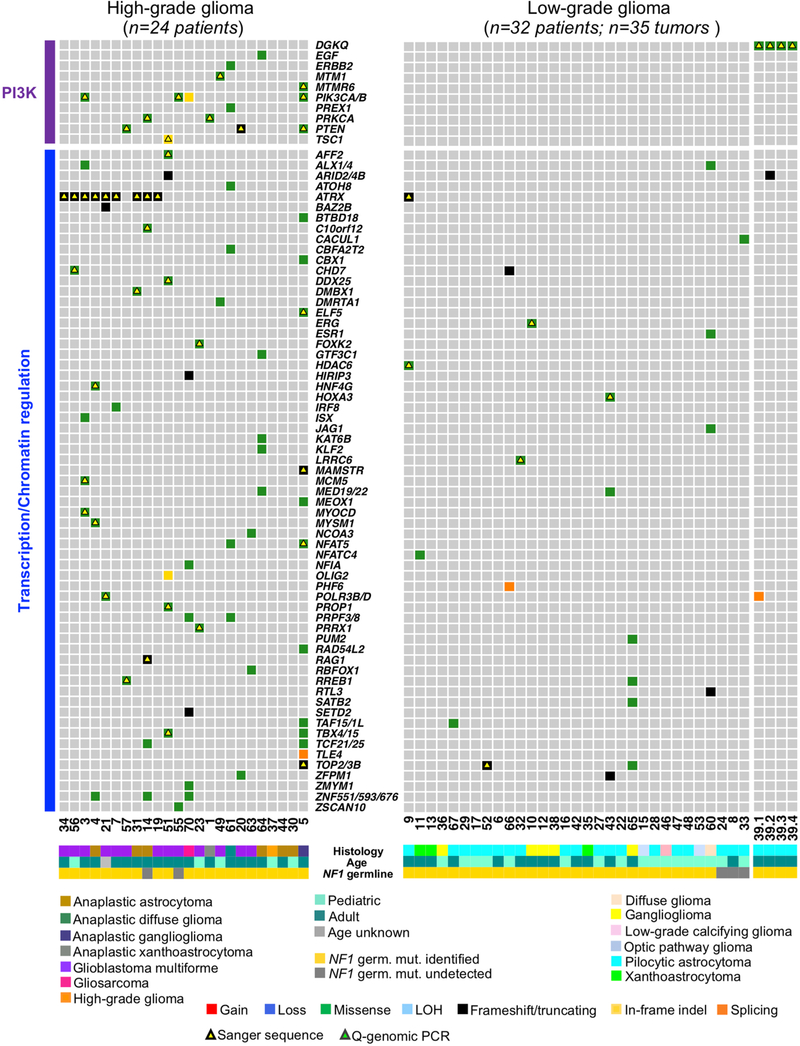
The application of a stringent somatic mutation-calling algorithm to the cohort of NF1-glioma resulted in 1,007 high-confidence somatic mutations across 59 tumors, including 838 SNVs and 169 indels, 767 of which were predicted to carry pathogenic effects (Supplementary Table 4). Mutation burden increased with grade and age, with high-grade gliomas of adults having a sixfold higher mutation load than low-grade tumors in children (Fig. 1c-e). The lowest rate of mutations in pediatric NF1-glioma is within the low range of mutation frequencies in pediatric tumors35. More specifically, it reflects the lower frequency of mutations of sporadic brain tumors in children compared with their adult counterparts (Extended Data Fig. 4). However, the mutational clonality of NFI-glioma was consistent across patients’ ages and tumor grades (Extended Data Fig. 5). The analysis of copy number changes of NFI-glioma using GISTIC2.0 led to the identification of CNVs selected on the basis of focality, amplitude, and recurrence of alterations. Statistically significant CNVs comprised gains at 5q31.3 (FGF1), 5p15.33 (TERT), 4q31.21 (IL15), and 17p13.2 (KIF1C), and losses at 9p21.3 (CDKN2A/CDKN2B; see Extended Data Figs. 3a-d and 6 and Supplementary Table 6a,b). The Isocitrate Dehydrogenase 1 (IDH1) gene, which is frequently mutated in sporadic low-grade gliomas and the Glioma-CpG Island Methylator Phenotype (G-CIMP) group of glioblastomas36,37, was wild-type in all 59 NF1-gliomas, regardless of grade and age. Similarly, mutations of H3.3 histone genes, genetic lesions frequently found in sporadic pediatric gliomas38, were absent in pediatric or adult NF1-gliomas. Additionally, the landscape of SNVs in low-grade NF1-gliomas was markedly different from that of high-grade tumors. Sporadic gliomas frequently harbor genetic alterations that cause telomere elongation. This process is typically carried out through mutations in the TERT gene promoter in IDH wild-type tumors10,39. Conversely, in lower grade, sporadic gliomas of adults harboring co-occurring mutations of IDH1 and TP53, the telomerase-independent alternative lengthening of telomeres (ALT) is sustained by inactivating mutations of ATRX, a gene encoding a chromatin remodeler and epigenetic modifier protein10,40. In NF1-glioma, we failed to detect mutations in the TERT promoter by targeted sequencing but we found copy number gain of the TERT gene more frequently in low-grade than high-grade tumors (47% versus 12%, P = 9 × 10⁻³; Fig. 2a). Despite the absence of IDH1 mutations, high-grade NF1-glioma frequently harbored inactivating mutations of ATRX (9 of 24, 38%; Fig. 2a). In contrast, this alteration was very rare in low-grade tumors (1 of 32 or 3.1%; Fig. 2a). ATRX mutations were mutually exclusive with TERT gene copy number gain and co-occurred with copy number loss of CDKN2A/CDKN2B, which was also more frequent in high-grade (58%) in comparison with low-grade tumors (19%; see Fig. 2a, Extended Data Fig. 7, and Supplementary Table 7), and mutations of TP53. TP53 mutations were absent in low-grade NF1-glioma (Fig. 2a). ATRX mutation emerged from a multinomial regression model41, including also age and grade, as the only independent predictor of somatic mutational spectrum in protein-coding regions (P = 1.1 × 10⁻³) with accumulation of C→T transitions in ATRX mutant NF1-glioma (Extended Data Fig. 8a, b). In conclusion, together with TP53 mutations and CDKN2A copy number losses, ATRX mutations characterize high- but not low-grade gliomas from NF1 patients.
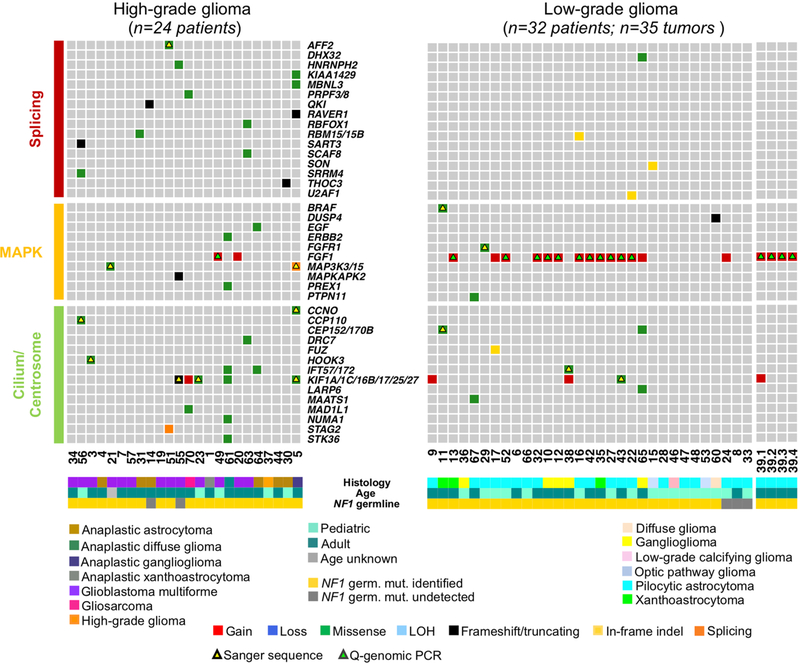
Fig. 2 |. Landscape of somatic genomic alterations in NF1-glioma.
a, Integrated matrix of 59 glioma samples from 56 patients and gene variants (SNVs, indels, and significant CNVs) observed in NF1-glioma (left panel, high-grade glioma; right panels, low-grade glioma). Rows and columns represent genes and tumor samples, respectively. Genomic alterations, age, the histology of glioma, and NF1 germline mutations are indicated. NFI-glioma samples are sorted by their mutation profiles, except for patient no. 5, hypermutated high-grade glioma, and patient no. 39, including four spatially distinct glioma samples, which are shown at the last columns of left and right panel, respectively. Recurrently mutated genes are selected for their previously established association with glioma (ATRX, CDKN2A, TP53, PIK3CA/B, PTEN, BRAF, FGFR1 and FGF1, PRKCA, TERT), cancer biology (DOCK2/3/6, FDZ3/8, BCL9/9L, TOP2/3B), and immune functions (IL15, DGKQ). Genes are sorted according to higher frequency (percentage of patients) in high-grade (top, red) or low-grade gliomas (bottom, blue), respectively. Validations by Sanger sequencing (SNVs) and quantitative-genomic PCR (gains and losses) are indicated by yellow and green triangles, respectively. LOH, loss of heterozygosity. b, Function/pathway analysis of damaging somatic mutations and CNVs. Genetic alterations in NF1-gliomas grouped into PI3K, transcription/chromatin regulation, splicing, MAPK, and cilium/centrosome functions. A significantly higher frequency of genetic alterations in PI3K, transcription/chromatin regulation, and splicing pathway were observed in high-grade glioma (n = 24; P = 4.7×10⁻⁵, P = 9.1×10⁻⁴, and P = 0.03, respectively; two-sided Fisher’s exact test), while mutations in the MAPK pathway were more frequent in low-grade glioma (n = 32; P = 0.03, two-sided Fisher’s exact test). The integrated matrices of NF1-glioma and gene pathway alterations are reported in Extended Data Figs. 9 and 10.
Gene pathway analysis performed on CNVs and SNVs that had been selected for pathogenic features indicated that five biological pathways were commonly targeted, often in a mutually exclusive manner. In total, 22 of 24 (92%) high-grade and 24 of 32 (75%) low-grade NF1-gliomas harbored genetic alterations in 1 or more of the 5 key biological processes (Fig. 2b and Extended Data Figs. 9 and 10). These included the PI3-kinase pathway that was more frequently targeted in high-grade (50%) compared with low-grade (3%) NF1-gliomas (P=4.7 × 10⁻⁵), the transcription/chromatin regulation pathway that was disrupted in high-grade at higher frequency than low-grade NF1-gliomas (83% and 38%, respectively, P = 9.1 × 10⁻⁴), and RNA splicing, affecting 42% of high grade and 12% of low grade (P = 0.03). Conversely, the MAP kinase pathway was more frequently targeted in low-grade than high-grade tumors (59% and 29%, respectively, P=0.03). Genetic alterations of cilium/centrosome occurred in a significant fraction of NF1-gliomas but were similarly distributed in high- and low-grade NF1-gliomas (Fig. 2b and Extended Data Figs. 9 and 10).
The multi-regional sampling of sporadic gliomas has revealed a notable extent of intra-tumoral heterogeneity42. We performed WES from four regionally distinct tumor fragments of a pilocytic astrocytoma from an adult patient with NF1 (patient no. 39). Among the 4 fragments, 36 of 64 of the observed alterations (56%, including 29 copy number gains and 7 SNVs) were shared by all samplings, whereas 37% of alterations (24 of 64, including 5 copy number gains, 12 copy number losses, and 7 SNVs) were private to a single tumor lesion (Supplementary Fig. 1).
Validation and functional characterization of ATRX inactivation in high-grade NF1-glioma.
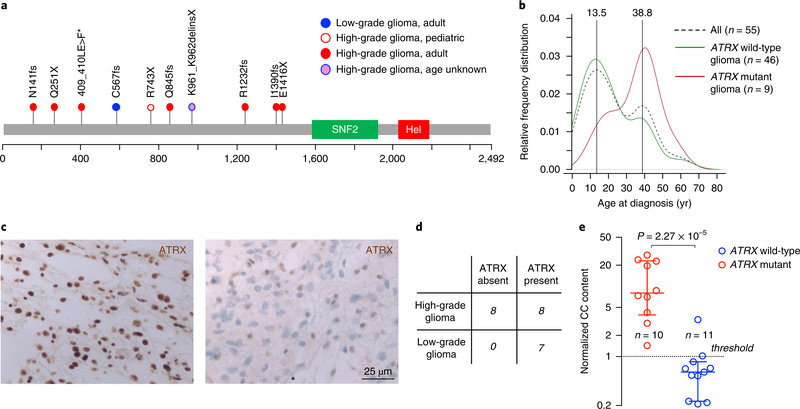
Functional annotation revealed that ATRX mutations are damaging events predicted to generate truncated or inactive ATRX proteins (Fig. 3a and Supplementary Table 4). In accordance with the increased frequency of high-grade tumors in older patients, we also found that ATRX mutations in NF1-gliomas primarily occurred in adults. Conversely, ATRX mutations were rare in children as only 1 of the 22 pediatric NF1-gliomas (4.5%) harbored an ATRX mutation (Fig. 3b).
Fig. 3 |. Analysis of ATRX somatic mutations in NF1-glioma patients.
a, ATRX mutations were identified by WES. The spectrum of ATRX somatic variants (SNVs and indels) is represented with each mutation shown only once per patient. We identified and validated by Sanger sequencing ATRX pathogenic mutations in 10 patients (1 low-grade glioma, 3%; 9 high-grade gliomas, 37.5%). b, The relative frequency of age distribution is represented for all patients (dashed black line, n = 55), ATRX wild-type (green line, n = 46), and ATRX mutant gliomas (red line, n = 9; for one patient carrying ATRX mutation age was unknown and was not included in the analysis). c, Microphotographs of ATRX immunohistochemistry in gliomas from NF1 patients. Representative images are from n = 7 low-grade gliomas (left) and n = 16 high-grade gliomas (right). Results were validated on more than ten independent samples to ensure the staining pattern on human tissue was reproducible. High-grade glioma samples were negative for ATRX expression whereas low-grade gliomas retained ATRX protein expression. d, Contingency table shows loss of ATRX protein expression in 8 of 16 high-grade and in none of 7 low-grade NF1-gliomas (P= 0.05, two-sided Fisher’s exact test). e, C-circle (CC) assay was performed to measure ALT activity in NF1-glioma samples. The scatter plot reports the normalized CC content for each glioma according to ATRX mutational status: ATRX wild-type (blue, n = 11) and ATRX mutant gliomas (red, n = 10). For each group the median with interquartile range is indicated. All ATRX mutant gliomas but only one ATRX wild-type glioma showed increased ALT activity (normalized CC content greater than 1; P = 2.3×10⁻⁵, two-sided MWW test).
As ATRX mutations occurring in NF1-gliomas are predicted to severely impact ATRX protein expression, we sought to validate our sequencing findings in an independent data set of 23 NF1-gliomas (16 high-grade and 7 low-grade) using formalin-fixed, paraffin-embedded samples and ATRX immunohistochemistry. Whereas ATRX protein expression was detected in 7 of 7 (100%) low-grade tumors, it was undetectable in 8 of 16 (50%) high-grade NF1-glioma samples (P = 0.05; Fig. 3c,d). Thus, immunohistochemistry data converged with sequencing results and confirmed that approximately half of high-grade gliomas from NF1 patients lose ATRX, which is instead retained in low-grade tumors. Next, we asked whether loss of ATRX is associated with the ALT phenotype in the context of NF1-gliomas. In primary tumors, ALT can be determined by measuring a specific type of circular and mostly single-stranded C-rich extrachromosomal telomeric repeat (C-circles)43. The C-circle assay of 21 NF1-gliomas from which genomic DNA was available showed that 10 of 10 gliomas harboring ATRX mutations scored positive for the presence of ALT-specific C-circles but only 1 of 11 (9%) tumors that retained a wild-type ATRX gene was positive for C-circles (P = 2.3 × 10⁻⁵; see Fig. 3e).
A subgroup of low-grade NF1-glioma exhibits an enriched immune transcriptome and contains abundant cytolytic T lymphocyte infiltrates and tumor neoantigens.
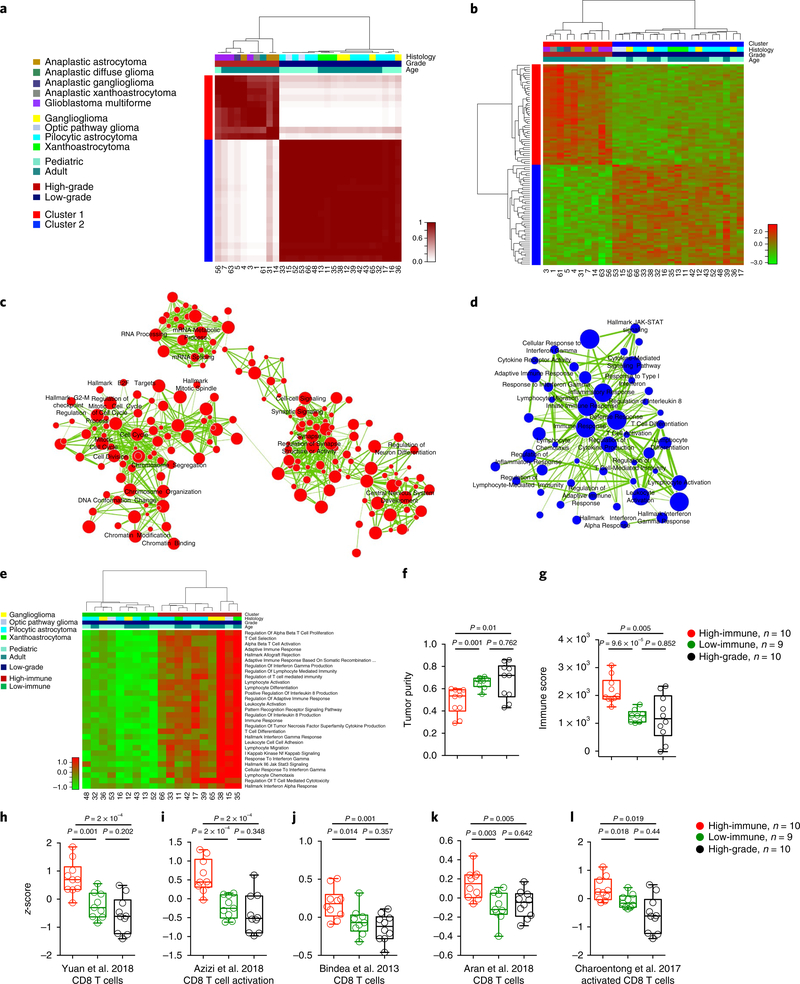
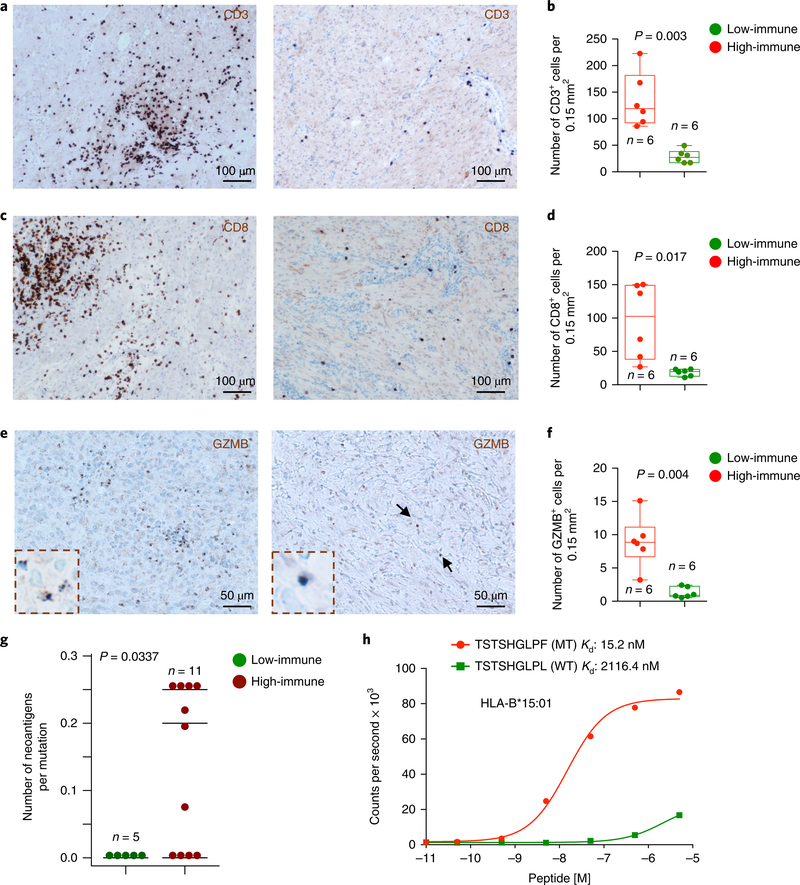
To segregate the RNA expression subtypes across the NF1-glioma data set, we analyzed 29 RNA-sequencing (RNAseq) profiles from 10 high-grade and 19 low-grade NF1-gliomas through unsupervised consensus clustering based on the 1,330 most variable genes, which resulted in 2 main clusters (cluster 1, red; cluster 2, blue; see Fig. 4a). Cluster 1 was specific for high-grade and cluster 2 for low-grade NF1-gliomas, thus indicating that tumor grading was the primary driver of transcriptome clustering. Next, we sought to identify the functional categories that characterize each cluster. A hierarchical clustering based on the 100 most differentially expressed genes between the 2 groups was constructed with the Mann-Whitney-Wilcoxon (MWW) test, from which we extracted the top and bottom 50 genes of the test statistics (Fig. 4b and Supplementary Table 8a,b). We performed a functional analysis of gene expression categories differentially enriched in high-grade versus low-grade NF1-glioma samples using a recently described robust, two-sided, single-sample MWW gene set test (MWW-GST) to inform the construction of a gene ontology enrichment map network (q <0.001, absolute normalized enrichment score (NES) >0.6)44. The network revealed that the genes enriched in high-grade NF1-gliomas belonged to categories involved in cell cycle and mitosis, chromosome organization, RNA metabolism, and neurogenesis, whereas the biological functions activated in low-grade NF1-gliomas composed an interconnected network of immune response categories notably enriched for T lymphocyte effector functions (Fig. 4c,d and Supplementary Table 9a,b). To recognize the individual low-grade tumors that exhibit immune cell activation, we applied single-sample MWW-GST using the enriched immune gene sets. The analysis showed that low-grade NF1-gliomas divided into two clusters, characterized by high- and low-immune gene expression, respectively (Fig. 4e). No histological group was predominant in either cluster (Pearson’s chi-squared P = 0.9635). qPCR with reverse transcription (RT-qPCR) confirmed that immune genes were elevated in the high-immune group of NFl-gliomas (Supplementary Fig. 2a and Supplementary Table 10). The application of ESTIMATE45, a validated computational approach for the inference of the fraction of stromal/immune cells and consequently the tumor cell purity within tumor samples, showed that the low-grade/high-immune group had significantly lower tumor purity and higher immune score when compared with either the low-grade/low-immune or the high-grade groups (Fig. 4f,g). A transcriptomic-based analysis with five different CD8+ T cell-specific gene expression signatures46–50 showed that low-grade/high-immune NFl-gliomas contain higher numbers of effector CD8+ T cells (Fig. 4h-l). This finding was confirmed by quantitative immunostaining for the T lymphocyte markers CD3 and CD8 (Fig. 5a-d). Interestingly, the T cell infiltrates in high-immune NFl-gliomas included cells positive for granzyme B (GZMB), the key cytolytic effector that is upregulated on CD8+ T cell activation, and productive responses to immunotherapies (Fig. 5e,f). Conversely, immunostaining for specific markers of B lymphocytes (CD20) and macrophages (CD68) indicated that these cell types are very rare in both high- and low-immune groups (Supplementary Fig. 2b,c).
Fig. 4 |. Transcriptomic analysis of NF1-glioma.
a, Consensus clustering on the Euclidean distance matrix based on the most variable genes among 29 NF1-glioma samples (1,330 genes). The consensus matrix is obtained from 10,000 random samplings using 70% of the 29 samples. The 10 high-grade samples fall in 1 cluster (red) and all low-grade samples (n = 19) fall in a different cluster (blue). b, Hierarchical clustering of 29 NF1-gliomas by Euclidean distance with the Ward linkage method was based on the 100 most differentially expressed genes (two-sided MWW test, top and bottom 50 genes). c,d, Enrichment map network of statistically significant gene ontology categories in (c) ten high-grade and (d) 19 low-grade NF1-gliomas (two-sided MWW-GST; q < 0.001, absolute NES >0.6). Nodes represent gene ontology terms and lines their connectivity. Node size is proportional to number of genes in the gene ontology category and line thickness indicates the fraction of genes shared between groups. Gene network categories in NF1 high-grade gliomas are linked to mitotic progression, chromosome organization, and RNA biogenesis/regulation. Gene network categories in NF1 low-grade gliomas converge on proinflammatory immune response enriched for T lymphocyte effector functions. e, Unsupervised clustering of single-sample MWW-GST enrichments of the categories in d. Low-grade NF1-gliomas are divided into two clusters (red and green), characterized by high- and low-immune gene set enrichments, respectively (two-sided MWW test; only statistically significant categories are shown; the complete list is presented in Supplementary Table 8). f, Tumor purity scores of low-grade/high-immune, low-grade/low-immune, and high-grade tumors computed by ESTIMATE. The low-grade/high-immune group has significantly lower tumor purity when compared with either the low-grade/low-immune or the high-grade glioma groups (P = 0.001, high-immune versus low-immune low-grade gliomas; P = 0.01 high-immune low-grade gliomas versus high-grade gliomas; P = 0.762 for low-immune low-grade gliomas versus high-grade gliomas; two-sided t-test). g, Immune scores of low-grade/high-immune, low-grade/low-immune, and high-grade tumors computed by ESTIMATE (P = 9.6×10⁻⁵, high-immune versus low-immune low-grade gliomas; P = 0.005 high-immune low-grade gliomas versus high-grade gliomas; P = 0.852 for low-immune low-grade gliomas versus high-grade gliomas; two-sided t-test). h-l, Enrichments of CD8+ T cell functions in low-grade/high-immune compared with low-grade/low-immune and high-grade gliomas. Boxplots report the z-scores and P values (two-sided MWW test) for published CD8+ T cell signatures46–50. Scatter plots show median, interquartile, and minimum to maximum range.
Fig. 5 |. T cell infiltration and neoantigen analysis in low-grade NF1-glioma subclusters.
a, Representative microphotographs of CD3 immunohistochemistry in low-grade/high-immune (left panels) and low-grade/low-immune (right panels) NF1-gliomas. Results were validated on more than ten independent samples to ensure that the staining pattern on human tissue was reproducible. b, The number of CD3-positive cells was scored in at least 5 pictures from low-grade/high-immune (n = 6, red dots) and low-grade/low-immune (n = 6, green dots) (*P = 0.003, two-sided t-test with Welch correction; scatter plots show mean with minimum to maximum range). c, Representative microphotographs of CD8 immunohistochemistry in low-grade/high-immune (left panels) and low-grade/low-immune (right panels) NFI-gliomas. Results were validated on more than ten independent samples to ensure that the staining pattern on human tissue was reproducible. d, The number of CD8-positive cells was scored in at least 5 pictures from low-grade/high-immune (n = 6, red dots) and low-grade/low-immune (n = 6, green dots) (*P = 0.017, two-sided t-test with Welch correction; scatter plots show mean with minimum to maximum range). e, Representative microphotographs of GZMB immunohistochemistry in low-grade/high-immune (left panels) and low-grade/low-immune (right panels) NFI-gliomas. Results were validated on more than ten independent samples to ensure that the staining pattern on human tissue was reproducible. f, The number of GZMB-positive cells was scored in at least 5 pictures from low-grade/high-immune (n = 6, red dots) and low-grade/low-immune (n = 6, green dots) (*P = 0.004, two-sided t-test with Welch correction; scatter plots show mean with minimum to maximum range). g, Quantification of neoantigens in low-grade NFI-glioma subclusters. The number of neoantigens per somatic mutation was significantly higher in the set of low-grade/high-immune NFI-gliomas (P = 0.034, two-sided MWW test). h, In vitro binding affinity kinetics of neoantigens and corresponding wild-type peptides for their restricted HLA class I allele. Data are shown as counts per second with increasing peptide concentration (log10 M). Data are mean of two independent experiments. MT, mutant peptide; WT, wild-type peptide.
Recent data showed that aberrant DNA methylation of genes expressed by immune cells regulates the extent of immune infiltration in solid tumors51,52. Therefore, we asked whether activation of an immune signature in NFl-gliomas might be driven by differential DNA methylation. Towards this aim, we profiled 11 of the low-grade NFl-gliomas previously analyzed by RNAseq with the 850K Epic Methylation platform. Clustering based on the probes differentially methylated between high- and low-immune tumors revealed that the low-immune group exhibited a larger number of hyper-methylated probes than the high-immune cluster (229 versus 30, P <0.0l, and absolute methylation fold-change >0.3; see Supplementary Fig. 3a and Supplementary Table 11a,b). Functional gene ontology analysis of the genes corresponding to the hyper-methylated probes in the low-immune group of NFl-gliomas identified enriched immune system categories (Supplementary Fig. 3b and Supplementary Table 12). We further confirmed this finding by an integrated analysis of gene expression and DNA methylation, from which a total of 68 genes enriched for immune categories emerged as significantly hyper-methylated and down-regulated in low-versus high-immune NFl-gliomas (Supplementary Fig. 3c,d and Supplementary Tables 13 and 14). At least eight of these genes (indicated in the magnified area of Supplementary Fig. 3c) are involved in important T lymphocyte functions.
The execution of an effective anti-tumor immune response by effector T cells is typically driven by neoantigens generated by somatic mutations of cancer cells53. To assess whether high- and low-immune NFl-glioma subtypes contain a different number of tumor-specific neoantigens, we evaluated NFl-gliomas profiled with matched germline/tumor WES and tumor RNAseq for HLA typing and tumor neoantigen identification. The analysis revealed that the high- but not the low-immune group of NFl-gliomas expressed neoantigens (Fig. 5g). To characterize the neoantigens identified in high-immune NFl-gliomas, we performed a homogenous, proximity-based assay that measures the affinity kinetics of mutant neoantigens and corresponding wild-type peptides for binding to their restricted HLA class I allele54. The mutant peptides bound with markedly higher affinity to HLA than their wild-type peptide counterpart, consistent with the mutations conferring enhanced HLA binding (Fig. 5h and Supplementary Fig. 4).
NF1-gliomas resemble LGm6 subgroup of sporadic gliomas.
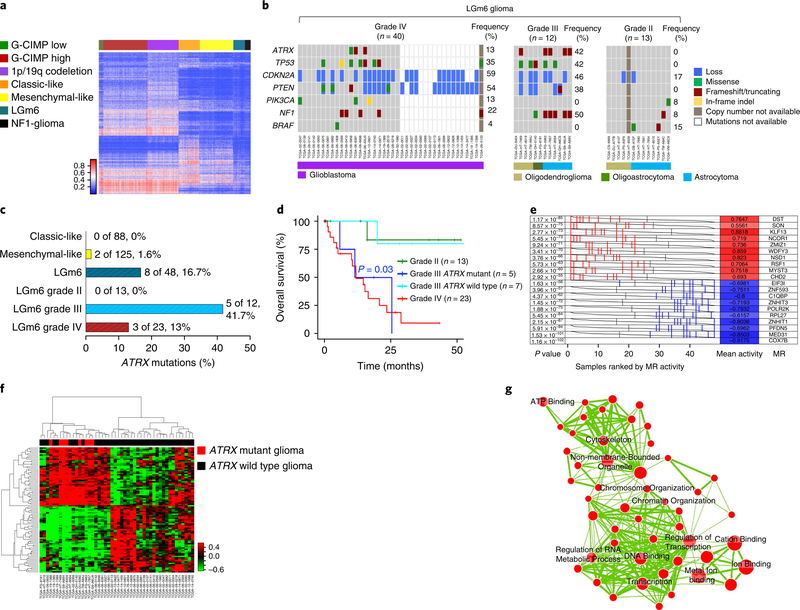
Having identified the landscape of genetic and epigenetic features of NFl-gliomas, we sought to relate them to those of the different subgroups of sporadic gliomas that we have recently reported in the pan-glioma cohort from The Cancer Genome Atlas (TCGA) project10. We first compared the epigenetic features through an integrative analysis of DNA methylation profiles of NFl-gliomas and the TCGA pan-glioma data set. We integrated NFl-gliomas with the TCGA pan-glioma cohort (n = 819) on 1,233 glioma-specific methylation probes and performed a supervised classification of NFl-gliomas using a nearest neighbor classifier trained on sporadic gliomas. We also performed an unsupervised clustering, merging sporadic TCGA gliomas and NFl-gliomas. Both supervised and unsupervised analyses showed that all of the NFl-glioma samples belong to the LGm6 group of gliomas, which is characterized by the divergent survival between grade II and III tumors (pilocytic astrocytoma-like) and grade IV tumors10 (LGm6-GBM; see Fig. 6a and Supplementary Fig. 5). Next, we used mathematical methods based on a multiple linear regression model to deconvolute mutation signatures that in other cancer types have been associated with distinct underlying mutational processes55 (Supplementary Fig. 6). The clustering of the TCGA pan-glioma cohort of IDH wild-type tumors based on mutational signatures revealed that the large majority (86%) of sporadic gliomas belonged to a group (cluster 2) that displays a single mutational signature (signature l). Conversely, a smaller group of tumors (cluster l) was richer in mutational signatures, including signature 3 that has been associated with failure of DNA double-strand break-repair by homologous recombination55. Although cluster l contained only l4% of IDH wild-type gliomas, it included 20 of 48 (42%) LGm6 tumors, therefore manifesting a marked enrichment for this methylation group (P = 8.l × l0–8). Interestingly, l00% of NFl-gliomas fell within cluster l (Supplementary Fig. 6a). The subset of sporadic LGm6 gliomas in cluster l exhibited significant enrichment for low-grade histology (P = 0.02) and, albeit not reaching statistical significance, there was a trend for increased frequency of NF1 mutations in this group (Supplementary Fig. 6c).
Fig. 6 |. NF1-gliomas resemble LGm6 subgroup of sporadic gliomas.
a, Heat map of DNA methylation data for the TCGA pan-glioma cohort (n = 819) and 31 NFI-gliomas according to the methylation clusters of sporadic gliomas10. The methylation profiles of NFI-glioma samples were classified using a nearest neighbor classifier based on 1,233 cancer-specific DNA methylation probes. Thirty-one of 31 NFI-glioma samples were assigned to the LGm6 methylation cluster, one of the methylation clusters that includes both low-grade and high-grade gliomas. b, Oncoprint of selected somatic genomic alterations in the LGm6 group of gliomas from the TCGA data set (ATRX, TP53, CDKN2A, PTEN, PIK3CA, NF1, BRAF). Rows and columns represent genes and samples, respectively. Glioma grade was significantly associated with alterations of ATRX, TP53, CDKN2A, PTEN. Glioma grade IV, n = 40; glioma grade III, n = 12; glioma grade II, n = 13; P = 0.01, P = 0.02, P = 0.04, P = 0.002, respectively; two-sided Fisher’s exact test. c, Barplot of ATRX non-synonymous somatic mutations occurring in phenotypic subtypes of IDH wild-type gliomas (classic-like, mesenchymal-like, and LGm6) and LGm6 gliomas grouped by tumor grade. ATRX mutations were significantly enriched in grade III LGm6 (P = 0.01, two-sided Fisher’s exact test). d, Kaplan-Meier survival analysis of LGm6 gliomas stratified according to histological grade and ATRX status for grade III gliomas: grade II (green curve, n = 13), grade III ATRX mutant (blue curve, n = 5), grade III ATRX wild-type (cyan, n = 7), grade IV (red curve, n = 23). The ATRX mutant grade III subgroup showed a significantly worse survival when compared with ATRX wild-type grade III patients (P = 0.03, two-sided log rank test). No difference in clinical outcome was observed when comparing ATRX mutant grade III with grade IV. e, Master regulators (MRs) in ATRX mutant glioma. Gray curves represent the activity of each of the 10 MRs with the highest (red) or lowest (blue) activity. Red or blue lines indicate individual ATRX mutant samples displaying high or low activity, respectively, of the MRs in ATRX mutant compared with ATRX wild-type (n = 8 and n = 40 ATRX mutant and ATRX wild-type samples, respectively; P value, two-sided MWW test for differential activity (left) and mean of the activity (right)). f, Hierarchical clustering of MR activity in 48 high-grade LGm6 IDH wild-type gliomas (36 grade IV and 12 grade III). Data were obtained using the Euclidean distance and Ward linkage method built on differential activity of MRs in ATRX mutant (8 samples, red) versus ATRX wild-type (40 samples, black) tumors (two-sided MWW-GST q <0.01, absolute NES >0.6, and two-sided MWW test for differential activity P <0.01). The activity of 41 of 89 MRs was increased in ATRX mutant samples. g, Enrichment map network of statistically significant gene ontology categories (two-sided Fisher’s exact test q <0.01) for genes included in the regulons of the 10 MRs with the highest activity in ATRX mutant gliomas. Nodes represent gene ontology terms and lines their connectivity. Node size is proportional to number of genes in the gene ontology category and line thickness indicates the fraction of genes shared between groups.
Next, we explored in more detail the pattern of driver mutations and CNVs of the LGm6 group of sporadic gliomas to ask whether it was related to the landscape of somatic alterations of NFl-gliomas. We found that somatic mutations of the NF1 gene are frequent in LGm6 tumors (25%). We also found that the key alterations identified in high-grade NFl-gliomas (ATRX and TP53 mutations and CDKN2A copy number losses) were also highly recurrent in LGm6 grade III and IV tumors in the LGm6 subgroup (Fig. 6b). Re-evaluation of ATRX status revealed that mutation of this gene is more frequent in this group than the other subtypes of sporadic IDH wild-type gliomas (Fig. 6c). This was in contrast with grade II tumors that lacked ATRX mutations and displayed a greatly reduced frequency of mutations (Fig. 6b,c). Furthermore, we found that, whereas the clinical outcome of LGm6-GBM was poor regardless of the ATRX status, ATRX mutations conferred a significantly worse prognosis to the grade III LGm6 patients (P = 0.03), with a survival that was comparable to that of LGm6-GBM. In contrast, survival of patients with ATRX wild-type grade III LGm6 glioma was similar to patients with grade II LGm6 glioma (Fig. 6d).
Finally, to identify the transcription factors that are causally involved as master regulators of the transcriptomic changes associated with loss of ATRX in the LGm6 group of IDH wild-type gliomas, we used the transcriptional network assembled from a TCGA-derived pan-glioma cohort and applied the regularized gradient-boosting machine (RGBM) approach, a recently developed algorithm that involves gradient-boosting machines for the inference of gene regulatory networks. RGBM was benchmarked with synthetic data and used to identify the master regulators that direct mitochondrial metabolic reprogramming of tumors harboring the FGFR3-TACC3 gene fusions44,56. We inferred the activity of master regulators enriched in ATRX mutant samples within the LGm6 cluster of IDH wild-type gliomas by computing a score that integrates the ability of transcription factors to activate their targets in each individual tumor sample. The analysis resulted in 41 activated master regulators and 48 inhibited master regulators in the 8 ATRX mutant high-grade LGm6 samples compared with 40 ATRX wild-type gliomas (two-sided MWW-GST q < 0.01, absolute NES > 0.6, and two-sided MWW test for differential activity q <0.01; see Fig. 6e and Supplementary Table 15). Unsupervised consensus clustering based on the activity of master regulators resulted in two main clusters defined by the divergent activity of the two groups of master regulators. The first cluster included all ATRX mutant samples, whereas the second cluster was exclusively composed of ATRX wild-type samples (Fig. 6f). This finding independently validates the 41 activated master regulators as key drivers of the hallmark features of ATRX mutant gliomas within the LGm6 group. The enrichment map network built from gene ontology categories and informed by the inferred targets of the 10 most active master regulators in ATRX mutant tumors shown in Fig. 6e indicated that chromatin and transcription regulation are among the most enriched functions (Fisher’s exact test q <0.01; see Fig. 6g and Supplementary Table 16a,b). This is consistent with the role of the most active master regulators in ATRX mutant gliomas (MYST3, CHD2, ZMIZ1, NCOR1, NSD1) as chromatin and epigenetic modifiers. The activation of a unique set of master regulators with important functions in chromatin remodeling and transcriptional coregulation as drivers of the ATRX mutant transcriptome within the IDH wild-type LGm6 cluster provides a clue to the molecular events that become deregulated and trigger global epigenomic remodeling and transcriptional changes following loss of ATRX function in brain tumors.
Discussion
Here, we reported the landscape of genetic and epigenetic alterations of gliomas occurring in NF1 patients. It is important to consider that the inaccessible brain tumor location, the relatively benign behavior of brain lesions, the comorbidities, and the neurological deterioration associated with surgical intervention most frequently argue against surgery as choice of treatment for glioma patients with NF113. Therefore, the collection of glioma samples analyzed in this study represents the selected subset of tumor lesions that undergo surgical resection in NF1 patients. Nevertheless, a comprehensive analysis of the complete spectrum of glioma grades throughout the lifespan of NF1 patients has allowed us to follow NF1 gliomagenesis and identify the genetic modules and the expression signatures that distinguish low-from high-grade tumors. We found that abundant infiltrates of activated T lymphocytes and mutation-derived neoantigens characterize a subset of low-grade gliomas, whereas high-grade tumors exhibit frequent mutations of ATRX typically co-occurring with alterations of TP53 and CDKN2A. We also classified gliomas occurring in the context of the NF1 syndrome within a particular methylation sub-group of sporadic gliomas, the LGm6, that recapitulates mutational and epigenetic profiles of NF1-glioma. The discovery that ATRX mutations drive aggressiveness in NF1-glioma prompted re-evaluation of the mutational and clinical features of the sporadic glioma counterpart (LGm6), leading to a more accurate classification of the sporadic tumors that cluster into this group.
The NF1 tumor-predisposing syndrome is associated with a heterogeneous pattern of glioma in children and adults57. Therefore, the dissection of the molecular landscape of glioma in NF1 patients required a comprehensive molecular study of brain tumors that could not be limited to a particular age and/or glioma grade. We observed several features that differentiate low-grade gliomas— which are relatively more common in children—from the high-grade tumors that instead predominate in adults with NF1. Pediatric low-grade NF1-gliomas exhibit a very low overall mutation rate in comparison to high-grade tumors, with few recurrent somatic mutations. The only set of recurrently mutated genes in low-grade NF1-glioma are genes involved in the MAPK pathway, thus recapitulating the genetic features of sporadic pilocytic astrocytoma. Conversely, the mutation burden of high-grade glioma in NF1 patients was higher and was characterized by recurrent alterations composing a genetic module that includes loss-of-function events targeting ATRX, TP53, and CDKN2A. Loss of ATRX in high-grade NF1-glioma is unique when considered within the genetic contexts associated with ATRX mutations in sporadic gliomas, in which they are typically associated with mutations of H3.3 in children or IDH1 in adults. The inactivating mutations of the ATRX gene result in loss of a functional ATRX protein with at least two important mechanistic consequences: development of the ALT phenotype and activation of a transcriptional/chromatin remodeling gene expression signature in ATRX mutant NF1-glioma.
Previous work reported that mouse models of low-grade glioma sustained by loss of NF1 manifest specific alterations of the immune microenvironment58. The analysis of human NF1-glioma confirms and extends this notion. We found that, compared with high-grade tumors, the gene expression signature more strongly enriched in low-grade NF1-glioma is an immune signature including several effector lymphocyte categories. This has been confirmed by the finding that the high-immune group of low-grade NF1-glioma contains both rich infiltrates of T lymphocytes, some of which are endowed with cytolytic activity, and mutation-derived neoantigens that exhibited enhanced HLA binding. The reduced DNA methylation of immune genes expressed in low-grade/high-immune NF1-glioma is consistent with previous studies in which reduced methylation and increased expression of immune genes in human tumors was linked to tumor infiltration by lymphocytes characterized by demethylated and transcriptionally active genes involved in T lymphocyte functions that, on the contrary, were highly methylated and transcriptionally repressed in cancer cells51,52. Taken together, our findings suggest that the long indolent course of low-grade NF1-gliomas that rarely progress to high-grade disease9,13,57 may be preserved by the checks imposed by the adaptive immunity acquired by some low-grade tumors.
DNA methylation profiling classified NF1-gliomas within the LGm6 IDH wild-type cluster of sporadic gliomas from our recent panglioma TCGA study10. Prompted by the discovery that high-grade IDH wild-type gliomas in NF1 patients harbor frequent mutations of ATRX, we re-analyzed the LGm6 subgroup of sporadic tumors. We found that the original definition of pilocytic astrocytoma-like, which combined histological grade II and grade III tumors in the LGm6 cluster, is not an accurate representation of the biology of these tumors. Indeed, mutation pattern and clinical outcome of grade II-LGm6 gliomas diverge markedly from those of grade III-LGm6 tumors harboring ATRX mutations, which are more similar to LGm6-GBM. This finding calls for a re-evaluation of the guidelines for the classification of IDH wild-type gliomas, whereby the LGm6 group exhibits a larger heterogeneity than previously described and requires analysis of the ATRX status for the accurate qualification of the clinical features. As previous studies have shown that loss of ATRX increases sensitivity to DNA-damaging agents59,60, ATRX mutations may represent a point of therapeutic intervention for high-grade NF1-gliomas and LGm6 sporadic gliomas. Our study also argues that, similar to NF1-glioma, the comparative genomic analysis of other NF1-associated neoplasms with the sporadic counterpart may reveal distinct pathogenic mechanisms that could have therapeutic implications.
Methods
Sample cohort.
Glioma frozen samples and matched peripheral blood samples were available from NF1 patients who underwent surgical treatment. Samples were obtained from the Onconeurotek Tumorbank-Hôpital Pitié-Salpêtriere (Paris, France), Istituto Neurologico Besta (Milano, Italy), MD Anderson Cancer Center (Houston, Texas, USA), and from collaborators in the United States, France, Spain, South Korea, Germany, and the United Kingdom. All samples were obtained with informed consent after approval of the institutional review boards (IRBs) of the respective hospitals where patients were treated and consisted of material in excess of what was required for diagnostic purposes. Material was anonymized at the time of collection. Progressive numbers were used to label specimens coded to preserve the confidentiality of the subjects. Genome sequence analyses with these materials were designated as IRB exempt under paragraph 4 and are covered under Columbia University IRB protocol no. IRB-AAAI7305.
All samples were from patients diagnosed with NF1 syndrome according to the National Institutes of Health Consensus Development Conference11. Clinical and sequencing information (case-assay overlap for WES, RNAseq, and DNA methylation array) are provided in Supplementary Table 1. Samples were collected from 56 NF1 patients. From 1 patient 4 spatially distinct samples were obtained, giving a total of 59 samples included in the analyses. Blood DNA was available from 43 of the 56 patients and was used for WES and NF1 germline mutation calling to confirm the clinical diagnosis, and to identify SNVs from matched tumor-normal pairs. The patient cohort includes 35 low-grade gliomas (23 pilocytic astrocytoma, 5 ganglioglioma, 3 xanthoastrocytoma, 2 optic pathway glioma, 1 diffuse glioma, and 1 low-grade calcifying astrocytoma) and 24 high-grade gliomas (13 glioblastoma multiforme, 6 anaplastic astrocytoma, 1 anaplastic diffuse glioma, 1 anaplastic ganglioglioma, 1 anaplastic xanthoastrocytoma, 1 gliosarcoma, and 1 classified as grade III astrocytoma). The median age of the patients at time of surgery was 20 years, with 22 pediatric patients (<16 years) and 33 adult patients (>16 years). For one patient age was unknown.
WES.
Sequencing libraries were generated from 1 μg genomic DNA using Agilent SureSelect Human All Exon kit (Agilent Technologies, California, USA) following the manufacturer’s recommendations. Libraries were sequenced using Illumina HiSeq platform (150-bp paired end). We performed quality control according to the following procedure and discarded: (1) a read pair if either 1 read contained adapter contamination, (2) a read pair if more than 10% of bases were uncertain in either 1 read, and (3) a read pair if the proportion of low-quality bases was over 50% in either 1 read. Cleaned sequencing reads had an average error rate lower than 1% and a Phred quality score of Q30. Burrows-Wheeler Aligner61 was used to map the paired-end clean reads to the human reference genome (GRCh37/hg19). After sorting with SAMtools62 and marking duplicates with the Broad Picard, we computed the coverage and depth based on the BAM files. Sequencing depth had a mean of 103 × and a median of 91 ×, with 99.78% of coverage mean in the target region. Aligned reads were further processed using GATK63 to remove low mapping quality reads (mapping quality score ≥20) and re-aligned in the genomic regions around potential indels. The quality scores were then recalculated for the cleaned BAM files. To eliminate additional potential mapping artifacts, we excluded variants within 50-bp intervals whose sequences aligned more than 3 times within the whole genome. To confirm that tumor and blood samples from the same patient were properly paired, we performed a ‘fingerprint’ analysis using NGSCheckMate21, a model-based method evaluating the correlation between the variant allele fractions, defined as the ratio of the number of reads supporting a non-reference allele to the total number of reads, estimated from two samples at known SNP sites.
Mutation calling and pathogenicity prediction.
Somatic SNVs and indels were identified in tumors with matched normal samples by integrating the results from five algorithms for variant calling: VarScan216, Freebayes14, Strelka17, MuTect18, and VarDict19. In tumor samples for which blood DNA was unavailable, nucleotide variants were identified using GATK HaplotypeCaller63 followed by the correction with a virtual normal as a substitute for the missing matched normal to filter out germline variants20. The virtual normal was built from a set of 433 public samples from healthy, unrelated individuals sequenced to high depth in the context of the 1000 Genomes Project64. The virtual normal approach outperforms the standard matched normal algorithms to remove germline variants, and offers significant improvement over the use of public polymorphism databases alone20. To reduce false positive events, all somatic variants detected by matched normal and virtual normal methods were further filtered according to the following criteria:
variant-supporting read count ≥2
variant allele frequency ≥0.05
average variant position in variant-supporting reads (relative to read length) ≥ 0.1 and ≤0.9
average distance to effective 3’ end of variant position in variant-supporting reads (relative to read length) ≥0.2
fraction of variant-supporting reads from each strand ≥0.01
average mismatch quality difference (variant - reference) ≤50
average mapping quality difference (reference - variant) ≤50
Somatic variants were annotated using AnnoVar65 algorithm, which aggregates information from genomic and protein resources (GENECODE, UniProt, dbNSFP) with cancer (COSMIC, ClinVar) and non-cancer variant databases (dbSNP, 1000 Genomes, Kaviar, Haplotype Reference Consortium, Exome Aggregation Consortium, NHLBI Exome Variant Server). Among the annotated variants, we selected only those producing a direct effect on the protein sequence (missense, truncating, stoploss, splicing variants, frameshift, and in-frame indels). Variants reported in the non-cancer databases with a minor allele frequency ≥0.05 were classified as germline polymorphisms and excluded. Additionally, variants occurring in very large genes (for example, TTN and USH2A) and highly paralogous genes (for example, mucins and keratins) were filtered out as common sequencing artifacts.
GATK HaplotypeCaller63 was used to call germline variants occurring in NF1 and in genes previously implicated in NF1-like syndromes. Identified variants were processed to remove false positives as described above.
The functional effect of missense SNVs and in-frame indels was determined using multiple prediction algoritms. MutationTaster266, Polyphen267, Provean68, and SIFT69 were applied to predict the pathogenicity of missense SNVs. The pathogenic effect of in-frame indels was determined by FATHMM-Indel70, Provean68, SIFT-Indel71, and VEST-Indel72. Variants predicted as damaging by two or more algorithms were classified as pathogenic mutations.
Germline somatic log odds filter for NF1 mutations in samples without matched normal DNA.
To distinguish between germline and somatic events of the NF1 gene detected in tumor without a matching normal, we used the algorithm implemented by Chapuy et al.22. The algorithm computes the log ratio of the probability that the allele fraction of a genomic event is consistent with the allele fraction modeled for a hypothetical germline event or a modeled somatic event. Given the model of allele fraction x in one of eight possible scenarios (two possibilities for germline events and six cases for somatic events), the probability that the observed allele fraction is consistent with this model is calculated using a Beta probability distribution function, where the modeled hypothesis is tested against the actual count of reference (nREF) and variant (nALT) reads: p(x) = β(x;nALT + 1,nREF + 1). The algorithm defines two models, xg1 and xg1, for the allele frequency x in the case of germline events, depending on whether the germline event is on the minor or major allele of a copy number event, respectively. The algorithm defines six models of the allele frequency for somatic events accounting for the minor and major allele when a somatic event co-occurs with a copy number event (xs1 and xs2), occurs before a copy number event (xs3 and xs4), occurs after a copy number event (xs5), or if it occurs in a different subclone (xs6). The formulas for the computation of each model of allele fraction depend on the cancer cell fraction, purity, ploidy, and local copy number computed by ABSOLUTE73, as reported by Chapuy et al.22
The log odds ratio of the most likely germline and somatic model is then defined as:
If L is greater than a given threshold, the event is considered germline; otherwise, it is considered somatic. In the ideal case a threshold of 0 can be selected; however, given the variability in purity this cut-off must be suitably calibrated. Here, we used the NF1 genomic events in tumors with matched normal, all of which have been validated via Sanger sequencing, for calibration. The threshold on the log ratio was set in such a way to have 100% precision on the validated mutations. The value of the log ratio L is reported in Supplementary Table 3.
DNA copy number analysis.
Somatic copy number was estimated from WES reads by GATK copy number protocol74. The coverage depth of aligned reads was analyzed to detect CNVs using a hidden Markov model for change-point detection. A normal DNA reference was created by integrating copy number from NF1 patient blood samples and used for the comparison with CNVs detected in tumor samples to encapsulate sequencing noise and identify somatic events. Telomeric regions were excluded from the analysis, as they tend to generate artifacts in the CNV calls. GISTIC215 was used to integrate results from individual patients and identify genomic regions recurrently amplified or deleted in NF1-glioma.
Chromosomes X and Y copy numbers in normal and tumor samples were estimated from WES data using CNVkit75 to confirm patient gender and to compute chromosome X tumor ploidy.
mRNA sequencing and unsupervised cluster analysis.
mRNA was purified from total RNA using poly-T oligo-attached magnetic beads. The mRNA was first fragmented randomly by addition of fragmentation buffer. First-strand cDNA was synthesized using random hexamer primers and M-MuLV reverse transcriptase (RNase H-). Second-strand cDNA synthesis was subsequently performed using DNA polymerase I and RNase H. Double-stranded cDNA was purified using AMPure XP beads. Remaining overhangs of the purified double-stranded cDNA were converted into blunt ends via exonuclease/polymerase activities. After adenylation of 3’ ends of DNA fragments, NEBNext Adaptor with hairpin loop structure was ligated to prepare for hybridization (NEB Next Ultra RNA Library Prep Kit). Libraries were sequenced on the Illumina HiSeq platform (150-bp paired end). Sequencing quality was assessed through error rate and base quality distributions of reads for each sample. We filtered the raw data, removing reads containing adaptors and reads containing more than 10% of bases that could not be determined, and reads including over 50% bases with a Phred quality score ≤5. Cleaned reads had error rate mean ≤2% and Q30 ≥90% for all samples. The reads were aligned to the human reference genome (GRCh37/hg19) using STAR76 and the expression was quantitated at gene level using featureCounts, a count-based estimation algorithm77. Downstream analysis of gene expression was performed in the R statistical environment. We applied GC-correction for the within normalization step and upper-quantile for the between phase, according to a described pipeline78. Most variable genes (1,330) among 29 NF1-glioma samples were used for consensus clustering on the Euclidean distance matrix (10,000 random samplings using 70% of the 29 samples). Best sample clustering (Calinski and Harabasz criterion) was obtained with k = 2 groups. Differential expression analysis was then performed between the two groups of samples, and the list of the 100 most differentially expressed genes (two-sided MWW test, top and bottom 50 genes of the test statistics) was used to construct a heat map comprising the whole data set. Samples were clustered using the hierarchical clustering algorithm based on the Ward linkage method and Euclidean distance as implemented in R.
Gene ontology networks.
Gene ontology enrichment was computed using either: (1) MWW-GST, when a full ranked list of genes was available44; or (2) Fisher’s exact test, when only a list of significant genes was available (that is, down-regulated and hyper-methylated genes, lists of genes in the regulons of the top 10 ATRX mutant, and wild-type-specific master regulators). The significant gene ontology terms from MWW-GST (q <0.001, absolute NES >0.6) or Fisher’s exact test (q < 0.01) analysis were further analyzed using the Enrichment Map application of Cytoscape79. In the network, nodes represent the terms and edges represent known term interactions and are defined by the number of shared genes between the pair of terms. Size of the nodes is proportional to the number of genes in the category. A cut-off was set to the overlapping coefficient (>0.5) to select the overlapping gene sets.
Assembly of the transcriptional interactomes and master regulator analysis.
To identify master regulators of the gene expression signature activated in the high-grade LGm6 IDH wild-type pan-glioma ATRX mutant (8 samples) versus ATRX wild-type (40 samples) subgroup, we used the transcriptional network assembled from gene expression profiles of the IDH wild-type pan-glioma data set using the RGBM algorithm from our previous works44,56. The transcriptional interactome comprised 300,969 (median regulon size: 141) interactions between a predefined set of 2,137 transcriptional regulators and 12,656 target genes. We also used the same workflow for master regulator analysis and activity, described in the same papers. As a result, we obtained 89 master regulators, 41 of which were enriched in ATRX mutant samples (two-sided MWW-GST adjusted P < 0.01, absolute NES> 0.6, and two-sided MWW test for differential activity adjusted P < 0.01).
DNA methylation analysis and integrative analysis with the TCGA IDH wild-type cohort.
Methylation analysis of NF1-glioma genomic DNA was performed using the Illumina Human 850K EPIC Infinium Methylation BeadChip. Array data were imported in the R statistical framework using the Minfi package14 and normalized using functional normalization. NF1-glioma DNA methylation profiles were classified in one of the pan-glioma methylation clusters10 by a nearest neighbor classifier using the 1,233 cancer-specific DNA methylation probes obtained by intersecting the 1,300 probes used by Ceccarelli et al.10 and those available on the 850K EPIC Infinium Methylation platform. For the joint unsupervised analysis of the TCGA cohort and the NF1 tumors reported in Supplementary Fig. 5, we first dichotomized the data using a β value > 0.25 as a threshold for positive DNA methylation. This binarization tends to mitigate the effects of variable tumor purity between the TCGA cohort and the NF1 cohort. Unsupervised hierarchical clustering on the 1,233 CpG sites was then applied using a binary distance metric for clustering and Ward’s method for linkage. The dendogram has two main branches, one corresponding to IDH mutant tumors and one corresponding to IDH wild-type tumors. The Calinski and Harabasz curve had two local maxima at k = 2 and k = 5. Cutting the tree with 5 groups resulted in cluster 3 containing 100% of the NF1 tumors (31 of 31 samples with DNA methylation assay) and 95% (62 of 65) sporadic LGm6 tumors.
Integrative expression and DNA methylation analysis.
We analyzed differences in DNA methylation level between the subgroups of low-grade NF1-gliomas characterized by differential activation of immune cells. After removing probes targeting X and Y chromosomes and probes not associated with promoters, the final methylation data matrix comprised 11 low-grade gliomas (5 low-immune and 6 high-immune) and 105,956 probes. Differential methylation analysis was then performed between low- and high-immune samples of the low-grade cohort using the two-sided MWW test (P < 0.01 and absolute methylation fold-change >0.3) and the list of the 259 most differentially methylated probes (229 hyper- and 30 hypo-methylated) was used to construct a heat map comprising the whole data set. Samples were clustered using the hierarchical clustering algorithm based on the Ward linkage method and Euclidean distance as implemented in R. Furthermore, differential expression analysis was also performed on the two groups of samples (9 low-immune and 10 high-immune) using the two-sided MWW test (P < 0.01 and absolute expression fold-change >1; 15 up- and 109 down-regulated) for integrative analysis. The primary probe for each gene was chosen as the one located closest to the −100-bp position in the promoter relative to the transcription start site; this location should be in a key region of the promoter to correlate with expression changes. Integration of the normalized gene expression and DNA methylation gene lists identified a total of 115 of 11,979 unique genes with both significant DNA methylation and RNAseq gene expression changes between low- and high-immune lower-grade samples. In particular, 68 of the 115 genes were significantly hyper-methylated and down-regulated in low-grade/low-immune compared to low-grade/high-immune samples. Finally, a starburst plot80 for comparison of DNA methylation and RNAseq gene expression data was constructed using log10(P value) for DNA methylation (x axis) and gene expression (y axis) for each gene. In the plot, the P values are multiplied by the sign of difference of beta values. The dashed black lines indicate the P value at 0.05.
Pairwise mutual exclusivity and co-occurrence of somatic alterations.
Pairwise mutually exclusive somatic alterations were identified using CoMEt81 with the ‘exhaustive’ option. Pairwise co-occurrence was tested by Fisher’s exact test. Statistically significant exclusion and co-occurrence patterns were visualized using Cytoscape with edge thickness representing -log10(P value).
Mutational signatures.
The R package DeConstructSigs was used to determine the proportion of COSMIC signatures as defined by Alexandrov et al.55.
Dirichlet-multinomial regression for mutational spectra.
The correlation between mutational spectrum as response variable (C >T, C >A, C >G, T >C, T > A, and T >G) and age, grade, and ATRX mutational status as predictor variable was determined by a Dirichlet-multinomial model82.
Clonality estimation.
Allele mutations and copy number calls for each sample were loaded into maftools83 to obtain mutational clones using the inferHeterogeneity function.
Neoantigen prediction.
For all samples analyzed with both Exome-seq and RNAseq available, the four-digit HLA type was predicted using Polysolver84, Optitype85, Phlat86, and Seq2hla87, respectively. HLA type was determined if predictions were consistent in any one of following conditions: (1) Polysolver and Optitype, (2) Polysolver and Phlat, (3) Polysolver and Seq2hla, (4) Optitype and Phlat, or (5) Optitype and Seq2hla. Missense mutations were then used to generate a list of all possible 9-mers. Binding affinity of mutant and corresponding wild-type peptides to the patient’s germline HLA alleles was predicted using netMHCpan-4.031. High-affinity binders were defined as those with a half-maximum inhibitory concentration (IC50) equal to or less than 500 nM. Low-affinity wild-type allele binders were defined as having an IC50 greater than 500 nM. Accordingly, a mutant-specific binder was referred to as a neoantigen when the mutant IC50 was less than 500 nM and the wild-type IC50 was more than 500 nM.
In vitro peptide-HLA I binding assay.
Peptide-HLA class I in vitro binding affinities were determined as described previously54. Purified recombinant HLA class I heavy chains were diluted into a refolding buffer (tris-maleate buffer, pH 6.6) containing β2-microglobulin and serial 10-fold dilutions (0.01 nM to 200 μM) of the test peptide, and incubated for 48 h at 18 °C to allow for equilibrium to be reached in PBS. The HLA concentration was 1.25 nM, and β2-microglobulin concentration was 10 nM. Complex formation was detected using a proximity-based luminescent oxygen channeling immunoassay. Donor beads were obtained preconjugated with streptavidin from Perkin Elmer; acceptor beads were conjugated in house with W6/32, a pan-specific anti-HLA class I mouse monoclonal antibody (Sigma-Aldrich, MABN1783, 1 mg ml−1) using standard procedures as described by the manufacturer. Binding affinity (Kd) was determined as described previously54,88,89 using the GraphPad Prism software 6.0. Data are means ± s.d. of counts per second. Amino acid abbreviations: A, Ala; C, Cys; D, Asp; E, Glu; F, Phe; G, Gly; H, His; I, Ile; K, Lys; L, Leu; M, Met; N, Asn; P, Pro; Q, Gln; R, Arg; S, Ser; T, Thr; V, Val; W, Trp; Y, Tyr.
C-circle assay.
The C-circle assay was done as previously described43. Briefly, standard curves for quantitative analysis were prepared with serially diluted QuickPreps of ALT[+] U2OS and ALT[-] HEK293 cell lines. DNA concentration in the QuickPrep was determined using Qubit HS dsDNA assay. Samples were subjected to rolling circle amplification (RCA) with or without ϕ29 polymerase for 14 h at 30 °C followed by SYBR Green qPCR. Total RCA reaction volume was 20 μl. The reaction was stopped by incubation at 70 °C for 20 min. We used 36B4 primers to quantitate telomere content level and determine telomere per single-copy gene ratio, telomere, and single-copy gene. Real-time qPCR amplification with telomere primers in the sample subjected to RCA in the presence of ϕ29 polymerase detects total telomere content (linear chromosomal telomeres plus extrachromosomal telomere C-circle DNA). Amplification with telomere primers of RCA without ϕ29 polymerase detects only linear chromosomal telomeres. The presence of extrachromosomal circular DNA in the sample causes a downward shift of the standard curve with telomere primers and ϕ29. Amplification with 36B4 primers determines the single-copy gene quantity in the reaction. C-circle content was calculated using the following formulas: C-circle content = 2-ΔΔCT, where ΔΔCT = NormΔCT(+) - NormΔCT (−), while NormΔCT (+) = CT(+) - CT(36B4) and NormΔCT(−) = CT(−) - CT(36B4) (Ct, threshold cycle). Data are presented as the average of three technical replicates for each DNA sample.
RT-qPCR.
Total RNA was prepared using the AllPrep DNA/RNA/Protein Mini Kit (Qiagen) according to the manufacturer’s instructions, and cDNA was synthesized using SuperScript II Reverse Transcriptase (Invitrogen). RT-qPCR was performed with a 7500 Real Time PCR thermal cycler system (Applied Biosystems), using SYBR Green PCR Master Mix (Applied Biosystems). Primer sequences are reported in Supplementary Table 17a. Data are presented as -ΔCT (CT18S - CT selected gene) of triplicate samples (CT, threshold cycle). Bar graphs show mean ± s.d. of three technical replicates for each glioma sample. Experiments were repeated three times with similar results.
Genomic qPCR.
Genomic DNA from blood and tumor samples was assayed by qPCR using SYBRGreen PCR Master Mix (Applied Biosystems). Dimethyl sulfoxide was added at a final concentration of 5% for amplification of the INK4A gene. Fluorescence intensities were detected using 7500 Real Time PCR thermal cycler (Applied Biosystems), and CT values were calculated using High-Resolution Melt Software v2.0 (Applied Biosystems). Primer sequences are reported in Supplementary Table 17b. Standard curves for test and reference primers were generated using dilution series of genomic DNA. Each dilution was tested in triplicate. The CT values (the cycle at which the change in fluorescence for the SYBR dye passes a significance threshold) were used for data normalization. ΔCT values (CT18S - CT selected gene) of triplicate samples were used to calculate copy number changes relative to control DNA using Microsoft Excel. Bar graphs show mean ± s.d. of three technical replicates for each glioma sample. Experiments were repeated three times with similar results.
Bi-allelic mutation analysis of NF1.
To determine whether the two different mutations detected in an individual tumor were on the same or on separate alleles, the genomic DNA or cDNA (obtained from reverse transcription using Superscript II reverse transcriptase, Invitrogen) fragments that included the two mutations were amplified using AccuPrime taq DNA polymerase high fidelity (primers designed to target each specific amplicon and amplicon size for each tumor sample are listed in Supplementary Table 5). PCR products of the corrected size were purified using QIAquick PCR Purification Kit (Qiagen), subcloned into plasmid pCR Blunt II TOPO, and used to transform Escherichia coli. DNA was isolated from individual colonies resistant to kanamycin and subjected to Sanger sequencing reaction using sense or anti-sense primers to detect one of the two mutations in the sense or the anti-sense sequence, respectively. Results were analyzed using Sequencer 5.4.6 (Gene Codes Corporation). The sequence of each identified mutation was confirmed in at least two independent plasmid clones (Supplementary Table 5).
Immunohistochemistry.
NF1-glioma samples analyzed by immunostaining had been stored in the Onconeurotek tumor bank (certified NF S96 900) and received authorization for analysis from the Ethics Committee (CPP Ile de France VI, ref. A39II) and the French Ministry for Research (AC 2013–1962). Immunostaining was performed as previously described44. For ATRX immunohistochemistry, deparaffinization and immunolabeling of sections were performed by a fully automatic immunohistochemistry system, Ventana BenchMark XT (Roche), using a streptavidin-peroxidase complex with diaminobenzidine as chromogen and hematoxylin counterstaining of nuclei. Primary ATRX antibody was from Sigma-Aldrich (HPA001906) and was used at 1:200 dilution. Images were acquired under 20 X magnification using an Olympus IX70 microscope equipped with a digital camera.
For immune cell marker analysis, tumor sections were deparaffinized in xylene and rehydrated in a graded series of ethyl alcohol. Antigen retrieval was performed in citrate solution pH 6.0 (CD20 and CD68) or Tris-EDTA solution pH 9.0 using a decloaking chamber (7 min for CD3 and CD8 and 15 min for GZMB). After peroxidase blocking in 3% H2O2 for 15 min, slides were blocked for 1 h in 10% horse or goat serum, 0.25% Triton X-100, and 1 X PBS. Primary antibodies were incubated at 4 °C overnight: CD3 (Dako, A0452, 1:200), CD8 (Leica NCL-L-CD8–4B11, 1:200), GZMB (Leica, PA0291, ready to use), CD20 (Leica, NCL-L-CD20-L26, 1:200), and CD68 (Sigma, HPA048982, 1:2,000). Sections were incubated in horseradish peroxidase-conjugated secondary antibody (Dako Envision+ System HRP Labelled Polymer ready to use anti-mouse and anti-rabbit, K4000 and K4003, respectively) for 30 min and 3,3-di-amino-benzidine (Vector) was used as substrate. Nuclei were counterstained with hematoxylin (Sigma). Slides were dehydrated and mounted. Five to 11 images for each section were acquired under 20× magnification using an Olympus IX70 microscope equipped with a digital camera. Positive cells were counted in an area of 0.15 mm2. Results are shown as average number of positive cells per 0.15 mm2. Box plots span the first quartile to the third quartile and whiskers indicate the smallest and largest values. Comparisons between two groups were analyzed by t-test with Welch correction (two-sided, unequal variance). Statistical analyses were performed and P values were obtained using the GraphPad Prism software 6.0.
Statistical analysis.
In general, two to four independent experiments were performed. Comparisons between groups were analyzed by t-test with Welch correction (two-sided, unequal variance) and/or the MWW non-parametric test when appropriate. Results in bar graphs are expressed as mean ± s.d. for the indicated number of observations. Box plots and scatter plots show median with the first quartile to the third quartile, and whiskers indicate the smallest and largest values. All statistical analyses were performed and P values were obtained using the GraphPad Prism software 6.0 or the R software (https://www.r-project.org) and are reported in the Source Data.
Extended Data
Extended Data Fig. 1 |. Data analysis workflow.
Fifty nine tumor samples from 56 NF1-glioma patients with 43 matched normal were profiled with WES, DNA Methylation profiles (31 tumors) and RNA sequencing (29 tumors). WES was used to call NF1 germline mutations using HaplotypeCaller and Somatic-germline log odds filter. Somatic SNVs were called from WES data by integrating the results of five algorithms (Freebayes, MuTect, Strelka, VarDict and VarScan). Recurrent CNVs were detected by GATK and GISTIC2. SNVs and CNVs were validated by Sanger sequencing (93% validation rate) and genomic qPCR (96% validation rate), respectively. Neoantigen prediction was obtained using netMHCpan and HLA genotype was determined by Polysolver, Optitype, Phlat and Seq2hla and validated by affinity binding kinetics. COSMIC cancer mutation signatures were identified by deconstructSig and compared to those occurring in sporadic glioma. DNA Methylation arrays were used to classify NF1 glioma in the methylation subtypes of sporadic glioma form the TCGA pan-glioma dataset (KNN). RNAseq was used to define gene expression clusters and immune subtypes of low-grade NF1-glioma and results were confirmed by RT-qPCR and immunohistochemistry. Integrative analysis of gene expression and DNA Methylation identified epigenetic signatures characterizing immune subtypes of low-grade glioma. A pan-glioma gene regulatory network was used to identify MRs of the ATRX-mutant phenotype in LGm6 sporadic and NF1-glioma (RGBM). Finally, the impact of ATRX mutation on survival was assessed using TCGA pan-glioma and NF1-glioma data.
Extended Data Fig. 2 |. Fingerprint analysis of WES NF1 samples.
Dendrogram of hierarchical clustering of 59 tumor and 43 normal samples based on Pearson correlation coefficients of SNPs allele fractions. Case ID and the tissue specimen are indicated (blood DNA, red; tumor with available matched blood DNA, blue; tumor without matched normal DNA, yellow). The analysis confirmed proper matching of samples for each of the 43 tumor-blood DNA pairs. Thirteen tumors without available paired normal DNA (yellow) showed individual branches in the clustering dendrogram.
Extended Data Fig. 3 |. Validation of recurrent CNVs.
Genomic qPCR was performed to assay copy number changes for TERT (n = 10 glioma samples), b, IL-15 (n = 8 glioma samples), c, FGF1 (n = 17 glioma samples) and d, CDKN2A (n = 11 glioma samples). Red and blue bars indicate WES-inferred gene gain and loss, respectively. Analysis of normal DNA (green bars) was included to define diploidy (dotted line). Tumor samples diploid for the tested gene were included as control (white bars). Bar graphs show mean± s.d. of 3 technical replicates. Experiments were repeated three times with similar results.
Extended Data Fig. 4 |. Somatic mutation burden of NF1-glioma and pediatric and adult cancer genomes.
Distribution of somatic non-synonymous coding mutation rate is represented on a logarithmic scale for NF1- and sporadic glioma (bold) and other frequent cancer types, including pediatric tumors. Cancer types and subgroups are ordered by increasing mutation frequency median, with the lowest frequencies (left) found in pediatric tumors and low-grade NF1-glioma. Somatic mutations used to calculate the mutational burden for different cancer types were retrieved from TCGA (adult tumors) and TARGET (pediatric tumors) databases.
Extended Data Fig. 5 |. Mutational clonality.
Analysis of mutational clonality in 55 NF1-glioma samples. a, Number of mutation clones relative to age (Pearson correlation coefficient = −0.126 and p = 0.363), and b, tumor grade (Pearson correlation coefficient = 0.031 and P = 0.820). Blue line: linear regression; shaded area: 95% confidence interval.
Extended Data Fig. 6 |. Analysis of DNA Copy Number Variations.
Schematics of chromosome location peaks (gain, red; loss, blue) identified using GISTIC2. Peaks are designated by candidate targets for each region, selected according to criteria described in Methods. The complete list of chromosome location peaks is included in Supplementary Table 6a, b.
Extended Data Fig. 7 |. Mutual exclusivity and co-occurrence of genetic alterations in NF1-glioma.
a, Mutually exclusive and b, co-occurring genetic alterations in NF1-glioma were evaluated using CoMEt and two-sided Fisher’s exact test, respectively. Significant mutual relationships between two gene alterations are indicated by a line (green, exclusion; red, co-occurrence) whose thickness represents −log10 of p-value (reported in Supplementary Table 7).
Extended Data Fig. 8 |. Distribution of somatic mutation spectrum in NF1-glioma.
Dirichlet multinomial regression test for ATRX status (n = 10 and n = 46 ATRX mutant and ATRX wild-type samples, respectively), age (n = 22 pediatric glioma; n = 33 adult glioma) and glioma grade (n = 24 high-grade glioma; n = 32 low-grade glioma). b, The relative proportions of the six different possible base-pair substitutions are represented by barplots for ATRX mutant (n = 10, solid fill) and ATRX wild-type (n = 46, patterned fill). The relative frequency of C > T transition was significantly higher in ATRX mutant tumors (p = 5.1 × 10⁻³, two-sided Fisher’s exact test).
Extended Data Fig. 9 |. Somatic alterations in PI3K and Transcription/Chromatin regulation pathways in NF1-glioma.
Integrated matrix of 59 NF1-glioma samples (56 patients) and somatic alterations (SNVs and indels, and significant copy number variations) occurring in genes linked to PI3K and transcription/chromatin regulation pathways (left panel, high-grade glioma; right panels low-grade glioma). Rows and columns represent genes and tumor samples, respectively. NF1-glioma samples are sorted in the same order of Fig. 2. Genes are grouped by PI3K (purple) and transcription/chromatin regulation (blue) pathways. Genomic alterations, age, the histology of glioma and the identification of NF1 germline mutation are shown by the indicated colors. Validation by Sanger sequencing (SNVs) and quantitative-genomic PCR (gains and losses) are indicated by yellow and green triangles, respectively.
Extended Data Fig. 10 |. Somatic alterations in splicing, MAPK and cilium/centrosome pathways in NF1-glioma.
Integrated matrix of 59 NFl-glioma (56 patients) and somatic alterations (SNVs and indels, and significant copy number variations) occurring in genes included in splicing, MAPK and cilium/centrosome pathways (left panel, high-grade glioma; right panels low-grade glioma). Rows and columns represent genes and tumor samples, respectively. NFl-glioma samples are sorted in the same order of Fig. 2. Genes are grouped by splicing (red), MAPK (yellow) and cilium/centrosome (green) pathways. Genomic alterations, age, the histology of glioma and the identification of NF1 germline mutation are shown by color as indicated. Validation by Sanger sequencing (SNVs) and quantitative-genomic PCR (gains and losses) are indicated by yellow and green triangles, respectively.
Supplementary Material
Acknowledgements
This work was supported by the Children’s Tumor Foundation Synodos Glioma Consortium (2015–04-007); NIH R01CA101644, U54CA193313, and R01CA131126 to A.L.; and R01CA178546, U54CA193313, R01CA179044, R01CA190891, R01NS061776, and The Chemotherapy Foundation to A.I. This work benefited from the facilities and expertise of the Onconeurotek Tumor Bank (Pitié-Salpêtrière, Paris, France), the CCBH-M Collection Neurology (University Hospital, Montpellier, France, www.chumontpellier.fr), the NeuroBioTec Collection (Groupement Hospitalier Est, Bron France), the biobank Tissutheque Beaujon BB-0033–00078 (Pathology Department, Beaujon hospital, Clichy, France), the Centre de Ressource Plurithématique Bordeaux Biothèque Santé, and the TUCERA network (Bordeaux, France). We are particularly grateful to P. Polisi for technical support with the mutation calls on high-performance clusters; to A. Rahimian and I. Detrait for technical support; and to V. Rigau, C. Gozé, A. Vital, S. Elmer, and I. Quintin-Roue for histological analyses.
Footnotes
Competing interests
The authors declare no competing interests.
Additional information
Extended data is available for this paper at https://doi.org/10.1038/s41591-018-0263-8.
Supplementary information is available for this paper at https://doi.org/10.1038/s41591-018-0263-8.
Publisher’s note: Springer Nature remains neutral with regard to jurisdictional claims in published maps and institutional affiliations.
Data availability
Genomic, epigenomic, and transcriptomic data supporting the findings of this study have been deposited at the European Genome-phenome Archive database (https://ega-archive.org), which is hosted by the EBI and the CRG, under accession number EGAS00001003186. All other data are available within the article, Supplementary Information, and Supplementary Data file.
Online content
Any methods, additional references, Nature Research reporting summaries, source data, statements of data availability, and associated accession codes are available at https://doi.org/10.1038/s41591-018-0263-8.
References
- 1.Uusitalo E. et al. Incidence and mortality of neurofibromatosis: a total population study in Finland. J. Invest. Dermatol 135, 904–906 (2015). [DOI] [PubMed] [Google Scholar]
- 2.Evans DG et al. Birth incidence and prevalence of tumor-prone syndromes: estimates from a UK family genetic register service. Am. J. Med. Genet. A 152A, 327–332 (2010). [DOI] [PubMed] [Google Scholar]
- 3.Gutmann DH et al. Neurofibromatosis type 1. Nat. Rev. Dis. Primers 3, 17004 (2017). [DOI] [PubMed] [Google Scholar]
- 4.Brems H, Beert E, de Ravel T & Legius E. Mechanisms in the pathogenesis of malignant tumours in neurofibromatosis type 1. Lancet Oncol. 10, 508–515 (2009). [DOI] [PubMed] [Google Scholar]
- 5.Philpott C, Tovell H, Frayling IM, Cooper DN & Upadhyaya M. The NF1 somatic mutational landscape in sporadic human cancers. Hum. Genomics 11, 13 (2017). [DOI] [PMC free article] [PubMed] [Google Scholar]
- 6.Uusitalo E. et al. Distinctive cancer associations in patients with neurofibromatosis type 1. J. Clin. Oncol 34, 1978–1986 (2016). [DOI] [PubMed] [Google Scholar]
- 7.Seminog OO & Goldacre MJ Risk of benign tumours of nervous system, and of malignant neoplasms, in people with neurofibromatosis: population-based record-linkage study. Br. J. Cancer 108, 193–198 (2013). [DOI] [PMC free article] [PubMed] [Google Scholar]
- 8.Blanchard G. et al. Systematic MRI in NF1 children under six years of age for the diagnosis of optic pathway gliomas. Study and outcome of a French cohort. Eur. J. Paediatr. Neurol 20, 275–281 (2016). [DOI] [PubMed] [Google Scholar]
- 9.Sellmer L. et al. Non-optic glioma in adults and children with neurofibromatosis 1. Orphanet J. Rare Dis 12, 34 (2017). [DOI] [PMC free article] [PubMed] [Google Scholar]
- 10.Ceccarelli M. et al. Molecular profiling reveals biologically discrete subsets and pathways of progression in diffuse glioma. Cell 164, 550–563 (2016). [DOI] [PMC free article] [PubMed] [Google Scholar]
- 11.Neurofibromatosis. Conference statement. National Institutes of Health Consensus Development Conference. Arch. Neurol 45, 575–578 (1988). [PubMed] [Google Scholar]
- 12.Gutmann DH et al. Gliomas presenting after age 10 in individuals with neurofibromatosis type 1 (NF1). Neurology 59, 759–761 (2002). [DOI] [PubMed] [Google Scholar]
- 13.Helfferich J. et al. Neurofibromatosis type 1 associated low grade gliomas: a comparison with sporadic low grade gliomas. Crit. Rev. Oncol. Hematol 104, 30–41 (2016). [DOI] [PubMed] [Google Scholar]
- 14.Garrison E & Marth G. Haplotype-based variant detection from short-read sequencing. ArXiv, 1207.3907 (2012). [Google Scholar]
- 15.Mermel CH et al. GISTIC2.0 facilitates sensitive and confident localization of the targets of focal somatic copy-number alteration in human cancers. Genome Biol. 12, R41 (2011). [DOI] [PMC free article] [PubMed] [Google Scholar]
- 16.Koboldt DC et al. VarScan 2: somatic mutation and copy number alteration discovery in cancer by exome sequencing. Genome Res. 22, 568–576 (2012). [DOI] [PMC free article] [PubMed] [Google Scholar]
- 17.Saunders CT et al. Strelka: accurate somatic small-variant calling from sequenced tumor-normal sample pairs. Bioinformatics 28, 1811–1817 (2012). [DOI] [PubMed] [Google Scholar]
- 18.Cibulskis K. et al. Sensitive detection of somatic point mutations in impure and heterogeneous cancer samples. Nat. Biotechnol 31, 213–219 (2013). [DOI] [PMC free article] [PubMed] [Google Scholar]
- 19.Lai Z. et al. VarDict: a novel and versatile variant caller for next-generation sequencing in cancer research. Nucleic Acids Res. 44, e108 (2016). [DOI] [PMC free article] [PubMed] [Google Scholar]
- 20.Hiltemann S, Jenster G, Trapman J, van der Spek P & Stubbs A. Discriminating somatic and germline mutations in tumor DNA samples without matching normals. Genome Res. 25, 1382–1390 (2015). [DOI] [PMC free article] [PubMed] [Google Scholar]
- 21.Lee S. et al. NGSCheckMate: software for validating sample identity in next-generation sequencing studies within and across data types. Nucleic Acids Res. 45, e103 (2017). [DOI] [PMC free article] [PubMed] [Google Scholar]
- 22.Chapuy B. et al. Molecular subtypes of diffuse large B cell lymphoma are associated with distinct pathogenic mechanisms and outcomes. Nat. Med 24, 679–690 (2018). [DOI] [PMC free article] [PubMed] [Google Scholar]
- 23.Evans DG et al. Comprehensive RNA analysis of the NF1 gene in classically affected NF1 affected individuals meeting NIH criteria has high sensitivity and mutation negative testing is reassuring in isolated cases with pigmentary features only. EBioMedicine 7, 212–220 (2016). [DOI] [PMC free article] [PubMed] [Google Scholar]
- 24.Hutter S. et al. No correlation between NF1 mutation position and risk of optic pathway glioma in 77 unrelated NF1 patients. Hum. Genet 135, 469–475 (2016). [DOI] [PubMed] [Google Scholar]
- 25.Messiaen LM et al. Exhaustive mutation analysis of the NF1 gene allows identification of 95% of mutations and reveals a high frequency of unusual splicing defects. Hum. Mutat 15, 541–555 (2000). [DOI] [PubMed] [Google Scholar]
- 26.Thomas L. et al. Exploring the somatic NF1 mutational spectrum associated with NF1 cutaneous neurofibromas. Eur. J. Hum. Genet 20, 411–419 (2012). [DOI] [PMC free article] [PubMed] [Google Scholar]
- 27.Stenson PD et al. The human gene mutation database (HGMD) and its exploitation in the fields of personalized genomics and molecular evolution. Curr. Protoc. Bioinformatics 39, 1.13.1–1.13.20 (2012). [DOI] [PubMed] [Google Scholar]
- 28.Friedman JM Neurofibromatosis 1 in GeneReviews (eds. Adam MP et al. , University of Washington, Seattle, 1993). [Google Scholar]
- 29.Messiaen L. et al. Clinical and mutational spectrum of neurofibromatosis type 1-like syndrome. JAMA 302, 2111–2118 (2009). [DOI] [PubMed] [Google Scholar]
- 30.Eisenbarth I, Beyer K, Krone W & Assum G. Toward a survey of somatic mutation of the NF1 gene in benign neurofibromas of patients with neurofibromatosis type 1. Am. J. Hum. Genet 66, 393–401 (2000). [DOI] [PMC free article] [PubMed] [Google Scholar]
- 31.Laycock-van Spyk S, Thomas N, Cooper DN & Upadhyaya M. Neurofibromatosis type 1-associated tumours: their somatic mutational spectrum and pathogenesis. Hum. Genomics 5, 623–690 (2011). [DOI] [PMC free article] [PubMed] [Google Scholar]
- 32.Pemov A. et al. The primacy of NF1 loss as the driver of tumorigenesis in neurofibromatosis type 1-associated plexiform neurofibromas. Oncogene 36, 3168–3177 (2017). [DOI] [PMC free article] [PubMed] [Google Scholar]
- 33.Upadhyaya M. et al. Germline and somatic NF1 gene mutation spectrum in NF1-associated malignant peripheral nerve sheath tumors (MPNSTs). Hum. Mutat 29, 74–82 (2008). [DOI] [PubMed] [Google Scholar]
- 34.Upadhyaya M. et al. Germline and somatic NF1 gene mutations in plexiform neurofibromas. Hum. Mutat 29, E103–111 (2008). [DOI] [PubMed] [Google Scholar]
- 35.Grobner SN et al. The landscape of genomic alterations across childhood cancers. Nature 555, 321–327 (2018). [DOI] [PubMed] [Google Scholar]
- 36.Yan H. et al. IDH1 and IDH2 mutations in gliomas. N. Engl. J. Med 360, 765–773 (2009). [DOI] [PMC free article] [PubMed] [Google Scholar]
- 37.Noushmehr H. et al. Identification of a CpG island methylator phenotype that defines a distinct subgroup of glioma. Cancer Cell 17, 510–522 (2010). [DOI] [PMC free article] [PubMed] [Google Scholar]
- 38.Schwartzentruber J. et al. Driver mutations in histone H3.3 and chromatin remodelling genes in paediatric glioblastoma. Nature 482, 226–231 (2012). [DOI] [PubMed] [Google Scholar]
- 39.Killela PJ et al. TERT promoter mutations occur frequently in gliomas and a subset of tumors derived from cells with low rates of self-renewal. Proc. Natl Acad. Sci. USA 110, 6021–6026 (2013). [DOI] [PMC free article] [PubMed] [Google Scholar]
- 40.Heaphy CM et al. Altered telomeres in tumors with ATRX and DAXX mutations. Science 333, 425 (2011). [DOI] [PMC free article] [PubMed] [Google Scholar]
- 41.Zhang Y, Zhou H, Zhou J & Sun W. Regression models for multivariate count data. J. Comput. Graph. Stat 26, 1–13 (2017). [DOI] [PMC free article] [PubMed] [Google Scholar]
- 42.Sottoriva A. et al. Intratumor heterogeneity in human glioblastoma reflects cancer evolutionary dynamics. Proc. Natl Acad. Sci. USA 110, 4009–4014 (2013). [DOI] [PMC free article] [PubMed] [Google Scholar]
- 43.Henson JD et al. DNA C-circles are specific and quantifiable markers of alternative-lengthening-of-telomeres activity. Nat. Biotechnol 27, 1181–1185 (2009). [DOI] [PubMed] [Google Scholar]
- 44.Frattini V. et al. A metabolic function of FGFR3-TACC3 gene fusions in cancer. Nature 553, 222–227 (2018). [DOI] [PMC free article] [PubMed] [Google Scholar]
- 45.Yoshihara K. et al. Inferring tumour purity and stromal and immune cell admixture from expression data. Nat. Commun 4, 2612 (2013). [DOI] [PMC free article] [PubMed] [Google Scholar]
- 46.Yuan J. et al. Single-cell transcriptome analysis of lineage diversity in high-grade glioma. Genome Med. 10, 57 (2018). [DOI] [PMC free article] [PubMed] [Google Scholar]
- 47.Azizi E. et al. Single-cell map of diverse immune phenotypes in the breast tumor microenvironment. Cell 174, 1293–1308.e36 (2018). [DOI] [PMC free article] [PubMed] [Google Scholar]
- 48.Bindea G. et al. Spatiotemporal dynamics of intratumoral immune cells reveal the immune landscape in human cancer. Immunity 39, 782–795 (2013). [DOI] [PubMed] [Google Scholar]
- 49.Aran D. et al. Reference-based annotation of single-cell transcriptomes identifies a profibrotic macrophage niche after tissue injury. Preprint at bioRxiv, 10.1101/284604 (2018). [DOI] [Google Scholar]
- 50.Charoentong P. et al. Pan-cancer immunogenomic analyses reveal genotype-immunophenotype relationships and predictors of response to checkpoint blockade. Cell Rep. 18, 248–262 (2017). [DOI] [PubMed] [Google Scholar]
- 51.Dedeurwaerder S. et al. DNA methylation profiling reveals a predominant immune component in breast cancers. EMBO Mol. Med 3, 726–741 (2011). [DOI] [PMC free article] [PubMed] [Google Scholar]
- 52.Jeschke J. et al. DNA methylation-based immune response signature improves patient diagnosis in multiple cancers. J. Clin. Invest 127, 3090–3102 (2017). [DOI] [PMC free article] [PubMed] [Google Scholar]
- 53.Schumacher TN & Schreiber RD Neoantigens in cancer immunotherapy. Science 348, 69–74 (2015). [DOI] [PubMed] [Google Scholar]
- 54.Harndahl M. et al. Peptide binding to HLA class I molecules: homogenous, high-throughput screening, and affinity assays. J. Biomol. Screen 14, 173–180 (2009). [DOI] [PubMed] [Google Scholar]
- 55.Alexandrov LB et al. Signatures of mutational processes in human cancer. Nature 500, 415–421 (2013). [DOI] [PMC free article] [PubMed] [Google Scholar]
- 56.Mall R. et al. RGBM: regularized gradient boosting machines for identification of the transcriptional regulators of discrete glioma subtypes. Nucleic Acids Res. 46, e39 (2018). [DOI] [PMC free article] [PubMed] [Google Scholar]
- 57.Rodriguez FJ et al. Gliomas in neurofibromatosis type 1: a clinicopathologic study of 100 patients. J. Neuropathol. Exp. Neurol 67, 240–249 (2008). [DOI] [PMC free article] [PubMed] [Google Scholar]
- 58.Solga AC et al. RNA sequencing of tumor-associated microglia reveals Ccl5 as a stromal chemokine critical for neurofibromatosis-1 glioma growth. Neoplasia 17, 776–788 (2015). [DOI] [PMC free article] [PubMed] [Google Scholar]
- 59.Flynn RL et al. Alternative lengthening of telomeres renders cancer cells hypersensitive to ATR inhibitors. Science 347, 273–277 (2015). [DOI] [PMC free article] [PubMed] [Google Scholar]
- 60.Koschmann C. et al. ATRX loss promotes tumor growth and impairs nonhomologous end joining DNA repair in glioma. Sci. Transi. Med 8, 328ra328 (2016). [DOI] [PMC free article] [PubMed] [Google Scholar]
- 61.Li H & Durbin R. Fast and accurate short read alignment with Burrows-Wheeler transform. Bioinformatics 25, 1754–1760 (2009). [DOI] [PMC free article] [PubMed] [Google Scholar]
- 62.Li H. et al. The sequence alignment/map format and SAMtools. Bioinformatics 25, 2078–2079 (2009). [DOI] [PMC free article] [PubMed] [Google Scholar]
- 63.DePristo MA et al. A framework for variation discovery and genotyping using next-generation DNA sequencing data. Nat. Genet 43, 491–498 (2011). [DOI] [PMC free article] [PubMed] [Google Scholar]
- 64.Genomes Project, C. et al. A global reference for human genetic variation. Nature 526, 68–74 (2015). [DOI] [PMC free article] [PubMed] [Google Scholar]
- 65.Wang K, Li M & Hakonarson H. ANNOVAR: functional annotation of genetic variants from high-throughput sequencing data. Nucleic Acids Res. 38, e164 (2010). [DOI] [PMC free article] [PubMed] [Google Scholar]
- 66.Schwarz JM, Cooper DN, Schuelke M & Seelow D. MutationTaster2: mutation prediction for the deep-sequencing age. Nat. Methods 11, 361–362 (2014). [DOI] [PubMed] [Google Scholar]
- 67.Adzhubei I, Jordan DM & Sunyaev SR Predicting functional effect of human missense mutations using PolyPhen-2. Curr. Protoc. Hum. Genet Chapter 7, (2013). [DOI] [PMC free article] [PubMed] [Google Scholar]
- 68.Choi Y & Chan AP PROVEAN web server: a tool to predict the functional effect of amino acid substitutions and indels. Bioinformatics 31, 2745–2747 (2015). [DOI] [PMC free article] [PubMed] [Google Scholar]
- 69.Sim NL et al. SIFT web server: predicting effects of amino acid substitutions on proteins. Nucleic Acids Res. 40, W452–457 (2012). [DOI] [PMC free article] [PubMed] [Google Scholar]
- 70.Ferlaino M. et al. An integrative approach to predicting the functional effects of small indels in non-coding regions of the human genome. BMC Bioinformatics 18, 442 (2017). [DOI] [PMC free article] [PubMed] [Google Scholar]
- 71.Hu J & Ng PC SIFT Indel: predictions for the functional effects of amino acid insertions/deletions in proteins. PLoS ONE 8, e77940 (2013). [DOI] [PMC free article] [PubMed] [Google Scholar]
- 72.Douville C. et al. Assessing the pathogenicity of insertion and deletion variants with the variant effect scoring tool (VEST-Indel). Hum. Mutat 37, 28–35 (2016). [DOI] [PMC free article] [PubMed] [Google Scholar]
- 73.Carter SL et al. Absolute quantification of somatic DNA alterations in human cancer. Nat. Biotechnol 30, 413–421 (2012). [DOI] [PMC free article] [PubMed] [Google Scholar]
- 74.Babadi M et al. GATK CNV: copy-number variation discovery from coverage data. Cancer Res. 77, abstr. 3580 (2017). [Google Scholar]
- 75.Talevich E, Shain AH, Botton T & Bastian BC CNVkit: genome-wide copy number detection and visualization from targeted DNA sequencing. PLoS Comput. Biol 12, e1004873 (2016). [DOI] [PMC free article] [PubMed] [Google Scholar]
- 76.Dobin A. et al. STAR: ultrafast universal RNA-seq aligner. Bioinformatics 29, 15–21 (2013). [DOI] [PMC free article] [PubMed] [Google Scholar]
- 77.Liao Y, Smyth GK & Shi W. featureCounts: an efficient general purpose program for assigning sequence reads to genomic features. Bioinformatics 30, 923–930 (2014). [DOI] [PubMed] [Google Scholar]
- 78.Risso D, Schwartz K, Sherlock G & Dudoit S. GC-content normalization for RNA-Seq data. BMC Bioinformatics 12, 480 (2011). [DOI] [PMC free article] [PubMed] [Google Scholar]
- 79.Isserlin R, Merico D, Voisin V & Bader GD Enrichment Map—a Cytoscape app to visualize and explore OMICs pathway enrichment results. F1000Res 3, 141 (2014). [DOI] [PMC free article] [PubMed] [Google Scholar]
- 80.Colaprico A. et al. TCGAbiolinks: an R/Bioconductor package for integrative analysis of TCGA data. Nucleic Acids Res. 44, e71 (2016). [DOI] [PMC free article] [PubMed] [Google Scholar]
- 81.Leiserson MD, Wu HT, Vandin F & Raphael BJ CoMEt: a statistical approach to identify combinations of mutually exclusive alterations in cancer. Genome Biol. 16, 160 (2015). [DOI] [PMC free article] [PubMed] [Google Scholar]
- 82.Zhang Y, Zhou H, Zhou J & Sun W. Regression models for multivariate count data. J. Comput. Graph. Stat 26, 1–13 (2017). [DOI] [PMC free article] [PubMed] [Google Scholar]
- 83.Mayakonda A, Koeffler HP Maftools: efficient analysis, visualization and summarization of MAF files from large-scale cohort based cancer studies. Preprint at BioRxiv, 10.1101/052662 (2016). [DOI] [Google Scholar]
- 84.Shukla SA, Howitt BE, Wu CJ & Konstantinopoulos PA Predicted neoantigen load in non-hypermutated endometrial cancers: correlation with outcome and tumor-specific genomic alterations. Gynecol. Oncol. Rep 19, 42–45 (2017). [DOI] [PMC free article] [PubMed] [Google Scholar]
- 85.Szolek A. et al. OptiType: precision HLA typing from next-generation sequencing data. Bioinformatics 30, 3310–3316 (2014). [DOI] [PMC free article] [PubMed] [Google Scholar]
- 86.Bai Y, Ni M, Cooper B, Wei Y & Fury W. Inference of high resolution HLA types using genome-wide RNA or DNA sequencing reads. BMC Genomics 15, 325 (2014). [DOI] [PMC free article] [PubMed] [Google Scholar]
- 87.Boegel S. et al. HLA typing from RNA-Seq sequence reads. Genome Med. 4, 102 (2012). [DOI] [PMC free article] [PubMed] [Google Scholar]
- 88.Braendstrup P. et al. Identification and HLA-tetramer-validation of human CD4+ and CD8+ T cell responses against HCMV proteins IE1 and IE2. PLoS One 9, e94892 (2014). [DOI] [PMC free article] [PubMed] [Google Scholar]
- 89.Hong E. et al. Configuration-dependent presentation of multivalent IL-15:IL-15Ralpha enhances the antigen-specific T cell response and anti-tumor immunity. J. Biol. Chem 291, 8931–8950 (2016). [DOI] [PMC free article] [PubMed] [Google Scholar]
Associated Data
This section collects any data citations, data availability statements, or supplementary materials included in this article.


