

Summary:
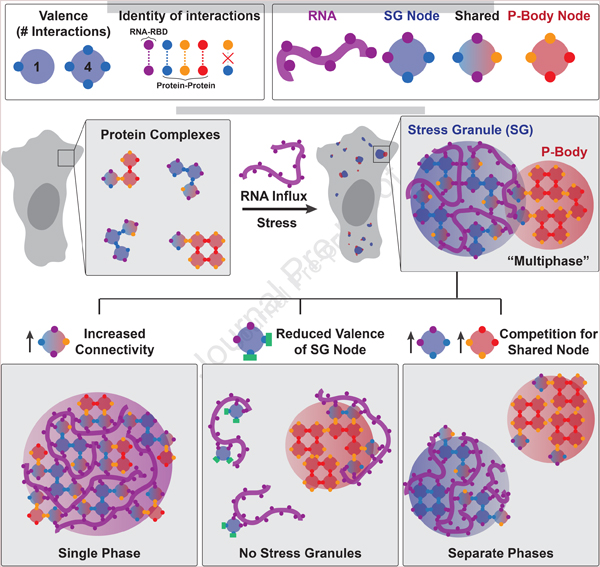
Liquid-liquid phase separation (LLPS) mediates formation of membraneless condensates, such as those associated with RNA processing, but the rules that dictate their assembly, sub-structure, and coexistence with other liquid-like compartments, remain elusive. Here, we address the biophysical mechanism of this multiphase organization using quantitative reconstitution of cytoplasmic stress granules (SGs) with attached P-bodies in human cells. Protein-interaction networks can be viewed as interconnected complexes (nodes) of RNA-binding domains (RBDs) whose integrated RNA-binding capacity determines whether LLPS occurs upon RNA influx. Surprisingly, both RBD-RNA specificity and disordered segments of key proteins are non-essential, but modulate multiphase condensation. Instead, stoichiometry-dependent competition between protein networks for connecting nodes determines SG/P-body composition and miscibility, while competitive binding of unconnected proteins disengages networks and prevents LLPS. Inspired by patchy colloid theory, we propose a general framework by which competing networks give rise to compositionally-specific and tunable condensates, while relative linkage between nodes underlies multiphase organization.
Keywords: Phase separation, multiphase, condensates, membraneless organelles, RNA-binding, stress granules, P-bodies, G3BP, UBAP2L, USP10
Graphical Abstract
In brief:
With sufficient RNA-binding interfaces, diverse protein complexes can trigger stress-dependent multiphase condensation, whose composition and spatial organization is determined by overlapping interaction networks.
Introduction
Eukaryotic cells coordinate their biochemical reactions using organelles. In addition to traditional membrane-enclosed organelles, cells feature a vast array of membraneless compartments, which exhibit sub-structure and form interfaces with each other. Unlike those of the nucleus (e.g. nucleoli, speckles) (Mao et al., 2011; Nizami et al., 2010; Zhu and Brangwynne, 2015), membraneless organelles in the cytosol typically form in a context-dependent manner, as a consequence of altered RNA homeostasis (stress granules, P-bodies) (Ivanov et al., 2018; Protter and Parker, 2016; Youn et al., 2019) or extracellular cues (signalosomes) (Gammons and Bienz, 2018; Schaefer and Peifer, 2019; Wu and Fuxreiter, 2016). Recent studies suggest that the physics of liquid-liquid phase separation (LLPS) dictate the formation of these droplet-like structures (Brangwynne et al., 2009; Li et al., 2012), which are increasingly referred to as condensates (Banani et al., 2017; Shin and Brangwynne, 2017). However, despite a flurry of recent attention, the molecular rules that account for their unique protein/nucleic acid compositions and “multiphase” patterning remain elusive.
Similarities between proteins essential for assembly of diverse condensates may inform the molecular origins of their formation and compositional specificity. Many of these proteins feature a modular organization, with a structured self-oligomerization domain (OD), intrinsically disordered region (IDR), and substrate-binding moiety (Mitrea and Kriwacki, 2016) (Figure 1A). In the case of RNA-dependent condensates, essential proteins feature an RNA-binding domain (RBD) with a folded, sequence-specific region (e.g. RRM) and/or a promiscuous, low-affinity arginine-rich motif (e.g. RGG, SR) (Chong et al., 2018; Mitrea et al., 2016; Thandapani et al., 2013). In principle, compositional specificity might be encoded by unique RBD-RNA interactions combined with stable self-oligomerization or additive weakly interacting IDR stickers (“self-associating IDRs”), both of which are sufficient for LLPS in vitro (Feric et al., 2016; Frey et al., 2006; Kato et al., 2012; Mitrea et al., 2016; Molliex et al., 2015; Nott et al., 2015; Patel et al., 2015). Whether this is the case for the vastly more complex condensates of the crowded intracellular environment is unclear, particularly given that many RBDs (e.g. RGG) and self-associating IDRs lack strong substrate discriminatory abilities.
Figure 1. G3BP dimerization and RNA-binding are necessary but not sufficient for stress granule formation.
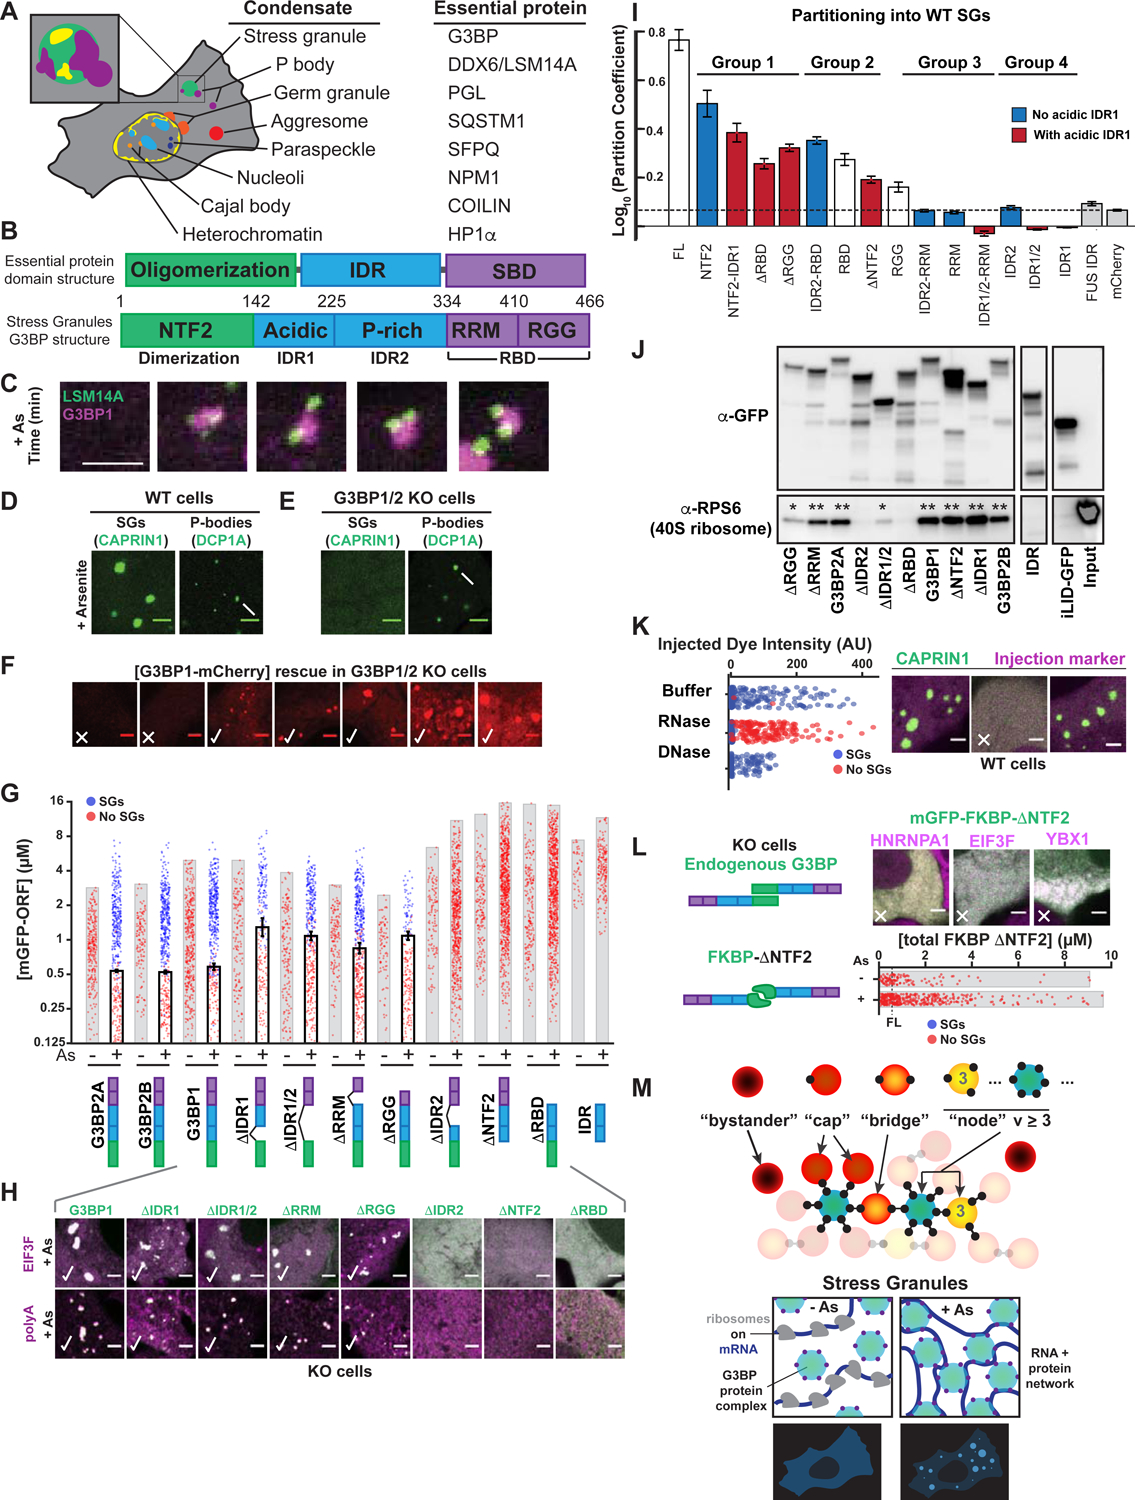
(A) Essential proteins for condensates. Inset: P-bodies (PBs, purple) attach to stress granules (SGs, green) with sub-structure (yellow).
(B) Top: Essential protein domain organization (IDR = intrinsically disordered region, SBD = substrate-binding domain). Bottom: G3BP SBD = RNA-binding domain (RBD), with Arg-Gly-Gly (RGG) region and RNA recognition motif (RRM).
(C) U2OS cells treated with 400 μM arsenite (As) form SGs with attached PBs. Lentivirus-based stable protein expression used in all experiments. Unless noted: scale bar, 3 μm.
(D) Wild-type (WT) cells (+As) with GFP-CAPRIN1 (SGs, arrowhead) or GFP-DCP1A (PBs, arrow).
(E) Same as (D) but G3BP1/2 double KO (“G3BP KO”) cells.
(F) Dose-response of SG rescue (yes = check, no = X) by G3BP1-mCherry (mCh) in G3BP KO cells (+As).
(G) Quantification of GFP-G3BP concentration threshold for SGs in KO cells (EIF3F-mCh co-positivity, +/− As). Mean and SEM: n=4 experiments, 4 images per. All experiments: each dot = one cell analyzed.
(H) Top: representative images for (G). Bottom: KO cells (+As) with GFP-G3BP1 deletions (Δs) were fixed followed by oligo-dT RNA-FISH to detect polyA+ mRNA (magenta) and SGs (check).
(I) WT U2OS cells with CAPRIN1-GFP and mCh-tagged protein. SG partition coefficient (PC) mean and SEM: n=3 experiments (n>4 images per). Dashed line = PC of mCh control.
(J) GFP-G3BP1 Δs were immunoprecipitated (IPed) from KO U2OS cells (-As) with anti (α)-GFP (then RNase and RIPA-wash) to isolate tightly-bound 40S ribosomes (* = low, ** = high RPS6). Representative blot (n=3 experiments).
(K) WT U2OS cells with GFP-CAPRIN1 were injected with buffer, RNase, or DNase, and As-treated then SGs were assessed (n=3 experiments, >100 cells per).
(L) G3BP KO cells (+As) with mCh SG proteins and GFP-FKBP-G3BP1ΔNTF2. Dashed line = rescue threshold for WT G3BP1. Images: ~8 μM GFP. X=no SGs.
(M) Top: graph theory framework for network-based condensation. “Valence” (v) = “particle” (protein or protein complex) interaction sites: v=0 (bystander), v=1 (cap); v=2 (bridge), v>2 (node). Bottom: exposed RNA for G3BP complex-binding is low; following As, RNA is exposed (ribosomes disassemble), and condensation occurs if RNA-binding v of G3BP node is sufficiently high.
See also Figure S1.
Stress granules (SGs) (Kedersha et al., 1999) are an ideal prototype for dissecting general mechanisms of intracellular LLPS, including that of specificity, as they feature multiphase structure, are not required for cell viability, form in a controllable manner, and have known composition (Ivanov et al., 2018; Protter and Parker, 2016; Youn et al., 2019). These micron-sized, RNA-protein droplets form in mammalian cells upon translational arrest and subsequent polysome disassembly, which releases exposed RNA into the cytoplasm (“RNA influx”) (Boeynaems et al., 2017; Kedersha et al., 1999; 2002; 2016; Kroschwald et al., 2015; Molliex et al., 2015; Wheeler et al., 2016; Wippich et al., 2013). Despite largely liquid-like dynamics, SGs may exhibit a less dynamic sub-structure (Jain et al., 2016; Niewidok et al., 2018; Souquere et al., 2009) and are frequently attached to the compositionally related P-bodies (PBs) (Eystathioy et al., 2002; 2003; Kedersha et al., 2005; Moon et al., 2019; Tauber et al., 2020). Despite this patterning and the known involvement of a complex network of RNA-binding proteins (RBPs) (Markmiller et al., 2018; Youn et al., 2018), studies indicate the essentiality of a single protein, G3BP, for RNA-dependent SG condensation (Alberti, 2019; Bley et al., 2015; Kedersha et al., 2016; Matsuki et al., 2013; Taylor, 2019; Tourrière et al., 2003). Although it features the modular architecture described above (Figure 1B), why G3BP is important for SG biogenesis relative to other abundant RBPs, and the mechanisms by which compositional specificity and multiphase coexistence of SGs/PBs are encoded, remain to be determined.
Here we use quantitative live cell reconstitution and biochemical assays, along with network concepts from graph theory and the study of “patchy” colloids, to dissect the relative contributions of oligomerization, RNA-binding, and protein disorder in multiphase SG/PB condensation. We show that the constitutive G3BP dimer, as well as its high-affinity binding partner UBAP2L, serve as interaction nodes to collectively confer the high number of RNA-binding contacts (RBD “valence”) needed to form a condensed ribonucleoprotein (RNP) network following RNA influx. Binding partners that lack RBDs act as “valence caps” on the G3BP node, disengaging its protein-protein interaction (PPI) network, thus decreasing RNA-binding capacity and abrogating SG assembly. We show that G3BP’s IDRs do not self-interact, but rather modulate RNA-binding via relative juxtaposition of a repulsive acidic region (see also accompanying papers (Alberti, 2019; Taylor, 2019)). Differentiation between P-bodies and stress granules is context-dependent, as changes in node stoichiometry create unique condensates that do not conform to any one description of a canonical RNP body. We propose that similar competing protein interaction networks are a ubiquitous mechanism by which cells spatiotemporally modulate multiphase coexistence, and associated substrate processing.
Results
G3BP dimerization and RNA-binding are necessary but not sufficient for stress granule formation
To elucidate the molecular rules of stress granule (SG) assembly and multiphase coexistence with P-bodies (PBs) (Figure 1A), we began by examining the minimal components required for SG assembly. In wild-type (WT) human U2OS cells, arsenite (As)-treatment (400 μM, 1-hour) causes the formation of PB-attached SGs (Figure 1C). Conversely, G3BP1/2 double knockout (G3BP KO) cells do not exhibit As-induced SGs, but form PBs (Figures 1D,E; S1A,B) (Kedersha et al., 2005; 2016). A concentration threshold characterizes systems that undergo liquid-liquid phase separation (LLPS) (Boeynaems et al., 2018; Brangwynne et al., 2015), raising the question of whether this is valid for G3BP-mediated SGs. Live cell microscopy reveals that G3BP KO cells stably expressing ectopic G3BP at low concentrations (0–0.6 μM) never exhibit microscopically detectable SGs following As-treatment, but upon exceeding ~0.6 μM, SGs become observable in nearly all cells (Figures 1F; S1A–E). No G3BP isoform causes SG assembly in the absence of stress, and micro-injection of RNase prevents their formation (Figure 1K), both of which are consistent with an essential role for RNA influx (Bounedjah et al., 2014).
Studies show that G3BP is dimeric, as is its isolated NTF2-like domain (hereafter, NTF2) (Figures 1B; 2D) (Alberti, 2019; Kedersha et al., 2016; Kristensen, 2015; Panas et al., 2015; Taylor, 2019; Tourrière et al., 2003; Vognsen et al., 2013). To examine the necessity of individual G3BP regions, we expressed a series of deletion constructs, determining concentration thresholds for SG formation (+/− As). Both dimerization and RNA-binding (via RRM or RGG) are essential for G3BP’s central role in SG assembly, as SGs form in As-treated cells expressing ΔRRM or ΔRGG, but not ΔRBD (both RRM and RGG are deleted) or ΔNTF2 (no dimers) (Figures 1G,H; S1F–I). However, for ΔRGG, SGs are smaller and the threshold for rescue is higher, which may account for divergence from previous studies (Bley et al., 2015; Kedersha et al., 2016; Matsuki et al., 2013). The requirement for the NTF2 and RBD correlates with their ability to partition into SGs in WT cells (Figure 1I), which reflects interaction preference for ribonucleoproteins (RNPs) in the SG network relative to the bulk cytoplasm.
Figure 2. SG condensation requires G3BP-UBAP2L complexes.
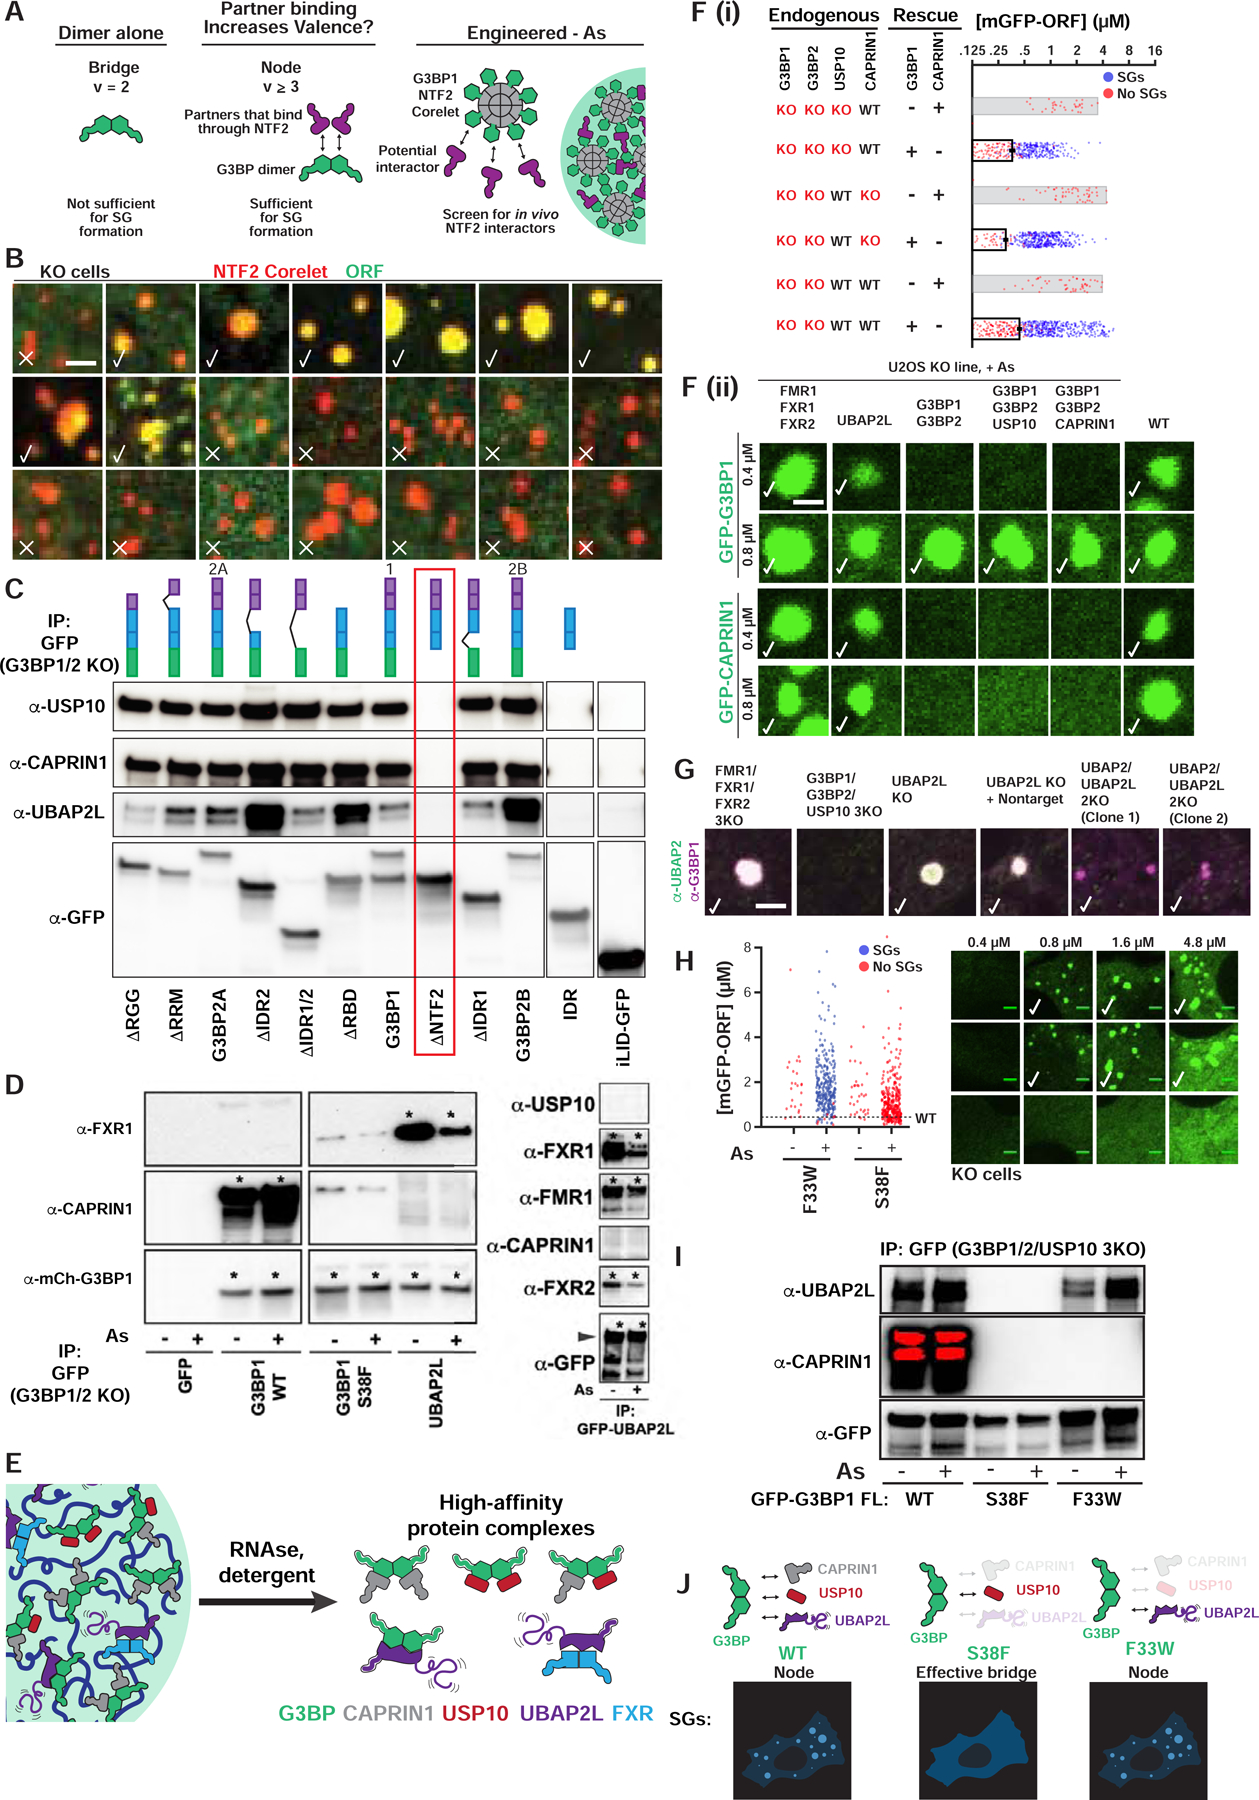
(A) Dimeric G3BP RBD bridges (v=2) are not sufficient for SGs; G3BP must act as node (v>2) via additional high-affinity protein-protein interactions (PPIs) with its NTF2 dimerization domain; right: live cell Corelet assay to screen for PPIs.
(B) G3BP KO cells (No As) with G3BP NTF2 Corelets (red, sspB-mCh-G3BP1ΔRBD; no tag, iLID-Fe core) and GFP-tagged proteins (10-min activation). Checks = putative NTF2 partners/PPIs.
(C) GFP-G3BP1Δs IPed from G3BP KO cells (No As) with α-GFP (then RNase and RIPA-wash) to isolate tightly-bound proteins. ΔNTF2 (red box) abolishes binding. Representative blot (n=3 experiments).
(D) GFP-tagged proteins IPed similar to (C), but +/− As. Representative blot (n=3 experiments), * = high-affinity interaction.
(E) High-affinity, RNA-independent complexes predicted by IPs.
(F) Top (i): Quantification of GFP-G3BP concentration threshold for SGs in KO cells (+As). Mean and SEM: n=3 experiments (n>4 images per). Bottom (ii): KO cells with GFP-tagged protein at indicated concentration, check = SGs, check* = smaller SGs.
(G) Panel of U2OS KO cells (+As) examined for SGs by immunofluorescence. Indicated: no SG defect (check), smaller SGs (check*), very small SGs in rare cells (check**).
(H) Quantification of G3BP variant concentration threshold for SGs in G3BP KO cells (+/− As). Mean and SEM: n=3 experiments (>4 images per). Representative images at indicated concentrations (+As, check=SGs).
(I) GFP-G3BP variants IPed similar to (D), but in G3BP1/2/USP10 3KO cells. Representative blot (n=3 experiments).
(J) G3BP variants form complexes of different valence, which corresponds to ability to rescue SG defects.
See also Figure S2.
Self-associating IDRs are implicated as key drivers of LLPS (Ruff et al., 2019) and potentially SG formation (Fang et al., 2019; Molliex et al., 2015; Patel et al., 2015). However, for G3BP, removal of either acidic IDR1 or both IDR1/2 causes only a minor shift in its threshold for LLPS (Figure 1G). Surprisingly, unlike ΔIDR1/2, deletion of just the proline-rich IDR2 blocks rescue of SG defects, suggesting a modulatory role for relative domain juxtaposition. As both IDR1 and IDR2 fail to partition into SGs, while presence of acidic IDR1 decreases partitioning of diverse fragments (Figure 1I), we hypothesized that its high negative charge causes electrostatic repulsion of RNA, the most abundant biomolecular component in SGs (Bounedjah et al., 2014). Consistent with this, ΔIDR2 and ΔRBD similarly lack the ability to bind rRNA-rich 40S ribosomes (Figure 1J).
Our findings underscore the importance of G3BP dimerization and RNA-binding in SG condensation. A simple physical picture is that RBD dimers “cross-link” exposed RNA following polysome disassembly. To test this, we replaced G3BP’s NTF2 with synthetic light-activated (iLID/sspB) (Guntas et al., 2015) or constitutive (FKBP) (Rollins et al., 2000) dimerization domains. Unexpectedly, stable expression of either full-length (FL) G3BP dimer mimetic failed to rescue SGs at concentrations greatly exceeding physiological values (Figures 1L; S1J). In parallel, we transiently expressed iLID/sspB-ΔNTF2 using Lipofectamine. In cells with both components at far higher concentrations than achieved with tolerated stable expression, SGs are observed (Figure S1J). This concentration threshold (20 μM) is >30x that of FL G3BP (0.6 μM) (Figures 1G; S1D,J). We cannot rule out the possibility that high levels of plasmid-encoded mRNA and cationic Lipofectamine, which can induce interferon signaling and SG assembly in WT cells, contribute to this effect (Guo et al., 2019; Hagen et al., 2015; Panas et al., 2019; Tourrière et al., 2003). Thus, NTF2-mediated dimerization of the RBD is necessary, but not sufficient, for SG formation at physiological G3BP concentrations (~1.8 μM in HeLa cytoplasm (Hein et al., 2015); ~2.2 μM in U2OS, see Supplemental Quantification and Statistical Analysis).
SG condensation requires G3BP-UBAP2L complexes
From work with patchy colloids (Bianchi et al., 2011), a system of interacting particles can only phase separate into a dynamically connected network if each particle has a sufficient number of sites to engage other particles, which defines its valence, v (Figure 1M); here, the “particle” (or “vertex” in graph theory) represents an individual protein, RNA, or stable complex. Generally speaking, v>2 are essential, with higher valences more readily driving LLPS. In the case of synthetic G3BP dimers (Figure 1L), there are only two interaction interfaces and thus feature overall v=2 (2 RBD-RNA interfaces); we refer to v=2 particles as “bridges”, which might contribute to phase separation by linking higher-valence particles, but cannot on their own form a space-spanning interaction network (Figure 1M).
Given that a generic dimerization domain cannot replace G3BP’s NTF2, we reasoned that rather than a bridge (v=2), the G3BP dimer embodies a particle of v≥3; we refer to such objects as “nodes” (Figure 1M). In the case of an endogenous G3BP dimer, such valence would be achieved by at least one heterotypic protein-protein interaction (PPI) with the NTF2 domains, in addition to the two RBDs. If so, NTF2 might serve as an interaction platform for additional RNA-binding nodes and amplify the overall v—and hence RNA-binding capacity—of the resulting complex (Figure 2A). To screen for such SG proteins, we harnessed NTF2’s dimerization abilities in the context of a two-component optogenetic biotechnology, known as Corelets (Bracha et al., 2018). Corelets are comprised of a 24-mer ferritin “core” coated by iLID molecules, which acts as an oligomerization platform following blue light-stimulated sspB-iLID interactions (Bracha et al., 2018). By changing the relative concentration of the two components, the oligomerization state (valence) can be varied (0 to 24) and intracellular phase diagrams can be mapped (Bracha et al., 2018). We hypothesized that NTF2 dimers would form homotypic links between cores and cause condensation, allowing microscopy-based identification of heterotypic NTF2-interacting partners by their relative partitioning (Figure 2A). In a panel of abundant (Table S1) and frequently studied GFP-tagged SG (N=20) and PB (N=3) proteins, only 8 SG proteins (USP10, UBAP2L, CAPRIN1, FMR1, FXR1, NUFIP2, G3BP1, G3BP2A) partition strongly into NTF2 condensates (G3BPΔRBD Corelets) (Figure 2B). These proteins are specific to NTF2 interactions, as they are not observed in a non-SG Corelet condensate (FUS IDR) (Figure S2A). To validate these proposed NTF2-binding partners, we performed biochemical studies, finding that G3BP-mediated co-immunoprecipitation (“co-IP”) of USP10, CAPRIN1, and UBAP2L all require its NTF2 domain; as interactions are preserved following RNase and stringent washing, we refer to these as “high-affinity” (Figure 2C). Conversely, FMR1 and FXR1, which assemble into dimers (Adinolfi et al., 2003; Dolzhanskaya et al., 2006), co-IP with UBAP2L, but not G3BP and CAPRIN1, allowing us to infer the existence of distinct high-affinity protein complexes (Figure 2D,E).
We reasoned that the identified proteins might serve as G3BP-interacting bridges or nodes to contribute additional, essential RNA-binding interfaces (valence) for condensing the SG RNP network; we note that all but USP10 have RBDs. To investigate this, we generated a series of single- and multi-knockout (KO) U2OS cell lines. KO of USP10, CAPRIN1, NUFIP2, FXR1/FXR2/FMR1 (3KO), or FXR1/FXR2/FMR1/NUFIP2 (4KO) had no effect on SG formation (Figure 2F,G). USP10 and CAPRIN1 are unlikely to play major roles in SG condensation at endogenous levels in U2OS cells, as associated G3BP 3KOs (G3BP1/G3BP2/USP10, G3BP1/G3BP2/CAPRIN1) require similar concentrations of G3BP for rescue relative to 2KO (Figure 2F). In contrast, UBAP2/2L 2KO results in smaller SGs, which form in only a minority of cells (Figure 2G), a finding supported by others (Cirillo et al., 2020; Huang et al., 2019; Markmiller et al., 2018; Taylor, 2019; Youn et al., 2018). Since UBAP2/2L 2KO has no effect on CAPRIN1 and G3BP1 levels, and only slightly reduces USP10 and G3BP2 (Figure S2E), these data suggest that UBAP2/2L (hereafter, paralogs referred to as “UBAP2L”) might act as a critical G3BP-associated node. In strong support of this hypothesis, we serendipitously discovered a missense mutation in G3BP’s NTF2 domain (S38F), which blocks its ability to rescue SG formation (Figure 2H). G3BP S38F forms dimers, (Figures 2D; S2D), binds USP10 (Figure S2C), and partitions strongly into SGs when expressed with WT G3BP (Figure S2B). However, the S38F variant is unable to form high-affinity complexes with CAPRIN1 or UBAP2L (Figure 2I), suggesting that the mutation changes G3BP from a v≥3 node to a v=2 bridge, which no longer engages required valence from UBAP2L. Importantly, a previously identified G3BP NTF2 variant (F33W) (Kedersha et al., 2016) retains association with UBAP2L, but not USP10 or CAPRIN1 (Figure 2I), yet displays a similar threshold concentration for rescue as WT (Figure 2H). Taken together, these data provide compelling support for G3BP-UBAP2L complexes playing an essential role in SG condensation by virtue of their node identities (Figure 2J).
Valence capping of the G3BP node by RBD-lacking binding partners prevents stress granule formation
Having identified NTF2-interacting proteins that may contribute RBD valence to the G3BP complex, we turned to investigate the role of USP10, the only identified partner without an RBD. We hypothesized that USP10 competes with RNA-binding proteins (RBPs, e.g. UBAP2L) for NTF2-binding and effectively “caps” the G3BP node; reduction of the overall valence of the complex would disrupt the formation of a space-spanning network (Figure 3A). To test this “valence capping” model, we examined the effect of USP10 concentration on G3BP-dependent SG formation. Building on qualitative studies (Kedersha et al., 2016; Panas et al., 2015), competitive inhibition experiments in G3BP KO cells indicate that USP10 impacts the G3BP rescue threshold as a function of stoichiometry, with a slope of ~1 (i.e. cells require excess G3BP relative to USP10 to form SGs) (Figures 3B,C; S3F). This is consistent with G3BP monomer binding a single USP10 molecule, which disengages other RBPs from its NTF2 interface. Expression of USP10’s NTF2-interaction motif (“NIM”, amino acids 1–33) results in identical inhibition (slope~1) (Figures 3B; S3B,C), indicating that full-length USP10 does not act as a bridge between G3BP and other SG components. A panel of controls (n=15 proteins) demonstrates specificity of inhibition to USP10 (Figure S3A), and optogenetic approaches support an NTF2-dependent mechanism of action (Figure S3D,E).
Figure 3. Valence capping of the G3BP node by RBD-lacking binding partners prevents stress granule formation.
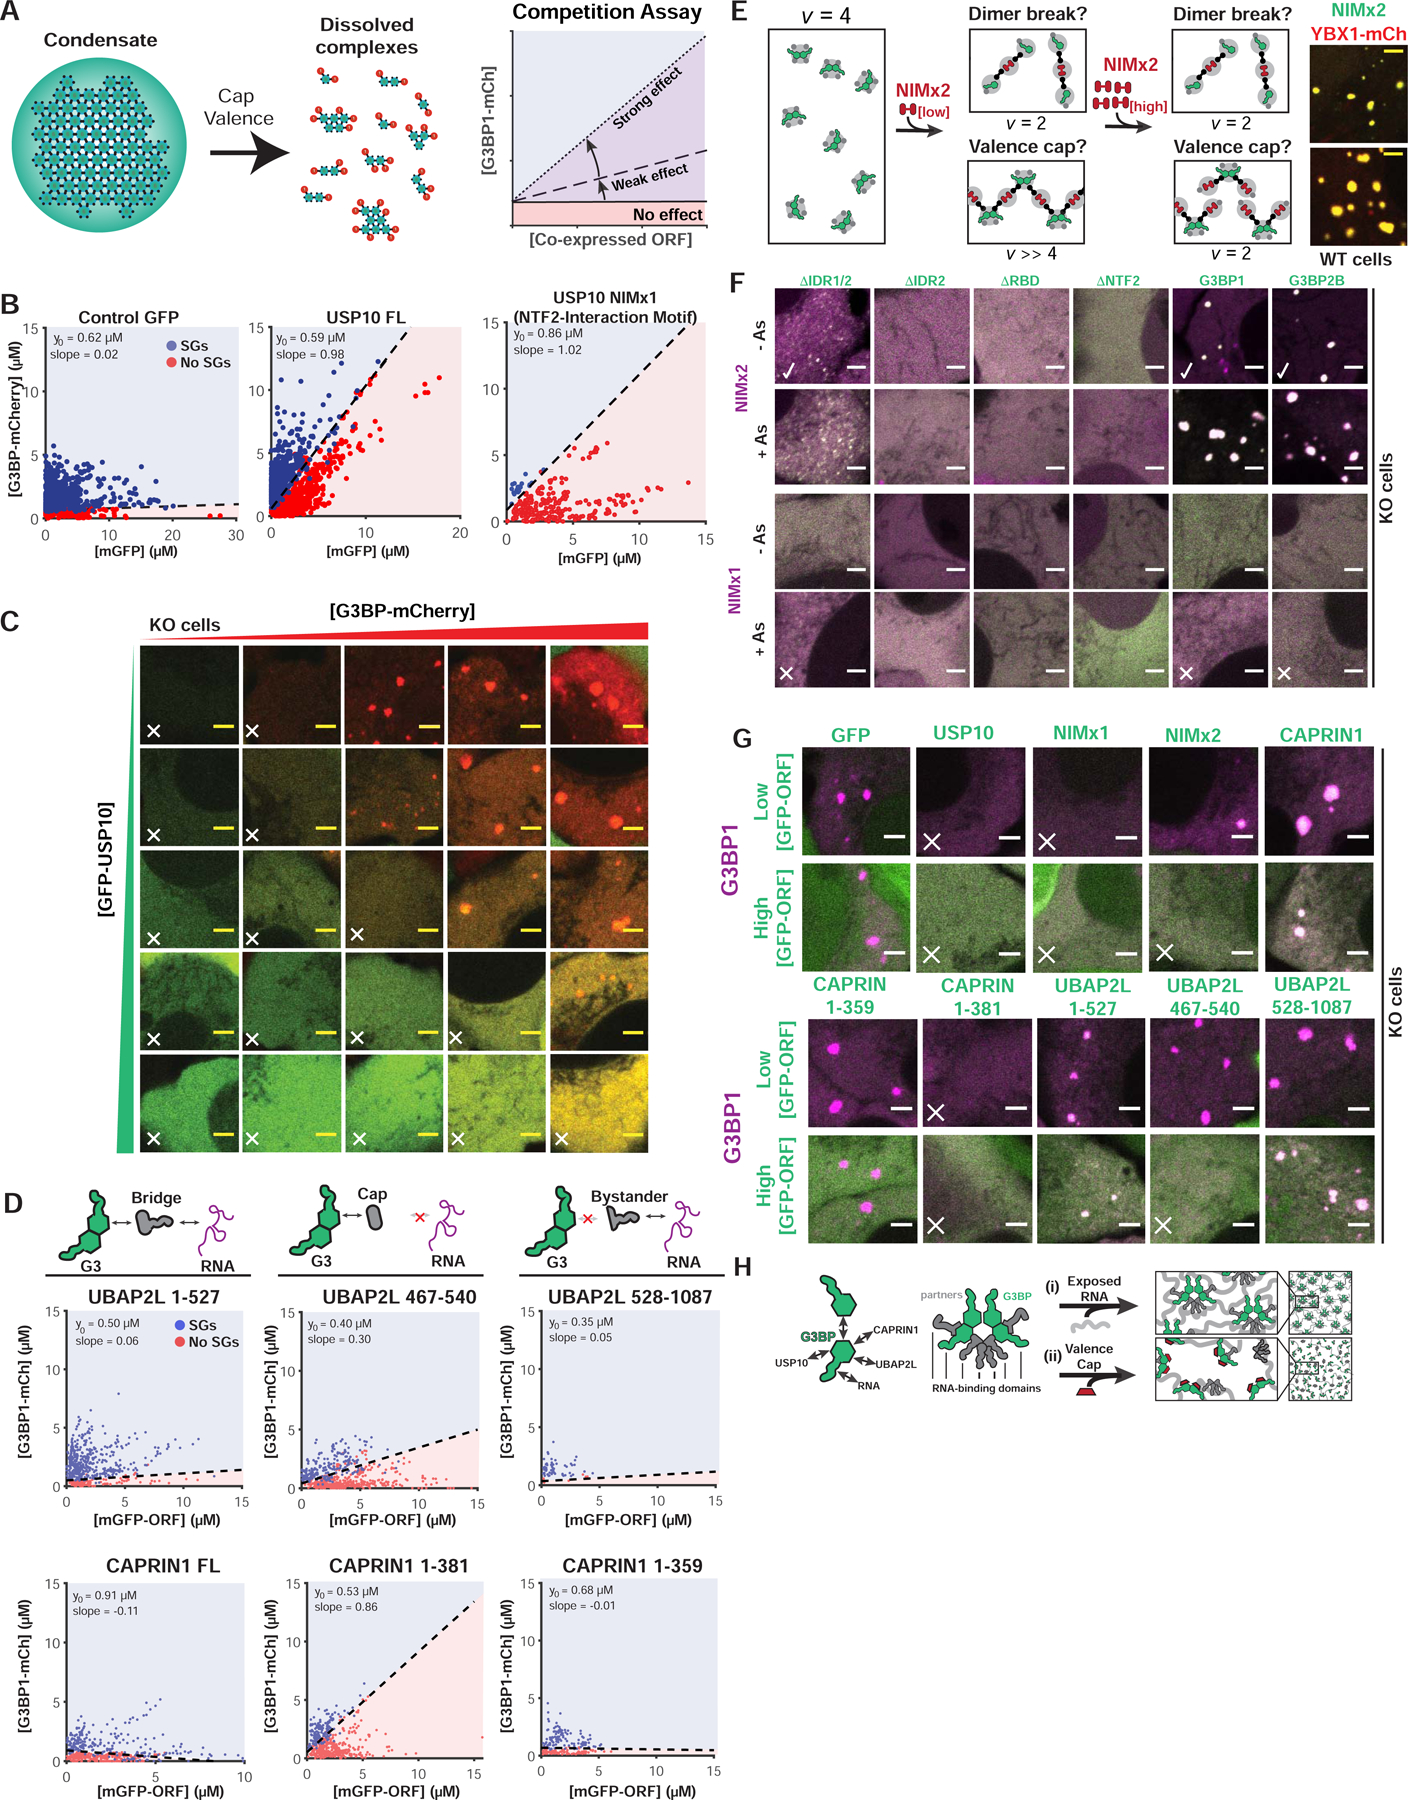
(A) Interacting “caps” (v=1) are proposed to disrupt networks of high v particles. Right: SG rescue competition assay (G3BP KO cells) tests model by co-expressing GFP-tagged NTF2 partners (cap, positive slope) with G3BP1-mCh.
(B) Competition assay for predicted caps in G3BP KO cells (+As). Indicated: y-intercept (G3BP rescue concentration, no competitor), best-fit slope demarcating +/− SG cells.
(C) Representative images for (B, middle) at indicated protein concentrations (X, no SGs).
(D) Competition assay similar to (B) with CAPRIN1/UBAP2LΔs.
(E) NTF2-interacting motifs (NIMs) inhibit SGs by “dimer breaking” or “valence capping”, differentiable using a v=2 NIM bridge (“NIMx2”). If capping: low NIMx2 promotes condensation, polymerizing G3BP dimers (high vRBD); high, inhibits by saturation (vRBD=2). If breaking, low and high NIMx2 link G3BP monomers (vRBD=2). Right: GFP-NIMx2 induces SGs in WT U2OS (-As).
(F) Representative images (X, inhibits SGs; check, promotes): G3BP KO cells (+/− As) expressing GFP-G3BPΔs and mCh-NIMx1 (or x2)
(G) Images (X, inhibits SGs) for G3BP KO cells (+As) with mCh-G3BP1 and GFP-tagged protein (low or high levels).
(H) Molecular model for SG regulation by NTF2 PPIs.
See also Figure S3.
Previous work speculated that differential USP10- vs. CAPRIN1-binding toggle G3BP between conformations that inhibit or promote RNP condensation (Kedersha et al., 2016). In contrast, our valence capping model proposes that USP10 acts as a v=1 interactor (“cap”) that decreases the overall valence of the G3BP complex. This hypothesis makes a specific and testable prediction: NTF2-binding bridges/nodes (v≥2) will similarly inhibit SG formation if their RBDs are removed, such that they too become caps (v=1) (Figure 1M). Informed by G3BP interaction domain-mapping studies (Baumgartner et al., 2013; Solomon et al., 2007; Youn et al., 2018), we generated GFP-tagged CAPRIN1 and UBAP2L caps (NIM only, v=1), bridges (NIM and RBD, v=2), and bystanders (lacks NIM, v=0), and performed competitive inhibition experiments in G3BP KO cells. Predicted bridges and bystanders have no effect on G3BP rescue (slope~0), whereas both CAPRIN1 and UBAP2L caps inhibit (positive slope) (Figures 3D,G; S3B). The UBAP2L NIM cap is a less potent inhibitor than that of USP10 or CAPRIN1, which agrees with co-IP studies assessing relative binding of the full-length proteins to G3BP (Figure 2C), and illustrates that degree of valence capping is dependent on relative interaction strengths (Figure 3A).
Although disfavored by prior work (Panas et al., 2015; 2014; Schulte et al., 2016), an alternative explanation is that USP10 disrupts NTF2 dimers. To test this, we generated a USP10 NIM doublet to change it from a cap (v=1) to a bridge (v=2, “NIMx2”), reasoning that if NIM disrupts G3BP dimers, NIMx2 would link two G3BP monomers into a complex with insufficient valence (v=2) for condensation (Figure 3E). Inconsistent with this model, expression of NIMx2 in WT cells causes formation of granules in the absence of stress (Figure 3E). Examination of KO cells (+/−As) co-expressing NIMx2 and G3BP deletions revealed that both NTF2 and RNA-binding are required (Figure 3F,G), which signifies a requisite amplification of RNA-binding valence. Strikingly, NIMx2 displays “reentrant” properties, promoting SG formation at low ratios relative to G3BP and inhibiting at high (>3) (Figures 3E–G; S3B). This reentrant phase transition likely results from a lack of available NIM-free G3BP for polymerization (Figure 3E) and can be recapitulated using an engineered system (Figure S3G). Taken together, these data negate the possibility that USP10 disrupts G3BP dimers, but instead favor a valence-capping model (Figure 3H).
High valence G3BP RBD nodes are sufficient for stress granule formation with attached P-bodies
Our data suggest that highly multivalent RNA-binding complexes are necessary for SG condensation, but a stringent test of this model requires experimental control of RBD valence (vRBD). To quantitatively interrogate the relationship between vRBD, protein complex concentration, and RNA availability, we again utilized the optogenetic Corelet system (Bracha et al., 2018). Replacing the dimerization domain (NTF2) of G3BP with sspB (“ΔNTF2 Corelets”) (Figure 4A), we find that non-stressed G3BP KO cells require a very high degree of RBD oligomerization (vRBD ~24 at 0.15 μM Core) for LLPS (Figure 4F,G). Following As-treatment (stress), LLPS occurs at lower core concentrations and valences (vRBD ~8 at 0.15 μM Core), and the resulting granules are larger (Figure 4F,G). Stress-dependent LLPS occurs rapidly (seconds) and is reversible (Figures 4B; S4A), indicating that multivalent RNA-binding contacts are essential for both SG formation and maintenance. Such condensates mimic the properties of endogenous SGs, including a dependence on RNA influx (Figures 4E–H; S4F,G), recruitment of SG proteins and polyA+ mRNA with attachment of PBs (Figure 4J), and liquid-like dynamics (Figure 4C,D). We therefore refer to these structures as optogenetic stress granules (opto-SGs).
Figure 4. High valence G3BP RBD complexes are sufficient for stress granule formation with attached P-bodies.
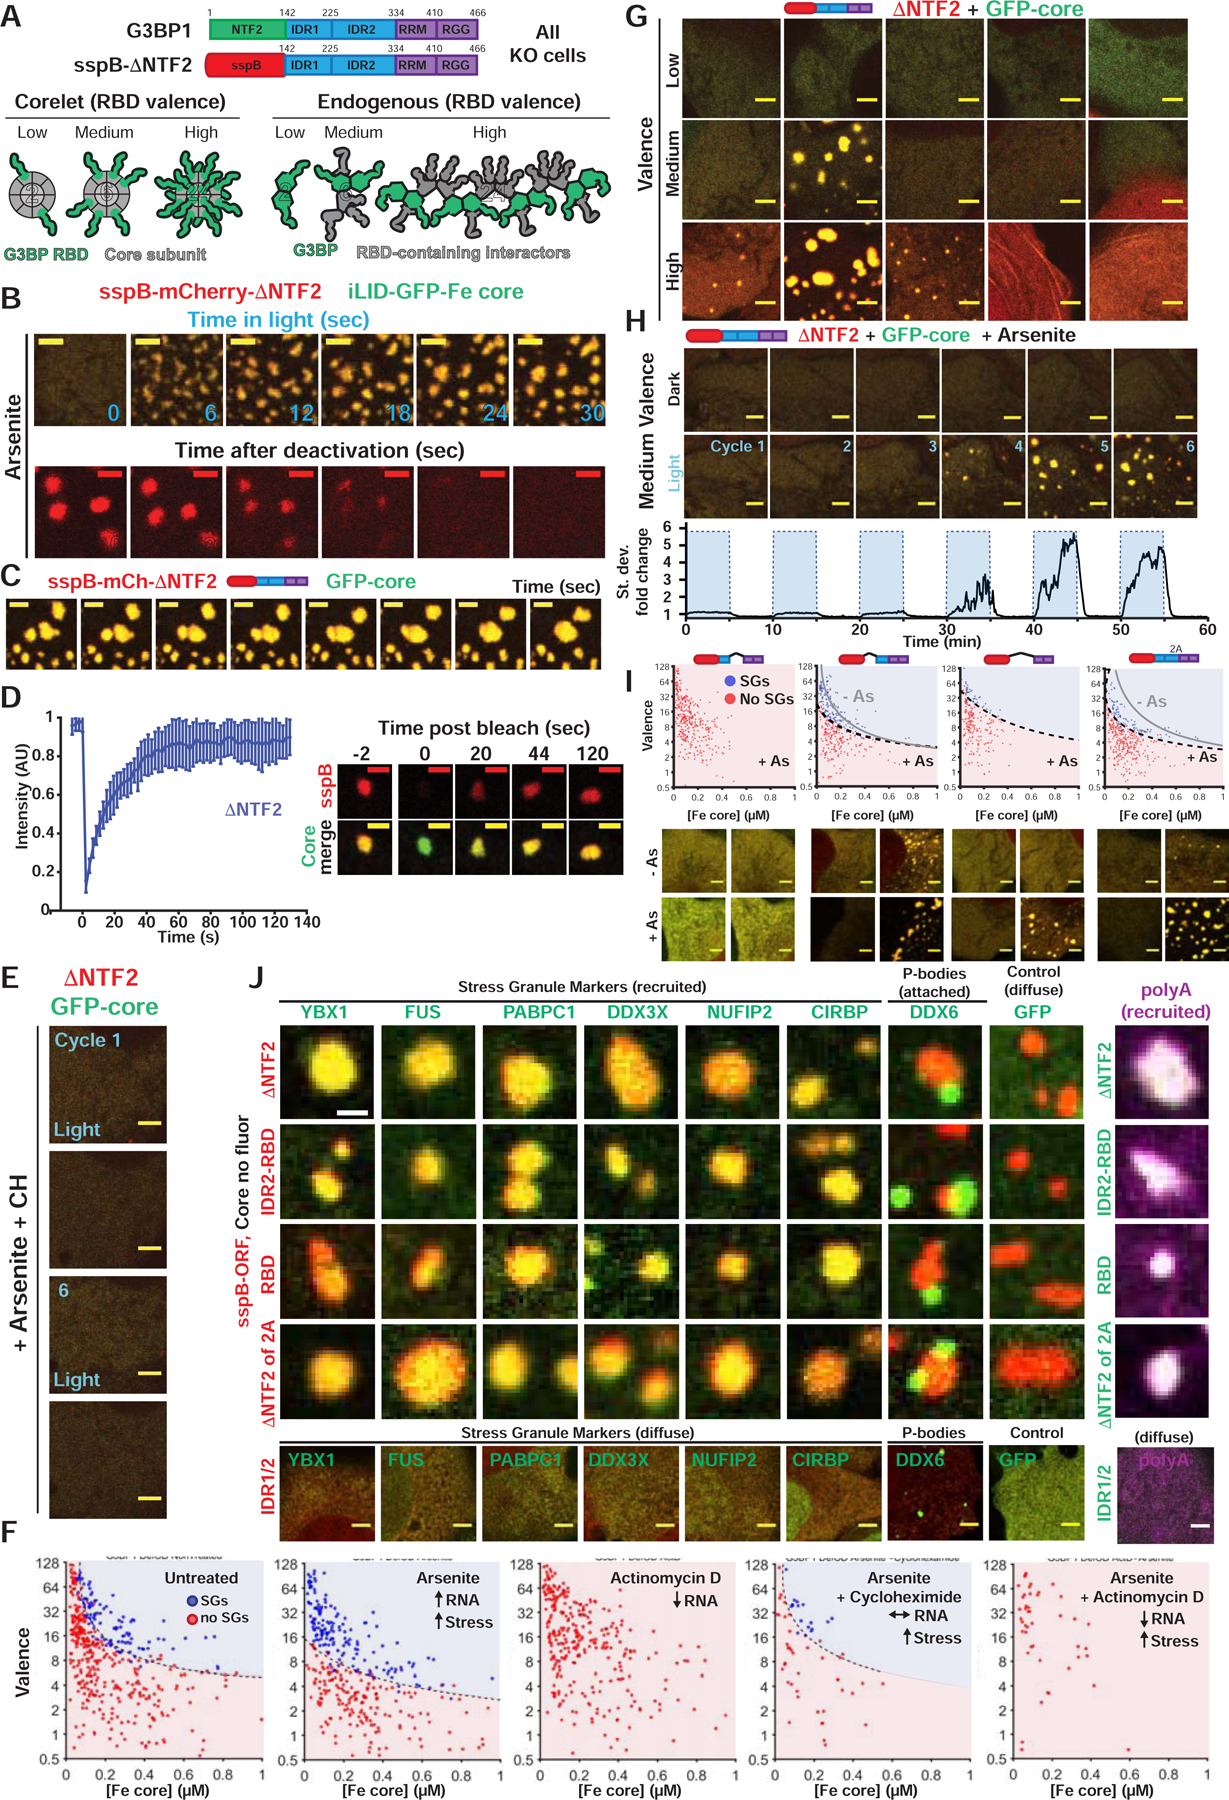
(A) Corelets allow optogenetic tuning of vRBD (0 to 24) on a 24-subunit Ferritin (Fe) core to mimic endogenous vRBD of G3BP complex. All Corelet experiments (unless noted): vRBD is denoted low (~2–4), medium (~6–8), or high (~18–24); core ~0.25 μM; cells = G3BP KO U2OS.
(B) Reversible G3BP1ΔNTF2 Corelets after 1-hour As. Indicated: seconds after oligomerization (+blue light) or monomerization (-blue light), scale bar = 3 μm in all images unless noted.
(C) ΔNTF2 Corelets fuse and relax to a sphere following As, activation (3-min). Scale bar, 2 μm.
(D) FRAP of ΔNTF2 Corelets (+As). Intensity relative to fluorescence before granule bleach. Mean and SEM: n=8 experiments. Representative images shown, scale bar = 2 μm.
(E) ΔNTF2 Corelet cells (medium v) treated with cycloheximide (CH) then As (six 10-min cycles: 5-min activate, 5-min deactivate). Images: after cycle.
(F) Intracellular ΔNTF2 Corelet phase diagrams for drugs that alter available RNA. Each dot = single cell (5-min activation), best-fit phase threshold shown.
(G) Representative images for (F).
(H) Similar to (E) but no CH. Standard deviation of pixel intensity relative to first image shown.
(I) Similar to (F) but for additional Δs (+/− As; dots shown for +As). Representative images for high v cells.
(J) GFP-tagged proteins co-expressed with indicated G3BP Corelets (iLID-Fe lacks GFP tag). Following As and 10-min activation, cells were fixed; arrowheads, PBs attached to SGs. Right: oligo-dT RNA FISH (Corelet, green; polyA+ RNA, magenta).
See also Figure S4.
The shift in the ΔNTF2 Corelet phase threshold after RNA influx can be visualized in As-treated cells subjected to repeated cycles of activation and de-activation, which triggers valence-dependent opto-SG assembly on a timescale similar to endogenous SGs (Figures 4H; S4F). Such a shift is negated by pre-treatment with cycloheximide, which blocks polysome disassembly/RNA influx (Figures 4E–G; S4G), and long-term inhibition of RNA transcription by Actinomycin D prevents opto-SG formation (Figure 4F,G). We emphasize that these drug-dependent changes in LLPS are not Corelet artifacts: similar threshold shifts are absent for self-associating FUS IDR Corelet condensates (Figure S4D,E), which do not recruit SG proteins (Figure S2A), and are thus not stress granules; this is consistent with previous studies using an orthogonal Cry2-based optoDroplet approach (Shin et al., 2017; Zhang et al., 2019).
To determine the minimal G3BP domain for opto-SG LLPS, we examined ΔNTF2 Corelets with additional regions deleted. Consistent with a lack of SG partitioning (Figure 1I), G3BP’s central IDRs do not self-interact, as IDR1, IDR2, and IDR1/2 Corelets never cause LLPS (+/− As) (Figure S4H–K). In contrast, both G3BP RBD (RRM and RGG) and IDR2-RBD Corelets form polyA+ opto-SGs containing all tested SG proteins (Figures 4I,J; S4B,C). Underscoring its utility as a biotechnology, G3BP Corelets replicate several phenotypes of corresponding GFP-tagged deletions. First, ΔNTF2/ΔIDR2 (synthetic GFP-G3BPΔIDR2) fails to form granules (+/− As) (Figure 4I). Second, similar to GFP-ΔIDR1, ΔNTF2/ΔIDR1 forms irregular granules (Figures 4I; S4C). Third, RBD-only Corelets feature a right shifted phase threshold relative to ΔNTF2 (Figure 4I). Finally, all such condensates are reversible, form multiphase structures with PBs, and similarly recruit SG proteins and polyA+ RNA (Figures 4J; S4B,C). Thus, Corelets recapitulate nearly all features of GFP-based rescue experiments (see also Figure S4J,K), and represent a powerful synthetic approach for assessing the relationship between RBD valence, RBD identity, and stress granule/P-body composition and coexistence.
Stress granules with attached P-bodies are the default multiphase condensate encoded by high valence RBD nodes
Unlike synthetic dimers, highly multivalent G3BP RBD Corelets are sufficient to compensate for full-length G3BP and assemble stress granules. Given that G3BP is a constitutive RBD dimer, this finding is only biologically meaningful if interaction partners contribute additional RBD valence (vRBD) to the protein complex. If true, we reasoned that such G3BP NTF2-associated proteins would act similarly upon oligomerization of their RBDs, forming compositionally identical SGs that adhere to PBs (Figure 5A). To test this, we mapped phase diagrams for UBAP2L and CAPRIN1 RBD Corelets (G3BP KO, +/− As) (Figure 5B,C). Surprisingly, despite each featuring a single RGG, both RBDs are even more potent than G3BP RBD (1 RRM, 1 RGG) at enabling SG formation in both the Corelet system (Figure 5C) and when placed into GFP-G3BP chimeric proteins (Figures 5E, S5J). Similar to G3BP RBD Corelets, As-induced RNA influx causes a shift in their associated phase thresholds and results in reversible, PB-studded opto-SGs with all tested markers (Figures 5C,D; S5). However, both As-induced threshold shifts are minor relative to G3BP RBD (Figure 4F), which could potentially arise from self-interactions that contribute to LLPS. We refuted this possibility, as RNA depletion inhibits CAPRIN1 RBD LLPS (Figure S5A), as does scrambling its sequence (Figure S5C). We thus infer that NTF2-associated RBPs are indeed capable of contributing vRBD to the multi-protein G3BP complex.
Figure 5. Stress granules with attached P-bodies are the default multiphase condensate encoded by high valence RBD nodes.
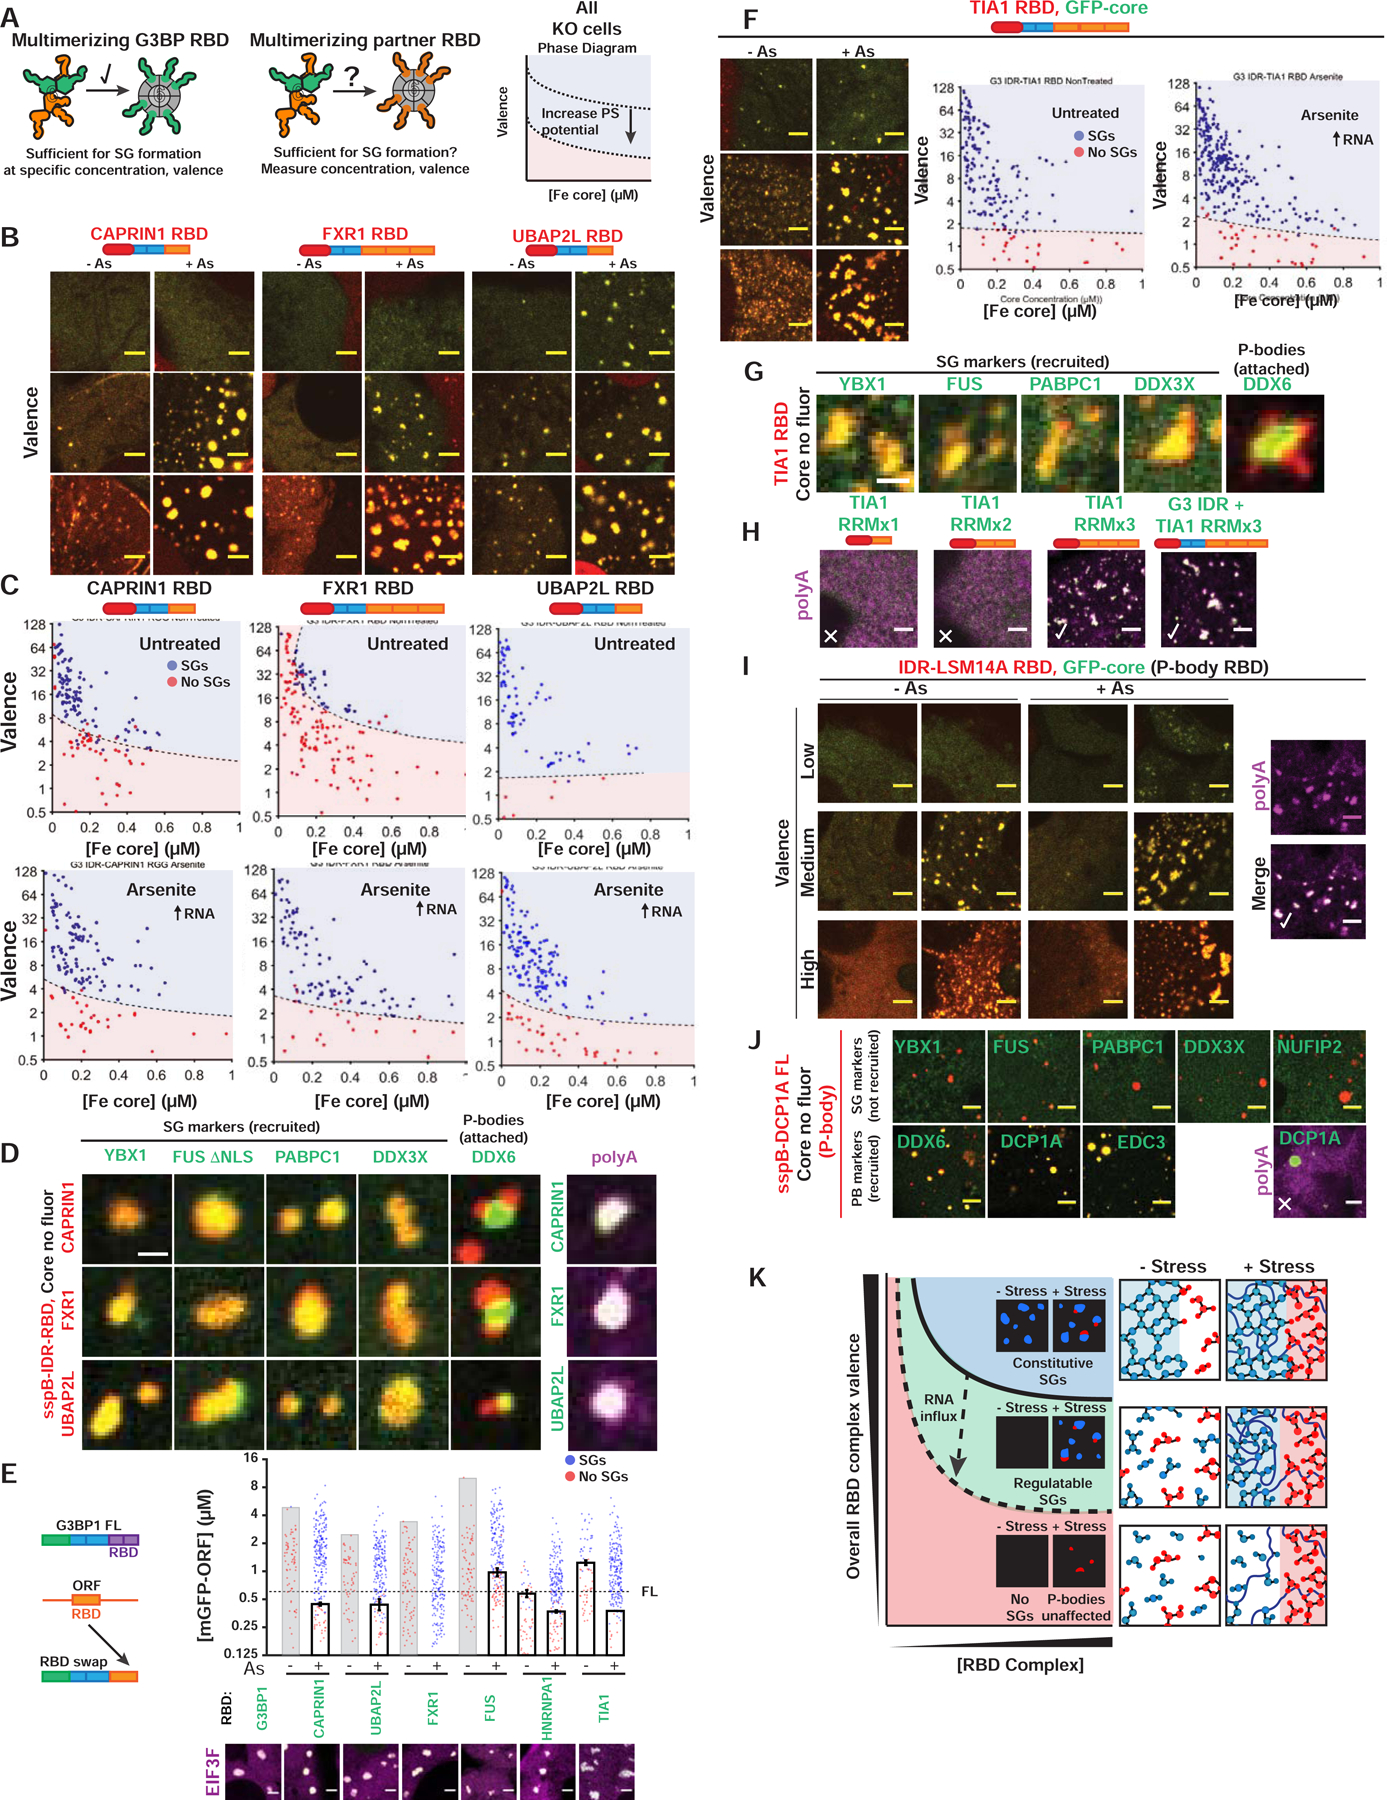
(A) Corelet assay to test whether NTF2 partners contribute vRBD to G3BP complex.
(B) Valence-dependent condensation (+/−As) examined for indicated RBDs fused to G3BP IDR in Corelet system (images correspond to (C)). All Corelet experiment images (unless noted): vRBD is noted low (~2–4), medium (~6–8), or high (~18–24); core ~0.25 μM; cells = G3BP KO U2OS; scale bar = 3 μm.
(C) Intracellular phase diagrams for RBDs in (B) +/− As. Each dot = single cell (5-min activation), best-fit phase threshold shown.
(D) GFP-tagged proteins expressed with indicated RBD Corelets (iLID-Fe lacks GFP tag). Following As and 10-min activation, cells were fixed; arrowheads, PBs attached to SGs. Right: oligo-dT RNA FISH.
(E) SG rescue threshold for GFP-tagged chimeric G3BP1 with swapped RBDs (G3BP KO cells with EIF3F-mCh, representative images below). Mean and SEM: n=4 experiments (>4 images per).
(F) Similar to (B,C) but with TIA1 RBD Corelets.
(G) Similar to (D) but with TIA1 RBD Corelets.
(H) Similar to (D) but with TIA1 RBD (number of RRMs altered; +/− G3BP1 IDR).
(I) Similar to (B,D) but with RBD from LSM14A (essential PB protein).
(J) Similar to (D) but with DCP1A (PB protein that lacks RBD).
(K) Phase diagram cartoon depicting SG formation as function of nucleating complex concentration and its vRBD. WT cells would exist in green region; G3BP KO/capped, red.
See also Figure S5.
It is conceivable that multivalent NTF2-associated RBDs are unique in engaging SG RNPs to form a condensed network that coexists with that of P-bodies. However, the RBD of FXR1, a dimeric RBP that interacts with UBAP2L but not NTF2 (Figure 2D), mimics G3BP RBD in all assays (Figures 5B–E; S5E–J). Remarkably, use of a large panel of additional Corelets (n=25) indicates that high vRBD is sufficient for PB-studded, polyA+ SG assembly, irrespective of whether the RBD is folded (RRM) or unfolded (RGG), from a SG or PB protein, or linked to G3BP IDR (Figures 5F–I; S5E–G). Despite this RBD interchangeability, we surmise that RBD-RNA specificity and relative interaction strengths contribute to the lack of relationship between type/number of RNA-binding motifs and relative phase thresholds (Figure 5C,F–H). Importantly, Corelets are capable of plugging into non-SG interaction networks, as those of DCP1A—a P-body protein with PPIs but no RBD—recruit PB but not SG markers (Figure 5J). Thus, polyA+ stress granules with attached P-bodies are the “default” multiphase condensate encoded by high valence RBD nodes (Figure 5K).
A self-associating IDR in UBAP2L is critical to its ability to act as a valence-multiplying node
Unlike other proteins, mild expression (<1 μM) of UBAP2L or FXR1 rescues stress granule defects in G3BP KO cells (Figures 6A,B; S6A–C), implying that they can act as G3BP-independent SG nodes. We hypothesized that, in each of these cases, a self-associating domain would confer the requisite valence for node identity (v≥3). Although previous studies have indicated that such a domain (dimerization) exists for FXR1 (Adinolfi et al., 2003; Dolzhanskaya et al., 2006), one has yet to be described for UBAP2L. Using a Corelet screen for PPI valence (n=13 UBAP2L/CAPRIN1 fragments) (Figure 6C), we identified a non-dimeric (Figure 6H), self-associating IDR in UBAP2L (781–1087), which is essential for its ability to rescue SG defects in G3BP KO cells (Figure 6C,D; S6D–G). We surmise that this “sticky” IDR facilitates weak interactions between UBAP2L proteins in separate high-affinity complexes (FXR1/UBAP2L, UBAP2L/G3BP), thus acting as an essential valence multiplier for SG formation (Figure 6E).
Figure 6. Competition between protein-protein interaction nodes encodes multiphase condensation.
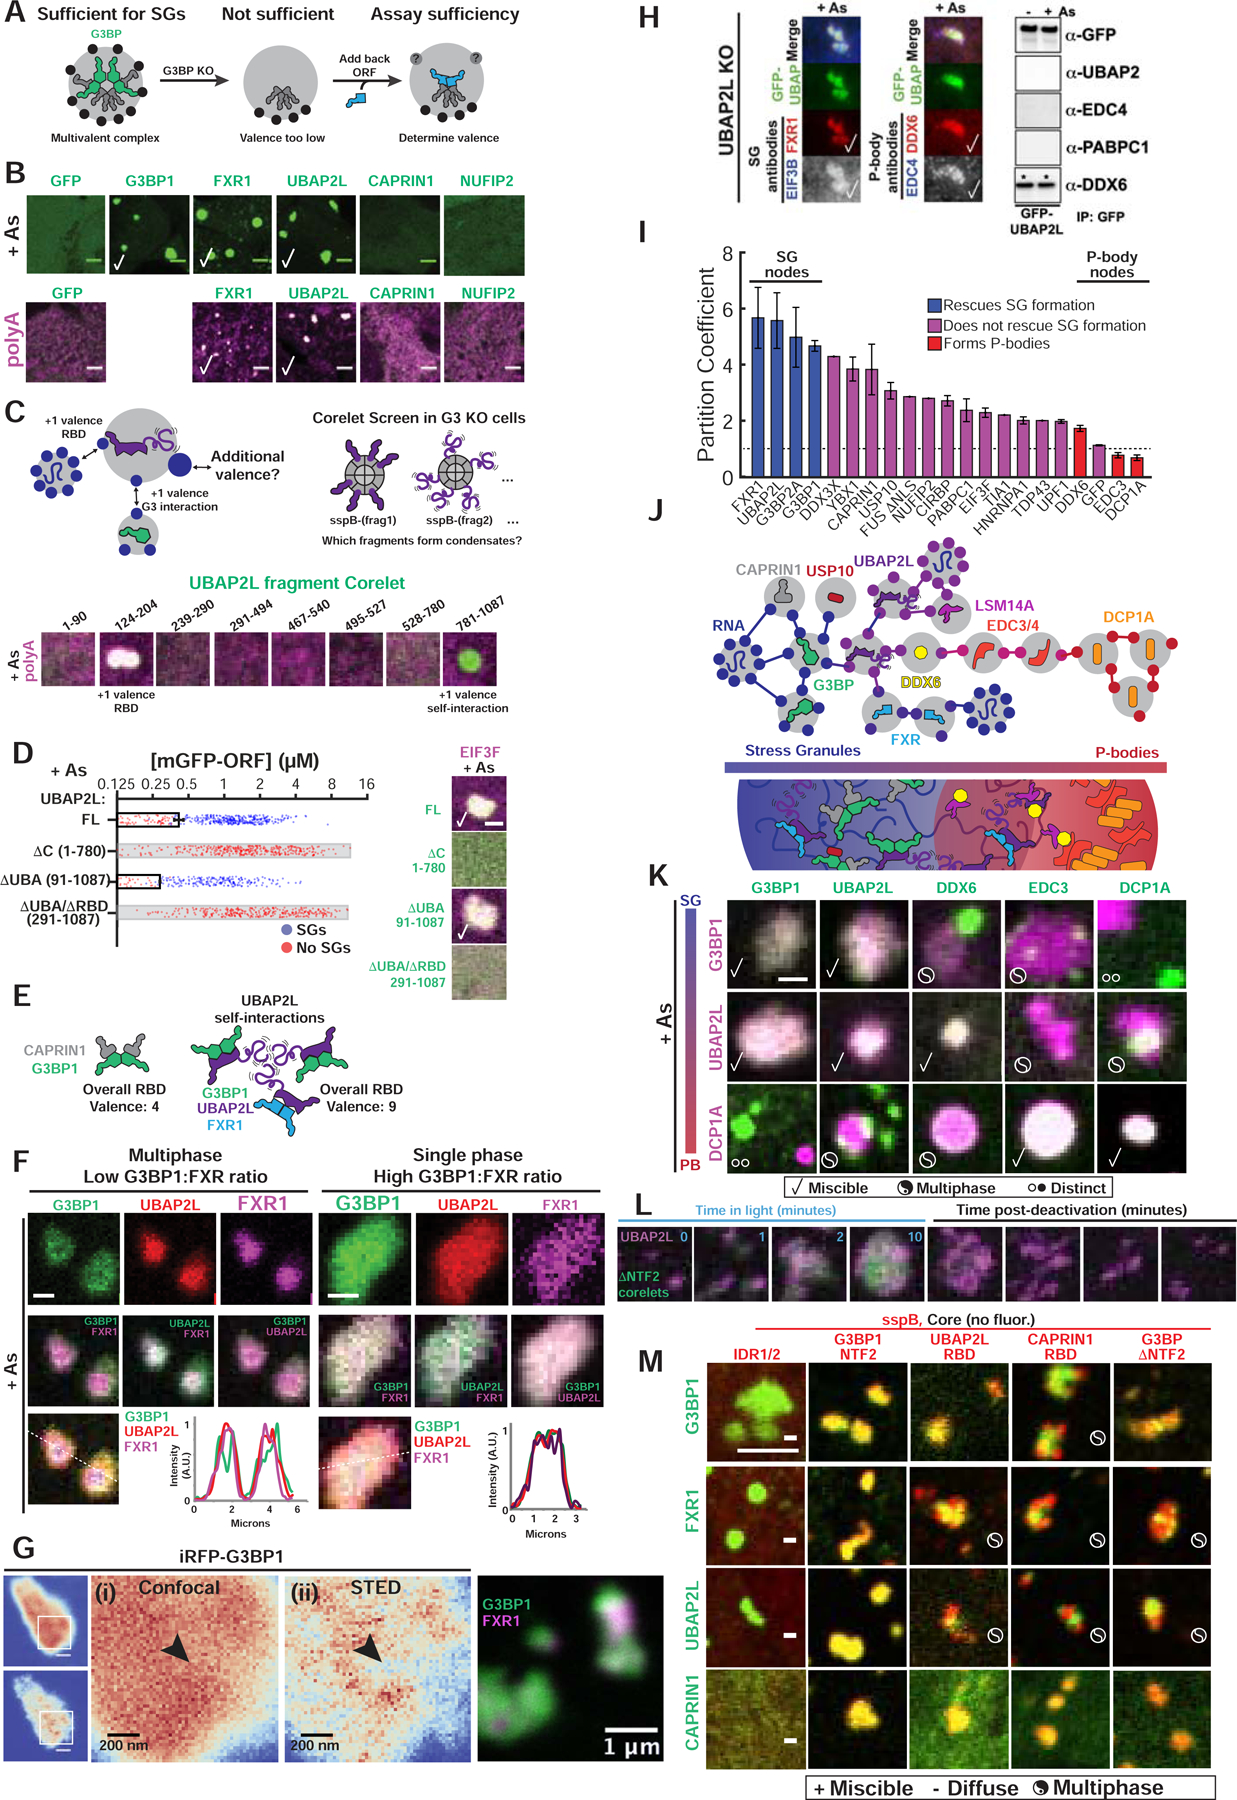
(A) SG proteins compensate for G3BP if acting as v>2 nodes.
(B) Expression (~0.4 μM) of GFP-tagged proteins in G3BP KO cells (+As, oligo-dT RNA FISH). Checks = polyA+ SGs. Scale bar, 3 μm, unless noted.
(C) Corelet screen in G3BP KO cells (+As) to uncover additional valence. Oligo-dT RNA FISH, 10-min activation, fixed. Arrowhead: condensates lack polyA+ mRNA.
(D) G3BP KO cells (+As) expressing GFP-UBAP2LΔs and EIF3F-mCh scored for SGs. Mean and SEM: n=4 experiments (>4 images per). Images: check = SGs, scale bar = 1 μm.
(E) SG formation requires sufficiently high vRBD complexes, which can be achieved partly via self-associating UBAP2L IDRs (purple tails) in different complexes.
(F) Triple co-expression (GFP-G3BP1, mCh-UBAP2L, iRFP-FXR1) in G3BP KO cells (+As). Line traces for single granules shown. Scale bar, 1 μm.
(G) Super-resolution STED of live G3BP KO cells (+As) with <2 μM of either iRFP-G3BP (left) or GFP-G3BP1 and iRFP-FXR1 (right). Arrowhead: G3BP-depleted regions in SGs.
(H) Left: Immunofluorescence of UBAP2L KO cells (+As) with GFP-UBAP2L. Check =co-localization. Right: IP of GFP-UBAP2L (G3BP KO cells +/− As) to detect high-affinity interactions (*).
(I) SG partition coefficients of GFP-tagged proteins in WT cells (+As) with mCh-CAPRIN1. Mean and SEM: n=3 experiments (n>4 images per).
(J) Schematic of how protein interaction network may inform molecular mechanism of multi-phase SG/PBs.
(K) G3BP KO cells (+As) expressing mCh- and GFP-tagged proteins (left to right by network distance from G3BP) pairwise (<2 μM). Legend below. Scale bar, 1 μm.
(L) G3BP KO cells with G3BPΔNTF2 Corelets (green) and UBAP2L-iRFP (<1 μM) were As-treated (1-hour) then activated and deactivated.
(M) G3BP KO cells (+As) expressing panel of Corelets (red; untagged core) and GFP-tagged proteins (green, ~2–3 μM); fixed post-activation (10-min). Scale bar, 3 μm.
Competition between protein-protein interaction nodes encodes multiphase condensation
Consistent with previous studies (Cirillo et al., 2020; Jain et al., 2016; Niewidok et al., 2018), super-resolution live cell microscopy revealed the presence of micro-phases (“cores”) within SGs (Figure 6G), which could provide insight into the rules governing phase miscibility. Since high-affinity UBAP2L complexes containing both FXR1 and G3BP are undetectable (Figure 2D), we hypothesized that the two dimeric nodes compete for available UBAP2L, with their relative stoichiometry critical for the observed mixed distribution in SGs by conventional confocal microscopy. Indeed, unlike UBAP2L, high ratios of FXR1 to G3BP cause demixing within SGs, as detected by G3BP-enriched and –depleted regions in individual granules (Figures 6F; S7A–C).
We reasoned that node stoichiometry similarly impacts SG/PB coexistence. In agreement with this, overexpression of UBAP2L in G3BP KO cells causes the formation of condensates that are not canonical stress granules or P-bodies, containing common markers of both (Figures 6H; S6A–C, H–J). The collapse of many SG and PB components into a single miscible phase may result from UBAP2L’s high-affinity interaction with the essential PB node, DDX6 (Figure 6H), which forms complexes with many PB proteins (Ayache et al., 2015; Brandmann et al., 2018; Kamenska et al., 2016; Ohn et al., 2008; Ozgur et al., 2015; Youn et al., 2018). Intriguingly, DDX6 is weakly recruited to SGs in WT cells, whereas other P-body proteins (EDC3 and DCP1A) are repelled (Figure 6I). Remarkably, relative network distance between upregulated nodes correlates with resulting condensate miscibility (Figure 6J): in contrast to neighboring nodes that favor a single miscible phase (e.g. G3BP/UBAP2L; EDC3/DCP1A), simultaneous overexpression of distant nodes (e.g. G3BP/DCP1A) decouples SGs from PBs (Figures 6K; S7D). This SG/PB dewetting would reflect an increased interfacial tension between the two phases (Feric et al., 2016; Zarzar et al., 2015), which may arise from a decreased relative amount of shared substrate.
Finally, we asked whether competition between nodes with shared preference for the SG RNP network, but unfavorable protein-protein interactions (PPIs), is sufficient for multiphase coexistence. Underscoring the importance of PPIs, co-expression of G3BP NTF2 Corelets (Figure 2B) and NTF2-associated full-length (FL) SG nodes universally results in a single miscible phase (Figure 6M). In contrast, G3BP RBD (lacking the UBAP2L-binding NTF2 domain) opto-SGs are immiscible with FL UBAP2L granules, forming on their surface and pulling them into close proximity as the multiphase granule grows; upon deactivation, opto-SGs dissolve and attached UBAP2L condensates disperse (Figures 6L). Multiphase coexistence is also observed in a panel of RBD Corelets expressed with their FL node counterparts (Figures 6M; S7E); note in particular how FL UBAP2L forms clear multiphase condensates with all RBD Corelets, likely as a consequence of its additional PPI connectivity to the P-body network (Figure 6H). Multiphase coexistence is less apparent for RBD Corelets expressed with FL G3BP, with the exception of CAPRIN1, which results in conspicuous, multiphase SGs (Figure 6M). Since all opto-SGs are compositionally identical in G3BP KO cells (Figures 4; 5), this result implies that RBD-RNA specificity plays a modulatory role in encoding multiphase coexistence, perhaps by clustering specific RNA sequences with different preferred interactions (Boeynaems et al., 2019; Courel et al., 2019; Fei et al., 2017; Feric et al., 2016; Hubstenberger et al., 2017; Langdon et al., 2018; Moon et al., 2019).
A minimal model of PPI network phase behavior demonstrates tunable multiphase coexistence
Given that many of our experimental findings can be interpreted using valence concepts from the study of patchy colloids, we sought to develop a formal theoretical framework to demonstrate the thermodynamic consistency of our interpretation of the data (Figure 7). Building on prior studies of patchy colloids (Bianchi et al., 2006; Jacobs et al., 2014), and inspired by the endogenous network depicted in Figure 6J, we specified a reduced set of protein complexes with monovalent binding sites, which are allowed to interact according to a prescribed PPI network. We then calculated the conditions for phase coexistence assuming that all interactions have equal affinities (see Supplemental Quantification and Statistical Analysis). Despite the simplicity of this approach, our minimal model reproduces the key features of tunable multiphase behavior observed in our experiments, including coexisting substrate-dependent and - independent phases (Figure 7A). Eliminating the interactions between two halves of the network by introducing a saturating cap protein (Figure 7B) alters the compositions of the phases and increases the interfacial free-energy barrier between the condensed phases, which tends to suppress wetting (Feric et al., 2016; Zarzar et al., 2015). Reducing the valence of the substrate-binding node by capping the self-interaction sites (Figure 7C) destabilizes the substrate-containing phase. Similarly, removing the substrate inhibits phase separation of the substrate-binding node (Figure 7D). Thus, a minimal patchy colloids framework is sufficient to describe how tuning the interactions of shared components can contribute to coexisting or disconnected networks in a multiphase system.
Figure 7. A minimal model of PPI network phase behavior demonstrates tunable multiphase coexistence.
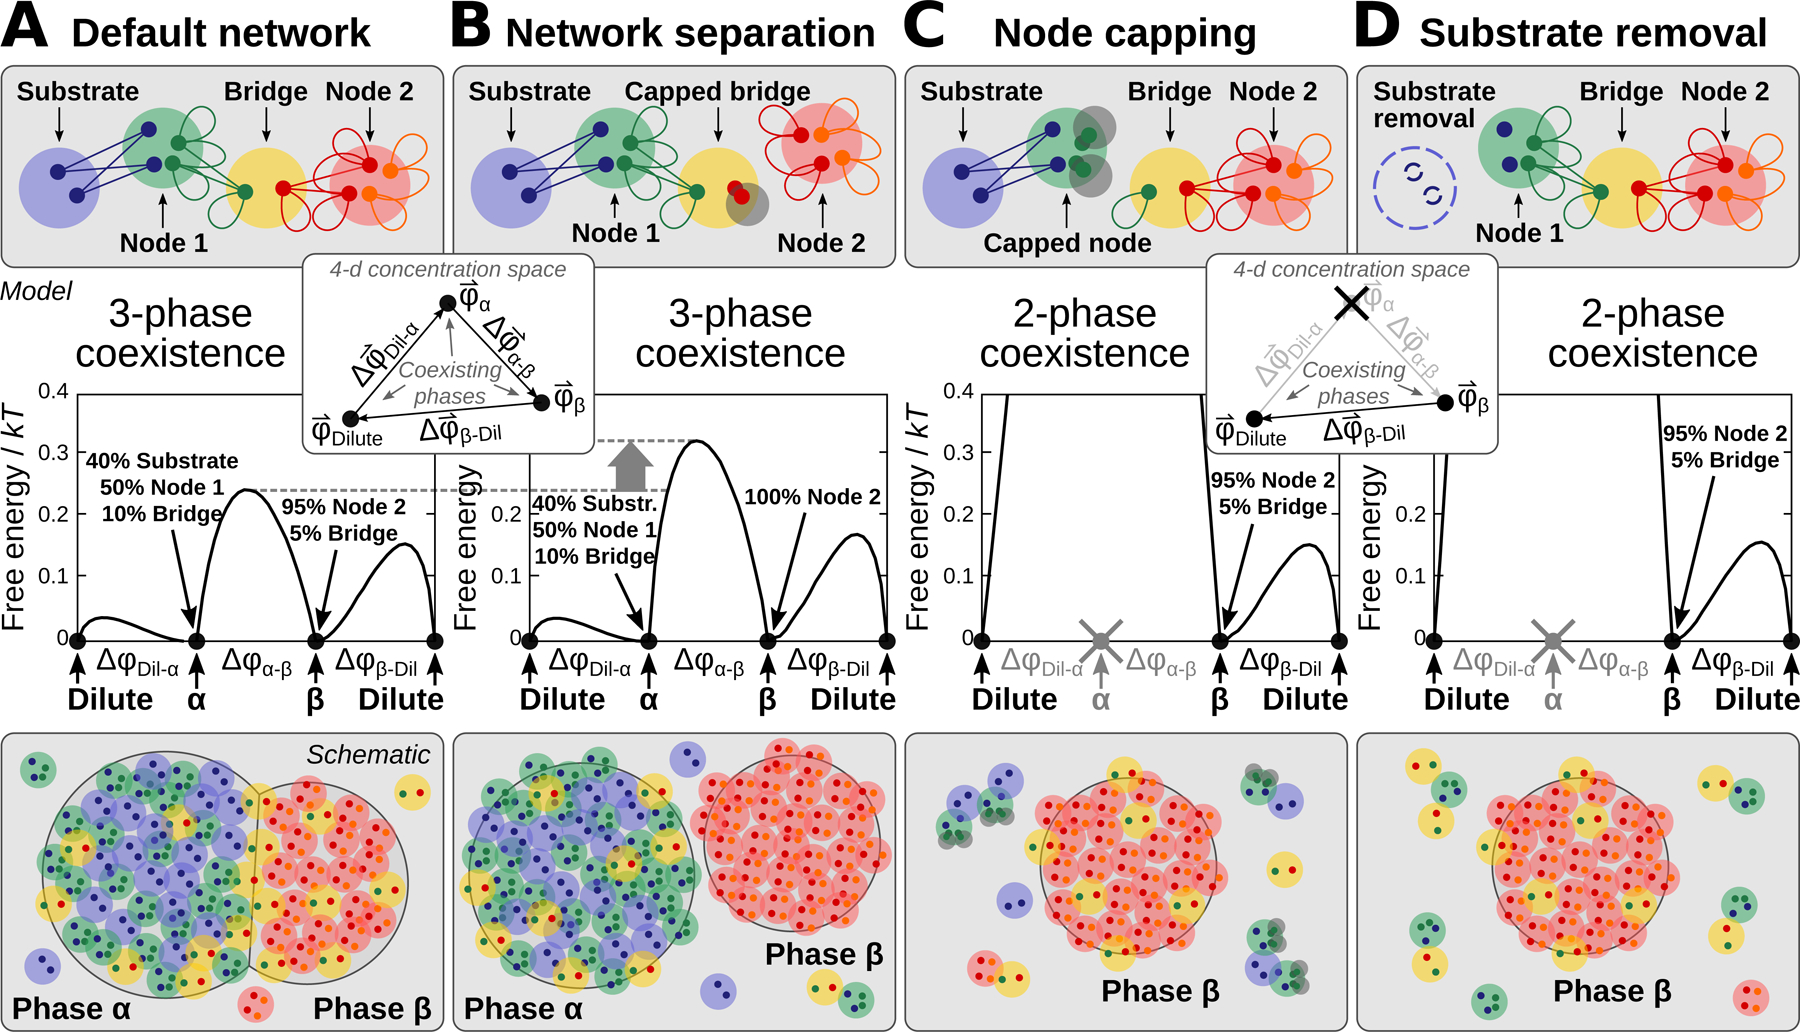
(A) A minimal network model, consisting of a substrate-binding complex, a bridge complex, and a high-valence self-interacting complex. Top: Large circles represent a single protein, protein complex, or substrate unit; small circles indicate monovalent interaction sites; and lines indicate equal-affinity protein-protein or protein-substrate interactions. Middle: Free-energy landscape calculated at phase coexistence. The coordinate indicates the distance between a pair of phases, whose compositions are path . The vertical axis reports the free-energy density in thermal units. Inset: Depiction of the three coexisting phases with concentration vectors in a 4-dimensional concentration space. Bottom: A cartoon of wetted droplets with a shared component.
(B) Disruption of the Bridge-Node 2 interactions, e.g. via saturation with “cap” proteins, separates the network. The compositions of the α and β phases shift and the α-β interfacial free-energy barrier height increases, which tends to disfavor wetting of the two phases.
(C) Inhibition of the Node 1 self-interactions, e.g. via capping, destabilizes the α phase.
(D) Removal of the substrate also destabilizes the α phase.
Discussion
Cells feature a rich diversity of membraneless condensates, each of which embodies numerous components and coexists with distinct liquid-like compartments (“multiphases”) (Banani et al., 2017; Mao et al., 2011; Nizami et al., 2010; Shin and Brangwynne, 2017). This spatiotemporally dynamic intracellular emulsion reflects the self-assembly output from complex networks of biomolecular interactions. What mechanism might account for multiphase patterning and how is molecular specificity of each condensate encoded? In this work, we have combined biochemical and quantitative intracellular reconstitution approaches with concepts from patchy colloids to introduce a biophysical framework whereby competing RNA-protein networks control multiphase condensation (Figure 7).
In the examined prototype, cytoplasmic stress granules (SGs) with attached P-bodies (PBs), G3BP is of critical importance (Bley et al., 2015; Kedersha et al., 2016; Matsuki et al., 2013). Similar to many proteins essential to forming intracellular condensates (e.g. NPM1, nucleolus) (Mitrea and Kriwacki, 2016), G3BP features a modular domain architecture with dimerization and RNA-binding domains (RBDs), connected by intrinsically disordered regions (IDRs) (Tourrière et al., 2003) (Figure 1A,B). Notwithstanding tremendous attention focused on self-associating IDRs in liquid-liquid phase separation (LLPS) (Elbaum-Garfinkle et al., 2015; Kato et al., 2012; Lin et al., 2015; Molliex et al., 2015; Nott et al., 2015; Patel et al., 2015; Wang et al., 2018), studies have shown that both oligomerization domains (ODs) and RBDs have essential roles in condensate formation (Feric et al., 2016; Mitrea et al., 2016), including in the case of G3BP-dependent SGs (Bley et al., 2015; Kedersha et al., 2016; Matsuki et al., 2013). Nevertheless, a mechanistic understanding of the contributions of oligomerization, disorder, and RNA-binding to multiphase condensation has remained elusive.
Our findings reveal that despite the common assertion that weakly self-associating IDRs are critically important for LLPS, G3BP’s IDRs are dispensable for its role in SG assembly (Figure 1), and one should be wary of equating their mere presence with physiological condensation (Riback et al., 2017). Instead, along with two accompanying papers from the Alberti and Taylor labs (Alberti, 2019; Taylor, 2019), we uncover a modulatory role for IDRs in tuning the RNA-binding capacity of the associated protein complex and its ability to induce RNP condensation. In the case of G3BP, juxtaposition of its RBD and acidic region (IDR1) prevents RNA engagement and SG assembly. Since similar acidic tracts are found in many SG (e.g. CAPRIN1, FMR1) and nucleolar (e.g. UBTF, NPM1) proteins, such electrostatic-based tuning of RNA-binding affinity may be broadly utilized, and phosphorylation/dephosphorylation of residues near RBDs might toggle RNA-protein interactions (Kim et al., 2019). More in line with recent work (Ruff et al., 2019), we identify a self-associating IDR in UBAP2L that is critical for SG formation. By conferring the ability to weakly interconnect multiple UBAP2L/G3BP and FXR1/UBAP2L complexes, this tyrosine-rich region likely acts as an essential RBD valence multiplier (Figure 6C–E).
Several studies suggest that dimerization of substrate-binding domains might be sufficient for assembly of certain condensates (Larson et al., 2017; Strom et al., 2017). However, our work highlights the contribution of higher degrees of substrate-binding valence, v, and illustrates the importance of careful consideration of ectopic protein expression levels relative to endogenous values in intracellular studies of condensate assembly. Although our experiments are consistent with the assertion that G3BP primarily exists in stress-independent homodimers (Alberti, 2019; Panas et al., 2015; Schulte et al., 2016; Taylor, 2019), synthetic RNA-binding dimers are unable to compensate for full-length G3BP at physiological concentrations (Figure 1L). Rather, G3BP’s dimerization domain (NTF2) must serve as a valence-amplifying interaction platform, recruiting RBD-containing bridges (e.g. CAPRIN1) and secondary nodes (e.g. UBAP2L), the latter of which is also critical for SG assembly (Figure 2). We confirmed the essentiality of such interconnected RBD complexes using an engineered system (Corelets) (Bracha et al., 2018), showing that high valence G3BP RBD oligomers (nodes) are dramatically more potent than dimers (bridges) at rescuing stress granule defects in G3BP knockout cells (Figure 4). Importantly, multivalent RBDs of NTF2-associated RNA-binding proteins (RBPs) (Figure 5) are similarly competent to form PB-studded stress granules, a shared preference for the SG RNP network that allows multicomponent G3BP complexes to induce condensation at physiological protein concentrations (Table S1). Such protein complexes (Figures 2; 6), organized via weakly connected oligomeric nodes, provide sufficient RNA-binding contacts to rapidly condense RNPs into stress granules following polysome disassembly (“RNA influx”).
Similarly built interconnected nodes appear to underlie the formation of diverse condensates (Figure 1A), suggesting that such wiring may confer a common evolutionary advantage. Importantly, G3BP’s protein-protein interaction (PPI) network is conserved in simple metazoans such as Drosophila (Baumgartner et al., 2013). Our data suggests a possible rationale for such node-node connectivity (e.g. G3BP-UBAP2L via NTF2), in affording switch-like control of LLPS by ligands (Choi et al., 2019), a mechanism we refer to as “valence capping”. NTF2-binding partners (e.g. USP10) that lack RBDs effectively turn G3BP complexes from v≥3 nodes into v=2 bridges, thereby lacking the requisite RNA-binding contacts to condense the SG network (Figure 3). This physical model likely represents a broadly applicable framework for understanding how organisms exert spatiotemporal control over phase separation, for example during tissue patterning (Brangwynne et al., 2009; Gammons and Bienz, 2018; Saha et al., 2016; Wu and Fuxreiter, 2016) and condensate spacing (Spencer et al., 2017; Zhang et al., 2018). We speculate that concentrations and composite interaction strengths of interconnected caps, bridges, and nodes have been finely tuned to allow context-dependent “phase switches”. In the case of stress granules, such a switch is hijacked by diverse viruses to ensure their survival (Panas et al., 2014; 2015; Schulte et al., 2016), which likely reflects a physiological utility (e.g. USP10) (Kedersha et al., 2016; Panas et al., 2015).
Considering the overlap between P-body and stress granule PPI networks (Figure 6J) (Youn et al., 2018), another possible evolutionary basis for interconnected nodes is that valence-capping—or ligand-based competition for a node’s PPI interfaces more generally—provides a facile way to control directional substrate (e.g. RNA) processing (Kim et al., 2019; Riback et al., 2019). Indeed, we show that subtle manipulation of node stoichiometry causes restructuring of multiphase organization (Figure 6), supporting a biophysical framework in which the relative overlap between networks of interactions (protein-protein, protein-RNA) defines phase immiscibility (or coexistence) and relative RNP partitioning (Figure 7). De novo multiphase SGs can result from competition for substrate between a synthetic RBD node and its full-length counterpart in an endogenous complex (Figure 6L,M). Further, shifting the stoichiometry of highly interconnected nodes is sufficient to encode compositionally distinct hybrid condensates (Figure 6H,K), hypertrophied examples of endogenous multiphase SGs (Figures 6F,G), or even decoupled SG/PBs (Figure 6K). Thus, competing nodes appear to promote a composition-dependent “tug-of-war” between PPIs and protein-RNA interactions, the outcome of which determines condensate specificity and association (Figure 7). The possibility for even relatively non-overlapping networks to become miscible by shifting the stoichiometric balance highlights the richness of the high-dimensional phase diagrams underlying multiphase condensation (Jacobs and Frenkel, 2017; Mao et al., 2019).
Our results illustrate that, rather than a binary classification scheme for a given multiphase (e.g. stress granule vs. P-body), a spectrum of condensates, each with their own biomolecular composition, is the inevitable consequence of distinct cellular states. Future studies will integrate new experimental findings regarding the caps, nodes, and bridges that define the network connectivity within a given set of condensates, together with theoretical approaches that consider more complex networks of particle-based interactions. In addition to having major implications for substrate processing and organismal development, these efforts will be important for understanding how condensates are manipulated by pathogens to ensure their survival (McInerney, 2015) or pathologies to drive cell death (Freibaum and Taylor, 2017). We envision that such network-based approaches based on soft matter physics will inform the identification of nodes most amenable to therapeutic targeting, and thus inspire new treatment strategies for devastating human diseases.
STAR METHODS
LEAD CONTACT AND MATERIALS AVAILABILITY
Further information and requests for resources and reagents should be directed to and will be fulfilled by the lead contact, Clifford P. Brangwynne (cbrangwy@princeton.edu). All reagents generated in this study will be made available on request, but we may require a payment and/or a completed Materials Transfer Agreement if there is potential for commercial application.
EXPERIMENTAL MODEL AND SUBJECT DETAILS
Cells were cultured in DMEM (GIBCO) with 10% FBS (Atlanta Biological), supplemented with 1% streptomycin and penicillin, and kept in a humidified incubator at 37°C with 5% CO2. All cell lines tested mycoplasma-negative. HEK293 and HEK293T (immortalized human female kidney-derived cells) were kind gifts from Marc Diamond lab (UT Southwestern). HeLa (immortalized human female cervical cancer-derived cells) were obtained from ATCC. U2OS cells (human female osteosarcoma cells) and U2OS G3BP1/2 (“G3BP”) knockout (KO) cells were previously described (Kedersha et al., 2016). G3BP KO cells were extensively characterized in the cited paper, and multiple independent labs have validated resistance to arsenite-dependent stress granule formation (personal communications). G3BP KO was confirmed independently in by Western blot (Figure S1B). Details regarding additional described U2OS knockout cell lines are provided in Table S2. All cell lines are adherent to plastic/glass substrates and divide (double) every 24-hours, on average. “Confluency” refers to the state when cells completely cover the bottom of dish, and hence stop dividing. Thus, when methods state 1:8 dilution (“passage” into new dish), ~72-hours will be required to reach next confluency.
METHOD DETAILS
Plasmid construction
Unless indicated (e.g. pHR lentiviral vector, SFFV promoter), all lentiviral DNA plasmids were generated using the FM5 lentiviral vector (kind gift from Marc Diamond lab, UT Southwestern), which features the Ubiquitin C promoter. DNA fragments encoding our proteins of interest were amplified by PCR with Phusion® High-Fidelity DNA Polymerase (NEB). Oligonucleotides used for PCR were synthesized by IDT. In-Fusion HD cloning kit (Takara) was used to insert the PCR amplified fragments into the desired linearized vector, which featured standardized linkers and overlaps to allow cloning in high throughput. Plasmid inserts were confirmed by GENEWIZ Sanger sequencing, reading from both ends of the insert. For all sspB-mCherry-tagged DNA constructs, correct sequencing was confirmed a second time by an independent researcher. Stress granule (SG) rescue defects associated with the G3BP S38F mutant were confirmed using two different fully sequenced DNA constructs (FM5-mGFP-G3BP1 S38F and pcDNA4 t/o-GFP-G3BP1 S38F) tested by two separate labs.
Generation of lentivirus and lentiviral transduction.
All live cell imaging experiments were performed using cells stably transduced with lentivirus, with the exception of light-induced sspB-/iLID-ΔNTF2 dimer-mediated rescue of G3BP knockout (Figure S1J; see Transient transfection). Lentiviruses containing desired constructs were produced using a previously optimized protocol (Sanders et al., 2014) by transfecting the plasmid along with helper plasmids VSVG and PSP (kind gift from Marc Diamond lab, UT Southwestern) into HEK293T cells with Lipofectamine™ 3000 (Invitrogen). Virus was collected 2–3 days after transfection and used to infect WT U2OS or G3BP KO U2OS cells. Lentivirus transduction was performed in 96-well plates. Three days following lentivirus application to cells at low confluency, cells were passaged for stable maintenance or directly to 96-well fibronectin-coated glass bottom dishes for live cell microscopy. For non-Corelet experiments, stable cell lines were passaged at least 3-times over 8+ days prior to use in live cell imaging experiments to eliminate cells expressing lethal levels of the fusion protein of interest. In all experiments, 90%+ of cells featured expression of the protein of interest at a range of concentrations (typically <5 μM; estimated concentrations are noted as relevant in the figure legends). This specific protocol was designed to avoid artifact-prone concentrations of fusion proteins that can occur with lipid-based transient transfection, which has previously been shown to induce interferon signaling and stress granule formation (e.g. GFP transfection of WT U2OS cells can lead to stress granules in ~20% of cells) (Guo et al., 2019; Hagen et al., 2015; Panas et al., 2019; Tourrière et al., 2003).
Transient transfection
Unlike all other experiments (see above), light-induced (sspB/iLID) ΔNTF2 dimer-mediated rescue of G3BP knockout was performed using transient transfection (Figure S1J). Initial attempts to rescue defects (data not shown) using lentivirus mediated stable expression were not successful due to inability to reach sufficiently high concentrations of the individual fusion proteins (i.e. >8 μM of both mCherry-sspB-G3BP1ΔNTF2 and mGFP-iLID-G3BP1ΔNTF2). See Figure 1L for constitutive dimer mGFP-FKBP-G3BPΔNTF2, data collected using stable, lentivirus-mediated expression. Thus, individual wells of a 96-well plate containing G3BP1/2 KO U2OS cells were transfected with both mCherry-sspB-G3BP1ΔNTF2 and mGFP-iLID-G3BP1ΔNTF2 using Lipofectamine™ 3000 (Invitrogen) according to manufacturer’s recommendations. 18-hours later, cells were observed to feature both fusion proteins diffusely expressed throughout the cytoplasm. Arsenite was added to a final concentration of 400 μM. 1-hour later, cells were imaged. Three biological replicates were performed. In rare cells with very high concentrations of both components (>10 μM of each) (Figure S1J), stress granules were observed, regardless of time of blue light activation. The light-independent nature of dimer-based rescue at these concentrations is consistent with the measured in vitro dark state Kd of 4.3 μM for iLID-sspB (Guntas et al., 2015). At such concentrations, iLID and sspB are expected to interact strongly in the dark. The in vitro light state Kd for iLID-sspB of 0.2 μM for iLID-sspB (or ~10 nM for “core” measurements, see Phase diagram data collection), which sets the lower limit for the assay.
Microinjections into live U2OS cells
Microinjections were performed using an Eppendorf Femtojet microinjector mounted on an Axiovert 200M Widefield at 60x magnification. Microneedles were pulled from borosilicate glass with O.D. 1 mm and I.D. 0.78 mm using Sutter Instrument Model P-97. U2OS WT cells stably expressing GFP-CAPRIN1 (~1–2 μM) were plated on 35 mm glass bottom dishes (MatTek) in DMEM (GIBCO) with 10% FBS (Atlanta Biological), supplemented with 1% streptomycin and penicillin, and kept in a humidified incubator at 37°C and 5% CO2. Prior to injection, media was replaced with fresh media supplemented with 10 mM HEPES to buffer against pH changes during CO2-free microinjection (Maharana et al., 2018). DNase (TURBO from Thermo Fisher, 2 U/μL), RNase (Cocktail Enzyme Mix from Thermo Fisher featuring RNase A: 0.5 U/μL, RNase T1: 20 U/μL), or buffer control were diluted 1:8 in TAMRA dye/PBS and injected directly into the cytoplasm with a pressure of 30 hPa for as short a time as possible. For each trial, approximately 100–150 cells were individually injected. Media was exchanged for fresh media containing 400 μM arsenite to induce polysome disassembly (“RNA influx”). 45–60 minutes later, cells were imaged with a Nikon A1 laser scanning microscope. Fields of view with TAMRA-positive cells were identified using the 546 laser-line in the absence of 488 to avoid potential bias with respect to cell selection. Upon finding cells, images were taken with both 488 and 546 laser lines and cells were scored for presence or lack of stress granules, measuring the TAMRA fluorescence in the cytoplasm (arbitrary units).
Live cell confocal microscopy
Cells were imaged on fibronectin-coated 96-well glass bottom dishes (Cellvis). Confocal images were taken on a Nikon A1 laser scanning confocal microscope using a 60x oil immersion lens with a numerical aperture of 1.4. The microscope stage was equipped with a humidified incubator to keep cells at 37°C and 5% CO2. Proteins tagged with mCherry, mGFP (“GFP”), EYFP, and miRFP670 (“iRFP”) were imaged with 560, 488, 488, and 640 nm lasers, respectively. All experiments and image acquisitions were performed on living cells to avoid potential artifacts due to fixation, with three exceptions: (A) RNA-FISH experiments; (B) immunofluorescence studies; (C) Corelet/GFP co-localization analysis. No measurements of protein concentration were performed in fixed cells, as fluorescence intensity of proteins in specific cellular compartments were differentially affected by paraformaldehyde fixation. The above details apply to all imaging data in the manuscript with the exception of STED super-resolution (Figure 6G) and widefield microscopy (Figures 6H; S6H) images. See below for details.
Stimulated emission depletion (STED) super-resolution microscopy
For images shown in Figure 6G, G3BP KO cells stably expressing either iRFP-G3BP1 or mGFP-G3BP1 and iRFP-FXR1—in all cases at ~1–2 μM—were treated with 400 μM arsenite (1-hour, humidified incubator) then imaged on an Abberior Instruments expert line STED laser scanning confocal microscope at 37°C. For single channel STED images, sequential image sets (each line imaged concurrently with and without the STED laser to control for bleaching artifacts) were taken with increasing STED power using the ‘Custom Axis’ options available in Imspector. For dual channel STED images, two sequential image sets were taken with each line imaging mGFP (+/− STED) and miRFP (+/− STED) with the first mGFP STED power set to 0% to avoid miRFP image bleaching, which occurred during the second image (again using the ‘custom axis’ option available in Imspector).
Widefield microscopy
For images displayed in Figure 6H and Figure S6H, G3BP KO or UBAP2L KO U2OS cells stably expressing GFP-UBAP2L were grown on glass coverslips, stressed with 400 μM arsenite when indicated, and fixed using 4% paraformaldehyde in PBS for 15-minutes, followed by 5-minutes post-fixation/permeabilization in ice cold methanol. Cells were blocked in 5% horse serum/PBS, and primary and secondary antibody incubations were performed in blocking buffer for 1-hour with rocking. Following washes with PBS, cells were mounted in polyvinyl mounting media and imaged. Images were captured using a Nikon Eclipse E800 microscope with a 63x Plan Apo objective lens (NA 1.4) and illuminated with a mercury lamp and standard filters for DAPI (UV-2A 360/40; 420/LP), Cy2 (FITC HQ 480/40; 535/50), Cy3 (Cy 3HQ 545/30; 610/75), and Cy5 (Cy 5 HQ 620/60; 700/75). Images were captured using a SPOT Pursuit Digital Camera (Diagnostics Instruments) with the manufacturer’s software, and raw TIF files were imported into Adobe Photoshop CS3. Identical adjustments in brightness and contrast were applied to all images in a given experiment.
Corelet activation
Pre-activation and post-activation images of G3BP KO cells stably expressing the indicated fusion proteins were captured with the mCherry (560) channel only to visualize the sspB component without triggering light-induced dimerization with the iLID-mGFP-tagged Ferritin core. Cells were activated with a 488-laser using 1% laser power to cause dimerization of iLID and sspB (Guntas et al., 2015). Activation of cells was achieved by imaging the mCherry and mGFP channels simultaneously using a 6-second frame interval for an area of 120×120 μm2 (1024×1024 pixels) at Nyquist zoom. See also Phase diagram data collection.
Fluorescence recovery after photobleaching (FRAP)
G3BP KO cells stably expressing indicated fusion proteins were first globally activated to trigger iLID-sspB dimerization by continuously exposing them with the 488 laser for 5-minutes. Light-activated condensates were then bleached in a ~1 μm2 region with the 560 laser at high power to quench the majority of the mCherry-sspB component of the condensate. Fluorescence recovery was monitored while imaging both mCherry and mGFP channels at a frame interval of 6-seconds. Fluorescence was standardized based on a non-bleached droplet in the same cell to control for FRAP-independent bleaching. Fluorescence intensity was compared to the initial image for generating plots.
Cell treatment with arsenite to dissociate polysomes
Cells were “stressed” by adding sodium arsenite (referred to as “As” throughout text) to cell media at a concentration of 400 μM, which is in excess of saturating concentrations for maximal polysome disassembly (Kedersha et al., 2016). Images were captured between 50-minutes and 2-hours (typically 1-hour) after arsenite treatment, unless performing activation-deactivation (light-dark) cycling experiments (see below). No differences were observed with respect to rescue of SG defects, phase threshold shift, SG inhibition, etc. between 60- and 120-minutes. SG number/size typically peaked by 45-minutes, and 1- to 2-hour time window was chosen, so that drug reached maximal effect (i.e. maximum amount of exposed RNA available in the cytoplasm). Cells typically began to die ~6 hours following treatment; to avoid confounding toxicity/lethality effects, the indicated 1- to 2-hour time window was used.
Inhibition of polysome disassembly by pre-treatment with cycloheximide
Cycloheximide (blocks polysome disassembly) was added to G3BP KO cells expressing indicated fluorescent fusion proteins at a final concentration of 100 μg/mL. Following 30-minutes of incubation, arsenite was added (400 μM final concentration). 1-hour later, cells were assessed for formation of stress granules (GFP-G3BP rescue experiments) or activation cycles were performed (Corelets).
Cell treatment with Actinomycin D to inhibit transcription
Actinomycin D (“ActD”; intercalates into DNA to prevent transcription) dissolved in DMSO was used to treat G3BP KO cells expressing indicated Corelets at a final concentration of 5 μg/mL. Images were taken 12–18 hours after Actinomycin D treatment, a time interval during which nucleoli were no longer visible by bright field microscopy, and the vast majority of mRNA was expected to be degraded. Final concentration of DMSO was 0.5%, which is well below toxic levels. For Actinomycin D plus arsenite experiments, arsenite was added to a final concentration of 400 μM ~12 hours following Actinomycin D treatment, and cells were imaged 1–2 hours post-arsenite. Qualitative observations suggested that the application of Actinomycin D at the indicated concentration was lethal following ~24–36 hours of treatment. The 12-hour time point was chosen to maximize the time since treatment (i.e. to reduce RNA in cells by as much as possible) without extensive lethality from the drug.
Phase diagram data collection
In order to determine precise phase threshold boundaries for intracellular phase diagrams, analyzed cells must feature high variability with respect to sspB-mCherry and iLID-mGFP concentrations, so as to sample sufficient core concentrations and valences. In order to achieve a broad concentration range for both components, G3BP KO cells were transduced in 96-well plates using an arrayed lentivirus approach. In this protocol, rows varied from 2 to 60 [2, 6, 20, 60] μL iLID-GFP-Fe lentivirus; columns, 2 to 60 [2, 6, 20, 60] μL mCherry-sspB-protein of interest (“POI”) (or POI-mCherry-sspB) lentivirus. G3BP KO cells were plated directly into the arrayed lentivirus to achieve ~25% confluency upon subsequent attachment to the plastic substrate. 72-hours later, at confluency, all 16-wells associated with an individual Corelet condition were washed with PBS, trypsinized, quenched with fresh media, and combined into a single test tube, thus ensuring a diverse population of cells with highly variable iLID to sspB ratios. Cells were plated at a 1:8 dilution factor onto fibronectin-coated, glass bottom 96-well plates (Cellvis) and imaged 48-hours later when at 60–90% confluency.
For all data collected toward generation of phase diagrams, a standardized imaging protocol was adopted to avoid confounding effects related to alterations in microscopy settings. Identical imaging settings were used relative to fluorescence correlation spectroscopy (FCS)-based calibrations (fluorescence to absolute concentration) (see Quantification and Statistical Analysis). Specifically, images were collected using 0.5 frames per second scan rate, 1024×1024 pixel frame (120×120 μm2), and 1.75x Nyquist zoom (63x oil immersion lens). Laser powers (1% 488 and 100% 546), intensities, and gains were kept constant. All time lapses (activation periods) were 5-minutes in length and featured 6-second intervals between frame acquisitions. Following the last frame, laser intensity was dropped for 4-additional frames followed by acquisition of 4-final images at higher relative laser intensity. This protocol was selected to achieve wide dynamic range (i.e. to achieve sufficient resolution of lower concentration cells, which feature lower signal to noise, and to avoid pixel saturation in cases of exceptionally bright dense phases).
Using this standardized protocol, each 5-minute acquisition was able to add (on average) 10-data points (i.e. cells) to a phase diagram. Thus, an average phase diagram reported in this study required collection of 20–30 fields or ~2–3 hours of data acquisition time. Typically, an individual phase diagram was compiled from data collected over the course of 3–5 experiments (i.e. different lentivirus transductions on different days). However, certain phase diagrams featured data from significantly more experiments (e.g. G3BP1ΔNTF2 Corelets, a condition used as a positive control for effects of drug treatments throughout studies, which ensured reliability of data). Throughout the duration of the study, there was no indication of systematic changes with respect to drug response, drug efficacy, measurement of fluorescence intensities, or phase diagram threshold shifts.
When selecting cells for analysis, only fully activated cells (entire cell within field of view) were considered to avoid potential artifacts related to local activation and diffusive capture (Bracha et al., 2018). The average mCherry and mGFP fluorescence intensity for a cell was determined using the first frame, prior to blue-light mediated dimerization of iLID on core to sspB-tagged protein of interest, and manual image segmentation of 4.5 × 4.5 μm square regions of interest (ROIs) in cytoplasmic regions featuring homogenous fluorescence (i.e. regions with low density of membrane-bound organelles like the juxtanuclear Golgi apparatus). The aforementioned FCS calibration curves were then used to determine the mCherry and mGFP concentrations. The mGFP concentration was divided by 24, the number of subunits per ferritin complex or “core”, to determine the core concentration. Valence was determined for an individual cell by dividing the mCherry concentration value by that of the core. Previously, we showed that this is a highly accurate measure based on the lever rule—in a “one-component” system (e.g. FUS IDR Corelets, which feature minimal endogenous proteins, nucleic acids; see Figure S2A), consistency in valence between initial, dilute, and condensed phases is reliably observed (Bracha et al., 2018). Binary decisions (yes or no) regarding Corelet-mediated phase separation in a cell of interest were determined manually. Datasets used for subsequent automated generation of phase diagrams and phase thresholds (see QUANTIFICATION AND STATISTICAL ANALYSIS) were coded and sent to a separate individual.
Cycling experiments following drug treatments
Cycling experiments were performed similarly to experiments describes in Phase diagram data collection with minor changes. After treatment of G3BP KO cells expressing indicated sspB/iLID Corelets with arsenite (or indicated drug), image acquisition was immediately commenced. For most experiments, a 5-minute activation (488 blue light) time lapse was acquired for each cycle, immediately followed by a 5-minute time lapse for deactivation (no 488 blue light). We have determined that this deactivation time far exceeds that which is required for complete reversibility (typically 30–60 seconds, see Figures 4B; S4A), of diverse Corelet condensates. Indicated cycling parameters were repeated 6–8 times. In certain experiments, instead, a 10-minute activation time lapse was immediately followed by a 5-minute time lapse for deactivation. This was repeated four times. Intervals were kept constant at 6-seconds in all cases. Representative cells/fields were chosen for data analysis based on standard core concentrations (~0.25 μM) and desired valence, which is indicated in figure legends for a given experiment.
G3BP rescue competition assay and stress granule inhibition experiments
For G3BP rescue competition experiments (Figure 3), an identical arrayed lentivirus approach was used as described in Phase diagram data collection (i.e. 2–60 μL G3BP1-mCherry and 2–60 μL mGFP-POI, arrayed 4-wells by 4-wells for 16-wells total of a 96-well plate). G3BP KO cells were plated into lentivirus, grown for 72-hours, then combined and passaged at 1:8 dilution factor. At the next confluency, cells were passaged to fibronectin-coated 96-well glass plates (Cellvis), and live cell confocal microscopy was performed on Day 8 post-transduction. For each condition (GFP-tagged POI), 4 separate experiments (each experiment = 1-well with arsenite treatment) were performed on three separate days with numerous technical replicates (fields of view or “images”). Live confocal imaging was performed 1–2 hours following arsenite treatment. Concentrations of mCherry and mGFP were determined similarly as for phase diagrams, and manual scoring of stress granule presence or absence was performed. Similar protocols were used to assess stress granule rescue thresholds in the absence of competition.
For stress granule inhibition experiments (Figure S1G; Figure S3B; etc.), WT U2OS cells stably expressing YBX1-mCherry (SG marker protein) were plated into 96-well plates at 25% confluency and transduced with 2–60 μL lentivirus of indicated mGFP-tagged protein (4-wells: 2, 6, 20, or 60 μL). Three days later, cells were washed, trypsinized, combined, and passaged at 1:8 dilution factor. Three days after this, confluent cells were passaged onto fibronectin-coated 96-well plates. Live cell confocal imaging was performed 2-days later (i.e. 8 days following lentivirus transduction) when cells were at 60–80% confluency. Images were taken between 1–2 hours after arsenite treatment. 3–4 independent experiments were performed for each condition on two separate days with numerous technical replicates (i.e. fields of view or “images”) per experiment. Concentrations of mGFP-tagged proteins were determined using FCS calibration curves, SG formation was assessed in a binary manner, and all data was coded then sent to a separate individual for quantitative analysis.
Stress granule partitioning
For stress granule partitioning experiments, WT U2OS cells stably expressing mGFP-CAPRIN1 (Figure 1I) or mCherry-CAPRIN1 (Figure 6I) were plated into 96-well plates at 25% confluency and transduced with either 30 μL of indicated mCherry-tagged lentivirus (Figure 1I) or mGFP-tagged lentivirus (Figure 6I). Three days later at confluemcy, cells were washed, trypsinized, and passaged at 1:8 dilution factor. Three days after this, cells were passaged onto fibronectin-coated 96-well glass plates (Cellvis). Live cell confocal imaging was performed 2-days later (i.e. 8 days following lentivirus transduction) when cells were at 60–80% confluency. Images were taken between 1–2 hours after arsenite treatment. Three independent experiments were performed for each condition.
Co-Localization Corelet studies
Followed similar protocol as “Phase diagram data collection” but performed two-lentivirus co-transduction (with sspB-mCh-POI and non-fluorescent iLID-Fe instead of typical GFP-tagged version) on G3BP KO cells stably expressing the indicated GFP-tagged protein. 72-hours after infection, cells were passaged at 1:8 dilution factor onto fibronectin-coated, glass bottom 96-well plates (Cellvis). 48-hours later, cells were treated with arsenite (400 μM). One hour later, removed plate from humidified incubator and placed on a blue LED light illuminator (Invitrogen SafeImager 2.0) for 10-minutes to activate Corelets. Immediately fixed with 4-percent PFA for 10 minutes. Washed twice with PBS and permeabilized with ice cold 70% methanol for 10 minutes. Washed an additional two times with PBS then placed at 4°C overnight. Performed fixed cell confocal microscopy the next day to examine co-localization of opto-SGs with indicated GFP-tagged proteins. Multiple replicates (images) were taken and representative examples are shown.
RNA fluorescence in situ histochemistry (RNA-FISH)
Indicated cells were fixed with 4-percent PFA for 10-minutes then washed twice with PBS and permeabilized with ice cold 70% ethanol. 96-well glass bottom plates (Cellvis) were placed at −4°C overnight. The next day, ethanol was replaced with Wash Buffer A (Stellaris) and incubated at room temperature for 5-minutes. Buffer A was then replaced with hybridization buffer (Stellaris) containing 5 μM 5’-Cy5-Oligo d(T)20 (Gene Link) (hybridizes to polyA tails of mRNA) and incubated in the dark for 16-hours to probe polyadenylated mRNA. Hybridization buffer was replaced with Wash Buffer A, placed at 37°C for 30-minutes, then replaced with Wash Buffer B, incubating at room temperature for another 5-minutes. Following three PBS washes, cells were imaged with Nikon A1 laser-scanning confocal microscope.
Western blot to assess G3BP1/2 levels and knockout
For Figure S1B, confluent human cell lines (U2OS WT, U2OS G3BP1/2 KO, HEK293, HeLa) from a 6-well plate were washed, trypsinized, quenched with media, harvested, and centrifuged at 500xg for 5-minutes. Cell pellets were washed with PBS and flash-frozen. Immediately prior to lysis, cells were thawed on ice and re-suspended in 150 μL 2x Nuage® LDS Sample Buffer/Reducing agent, sonicated, and boiled at 100°C for 5-minutes. 50 ng of the following recombinant proteins were loaded in lanes alongside cell lysates as positive controls: G3BP1 (Novus, NBP1-50925-50UG), G3BP2 (Novus, NBP1-78843-100UG). Samples were run on a NuPAGE® Novex 10% Bis-Tris Gel and transferred to PVDF Pre-Cut Blotting Membranes, as per manufacturer’s protocol. Membranes were blocked overnight at 4°C with rocking in 5% NFDM in TBST (5 mM Tris-HCl, pH 7.5, 15 mM NaCl, 1% Tween-20). Membranes were probed with the following primary antibodies in blocking solution overnight at 4°C with rocking: G3BP1 (Mouse monoclonal, AbCam ab86135, 1:300), G3BP2 (Rabbit polyclonal, AbCam ab86135, 1:5000), Beta actin (Rabbit polyclonal, AbCam ab8227, 1:10,000). The next day, membranes were washed multiple times and then incubated with the following secondary antibodies in blocking solution for 30-minutes at room temperature with rocking: Peroxidase-AffiniPure Goat Anti-Mouse IgG (H+L) (Jackson, 115-035-062, 1:10,000), Peroxidase-AffiniPure Goat Anti-Rabbit IgG (H+L) (Jackson, 115-035-144, 1:10,000). Subsequently, multiple washes were performed prior to developing the membrane using SuperSignal™ West Pico PLUS Chemiluminescent Substrate, as per manufacturer’s instructions.
Immunoprecipitation of high-affinity protein complexes from U2OS Cells
150 mm dishes of near-confluent cells were treated as indicated, washed with cold Hanks Basic Salt Solution, and scrape-harvested at 4°C into lysis buffer (20 mM Tris-HCl pH 7.4, 150 mM NaCl, 5 mM MgCl2, 1 mM DTT 0.5% NP-40, 10% glycerol) containing 1 mM DTT, protease inhibitors (Roche, EDTA free), HALT phosphatase inhibitors (Pierce), and 20 μg/nL RNase A. Cells were rotated for 30-minutes at 4°C, cleared by centrifugation (5000 rpm for 5-minutes), and supernatants removed then incubated with Chromotek-GFP-Trap® Beads (Allele Biotech) for 2-hours with continuous rotation at 4°C. Beads were washed 5-times, and either eluted directly into SDS-lysis buffer with RNase treatment, or extracted in RIPA buffer (50 mM TRIS, 150 mM NaCl, 1.0% NP40, 0.5% DOC, 0.05% SDS) for 1-hour at 4°C with rotation. Material released by RIPA buffer was recovered and precipitated with 60% acetone. Beads post-RIPA extraction contained bound material denoted “high-affinity”, which was released by heating in reducing SDS-PAGE lysis buffer. Proteins were resolved on 4–20% Mini-PROTEAN TGX Precast Gel (Bio-Rad), transferred to nitrocellulose membranes using the Transfer-Blot Turbo transfer system (Bio-Rad), and blotted using standard procedures as above. Chemiluminescence was detected using SuperSignal West Pico substrate (Thermo Scientific).
CRISPR-Cas9 generation of KO cell lines and validation
Please see Table S2 for information regarding generation of U2OS knockout cell lines. Each target sequence (see table) was purchased as paired DNA oligos (sense/anti-sense pairs) from IDT, annealed, and ligated into pCas-Guide (Origene), with the exception of UBAP2 (see below). Plasmid inserts were verified by sequencing, and transfected into cells with pDonor-D09 (Origene, encodes puromycin resistance). Following transfection, cells were subjected to a brief (24-hour) selection in puromycin (2 μg/mL) and allowed to recover for 2-days or longer before evaluation using the indicated antibodies and immunofluorescence. Cells were cloned by limiting dilution, and clones were verified using both immunostaining and western blotting.
For single KO lines, the parental cell line was U2OS expressing the Tet-repressor (Kedersha et al 2016). CAPRIN1 and USP10 were individually knocked out in the previously characterized double KO (G3BP1/2) cells (Kedersha et al 2016). To create the U2OSΔFXR1/FXR2/FMR1 (3KO) cell line, FXR2 was first KOed, clones were selected, and FXR2 protein expression was evaluated by immunofluorescence and Western blotting. “Clone 6” was then transfected with guide RNAs targeting FXR1 and FMR1. Clones were selected and screened in a similar manner and finally a triple-null line (3KO) was obtained. All loci were sequenced to confirm deletions in the DNA.
In the case of UBAP2/UBAP2L double KO (2KO), validated UBAP2L single-KO cells were plated into 200 μL of pCRISPRv2-UBAP2 gRNA (pooled, 6 gRNAs) or 200 μL of pCRISPRv2-NonTarget gRNA (Shalem et al., 2014) in 96-well plate. 72-hours later, confluent cells were washed, trypsinized and passaged into new wells containing 200 μL of the same lentivirus. Cells were passaged three times and examined for successful KO by immunofluorescence, validating with two antibodies against UBAP2, which indicated that ~30 percent of the cells featured very low or undetectable levels of UBAP2 (in NonTarget control, 100% of cells displayed UBAP2 staining). Cells were amplified by three successive 1:8 passages in 96-well plates over a 1-week period. Upon the third confluency in 96-well, cells were passaged at limiting dilution into three separate 96-well plates, so that each well featured ~50% chance of receiving a cell. 10 days later, colonies were apparent in ~20–30% of wells. For NonTarget control, six wells were harvested and passaged; candidate UBAP2/2L double-Kos (2KO), 50 separate lines. Following approximately two weeks of additional passage and growth, candidate KO lines (and NonTarget controls) were plated onto fibronectin-covered glass (96-well plate). 24-hours later, cells were at ~60–80% confluency. Cells were fixed with 4% PFA, permeabilized with ice-cold methanol for 5-minutes, and immunofluorescence was performed (anti-UBAP2, anti-G3BP1). In NonTarget controls (i.e. UBAP2L 1KO), most cells featured G3BP-positive stress granules but they were slightly smaller than control conditions (i.e. WT cells), a result that was validated across labs (data not shown). Four candidate UBAP2/2L double KO lines featured undetectable UBAP2 by immunofluorescence. In these examples, G3BP-positive SGs were only present in ~30% of cells and they were much smaller in size than in WT or UBAP2L single-KOs. Double knockout of UBAP2 and UBAP2L was confirmed in three lines and relative levels of G3BP1, G3BP2, USP10, and CAPRIN1 were assessed by Western blot.
Genotyping of Cas9 mutant cell lines
To identify Cas9-induced mutations of all KO cell lines in the coding sequence, genomic amplification was performed using nested primer sets surrounding the region targeted by the particular guide sequence. Genomic DNA PCR was done with Invitrogen’s AccuPrime GC-Rich DNA Polymerase (Buffer A). DNA was initially denatured at 95°C for 3-min, followed by denaturation at 95°C for 30-sec, annealing at 60°C for 30-sec, and extension at 72°C for 1-min for 30 cycles. Final extension was done at 72°C for 10-min. PCR amplicons were directly sequenced. If there was evidence for multiple sequences (i.e. multiple alleles), PCR products were adenylated using Taq polymerase and cloned into Promega pGEM®-T Easy vector; individual clones were obtained and sequenced.
Double-positive U2OS stable cell lines
A clonal cell line was made constitutively expressing mCherry-G3BP1 by transfection of mCherry-G3BP1-C1 into the G3BP1/2 (G3BP) KO cells containing the Tet repressor, selected using G418 (500 μg/mL), and cloned. This line was used to make double-positive cells expressing Tet-inducible GFP-tagged proteins (G3BP1 WT, G3BP1 S38F, G3BP1 F33W, and UBAP2L WT) in pcDNA4 t/o vector (Invitrogen), selected using zeocin (Invitrogen, 250 μg/mL). These cell lines were used for immunoprecipitation experiments in Figure 2 and Figure 6.
Supplementary Material
Figure S1. G3BP dimerization and RNA-binding are necessary but not sufficient for stress granule formation, Related to Figure 1.
(A) Wild-type (WT) and G3BP1/2 KO (“G3BP KO”) U2OS cells expressing mCherry (mCh)-CAPRIN1 (SG protein) with indicated GFP-tagged proteins (+/− 400 μM arsenite, “As”; 1-hour). Lentivirus-mediated stable expression used in all experiments unless specified. Indicated: arrows, P-bodies (PBs); arrowheads, stress granules (SGs).
(B) Western blot of lysate from indicated cells (antibody, α; actin = loading control). 50 ng of recombinant G3BP1 or G3BP2 used as controls.
(C) Fluorescence correlation spectroscopy (FCS) calibration curves to approximate GFP and mCh concentrations in U2OS cells. iLID-GFP and mCh-sspB were used for calibrations due to lack of binding partners, predicted monomeric state, and common use as tags in studies.
(D) G3BP KO cells expressing G3BP1-mCh or GFP-G3BP1 assayed for SG formation (+/− As). Each dot = separate cell (red, no SGs; blue, SGs). Data pooled from n=4 experiments, >4 images per.
(E) G3BP KO cells expressing GFP-G3BP1 were As-treated. Inset shows fusion of SGs (arrowheads) and relaxation to a sphere. Scale bar, 3 μm.
(F) G3BP KO cells (+As) expressing G3BP1-mCh and indicated GFP-tagged G3BP1 domain deletion were scored for SGs to assess whether deletions inhibit (top, X) or promote (bottom, check) rescue. Scale bar, 3 μm.
(G) WT U2OS cells expressing YBX1-mCh (SG protein) and indicated GFP-G3BP domain deletion were As-treated and SGs were scored. Each dot = separate cell. Mean and SEM: 3–4 experiments, >4 images per. Representative images (X, inhibition). Scale bar, 3 μm.
(H) G3BP KO cells were pre-treated with cycloheximide (CH, 30-min, blocks polysome disassembly) followed by As (1-hour) and compared to cells that did not receive CH. Checks indicate SGs. Scale bar, 3 μm.
(I) Representative images of G3BP KO cells expressing mCh-CAPRIN1 or YBX1-mCh with indicated GFP-tagged G3BP domain deletion (+/− As).
(J) G3BP KO cells were transfected (Lipofectamine) with iLID-GFP-G3BP1ΔNTF2 and sspB-mCh-G3BP1ΔNTF2 (synthetic RBD dimer). 18-hours later, cells were As-treated (1-hour), and SGs assessed. Mean and SEM: n=3 experiments, 4 images per. Dashed line: SG rescue threshold for full-length G3BP1 (“WT”). Top: Representative images (X, no SGs; check, SGs). Scale bar, 3 μm.
Figure S2. SG condensation requires G3BP-UBAP2L complexes, Related to Figure 2.
(A) G3BP KO cells expressing FUS IDR Corelets (iLID-Fe core, non-fluorescent; FUS IDR-sspB-mCh, red) and indicated GFP-tagged protein were activated (10-min) and fixed. Representative images: check, recruited; X, not recruited.
(B) G3BP KO cells expressing mCh-G3BP1 and indicated GFP-tagged G3BP1 variant were As-treated (1-hour). Representative images: scale bar, 3 μm. Relative SG partitioning indicated.
(C) Indicated GFP-tagged proteins were immunoprecipitated (“IP”) from G3BP KO cells (no As) with α-GFP followed by RNase and RIPA-wash to isolate tightly-bound proteins (assessed with antibody α).
(D) Loading control for Figure 2D: IP of indicated GFP-tagged protein expressed in G3BP KO cells (+/− As).
(E) Western blot of WT, UBAP2L 1KO, and UBAP2L 2KO U2OS cell lines (three separate clones) to assess expression levels of indicated proteins.
Figure S3. Valence capping of the G3BP node by RBD-lacking binding partners prevents stress granule formation, Related to Figure 3.
(A) As-treated G3BP KO cells expressing mCh-G3BP1 (~1 μM) and indicated GFP-tagged protein (~2–4 μM). X=inhibits SGs.
(B) WT U2OS cells expressing YBX1-mCh (SG protein) and indicated GFP-tagged protein were As-treated and SG formation was assessed (each dot, separate cell). Mean and SEM: n=3 experiments, >4 images per. Representative images (bottom): X=SG inhibition.
(C) WT U2OS cells expressing CAPRIN1-mCh (SG protein) and indicated GFP-tagged protein. GFP concentrations are noted at top of column. X=inhibits SG formation. Scale bar, 3 μm.
(D) G3BP KO cells expressing indicated iRFP-tagged protein and G3BP1ΔRBD (“NTF2”) Corelets were treated with drug (ActD, 12-hours; As, 1-hour), activated (5-min), and examined for LLPS. Top left: Representative images for cells with core~0.25 μM and indicated valence (v). All images: scale bar, 3 μm. Bottom left: ActD-treated cells expressing indicated iRFP-tagged protein and NTF2 Corelets (core~0.25 μM, v~16): X = inhibition of LLPS. Right: Intracellular phase diagrams for NTF2 Corelets expressed with iRFP-tagged proteins in G3BP KO cells (drug treatment shown). Each dot=single cell. Calculated best-fit phase threshold.
(E) G3BP KO cells expressing indicated iRFP-tagged protein and G3BP1ΔNTF2 Corelets were As-treated, activated (5-min), and examined for LLPS. Top: Representative images at core~0.25 μM and v~8. Scale bar, 3 μm. Bottom: calculated best-fit phase threshold. Compare to Figure 4F.
(F) G3BP KO cells expressing indicated mCh-tagged protein and GFP-tagged G3BP isoform/deletion were As-treated and scored for SGs (X=inhibition by mCh-tagged protein). Scale bar, 3 μm.
(G) G3BP KO cells expressing sspB-mCh-sspB cross-linker Corelets were activated (5-min) and examined for LLPS. Left: Representative images at sspB~1 μM, v~16. Scale bar, 3 μm. Right: Qualitative phase thresholds show reentrant phase transition (blue, LLPS; red, no LLPS). Bottom: Patchy colloid-inspired schematic describing re-entrant LLPS. At low sspB concentrations (left), average core v is insufficient to form space-spanning network, unlike medium concentrations (middle). At high concentrations (right), binding sites on cores are saturated, cross-links cannot occur, and network formation is inhibited.
Figure S4. High valence G3BP RBD complexes are sufficient for stress granule formation with attached P-bodies, Related to Figure 4.
(A) G3BP KO cells expressing G3BP1ΔNTF2 Corelets were As-treated and immediately activated with blue light (continuous). 1-hour later, cells were deactivated (time indicated). Scale bar, 3 μm.
(B) G3BP KO cells expressing G3BP1 RBD Corelets (v~6–8; core~0.25 μM) were As-treated and immediately subjected to four 15-min activation-deactivation cycles (10-min on, 5-min off). Representative images shown for last frame of cycle. Scale bar, 3 μm. Bottom: standard deviation of pixel intensity relative to first image.
(C) Similar to (B) except using G3BP1 IDR2-RBD Corelets. Granules appear irregular, similar to GFP-G3BP1ΔIDR1 (see Figure 1H).
(D) G3BP KO cells expressing FUS IDR Corelets were treated with noted drug (As, 1-hour; ActD, 12-hours) followed by activation (5-min). Cells were assessed for LLPS and intracellular phase diagrams plotted. Each dot = separate cell (blue, LLPS; red, no LLPS). Best-fit phase threshold displayed.
(E) Left: Representative images for Figure S4D: core~0.25 μM, v marked (low~3, medium~6, high~18), drug treatment indicated (As, 1-hour; ActD, 12-hours). Scale bar, 3 μm (all images). Right: Similar to (B) except using FUS IDR Corelets (v~18).
(F) G3BP KO cells expressing ΔNTF2 Corelets (v ~18; core~0.25 μM) were As-treated and immediately subjected to six 10-min activation-deactivation cycles (5-min on, 5-min off). Representative images shown for last frame of each cycle. Scale bar, 3 μm. Bottom: standard deviation of pixel intensity relative to first image.
(G) Similar to (F) but cells were pre-treated with cycloheximide (30-min) to inhibit polysome disassembly (“RNA influx”).
(H) Top: Similar to (D) but using G3BP1 IDR1/2 (“IDR”) Corelets. No LLPS in any cell tested (red dots). Bottom: Representative images for core~0.4 μM, v~18 cells treated with indicated drug (As, 1-hour; ActD, 12-hours). Scale bar, 3 μm.
(I) Left: similar to (B) but using G3BP1 IDR1/2 (“IDR”) Corelets at v~24. Right: representative images of G3BP KO cells expressing IDR Corelets (core, non-fluorescent; sspB-mCh-IDR, red) and PABPC1-EYFP (SG protein, green). Following As-treatment (1-hour), cells were activated (5-min): no LLPS observed, PABPC1 remains diffuse. Scale bar, 3 μm.
(J) Representative images: G3BP KO cells (+/− As) expressing indicated G3BP1 Corelets (v~18, core~0.4 μM) were activated for 5-min. Arrowheads: binding to microtubules. Scale bar, 3 μm.
(K) G3BP KO cells expressing indicated G3BP1 Corelets (green) were As-treated (1-hour), activated (10-min), and fixed. Oligo-DT RNA FISH was performed to detect polyadenylated mRNA (magenta). FL G3BP1 Corelets (left) used as positive control. In other conditions, polyA+ mRNA is diffuse (no SGs form). Arrowheads: microtubule-binding. Scale bar, 3 μm.
Figure S5. Stress granules with attached P-bodies are the default multiphase condensate encoded by high valence RBD nodes, Related to Figure 5.
(A) G3BP KO cells expressing G3BP IDR1/2 (“IDR”)-CAPRIN1 RBD Corelets were treated with ActD (12-hours) and activated (5-min). Left: representative images for cells with core~0.25 μM and indicated v (low~3, medium~6, high~18). IDR-CAPRIN RBD Corelets bind microtubules (arrowheads). Scale bar, 3 μm. Right: intracellular phase diagram, each dot = separate cell (red, no LLPS).
(B) G3BP KO cells (no As) expressing IDR-CAPRIN1 RBD Corelets were activated (5-min). Representative images show directional movement along microtubules. Time since activation indicated. Scale bar, 3 μm.
(C) Intracellular phase diagrams for activated G3BP KO cells (+/− As) expressing IDR-CAPRIN1 RBD (scrambled) Corelets were plotted (+/− As). Non-scrambled phase threshold, shaded region (see Figure 5C). Right: As-treated cells expressing IDR-CAPRIN1 RBD (scrambled) Corelets (green) were activated (10-min) and fixed. Oligo-DT RNA FISH was performed to detect polyadenylated mRNA (magenta). Scale bar, 3 μm.
(D) G3BP KO cells expressing indicated Corelet (“IDR” = G3BP1 IDR1/2) at core ~0.25 μM and v~18 were As-treated (1-hour) and fluorescence recovery after photobleaching (FRAP) experiments performed. Left: Granule fluorescence intensity relative to before bleach. Mean and SEM: n=8 experiments. Right: Representative images for FRAP time course. Scale bar, 2 μm.
(E) G3BP KO cells expressing indicated Corelets (core, no fluorescent tag; sspB-mCh, red) and GFP-tagged protein (green) were As-treated (1-hour), activated (10-min), and fixed. Arrowheads indicate PBs adhered to opto-SGs. Far right: similar protocol but with iLID-GFP-Fe to visualize cores (green) and oligo-dT FISH performed to detect polyadenylated RNA (magenta).
(F) G3BP KO cells expressing indicated Corelets (core, green; sspB-mCh, not shown) were As-treated (1-hour), activated (10-min), and fixed. Oligo-DT RNA FISH performed to detect polyadenylated mRNA (magenta). Co-localization (white) occurs in all cases except controls, EDC3 (PB protein), and USP10 (no RBD). See Table S1 for protein domains.
(G) Similar to (E) except using different GFP-tagged proteins and RBDs with or without G3BP1 IDR1/2 (“IDR”).
(H) G3BP KO cells expressing IDR-FXR1 RBD Corelets (v~6, core~0.25 μM) were As-treated and immediately subjected to seven 10-min activation-deactivation cycles (5-min on, 5-min off). Representative images for last frame of each cycle. Scale bar, 3 μm. Bottom: standard deviation of pixel intensity relative to first image. First cycle not shown due to space constraints.
(I) Similar to (H) but using IDR-CAPRIN1 RBD Corelets.
(J) G3BP KO cells expressing mCh-tagged SG protein (magenta) and GFP-tagged G3BP1 with swapped RBD (protein indicated in green) were As-treated (1-hour) and imaged. White hue indicates co-localization (SG rescue). Scale bar, 3 μm.
Figure S6. Competition between protein-protein interaction nodes encodes multiphase condensation, Related to Figure 6.
(A) G3BP KO cells expressing indicated GFP-tagged protein were assessed for LLPS (+/− As). Indicated: check, condensates (SGs or PBs); arrowhead, those found to lack polyadenylated RNA (oligo-dT RNA FISH, bottom right). Note concentration dependence of condensation in untreated cells for DCP1A, UBAP2L, FMR1, and FXR1, which is affected by As-treatment. Scale bar, 3 μm.
(B) Representative images of G3BP KO cells (no As) expressing (~1–2 μM) indicated GFP-tagged protein. Checks indicate condensates. Scale bar, 3 μm.
(C) G3BP KO cells expressing mCh-UBAP2L (magenta) and GFP-FXR1 (both ~1–2 μM) were imaged immediately following As (time since As-treatment shown). Both proteins co-localize in puncta that fuse and relax to sphere. Not shown: puncta grow in size and irregularity as available RNA increases. Scale bar, 3 μm.
(D) Representative images for CAPRIN1 fragments tested in self-associating domain screen (Figure 6C): G3BP KO cells expressing indicated Corelet were As-treated (1-hour), activated (10-min), and fixed. Oligo-dT RNA FISH was performed to detect polyadenylated mRNA (magenta), which only co-localizes with CAPRIN1 382–709 (green, RBD 605–709). Scale bar, 3 μm.
(E) G3BP KO U2OS cells (no As) expressing EIF3F-mCh and indicated GFP-tagged UBAP2L were scored for condensates (EIF3F-negative). Each dot = separate cell. Mean and SEM: n=3–4 experiments, >4 images per. UBAP2L 1–780 lacks IDR; 91–1087, UBA; 291–1087, UBA and RBD. Right: Representative images. Scale bar, 1 μm.
(F) G3BP KO cells expressing UBAP2L C-terminus (781–1087) Corelets (+/− As) were activated (5-min) and assayed for LLPS. Each dot is a separate cell. Best-fit phase threshold displayed.
(G) G3BP KO U2OS cells expressing indicated mCh-tagged SG protein and GFP-tagged UBAP2L deletion protein were imaged (+/−As). Representative images shown, check=co-localization. Scale bar, 3 μm.
(H) Two-color immunofluorescence on G3BP KO or UBAP2L KO cells expressing GFP-UBAP2L (green) (+/− As). Indicated: Antibodies (with color, top); check, co-localize with UBAP2L granules; yin-yangs, multiphase bodies.
(I) G3BP KO U2OS cells expressing mCh-UBAP2L and indicated GFP-tagged protein were As-treated (1-hour) and examined for co-localization. Indicated: X, no co-localization; yin-yangs, multiphase bodies.
(J) G3BP KO cells expressing mCh-UBAP2L and indicated GFP-tagged G3BP1 domain deletion/variant (+/− As). Note that S38F mutation blocks partitioning into UBAP2L granules similar to ΔNTF2 (X, no recruitment). Scale bar, 3 μm.
Figure S7. Competition between protein-protein interaction nodes encodes multiphase condensation, Related to Figure 6.
(A) G3BP KO cells expressing iRFP-FXR1 (magenta) and GFP-G3BP1 (green) were As-treated and time course performed. Arrowhead: FXR1 granules adsorbing onto surface of G3BP1 SGs. Scale bar, 3 μm. Right: Line trace profile shows multiphase coexistence within a single SG.
(B) As-treatment time courses for G3BP KO cells expressing (<2 μM) iRFP-UBAP2L (magenta) with GFP-G3BP1 (top) or GFP-FXR1 (bottom). Both pairs co-localize by confocal microscopy.
(C) Additional examples of G3BP KO triple co-expression data shown in Figure 6F. Relative concentration ratios of proteins are indicated.
(D) Representative images of G3BP KO cells (no As) expressing pairs of mCh- and GFP-tagged SG and PB proteins. Indicated: Checks, miscible; yin-yangs, multiphase coexistence.
(E) G3BP KO cells expressing indicated Corelet (iLID-Fe, untagged; sspB-mCh, red) and GFP-tagged protein (green) were As-treated (1-hour), activated (10-min), and fixed. DCP1A expression results in PB-like condensates that dissociate from opto-SGs, similar to Figure 6K. Miscibility indicated below. Scale bar, 1 μm.
Highlights:
Stress granule formation requires RNA-binding nodes with high network connectivity
Capping of nodes by ligands lacking connectivity prevents condensation
Protein disorder and RNA-binding specificity play non-essential, modulatory roles
Competition of RNP networks for connecting nodes controls multiphase organization
Acknowledgements
We thank Rivkah Brown, Chang-Hyun Choi, Evangelos Gatzogiannis, Brittany Grego, Anastasia Repouliou, and Claire Riggs for assistance with experiments, and all Brangwynne Lab members for helpful critiques. We thank J. Paul Taylor (St. Jude Children’s Hospital) and Simon Alberti (MPI-CBG) for discussing independently collected, corroborating data. This work was supported by the Howard Hughes Medical Institute, the St. Jude Research Collaborative on Membrane-less Organelles, the NIH (U01 DA040601), and an NSF CAREER award (125035) (C.P.B.). D.W.S. acknowledges support through the NIH (F32 GM130072); D.S.W.L., NSF Graduate Research Fellowship Program (DCE-1656466); A.R.S., LSRF Fellowship from Mark Foundation for Cancer Research; D.B., Cross-Disciplinary Postdoctoral Fellowship from Human Frontiers Science Program; J.M.E., NWO Rubicon Fellowship; N.L.K., S.M.L., P.A., NIH (R35 GM126901); S.M.L., NIH (K99 GM124458); P.I., NIH (R01 GM126150).
Footnotes
Publisher's Disclaimer: This is a PDF file of an unedited manuscript that has been accepted for publication. As a service to our customers we are providing this early version of the manuscript. The manuscript will undergo copyediting, typesetting, and review of the resulting proof before it is published in its final form. Please note that during the production process errors may be discovered which could affect the content, and all legal disclaimers that apply to the journal pertain.
Declaration of Interests
Patent applications have been filed based on this work.
References
- Adinolfi S, Ramos A, Martin SR, Dal Piaz F, Pucci P, Bardoni B, Mandel JL, and Pastore A (2003). The N-terminus of the fragile X mental retardation protein contains a novel domain involved in dimerization and RNA binding. Biochemistry 42, 10437–10444. [DOI] [PubMed] [Google Scholar]
- Alberti S (2019). Conformational rearrangements within G3BP1 promote the emergence of RNA cross-linking microclusters that drive stress granule formation by condensation. Cell 1–82.
- Ayache J, Bénard M, Ernoult-Lange M, Minshall N, Standart N, Kress M, and Weil D (2015). P-body assembly requires DDX6 repression complexes rather than decay or Ataxin2/2L complexes. Mol. Biol. Cell 26, 2579–2595. [DOI] [PMC free article] [PubMed] [Google Scholar]
- Banani SF, Lee HO, Hyman AA, and Rosen MK (2017). Biomolecular condensates: organizers of cellular biochemistry. Nat. Rev. Mol. Cell Biol 18, 285–298. [DOI] [PMC free article] [PubMed] [Google Scholar]
- Baumgartner R, Stocker H, and Hafen E (2013). The RNA-binding proteins FMR1, rasputin and caprin act together with the UBA protein lingerer to restrict tissue growth in Drosophila melanogaster. PLoS Genet 9, e1003598. [DOI] [PMC free article] [PubMed] [Google Scholar]
- Bianchi E, Blaak R, and Likos CN (2011). Patchy colloids: state of the art and perspectives. Phys Chem Chem Phys 13, 6397–6410. [DOI] [PubMed] [Google Scholar]
- Bianchi E, Largo J, Tartaglia P, Zaccarelli E, and Sciortino F (2006). Phase diagram of patchy colloids: towards empty liquids. Phys. Rev. Lett 97, 168301. [DOI] [PubMed] [Google Scholar]
- Bley N, Lederer M, Pfalz B, Reinke C, Fuchs T, Glaß M, Möller B, and Hüttelmaier S (2015). Stress granules are dispensable for mRNA stabilization during cellular stress. Nucleic Acids Res 43, e26–e26. [DOI] [PMC free article] [PubMed] [Google Scholar]
- Boeynaems S, Alberti S, Fawzi NL, Mittag T, Polymenidou M, Rousseau F, Schymkowitz J, Shorter J, Wolozin B, Van Den Bosch L, et al. (2018). Protein Phase Separation: A New Phase in Cell Biology. Trends Cell Biol 28, 420–435. [DOI] [PMC free article] [PubMed] [Google Scholar]
- Boeynaems S, Bogaert E, Kovacs D, Konijnenberg A, Timmerman E, Volkov A, Guharoy M, De Decker M, Jaspers T, Ryan VH, et al. (2017). Phase Separation of C9orf72 Dipeptide Repeats Perturbs Stress Granule Dynamics. Mol. Cell 65, 1044–1055.e1045. [DOI] [PMC free article] [PubMed] [Google Scholar]
- Boeynaems S, Holehouse AS, Weinhardt V, Kovacs D, Van Lindt J, Larabell C, Van Den Bosch L, Das R, Tompa PS, Pappu RV, et al. (2019). Spontaneous driving forces give rise to protein-RNA condensates with coexisting phases and complex material properties. Proc. Natl. Acad. Sci. U.S.A 116, 7889–7898. [DOI] [PMC free article] [PubMed] [Google Scholar]
- Bounedjah O, Desforges B, Wu T-D, Pioche-Durieu C, Marco S, Hamon L, Curmi PA, Guerquin-Kern J-L, Piétrement O, and Pastré D (2014). Free mRNA in excess upon polysome dissociation is a scaffold for protein multimerization to form stress granules. Nucleic Acids Res 42, 8678–8691. [DOI] [PMC free article] [PubMed] [Google Scholar]
- Bracha D, Walls MT, Wei M-T, Zhu L, Kurian M, Avalos JL, Toettcher JE, and Brangwynne CP (2018). Mapping Local and Global Liquid Phase Behavior in Living Cells Using Photo-Oligomerizable Seeds. Cell 175, 1467–1480.e13. [DOI] [PMC free article] [PubMed] [Google Scholar]
- Brandmann T, Fakim H, Padamsi Z, Youn J-Y, Gingras A-C, Fabian MR, and Jinek M (2018). Molecular architecture of LSM14 interactions involved in the assembly of mRNA silencing complexes. Embo J 37, 9358. [DOI] [PMC free article] [PubMed] [Google Scholar]
- Brangwynne CP, Eckmann CR, Courson DS, Rybarska A, Hoege C, Gharakhani J, Jülicher F, and Hyman AA (2009). Germline P granules are liquid droplets that localize by controlled dissolution/condensation. Science 324, 1729–1732. [DOI] [PubMed] [Google Scholar]
- Brangwynne CP, Tompa P, and Pappu RV (2015). Polymer physics of intracellular phase transitions. Nature Physics 11, 899–904. [Google Scholar]
- CAHN JW, and HILLIARD JE (1958). Free Energy of a Nonuniform System. 1. Interfacial Free Energy. Journal of Chemical Physics 28, 258–267. [Google Scholar]
- CHAPMAN WG, GUBBINS KE, JACKSON G, and RADOSZ M (1989). Saft - Equation-of-State Solution Model for Associating Fluids. Fluid Phase Equilibria 52, 31–38. [Google Scholar]
- Choi J-M, Dar F, and Pappu RV (2019). LASSI: A lattice model for simulating phase transitions of multivalent proteins. PLoS Comput Biol 15, e1007028. [DOI] [PMC free article] [PubMed] [Google Scholar]
- Cirillo L, Cieren A, Barbieri S, Khong A, Schwager F, Parker R, and Gotta M (2020). UBAP2L Forms Distinct Cores that Act in Nucleating Stress Granules Upstream of G3BP1. Current Biology 1–26. [DOI] [PubMed]
- Courel M, Clément Y, Bossevain C, Foretek D, Vidal Cruchez O, Yi Z, Bénard M, Benassy M-N, Kress M, Vindry C, et al. (2019). GC content shapes mRNA storage and decay in human cells. Elife 8, 2579. [DOI] [PMC free article] [PubMed] [Google Scholar]
- Dolzhanskaya N, Merz G, Aletta JM, and Denman RB (2006). Methylation regulates the intracellular protein-protein and protein-RNA interactions of FMRP. J. Cell. Sci 119, 1933–1946. [DOI] [PubMed] [Google Scholar]
- Elbaum-Garfinkle S, Kim Y, Szczepaniak K, Chen CC-H, Eckmann CR, Myong S, and Brangwynne CP (2015). The disordered P granule protein LAF-1 drives phase separation into droplets with tunable viscosity and dynamics. Proc. Natl. Acad. Sci. U.S.a 112, 7189–7194. [DOI] [PMC free article] [PubMed] [Google Scholar]
- Eystathioy T, Chan EKL, Tenenbaum SA, Keene JD, Griffith K, and Fritzler MJ (2002). A phosphorylated cytoplasmic autoantigen, GW182, associates with a unique population of human mRNAs within novel cytoplasmic speckles. Mol. Biol. Cell 13, 1338–1351. [DOI] [PMC free article] [PubMed] [Google Scholar]
- Eystathioy T, Jakymiw A, Chan EKL, Séraphin B, Cougot N, and Fritzler MJ (2003). The GW182 protein colocalizes with mRNA degradation associated proteins hDcp1 and hLSm4 in cytoplasmic GW bodies. Rna 9, 1171–1173. [DOI] [PMC free article] [PubMed] [Google Scholar]
- Fang MY, Markmiller S, Vu AQ, Javaherian A, Dowdle WE, Jolivet P, Bushway PJ, Castello NA, Baral A, Chan MY, et al. (2019). Small-Molecule Modulation of TDP-43 Recruitment to Stress Granules Prevents Persistent TDP-43 Accumulation in ALS/FTD. Neuron 103, 802–819.e811. [DOI] [PMC free article] [PubMed] [Google Scholar]
- Fei J, Jadaliha M, Harmon TS, Li ITS, Hua B, Hao Q, Holehouse AS, Reyer M, Sun Q, Freier SM, et al. (2017). Quantitative analysis of multilayer organization of proteins and RNA in nuclear speckles at super resolution. J. Cell. Sci 130, 4180–4192. [DOI] [PMC free article] [PubMed] [Google Scholar]
- Feric M, Vaidya N, Harmon TS, Mitrea DM, Zhu L, Richardson TM, Kriwacki RW, Pappu RV, and Brangwynne CP (2016). Coexisting Liquid Phases Underlie Nucleolar Subcompartments. Cell 165, 1686–1697. [DOI] [PMC free article] [PubMed] [Google Scholar]
- Freibaum BD, and Taylor JP (2017). The Role of Dipeptide Repeats in C9ORF72-Related ALS-FTD. Front Mol Neurosci 10, 35. [DOI] [PMC free article] [PubMed] [Google Scholar]
- Frey S, Richter RP, and Görlich D (2006). FG-rich repeats of nuclear pore proteins form a three-dimensional meshwork with hydrogel-like properties. Science 314, 815–817. [DOI] [PubMed] [Google Scholar]
- Gammons M, and Bienz M (2018). Multiprotein complexes governing Wnt signal transduction. Curr. Opin. Cell Biol 51, 42–49. [DOI] [PubMed] [Google Scholar]
- Gennes P.-G. de (2004). Capillarity and wetting phenomena : drops, bubbles, pearls, waves (New York: Springer; ). [Google Scholar]
- Guntas G, Hallett RA, Zimmerman SP, Williams T, Yumerefendi H, Bear JE, and Kuhlman B (2015). Engineering an improved light-induced dimer (iLID) for controlling the localization and activity of signaling proteins. Proc. Natl. Acad. Sci. U.S.a 112, 112–117. [DOI] [PMC free article] [PubMed] [Google Scholar]
- Guo X, Wang H, Li Y, Leng X, Huang W, Ma Y, Xu T, and Qi X (2019). Transfection reagent Lipofectamine triggers type I interferon signaling activation in macrophages. Immunol. Cell Biol 97, 92–96. [DOI] [PubMed] [Google Scholar]
- Hagen L, Sharma A, Aas PA, and Slupphaug G (2015). Off-target responses in the HeLa proteome subsequent to transient plasmid-mediated transfection. Biochim. Biophys. Acta 1854, 84–90. [DOI] [PubMed] [Google Scholar]
- Hein MY, Hubner NC, Poser I, Cox J, Nagaraj N, Toyoda Y, Gak IA, Weisswange I, Mansfeld J, Buchholz F, et al. (2015). A human interactome in three quantitative dimensions organized by stoichiometries and abundances. Cell 163, 712–723. [DOI] [PubMed] [Google Scholar]
- Huang C, Chen Y, Dai H, Zhang H, Xie M, Zhang H, Chen F, Kang X, Bai X, and Chen Z (2019). UBAP2L arginine methylation by PRMT1 modulates stress granule assembly. Cell Death Differ 19, R397–15. [DOI] [PMC free article] [PubMed] [Google Scholar]
- Hubstenberger A, Courel M, Bénard M, Souquere S, Ernoult-Lange M, Chouaib R, Yi Z, Morlot J-B, Munier A, Fradet M, et al. (2017). P-Body Purification Reveals the Condensation of Repressed mRNA Regulons. Mol. Cell 68, 144–157.e145. [DOI] [PubMed] [Google Scholar]
- Ivanov P, Kedersha N, and Anderson P (2018). Stress Granules and Processing Bodies in Translational Control. Cold Spring Harb Perspect Biol a032813. [DOI] [PMC free article] [PubMed]
- Jacobs WM, and Frenkel D (2017). Phase Transitions in Biological Systems with Many Components. Biophys. J 112, 683–691. [DOI] [PMC free article] [PubMed] [Google Scholar]
- Jacobs WM, Oxtoby DW, and Frenkel D (2014). Phase separation in solutions with specific and nonspecific interactions. J Chem Phys 140, 204109. [DOI] [PubMed] [Google Scholar]
- Jain S, Wheeler JR, Walters RW, Agrawal A, Barsic A, and Parker R (2016). ATPase-Modulated Stress Granules Contain a Diverse Proteome and Substructure. Cell 164, 487–498. [DOI] [PMC free article] [PubMed] [Google Scholar]
- Kamenska A, Simpson C, Vindry C, Broomhead H, Bénard M, Ernoult-Lange M, Lee BP, Harries LW, Weil D, and Standart N (2016). The DDX6–4E-T interaction mediates translational repression and P-body assembly. Nucleic Acids Res 44, 6318–6334. [DOI] [PMC free article] [PubMed] [Google Scholar]
- Kato M, Han TW, Xie S, Shi K, Du X, Wu LC, Mirzaei H, Goldsmith EJ, Longgood J, Pei J, et al. (2012). Cell-free Formation of RNA Granules: Low Complexity Sequence Domains Form Dynamic Fibers within Hydrogels. Cell 149, 753–767. [DOI] [PMC free article] [PubMed] [Google Scholar]
- Kedersha NL, Gupta M, Li W, Miller I, and Anderson P (1999). RNA-binding proteins TIA-1 and TIAR link the phosphorylation of eIF-2 alpha to the assembly of mammalian stress granules. J. Cell Biol 147, 1431–1442. [DOI] [PMC free article] [PubMed] [Google Scholar]
- Kedersha N, Chen S, Gilks N, Li W, Miller IJ, Stahl J, and Anderson P (2002). Evidence that ternary complex (eIF2-GTP-tRNA(i)(Met))-deficient preinitiation complexes are core constituents of mammalian stress granules. Mol. Biol. Cell 13, 195–210. [DOI] [PMC free article] [PubMed] [Google Scholar]
- Kedersha N, Panas MD, Achorn CA, Lyons S, Tisdale S, Hickman T, Thomas M, Lieberman J, McInerney GM, Ivanov P, et al. (2016). G3BP-Caprin1-USP10 complexes mediate stress granule condensation and associate with 40S subunits. J. Cell Biol 212, 845–860. [DOI] [PMC free article] [PubMed] [Google Scholar]
- Kedersha N, Stoecklin G, Ayodele M, Yacono P, Lykke-Andersen J, Fritzler MJ, Scheuner D, Kaufman RJ, Golan DE, and Anderson P (2005). Stress granules and processing bodies are dynamically linked sites of mRNP remodeling. J. Cell Biol 169, 871–884. [DOI] [PMC free article] [PubMed] [Google Scholar]
- Kim TH, Tsang B, Vernon RM, Sonenberg N, Kay LE, and Forman-Kay JD (2019). Phospho-dependent phase separation of FMRP and CAPRIN1 recapitulates regulation of translation and deadenylation. Science 365, 825–829. [DOI] [PubMed] [Google Scholar]
- Kristensen O (2015). Crystal structure of the G3BP2 NTF2-like domain in complex with a canonical FGDF motif peptide. Biochem. Biophys. Res. Commun 467, 53–57. [DOI] [PubMed] [Google Scholar]
- Kroschwald S, Maharana S, Mateju D, Malinovska L, Nüske E, Poser I, Richter D, and Alberti S (2015). Promiscuous interactions and protein disaggregases determine the material state of stress-inducible RNP granules. Elife 4, e06807. [DOI] [PMC free article] [PubMed] [Google Scholar]
- Langdon EM, Qiu Y, Ghanbari Niaki A, McLaughlin GA, Weidmann CA, Gerbich TM, Smith JA, Crutchley JM, Termini CM, Weeks KM, et al. (2018). mRNA structure determines specificity of a polyQ-driven phase separation. Science 360, 922–927. [DOI] [PMC free article] [PubMed] [Google Scholar]
- Larson AG, Elnatan D, Keenen MM, Trnka MJ, Johnston JB, Burlingame AL, Agard DA, Redding S, and Narlikar GJ (2017). Liquid droplet formation by HP1α suggests a role for phase separation in heterochromatin. Nature 547, 236–240. [DOI] [PMC free article] [PubMed] [Google Scholar]
- Li P, Banjade S, Cheng H-C, Kim S, Chen B, Guo L, Llaguno M, Hollingsworth JV, King DS, Banani SF, et al. (2012). Phase transitions in the assembly of multivalent signalling proteins. Nature 483, 336–340. [DOI] [PMC free article] [PubMed] [Google Scholar]
- Lin Y, Protter DSW, Rosen MK, and Parker R (2015). Formation and Maturation of Phase-Separated Liquid Droplets by RNA-Binding Proteins. Mol. Cell 60, 208–219. [DOI] [PMC free article] [PubMed] [Google Scholar]
- Maharana S, Wang J, Papadopoulos DK, Richter D, Pozniakovsky A, Poser I, Bickle M, Rizk S, Guillén-Boixet J, Franzmann TM, et al. (2018). RNA buffers the phase separation behavior of prion-like RNA binding proteins. Science 360, 918–921. [DOI] [PMC free article] [PubMed] [Google Scholar]
- Mao S, Kuldinow D, Haataja MP, and Kosmrlj A (2019). Phase behavior and morphology of multicomponent liquid mixtures. Soft Matter 15, 1297–1311. [DOI] [PubMed] [Google Scholar]
- Mao YS, Zhang B, and Spector DL (2011). Biogenesis and function of nuclear bodies. Trends Genet 27, 295–306. [DOI] [PMC free article] [PubMed] [Google Scholar]
- Markmiller S, Soltanieh S, Server KL, Mak R, Jin W, Fang MY, Luo E-C, Krach F, Yang D, Sen A, et al. (2018). Context-Dependent and Disease-Specific Diversity in Protein Interactions within Stress Granules. Cell 172, 590–604.e13. [DOI] [PMC free article] [PubMed] [Google Scholar]
- Matsuki H, Takahashi M, Higuchi M, Makokha GN, Oie M, and Fujii M (2013). Both G3BP1 and G3BP2 contribute to stress granule formation. Genes Cells 18, 135–146. [DOI] [PubMed] [Google Scholar]
- McInerney GM (2015). FGDF motif regulation of stress granule formation. DNA Cell Biol 34, 557–560. [DOI] [PubMed] [Google Scholar]
- Michelsen ML, and Hendriks EM (2001). Physical properties from association models. Fluid Phase Equilibria 180, 165–174. [Google Scholar]
- Mitrea DM, and Kriwacki RW (2016). Phase separation in biology; functional organization of a higher order. Cell Commun. Signal 14, 1. [DOI] [PMC free article] [PubMed] [Google Scholar]
- Mitrea DM, Cika JA, Guy CS, Ban D, Banerjee PR, Stanley CB, Nourse A, Deniz AA, and Kriwacki RW (2016). Nucleophosmin integrates within the nucleolus via multi-modal interactions with proteins displaying R-rich linear motifs and rRNA. Elife 5, D181. [DOI] [PMC free article] [PubMed] [Google Scholar]
- Molliex A, Temirov J, Lee J, Coughlin M, Kanagaraj AP, Kim HJ, Mittag T, and Taylor JP (2015). Phase separation by low complexity domains promotes stress granule assembly and drives pathological fibrillization. Cell 163, 123–133. [DOI] [PMC free article] [PubMed] [Google Scholar]
- Moon SL, Morisaki T, Khong A, Lyon K, Parker R, and Stasevich TJ (2019). Multicolour single-molecule tracking of mRNA interactions with RNP granules. Nat. Cell Biol 36, 932. [DOI] [PMC free article] [PubMed] [Google Scholar]
- Niewidok B, Igaev M, Pereira da Graca A, Strassner A, Lenzen C, Richter CP, Piehler J, Kurre R, and Brandt R (2018). Single-molecule imaging reveals dynamic biphasic partition of RNA-binding proteins in stress granules. J. Cell Biol 217, 1303–1318. [DOI] [PMC free article] [PubMed] [Google Scholar]
- Nizami Z, Deryusheva S, and Gall JG (2010). The Cajal body and histone locus body. Cold Spring Harb Perspect Biol 2, a000653–a000653. [DOI] [PMC free article] [PubMed] [Google Scholar]
- Nott TJ, Petsalaki E, Farber P, Jervis D, Fussner E, Plochowietz A, Craggs TD, Bazett-Jones DP, Pawson T, Forman-Kay JD, et al. (2015). Phase transition of a disordered nuage protein generates environmentally responsive membraneless organelles. Mol. Cell 57, 936–947. [DOI] [PMC free article] [PubMed] [Google Scholar]
- Ohn T, Kedersha N, Hickman T, Tisdale S, and Anderson P (2008). A functional RNAi screen links O-GlcNAc modification of ribosomal proteins to stress granule and processing body assembly. Nat. Cell Biol 10, 1224–1231. [DOI] [PMC free article] [PubMed] [Google Scholar]
- Ozgur S, Basquin J, Kamenska A, Filipowicz W, Standart N, and Conti E (2015). Structure of a Human 4E-T/DDX6/CNOT1 Complex Reveals the Different Interplay of DDX6-Binding Proteins with the CCR4-NOT Complex. Cell Rep 13, 703–711. [DOI] [PubMed] [Google Scholar]
- Panas MD, Ahola T, and McInerney GM (2014). The C-terminal repeat domains of nsP3 from the Old World alphaviruses bind directly to G3BP. J. Virol 88, 5888–5893. [DOI] [PMC free article] [PubMed] [Google Scholar]
- Panas MD, Kedersha N, Schulte T, Branca RM, Ivanov P, and Anderson P (2019). Phosphorylation of G3BP1-S149 does not influence stress granule assembly. J. Cell Biol 218, 2425–2432. [DOI] [PMC free article] [PubMed] [Google Scholar]
- Panas MD, Schulte T, Thaa B, Sandalova T, Kedersha N, Achour A, and McInerney GM (2015). Viral and cellular proteins containing FGDF motifs bind G3BP to block stress granule formation. PLoS Pathog 11, e1004659. [DOI] [PMC free article] [PubMed] [Google Scholar]
- Patel A, Lee HO, Jawerth L, Maharana S, Jahnel M, Hein MY, Stoynov S, Mahamid J, Saha S, Franzmann TM, et al. (2015). A Liquid-to-Solid Phase Transition of the ALS Protein FUS Accelerated by Disease Mutation. Cell 162, 1066–1077. [DOI] [PubMed] [Google Scholar]
- Protter DSW, and Parker R (2016). Principles and Properties of Stress Granules. Trends Cell Biol 26, 668–679. [DOI] [PMC free article] [PubMed] [Google Scholar]
- Riback JA, Katanski CD, Kear-Scott JL, Pilipenko EV, Rojek AE, Sosnick TR, and Drummond DA (2017). Stress-Triggered Phase Separation Is an Adaptive, Evolutionarily Tuned Response. Cell 168, 1028–1040.e19. [DOI] [PMC free article] [PubMed] [Google Scholar]
- Riback JA, Zhu L, Ferrolino MC, Tolbert M, Mitrea DM, Sanders DW, Wei M-T, Kriwacki RW, and Brangwynne CP (2019). Composition dependent phase separation underlies directional flux through the nucleolus. s3–16, 441–26. [Google Scholar]
- Rollins CT, Rivera VM, Woolfson DN, Keenan T, Hatada M, Adams SE, Andrade LJ, Yaeger D, van Schravendijk MR, Holt DA, et al. (2000). A ligand-reversible dimerization system for controlling protein-protein interactions. Proc. Natl. Acad. Sci. U.S.a 97, 7096–7101. [DOI] [PMC free article] [PubMed] [Google Scholar]
- Rubinstein M (2003). Polymer physics (New York: Oxford University Press; ). [Google Scholar]
- Ruff KM, Pappu RV, and Holehouse AS (2019). Conformational preferences and phase behavior of intrinsically disordered low complexity sequences: insights from multiscale simulations. Curr. Opin. Struct. Biol 56, 1–10. [DOI] [PubMed] [Google Scholar]
- Saha S, Weber CA, Nousch M, Adame-Arana O, Hoege C, Hein MY, Osborne-Nishimura E, Mahamid J, Jahnel M, Jawerth L, et al. (2016). Polar Positioning of Phase-Separated Liquid Compartments in Cells Regulated by an mRNA Competition Mechanism. Cell 166, 1572–1584.e16. [DOI] [PMC free article] [PubMed] [Google Scholar]
- Sanders DW, Kaufman SK, DeVos SL, Sharma AM, Mirbaha H, Li A, Barker SJ, Foley AC, Thorpe JR, Serpell LC, et al. (2014). Distinct tau prion strains propagate in cells and mice and define different tauopathies. Neuron 82, 1271–1288. [DOI] [PMC free article] [PubMed] [Google Scholar]
- Schaefer KN, and Peifer M (2019). Wnt/Beta-Catenin Signaling Regulation and a Role for Biomolecular Condensates. Dev. Cell 48, 429–444. [DOI] [PMC free article] [PubMed] [Google Scholar]
- Schulte T, Liu L, Panas MD, Thaa B, Dickson N, Götte B, Achour A, and McInerney GM (2016). Combined structural, biochemical and cellular evidence demonstrates that both FGDF motifs in alphavirus nsP3 are required for efficient replication. Open Biol 6, 160078. [DOI] [PMC free article] [PubMed] [Google Scholar]
- Shalem O, Sanjana NE, Hartenian E, Shi X, Scott DA, Mikkelson T, Heckl D, Ebert BL, Root DE, Doench JG, et al. (2014). Genome-scale CRISPR-Cas9 knockout screening in human cells. Science 343, 84–87. [DOI] [PMC free article] [PubMed] [Google Scholar]
- Shin Y, and Brangwynne CP (2017). Liquid phase condensation in cell physiology and disease. Science 357, eaaf4382. [DOI] [PubMed] [Google Scholar]
- Shin Y, Berry J, Pannucci N, Haataja MP, Toettcher JE, and Brangwynne CP (2017). Spatiotemporal Control of Intracellular Phase Transitions Using Light-Activated optoDroplets. Cell 168, 159–171.e14. [DOI] [PMC free article] [PubMed] [Google Scholar]
- Solomon S, Xu Y, Wang B, David MD, Schubert P, Kennedy D, and Schrader JW (2007). Distinct structural features of caprin-1 mediate its interaction with G3BP-1 and its induction of phosphorylation of eukaryotic translation initiation factor 2alpha, entry to cytoplasmic stress granules, and selective interaction with a subset of mRNAs. Mol. Cell. Biol 27, 2324–2342. [DOI] [PMC free article] [PubMed] [Google Scholar]
- Souquere S, Mollet S, Kress M, Dautry F, Pierron G, and Weil D (2009). Unravelling the ultrastructure of stress granules and associated P-bodies in human cells. J. Cell. Sci 122, 3619–3626. [DOI] [PubMed] [Google Scholar]
- Spencer AK, Schaumberg AJ, and Zallen JA (2017). Scaling of cytoskeletal organization with cell size in Drosophila. Mol. Biol. Cell 28, 1519–1529. [DOI] [PMC free article] [PubMed] [Google Scholar]
- Strom AR, Emelyanov AV, Mir M, Fyodorov DV, Darzacq X, and Karpen GH (2017). Phase separation drives heterochromatin domain formation. Nature 547, 241–245. [DOI] [PMC free article] [PubMed] [Google Scholar]
- Tauber D, Tauber G, Khong A, Van Treeck B, Pelletier J, and Parker R (2020). Modulation of RNA Condensation by the DEAD-Box Protein eIF4A. Cell. [DOI] [PMC free article] [PubMed]
- Taylor JP (2019). G3BP1 is a molecular switch that triggers phase separation to assemble stress granules. [DOI] [PMC free article] [PubMed]
- Tourrière H, Chebli K, Zekri L, Courselaud B, Blanchard JM, Bertrand E, and Tazi J (2003). The RasGAP-associated endoribonuclease G3BP assembles stress granules. J. Cell Biol 160, 823–831. [DOI] [PMC free article] [PubMed] [Google Scholar] [Retracted]
- Vognsen T, Møller IR, and Kristensen O (2013). Crystal structures of the human G3BP1 NTF2-like domain visualize FxFG Nup repeat specificity. PLoS ONE 8, e80947. [DOI] [PMC free article] [PubMed] [Google Scholar]
- Wang J, Choi J-M, Holehouse AS, Lee HO, Zhang X, Jahnel M, Maharana S, Lemaitre R, Pozniakovsky A, Drechsel D, et al. (2018). A Molecular Grammar Governing the Driving Forces for Phase Separation of Prion-like RNA Binding Proteins. Cell 174, 688–699.e16. [DOI] [PMC free article] [PubMed] [Google Scholar]
- Wheeler JR, Matheny T, Jain S, Abrisch R, and Parker R (2016). Distinct stages in stress granule assembly and disassembly. Elife 5, 875. [DOI] [PMC free article] [PubMed] [Google Scholar]
- Wippich F, Bodenmiller B, Trajkovska MG, Wanka S, Aebersold R, and Pelkmans L (2013). Dual specificity kinase DYRK3 couples stress granule condensation/dissolution to mTORC1 signaling. Cell 152, 791–805. [DOI] [PubMed] [Google Scholar]
- Wolff J, Marques CM, and Thalmann F (2011). Thermodynamic Approach to Phase Coexistence in Ternary Phospholipid-Cholesterol Mixtures. Phys. Rev. Lett 106. [DOI] [PubMed] [Google Scholar]
- Wu H, and Fuxreiter M (2016). The Structure and Dynamics of Higher-Order Assemblies: Amyloids, Signalosomes, and Granules. Cell 165, 1055–1066. [DOI] [PMC free article] [PubMed] [Google Scholar]
- Youn J-Y, Dunham WH, Hong SJ, Knight JDR, Bashkurov M, Chen GI, Bagci H, Rathod B, MacLeod G, Eng SWM, et al. (2018). High-Density Proximity Mapping Reveals the Subcellular Organization of mRNA-Associated Granules and Bodies. Mol. Cell 69, 517–532.e11. [DOI] [PubMed] [Google Scholar]
- Youn J-Y, Dyakov BJA, Zhang J, Knight JDR, Vernon RM, Forman-Kay JD, and Gingras A-C (2019). Properties of Stress Granule and P-Body Proteomes. Mol. Cell 76, 286–294. [DOI] [PubMed] [Google Scholar]
- Zarzar LD, Sresht V, Sletten EM, Kalow JA, Blankschtein D, and Swager TM (2015). Dynamically reconfigurable complex emulsions via tunable interfacial tensions. Nature 518, 520–524. [DOI] [PMC free article] [PubMed] [Google Scholar]
- Zhang L, Köhler S, Rillo-Bohn R, and Dernburg AF (2018). A compartmentalized signaling network mediates crossover control in meiosis. Elife 7, 245. [DOI] [PMC free article] [PubMed] [Google Scholar]
- Zhang P, Fan B, Yang P, Temirov J, Messing J, Kim HJ, and Taylor JP (2019). Chronic optogenetic induction of stress granules is cytotoxic and reveals the evolution of ALS-FTD pathology. Elife 8, 651. [DOI] [PMC free article] [PubMed] [Google Scholar]
- Zhu L, and Brangwynne CP (2015). Nuclear bodies: the emerging biophysics of nucleoplasmic phases. Curr. Opin. Cell Biol 34, 23–30. [DOI] [PMC free article] [PubMed] [Google Scholar]
Associated Data
This section collects any data citations, data availability statements, or supplementary materials included in this article.
Supplementary Materials
Figure S1. G3BP dimerization and RNA-binding are necessary but not sufficient for stress granule formation, Related to Figure 1.
(A) Wild-type (WT) and G3BP1/2 KO (“G3BP KO”) U2OS cells expressing mCherry (mCh)-CAPRIN1 (SG protein) with indicated GFP-tagged proteins (+/− 400 μM arsenite, “As”; 1-hour). Lentivirus-mediated stable expression used in all experiments unless specified. Indicated: arrows, P-bodies (PBs); arrowheads, stress granules (SGs).
(B) Western blot of lysate from indicated cells (antibody, α; actin = loading control). 50 ng of recombinant G3BP1 or G3BP2 used as controls.
(C) Fluorescence correlation spectroscopy (FCS) calibration curves to approximate GFP and mCh concentrations in U2OS cells. iLID-GFP and mCh-sspB were used for calibrations due to lack of binding partners, predicted monomeric state, and common use as tags in studies.
(D) G3BP KO cells expressing G3BP1-mCh or GFP-G3BP1 assayed for SG formation (+/− As). Each dot = separate cell (red, no SGs; blue, SGs). Data pooled from n=4 experiments, >4 images per.
(E) G3BP KO cells expressing GFP-G3BP1 were As-treated. Inset shows fusion of SGs (arrowheads) and relaxation to a sphere. Scale bar, 3 μm.
(F) G3BP KO cells (+As) expressing G3BP1-mCh and indicated GFP-tagged G3BP1 domain deletion were scored for SGs to assess whether deletions inhibit (top, X) or promote (bottom, check) rescue. Scale bar, 3 μm.
(G) WT U2OS cells expressing YBX1-mCh (SG protein) and indicated GFP-G3BP domain deletion were As-treated and SGs were scored. Each dot = separate cell. Mean and SEM: 3–4 experiments, >4 images per. Representative images (X, inhibition). Scale bar, 3 μm.
(H) G3BP KO cells were pre-treated with cycloheximide (CH, 30-min, blocks polysome disassembly) followed by As (1-hour) and compared to cells that did not receive CH. Checks indicate SGs. Scale bar, 3 μm.
(I) Representative images of G3BP KO cells expressing mCh-CAPRIN1 or YBX1-mCh with indicated GFP-tagged G3BP domain deletion (+/− As).
(J) G3BP KO cells were transfected (Lipofectamine) with iLID-GFP-G3BP1ΔNTF2 and sspB-mCh-G3BP1ΔNTF2 (synthetic RBD dimer). 18-hours later, cells were As-treated (1-hour), and SGs assessed. Mean and SEM: n=3 experiments, 4 images per. Dashed line: SG rescue threshold for full-length G3BP1 (“WT”). Top: Representative images (X, no SGs; check, SGs). Scale bar, 3 μm.
Figure S2. SG condensation requires G3BP-UBAP2L complexes, Related to Figure 2.
(A) G3BP KO cells expressing FUS IDR Corelets (iLID-Fe core, non-fluorescent; FUS IDR-sspB-mCh, red) and indicated GFP-tagged protein were activated (10-min) and fixed. Representative images: check, recruited; X, not recruited.
(B) G3BP KO cells expressing mCh-G3BP1 and indicated GFP-tagged G3BP1 variant were As-treated (1-hour). Representative images: scale bar, 3 μm. Relative SG partitioning indicated.
(C) Indicated GFP-tagged proteins were immunoprecipitated (“IP”) from G3BP KO cells (no As) with α-GFP followed by RNase and RIPA-wash to isolate tightly-bound proteins (assessed with antibody α).
(D) Loading control for Figure 2D: IP of indicated GFP-tagged protein expressed in G3BP KO cells (+/− As).
(E) Western blot of WT, UBAP2L 1KO, and UBAP2L 2KO U2OS cell lines (three separate clones) to assess expression levels of indicated proteins.
Figure S3. Valence capping of the G3BP node by RBD-lacking binding partners prevents stress granule formation, Related to Figure 3.
(A) As-treated G3BP KO cells expressing mCh-G3BP1 (~1 μM) and indicated GFP-tagged protein (~2–4 μM). X=inhibits SGs.
(B) WT U2OS cells expressing YBX1-mCh (SG protein) and indicated GFP-tagged protein were As-treated and SG formation was assessed (each dot, separate cell). Mean and SEM: n=3 experiments, >4 images per. Representative images (bottom): X=SG inhibition.
(C) WT U2OS cells expressing CAPRIN1-mCh (SG protein) and indicated GFP-tagged protein. GFP concentrations are noted at top of column. X=inhibits SG formation. Scale bar, 3 μm.
(D) G3BP KO cells expressing indicated iRFP-tagged protein and G3BP1ΔRBD (“NTF2”) Corelets were treated with drug (ActD, 12-hours; As, 1-hour), activated (5-min), and examined for LLPS. Top left: Representative images for cells with core~0.25 μM and indicated valence (v). All images: scale bar, 3 μm. Bottom left: ActD-treated cells expressing indicated iRFP-tagged protein and NTF2 Corelets (core~0.25 μM, v~16): X = inhibition of LLPS. Right: Intracellular phase diagrams for NTF2 Corelets expressed with iRFP-tagged proteins in G3BP KO cells (drug treatment shown). Each dot=single cell. Calculated best-fit phase threshold.
(E) G3BP KO cells expressing indicated iRFP-tagged protein and G3BP1ΔNTF2 Corelets were As-treated, activated (5-min), and examined for LLPS. Top: Representative images at core~0.25 μM and v~8. Scale bar, 3 μm. Bottom: calculated best-fit phase threshold. Compare to Figure 4F.
(F) G3BP KO cells expressing indicated mCh-tagged protein and GFP-tagged G3BP isoform/deletion were As-treated and scored for SGs (X=inhibition by mCh-tagged protein). Scale bar, 3 μm.
(G) G3BP KO cells expressing sspB-mCh-sspB cross-linker Corelets were activated (5-min) and examined for LLPS. Left: Representative images at sspB~1 μM, v~16. Scale bar, 3 μm. Right: Qualitative phase thresholds show reentrant phase transition (blue, LLPS; red, no LLPS). Bottom: Patchy colloid-inspired schematic describing re-entrant LLPS. At low sspB concentrations (left), average core v is insufficient to form space-spanning network, unlike medium concentrations (middle). At high concentrations (right), binding sites on cores are saturated, cross-links cannot occur, and network formation is inhibited.
Figure S4. High valence G3BP RBD complexes are sufficient for stress granule formation with attached P-bodies, Related to Figure 4.
(A) G3BP KO cells expressing G3BP1ΔNTF2 Corelets were As-treated and immediately activated with blue light (continuous). 1-hour later, cells were deactivated (time indicated). Scale bar, 3 μm.
(B) G3BP KO cells expressing G3BP1 RBD Corelets (v~6–8; core~0.25 μM) were As-treated and immediately subjected to four 15-min activation-deactivation cycles (10-min on, 5-min off). Representative images shown for last frame of cycle. Scale bar, 3 μm. Bottom: standard deviation of pixel intensity relative to first image.
(C) Similar to (B) except using G3BP1 IDR2-RBD Corelets. Granules appear irregular, similar to GFP-G3BP1ΔIDR1 (see Figure 1H).
(D) G3BP KO cells expressing FUS IDR Corelets were treated with noted drug (As, 1-hour; ActD, 12-hours) followed by activation (5-min). Cells were assessed for LLPS and intracellular phase diagrams plotted. Each dot = separate cell (blue, LLPS; red, no LLPS). Best-fit phase threshold displayed.
(E) Left: Representative images for Figure S4D: core~0.25 μM, v marked (low~3, medium~6, high~18), drug treatment indicated (As, 1-hour; ActD, 12-hours). Scale bar, 3 μm (all images). Right: Similar to (B) except using FUS IDR Corelets (v~18).
(F) G3BP KO cells expressing ΔNTF2 Corelets (v ~18; core~0.25 μM) were As-treated and immediately subjected to six 10-min activation-deactivation cycles (5-min on, 5-min off). Representative images shown for last frame of each cycle. Scale bar, 3 μm. Bottom: standard deviation of pixel intensity relative to first image.
(G) Similar to (F) but cells were pre-treated with cycloheximide (30-min) to inhibit polysome disassembly (“RNA influx”).
(H) Top: Similar to (D) but using G3BP1 IDR1/2 (“IDR”) Corelets. No LLPS in any cell tested (red dots). Bottom: Representative images for core~0.4 μM, v~18 cells treated with indicated drug (As, 1-hour; ActD, 12-hours). Scale bar, 3 μm.
(I) Left: similar to (B) but using G3BP1 IDR1/2 (“IDR”) Corelets at v~24. Right: representative images of G3BP KO cells expressing IDR Corelets (core, non-fluorescent; sspB-mCh-IDR, red) and PABPC1-EYFP (SG protein, green). Following As-treatment (1-hour), cells were activated (5-min): no LLPS observed, PABPC1 remains diffuse. Scale bar, 3 μm.
(J) Representative images: G3BP KO cells (+/− As) expressing indicated G3BP1 Corelets (v~18, core~0.4 μM) were activated for 5-min. Arrowheads: binding to microtubules. Scale bar, 3 μm.
(K) G3BP KO cells expressing indicated G3BP1 Corelets (green) were As-treated (1-hour), activated (10-min), and fixed. Oligo-DT RNA FISH was performed to detect polyadenylated mRNA (magenta). FL G3BP1 Corelets (left) used as positive control. In other conditions, polyA+ mRNA is diffuse (no SGs form). Arrowheads: microtubule-binding. Scale bar, 3 μm.
Figure S5. Stress granules with attached P-bodies are the default multiphase condensate encoded by high valence RBD nodes, Related to Figure 5.
(A) G3BP KO cells expressing G3BP IDR1/2 (“IDR”)-CAPRIN1 RBD Corelets were treated with ActD (12-hours) and activated (5-min). Left: representative images for cells with core~0.25 μM and indicated v (low~3, medium~6, high~18). IDR-CAPRIN RBD Corelets bind microtubules (arrowheads). Scale bar, 3 μm. Right: intracellular phase diagram, each dot = separate cell (red, no LLPS).
(B) G3BP KO cells (no As) expressing IDR-CAPRIN1 RBD Corelets were activated (5-min). Representative images show directional movement along microtubules. Time since activation indicated. Scale bar, 3 μm.
(C) Intracellular phase diagrams for activated G3BP KO cells (+/− As) expressing IDR-CAPRIN1 RBD (scrambled) Corelets were plotted (+/− As). Non-scrambled phase threshold, shaded region (see Figure 5C). Right: As-treated cells expressing IDR-CAPRIN1 RBD (scrambled) Corelets (green) were activated (10-min) and fixed. Oligo-DT RNA FISH was performed to detect polyadenylated mRNA (magenta). Scale bar, 3 μm.
(D) G3BP KO cells expressing indicated Corelet (“IDR” = G3BP1 IDR1/2) at core ~0.25 μM and v~18 were As-treated (1-hour) and fluorescence recovery after photobleaching (FRAP) experiments performed. Left: Granule fluorescence intensity relative to before bleach. Mean and SEM: n=8 experiments. Right: Representative images for FRAP time course. Scale bar, 2 μm.
(E) G3BP KO cells expressing indicated Corelets (core, no fluorescent tag; sspB-mCh, red) and GFP-tagged protein (green) were As-treated (1-hour), activated (10-min), and fixed. Arrowheads indicate PBs adhered to opto-SGs. Far right: similar protocol but with iLID-GFP-Fe to visualize cores (green) and oligo-dT FISH performed to detect polyadenylated RNA (magenta).
(F) G3BP KO cells expressing indicated Corelets (core, green; sspB-mCh, not shown) were As-treated (1-hour), activated (10-min), and fixed. Oligo-DT RNA FISH performed to detect polyadenylated mRNA (magenta). Co-localization (white) occurs in all cases except controls, EDC3 (PB protein), and USP10 (no RBD). See Table S1 for protein domains.
(G) Similar to (E) except using different GFP-tagged proteins and RBDs with or without G3BP1 IDR1/2 (“IDR”).
(H) G3BP KO cells expressing IDR-FXR1 RBD Corelets (v~6, core~0.25 μM) were As-treated and immediately subjected to seven 10-min activation-deactivation cycles (5-min on, 5-min off). Representative images for last frame of each cycle. Scale bar, 3 μm. Bottom: standard deviation of pixel intensity relative to first image. First cycle not shown due to space constraints.
(I) Similar to (H) but using IDR-CAPRIN1 RBD Corelets.
(J) G3BP KO cells expressing mCh-tagged SG protein (magenta) and GFP-tagged G3BP1 with swapped RBD (protein indicated in green) were As-treated (1-hour) and imaged. White hue indicates co-localization (SG rescue). Scale bar, 3 μm.
Figure S6. Competition between protein-protein interaction nodes encodes multiphase condensation, Related to Figure 6.
(A) G3BP KO cells expressing indicated GFP-tagged protein were assessed for LLPS (+/− As). Indicated: check, condensates (SGs or PBs); arrowhead, those found to lack polyadenylated RNA (oligo-dT RNA FISH, bottom right). Note concentration dependence of condensation in untreated cells for DCP1A, UBAP2L, FMR1, and FXR1, which is affected by As-treatment. Scale bar, 3 μm.
(B) Representative images of G3BP KO cells (no As) expressing (~1–2 μM) indicated GFP-tagged protein. Checks indicate condensates. Scale bar, 3 μm.
(C) G3BP KO cells expressing mCh-UBAP2L (magenta) and GFP-FXR1 (both ~1–2 μM) were imaged immediately following As (time since As-treatment shown). Both proteins co-localize in puncta that fuse and relax to sphere. Not shown: puncta grow in size and irregularity as available RNA increases. Scale bar, 3 μm.
(D) Representative images for CAPRIN1 fragments tested in self-associating domain screen (Figure 6C): G3BP KO cells expressing indicated Corelet were As-treated (1-hour), activated (10-min), and fixed. Oligo-dT RNA FISH was performed to detect polyadenylated mRNA (magenta), which only co-localizes with CAPRIN1 382–709 (green, RBD 605–709). Scale bar, 3 μm.
(E) G3BP KO U2OS cells (no As) expressing EIF3F-mCh and indicated GFP-tagged UBAP2L were scored for condensates (EIF3F-negative). Each dot = separate cell. Mean and SEM: n=3–4 experiments, >4 images per. UBAP2L 1–780 lacks IDR; 91–1087, UBA; 291–1087, UBA and RBD. Right: Representative images. Scale bar, 1 μm.
(F) G3BP KO cells expressing UBAP2L C-terminus (781–1087) Corelets (+/− As) were activated (5-min) and assayed for LLPS. Each dot is a separate cell. Best-fit phase threshold displayed.
(G) G3BP KO U2OS cells expressing indicated mCh-tagged SG protein and GFP-tagged UBAP2L deletion protein were imaged (+/−As). Representative images shown, check=co-localization. Scale bar, 3 μm.
(H) Two-color immunofluorescence on G3BP KO or UBAP2L KO cells expressing GFP-UBAP2L (green) (+/− As). Indicated: Antibodies (with color, top); check, co-localize with UBAP2L granules; yin-yangs, multiphase bodies.
(I) G3BP KO U2OS cells expressing mCh-UBAP2L and indicated GFP-tagged protein were As-treated (1-hour) and examined for co-localization. Indicated: X, no co-localization; yin-yangs, multiphase bodies.
(J) G3BP KO cells expressing mCh-UBAP2L and indicated GFP-tagged G3BP1 domain deletion/variant (+/− As). Note that S38F mutation blocks partitioning into UBAP2L granules similar to ΔNTF2 (X, no recruitment). Scale bar, 3 μm.
Figure S7. Competition between protein-protein interaction nodes encodes multiphase condensation, Related to Figure 6.
(A) G3BP KO cells expressing iRFP-FXR1 (magenta) and GFP-G3BP1 (green) were As-treated and time course performed. Arrowhead: FXR1 granules adsorbing onto surface of G3BP1 SGs. Scale bar, 3 μm. Right: Line trace profile shows multiphase coexistence within a single SG.
(B) As-treatment time courses for G3BP KO cells expressing (<2 μM) iRFP-UBAP2L (magenta) with GFP-G3BP1 (top) or GFP-FXR1 (bottom). Both pairs co-localize by confocal microscopy.
(C) Additional examples of G3BP KO triple co-expression data shown in Figure 6F. Relative concentration ratios of proteins are indicated.
(D) Representative images of G3BP KO cells (no As) expressing pairs of mCh- and GFP-tagged SG and PB proteins. Indicated: Checks, miscible; yin-yangs, multiphase coexistence.
(E) G3BP KO cells expressing indicated Corelet (iLID-Fe, untagged; sspB-mCh, red) and GFP-tagged protein (green) were As-treated (1-hour), activated (10-min), and fixed. DCP1A expression results in PB-like condensates that dissociate from opto-SGs, similar to Figure 6K. Miscibility indicated below. Scale bar, 1 μm.