Abstract
Modern experimental kinetics of protein folding began in the early 1990s with the introduction of nanosecond laser pulses to trigger the folding reaction, providing an almost 106-fold improvement in time resolution over the stopped-flow method being employed at the time. These experiments marked the beginning of the “fast-folding” subfield that enabled investigation of the kinetics of formation of secondary structural elements and disordered loops for the first time, as well as the fastest folding proteins. When I started to work on this subject, a fast folding protein was one that folded in milliseconds. There were, moreover, no analytical theoretical models and no atomistic or coarse-grained molecular dynamics simulations to describe the mechanism. Two of the most important discoveries from my lab since then are a protein that folds in hundreds of nanoseconds, as determined from nanosecond laser temperature experiments, and the discovery that the theoretically predicted barrier crossing time is about the same for proteins that differ in folding rates by 104-fold, as determined from single molecule fluorescence measurements. We also developed what has been called the “Hückel model” of protein folding, which quantitatively explains a wide range of equilibrium and kinetic measurements. This retrospective traces the history of contributions to the “fast folding” subfield from my lab until about 3 years ago, when I left protein folding to spend the rest of my research career trying to discover an inexpensive drug for treating sickle cell disease.
Introduction
This Perspective is dedicated to my dear friend and close scientific colleague, Devarajan (“Dave”) Thirumalai. Dave has made numerous pioneering contributions to a wide range of subjects in physical chemistry and biological physics for which he is being honored by this Festschrift. I have profited enormously in my own work from both Dave’s published work and extensive discussions with him, especially concerning the connection of concepts and methods of theoretical polymer physics to protein folding kinetics and mechanism.
Like many scientists of my generation, when I began my research career1 there were very few proteins that were easy to access for investigations by those of us trained in experimental physical chemistry. The most accessible of course was hemoglobin, which accounted for the fact that the study of hemoglobin was at the center of biophysical research, with more papers on hemoglobin than any other protein up to the 1980s and beyond. Moreover, hemoglobin was the second structure to be solved by X-ray crystallography, shortly after the structure of myoglobin. Additional motivation for studies on hemoglobin came from two monumental works: the 1965 allosteric theory of Jacques Monod, Jeffries Wyman, and Jean-Pierre Changeux (MWC),2 one of the most highly cited theoretical papers in all of biology, and the 1970 paper by Max Perutz on interpreting the functional properties of hemoglobin in terms of the atomic structure that ushered in the era of structure–function relations in biology.3 Moreover, beginning with the work of Hans Frauenfelder in the mid 1970s,4 hemoglobin’s little brother myoglobin also become a popular subject for study by physicists and physical chemists. My interest in hemoglobin and myoglobin was sparked by these three works, plus the explosion of research in the early 1970s on sickle cell disease. So, there were many opportunities for me to stay busy working on these molecules by applying the training I received at the University of Pennsylvania from Robin Hochstrasser in molecular spectroscopy5 and from Philip George in classical physical chemistry.6
Consequently, apart from a brief foray on the single crystal spectroscopy of nucleic acid base crystals7 and near-infrared circular dichroism of cytochrome c and iron sulfur proteins,8 I worked almost exclusively on hemoglobin and myoglobin from the time I arrived at the NIH in 1968 to the early 1990s (see complete bibliography in ref (9)). The primary focus of my research changed dramatically after a conversation with Peter Wolynes over a glass of vodka in Moscow in 1991, following a meeting sponsored by the US and Soviet Academies on “Dynamics of Proteins and Glasses.” Peter said “Bill, why don’t you give up hemoglobin and use your fast kinetics methods to work on a hard problem.” I thought hemoglobin was a hard problem (and still is), but the hard problem he was referring to was of course protein folding. Unbeknownst to me, the fastest kinetic method being used to study protein folding at the time was Quentin Gibson’s stopped flow method with a maximum time-resolution of ∼1 ms.10 I was also totally unaware of the fact that nothing at all was known about the time scales for the formation of basic structural elements of proteins such as helices, hairpins, and disordered loops (Figure 1). So, I told Peter that I would consider doing something, but I knew very little about protein folding, except what I learned from occasionally attending seminars in Chris Anfinsen’s lab, and asked Peter to send me the 10 most important experimental papers on the subject. All of them used conventional kinetic methods with commercial instrumentation and the thinking about the mechanism was very much like that of an organic chemist, not a physical chemist, so none of them caught my interest and I gave the subject no more thought for over a year.
Figure 1.
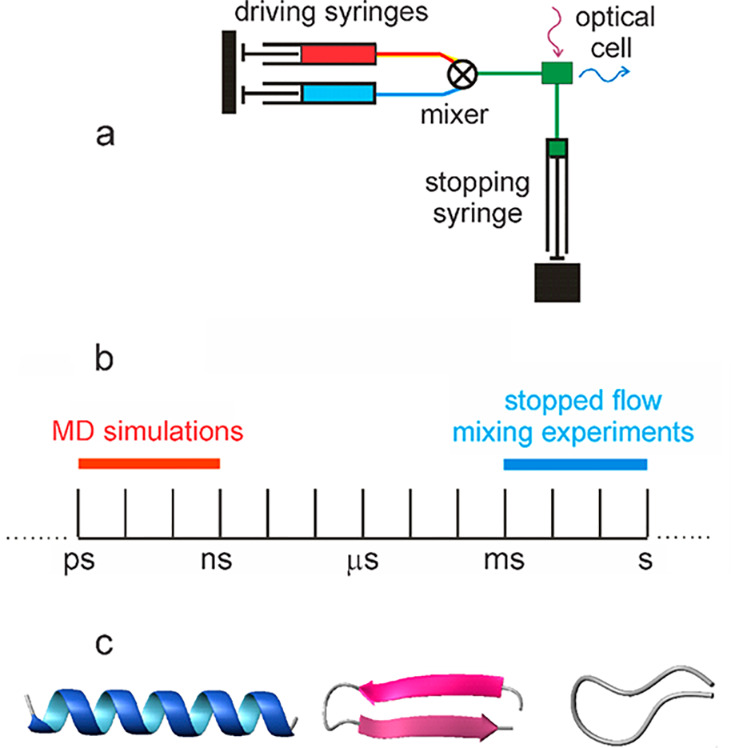
Time scales for folding experiments in early 1990s. (a) Cartoon of stopped flow instrument. (b) Comparison of time scales of molecular dynamics simulations and experiments. (c) Schematic structures of a helix, β hairpin, and disordered loop.
Beginning of the Fast-Folding Subfield and the Protein Folding “Speed Limit”
Nothing happened until a seminar visit to my lab at NIH by Heiner Roder from Penn in 1992. Heiner told me about his discovery of a very interesting property of cytochrome c, the protein along with myoglobin of my Ph.D. thesis research with Robin Hochstrasser. I knew from purifications from horse hearts that reduced cytochrome c does not bind carbon monoxide. In fact, any binding at all is an indication that the protein is either not pure or partially denatured. What Heiner discovered is that under destabilizing conditions produced by strong chemical denaturants, cytochrome c can be unfolded by preferential binding of carbon monoxide to the covalently attached heme group in the unfolded state. He reasoned that electronic excitation with a short light pulse can initiate the folding reaction by photodissociating the carbon monoxide (Figure 2). Robin and I collaborated on a project in the late 1970s where we found that a light pulse can break the bond between the iron of the heme and carbon monoxide in hemoglobin in less than 10 ps,11 so there was time resolution to burn. Heiner actually tried the experiment in Robin’s laser lab at Penn by making measurements at a single wavelength but was unsuccessful (I am sure because Robin did not pay close enough attention) and asked me to give it a try. The motivation, of course, was to improve the time resolution in protein folding kinetics experiments over the ∼1 ms available at that time using stopped flow instrumentation. In addition to my interest in cytochrome c, my colleagues Jim Hofrichter and Eric Henry developed a high precision nanosecond spectrometer and analysis method using singular value decomposition;12 we had spent the previous 10 years using nanosecond carbon monoxide photodissociation to study the rapid kinetics of ligand rebinding and protein conformational changes in both myoglobin and hemoglobin. So, it was a perfect opportunity to enter the protein folding field with a new kind of experiment on a molecule I knew well and an experiment that could have an impact because of the dramatic increase in time resolution.
Figure 2.
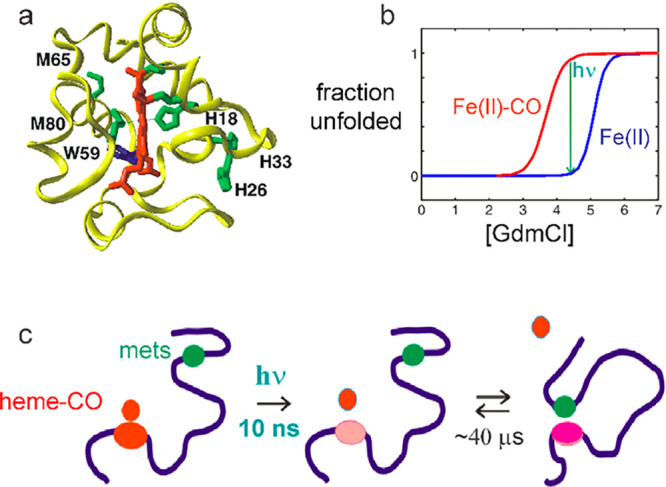
Nanosecond-resolved spectroscopic experiment on loop formation kinetics in cytochrome c. (a) Schematic structure of cytochrome c showing potential histidine and methionine ligands that could bind to the heme iron at the position occupied by M80 following carbon monoxide dissociation from the iron. (b) Fraction unfolded vs chemical denaturant concentration showing that removal of the carbon monoxide by light (hν) can result in folding to the native structure. (c) Cartoon of experiment showing heme group attached to black polypeptide chain, which changes color upon CO dissociation, and the two methionine ligands (M65 and M80), 15 residues apart in the sequence represented by a single filled green circle.
There were two problems with the experiment; not only did carbon monoxide rebind before the protein folded, but to get any kinetic information turned out to be much more difficult than I had originally thought. It required very carefully performed experiments by a new postdoctoral fellow, Colleen Jones, and a very sophisticated and innovative application of singular value decomposition by Eric Henry to disentangle the time dependence of the component spectra for distinguishing between histidine and methionine binding to the heme. Kinetic modeling that included the dissociation and binding of these two types of heme ligands in unfolded cytochrome c yielded a rate of (40 μs)−1 for the binding of the two methionines ∼50–60 residues distant in the sequence from the residues covalently connected to the heme to form a disordered loop.13 A few years later, postdoctoral fellow Stephen Hagen performed experiments to determine how much of this reaction time resulted from diffusion of the methionines distant along the chain to form an encounter complex and how much resulted from binding within the volume of the encounter complex to form the iron–methionine bond.14 He did this by photodissociating the complex of methionine with a heme containing peptide consisting of residues 11–21 of cytochrome c (“microperoxidase”) and measuring the bimolecular methionine rebinding rate to the heme without competing reactions from histidine or CO. This allowed him to use well-established kinetic theory to determine the diffusion limited rate for loop formation, which turned out to be (35–40 μs)−1. Steve then used the n−3/2 length dependence for end-to-end contact rate from the Szabo–Schulten–Schulten mean first passage time theory15 to estimate that the fastest forming loops of 10 residues would form with a rate of ∼(1 μs)−1.14 Dave Thirumalai had determined the maximum loop formation rate is for a 10 residue peptide because polypeptide chain stiffness reduces the rate for shorter loops.16 Since residues must come in contact for a protein to collapse to a compact structure in the folding process, we suggested that the shortest time a protein could possibly fold is ∼1 μs. Andrew McCammon called this time the “speed limit” for protein folding in his PNAS Commentary on the Hagen article.17
Laser Temperature Jump and Secondary Structure Formation Kinetics
Initiating protein folding by photochemical triggering was limited to just a very few proteins. It was quickly and simultaneously recognized by four different research groups that the most generic method of measuring rapid kinetics is to jump the temperature with short laser pulses. All that is required is a difference in enthalpy between reactants and products, such as folded and unfolded states in the case of protein folding. A temperature increase would induce a change in the equilibrium population of these states and allow observation of the relaxation kinetics to the new equilibrium population at the elevated temperature. Not surprisingly, as was his custom for a wide range of problems in spectroscopy and physical chemistry,18 Robin Hochstrasser reported the first temperature jump study.19 He used picosecond lasers to raise the temperature by exciting a nonfluorescent dye in a solution containing ribonuclease A, so that all of the excitation energy appeared as heat. Unfortunately, the results were not all that informative. A change in the infrared amide I band was observed, indicating some change, albeit not well-defined, in the β sheet structure. Prior to our first published study using ns pulses, there were 2 others - one on α helix formation by Brian Dyer and William Woodruff20 and one on the folding of apo-myoglobin by Martin Gruebele.21 All of the studies following Hochstrasser employed near-infrared lasers that heated the solution by water (vibrational overtone) absorption. Dyer and Woodruff used 20 ns pulsed laser excitation and infrared detection to measure a relaxation rate for a 21-residue alanine-based peptide (the relaxation rate is the sum of the folding and unfolding rates for a two-state system, often mistakenly taken to be an unfolding rate in temperature jump studies). Using 15 ns laser pulses and tryptophan fluorescence detection, Gruebele measured the association rate of apomyoglobin helices distant in sequence, as an indicator of collapse of the protein prior to folding. My group’s T-jump experiments were performed on an instrument built by a postdoc, Peggy Thompson, in which the 10 ns laser pulse of the 1052 nm fundamental from a Nd:YAG laser was Raman-shifted to longer wavelengths where water absorbs more strongly and therefore produces larger temperature increases, a method introduced by Flynn and co-workers.22 Her first experiments were on a 20-residue alanine-based peptide using fluorescence detection from a probe connected to the N-terminus.23 The experiment did not measure the helix–coil transition rates directly, because the observed 20 ns relaxation reflected a local conformational change at the N-terminus, but did give interesting new information about helix formation by analyzing the data with a “kinetic zipper” model. Thompson’s subsequent study on a 16-residue alanine-based peptide (Figure 3), motivated by the experiments of Susan Marqusee when she was a graduate student with Robert Baldwin,24 produced a helix–coil relaxation rate at 300 K of (300 ns)−1, the midpoint temperature of the helix–coil transition (tfold ∼ 600 ns).25 In this study the kinetics were explained with a model very similar to the one developed for the β hairpin by Victor Muñoz, our next temperature jump project.
Figure 3.
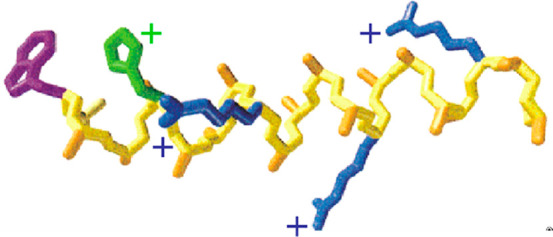
Structure of the 16-residue alanine-based peptide solubilized with arginines (blue). Protonated histidine (green) quenches the fluorescence of the (purple) tryptophan by electron transfer upon formation of the helical turn.
Brief Digression from Pulsed Laser Experiments
In 1995 I visited Denis Rousseau at Bell Laboratories to learn more about an ultrarapid mixing, continuous flow method he was using to study a fast bimolecular reaction.26 The method was invented by Tom Jovin and appeared to have great promise for measuring submillisecond protein folding kinetics following dilution of a chemical denaturant.27 The basic idea of the method is that pumping solutions though a very small gap creates turbulence, which breaks the liquids into tiny volume elements that results in rapid mixing because diffusion now occurs over very short distances (∼0.1 μm). Jim Hofrichter, with two new postdoctoral fellows, Yi Hu and Chi-Kin Chan, developed a Jovin-like instrument. They demonstrated that this technique increased the time resolution in protein denaturant dilution experiments by almost 100-fold compared to the stopped flow method and used it to study cytochrome c folding kinetics.28 To eliminate the heme–ligand exchange chemistry observed in Colleen’s experiment on reduced cytochrome c, measurements were made with the imidazole complex of oxidized cytochrome c. Folding was monitored by tryptophan fluorescence, which is partially quenched in the unfolded state and completely quenched in the folded state from Förster excitation energy transfer to the heme. Decay of the fluorescence is biphasic, with an unresolved process at less than 50 μs, which we attributed to partial collapse of the unfolded state at the lower denaturant concentration and a 600 μs process attributed to formation of the native, folded structure. Heiner Roder later constructed a better instrument without a free-flowing jet and used it to study a variety of systems,29 so I decided to abandon the method and focus on temperature jump with its much greater time resolution. I should mention here that later experiments by Steve Hagen using temperature jump that easily resolved the expansion/collapse relaxation yielded a longer time of ∼100 μs.30 Steve’s experiments also indicated that a small free-energy barrier separated the expanded and more collapsed denatured states.
Laser Temperature Jump and Secondary Structure Formation Kinetics (Continued)
In 1996, Victor Muñoz arrived, bringing his expertise on peptides as a result of his development of Agadir while a PhD student. He also brought a very important piece of information that the 16-residue C-terminal hairpin from the protein GB1 is natively folded, the first example of folded β structure in isolation. Victor immediately started T-jump experiments with Peggy’s instrument. His experiments gave several novel results, making his paper the most important work using T-jump in the protein folding field up to that time.31 First, rather surprisingly, this small peptide behaved like a perfect two-state system, as evidenced by its equilibrium behavior and the observation that identical fast relaxation rates of (5 μs)−1 were measured by two different methods: tryptophan fluorescence and Förster resonance energy transfer. It also showed a negative activation energy for folding at high temperatures, an interesting property also observed for proteins. Because it is so small and behaved like a very fast-folding single domain protein, Victor’s β hairpin became a benchmark for most theoretical groups using molecular dynamics simulations to investigate protein folding. Finally, the kinetics, including the negative activation energy, could be explained by an Ising-like theoretical model developed by Victor,31,32 where the key assumptions were later used by him33 and by the groups of David Baker34 and Alexei Finkelstein35 to describe the mechanism of single domain protein folding.36 The details of Victor’s mechanism for proteins will be described later. The lack of a need to explicitly consider non-native interactions was supported by off-lattice simulations of Victor’s β hairpin by Klimov and Thirumalai.37
Effect of Viscosity on Protein Folding Kinetics and Internal Friction
The concept of internal friction in protein folding kinetics was motivated by our work on the conformational changes in myoglobin following photodissociation of the carbon monoxide complex. In this study, postdoctoral fellow Anjum Ansari discovered that above 20 cP the protein conformational relaxation time depends on the first power of the solvent viscosity, as expected from Kramers hydrodynamic theory for the pre-exponential factor in the high friction limit, while below 1 cP it is independent of solvent viscosity.38 The viscosity independence at low viscosity indicated that the friction in Kramers’s pre-exponential factor is totally dominated by internal friction that results from colliding proteins atoms.
A major problem with previous viscosity studies in the protein folding field was that the viscogens also alter the folding/unfolding equilibrium free energy changes and therefore almost certainly also alter the activation free energy, so that changes are not solely due to changes in the pre-exponential factor. Postdoctoral fellow Gouri Jas performed a very careful and painstaking set of experiments on both Peggy’s helical peptide and Victor’s β hairpin.39 By making measurements at very low viscosities between 1 and 3 cP, Gouri found that neither the equilibrium constant nor the activation energy changed, indicating that the slowing of the relaxation rates upon addition of viscogens results entirely from the dynamical effect of increasing the solvent viscosity. The β-hairpin formation rate was found to vary as the inverse first power of the viscosity (η), while the α helix formation rate exhibited a fractional viscosity dependence of (η)−0.6. In this paper, we suggested that the fractional viscosity dependence might arise from motion over the barrier top that is faster than the solvent relaxation time, i.e., a breakdown of Kramers theory for the case where all of the friction arises from the solvent, an explanation that was also employed in theoretical work by Wolynes.40 A later theoretical study by Robert Best and co-workers using molecular dynamics simulations supported this proposal. They showed that the decreased viscosity dependence for the α helix arises from the rapid dihedral motions while crossing the barrier top, but no such rapid motions occur at the β hairpin barrier top.41 This explanation provided additional support for the Victor’s mechanism that the β turn forms prior to reaching the barrier top (Figure 4b).31
Figure 4.
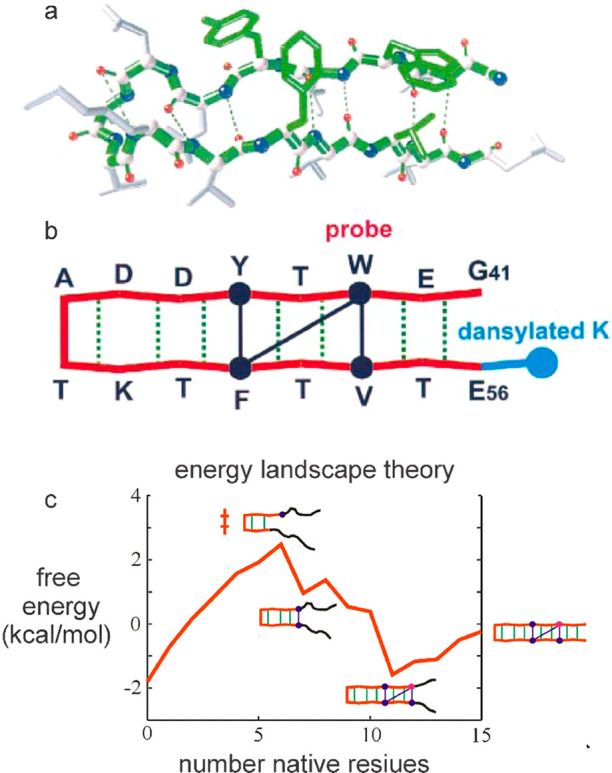
β hairpin folding and landscape theory. (a) Structure of C-terminal β hairpin of Protein GB1 with the four residues of the hydrophobic cluster shown in green. (b) Schematic representation of the structure showing the pattern of hydrogen bonds (green) and the three interactions (dark blue) between hydrophobic side chains that stabilize the structure. Also shown is the position of the dansyl group used as the acceptor of tryptophan excitation energy in folding/unfolding measurements monitored by FRET. (c) Free energy calculated from Ising-like model showing two-state behavior (two free energy minima) versus number of native residues as reaction coordinate, a transition state with lower energy than the unfolded state that explains negative activation energy, and fraying of the ends in the folded state as observed by NMR.
Generic Method for Intramolecular Contact Formation
Realizing that the formation of contacts between distance parts of a polypeptide chain is an essential component of protein folding mechanisms and that cytochrome c discussed above is a very special case, we sought a generic method for measuring intramolecular contact rates. A search of the literature provided a method based on monitoring the decay of tryptophan’s long-lived, electronically excited triplet state by triplet–triplet absorption42 and the finding that cysteine quenches this triplet hundreds of times faster than any other amino acid.43 Consequently, the rate of intramolecular contact formation between a tryptophan and cysteine could be measured in a peptide with a sequence containing one of each. In our initial study, we chose a peptide consisting of multiples of the triplet of Ala-Gly-Gln with a tryptophan at one end and cysteine at the other because this sequence was expected to have no secondary structure propensity. With help from Jim Hofrichter, postdoctoral fellow Lisa Lapidus built an instrument to monitor the population of tryptophan in its excited triplet by measuring the time dependence of the triplet–triplet absorption with a cw laser following pulsed excitation with a nanosecond laser at 290 nm on the red side of tryptophan absorption to decrease photodamage.44 The mechanism of quenching can be described as a two-step process, in which the cysteine and tryptophan diffuse together to form an encounter complex, followed by an electron transfer from the tryptophan to the cysteine sulfur, which quenches the tryptophan triplet state. The decay rate of the triplet–triplet absorption is, then, the product of the diffusion limited rate of contact formation to form the encounter complex and the probability that quenching occurs during the lifetime of the encounter complex (Figure 5). By measuring both intramolecular and bimolecular quenching rates, the diffusion limited contact rate, the rate of interest, could be obtained. Lisa found that the contact rate decreased from (40 ns)−1 to (140 ns)−1 in varying the length of the Cys-(Ala-Gly-Gln)n peptide from n = 1 to 6, approaching the n−3/2 length dependence for the longest peptides for end-to-end contact rate predicted by Szabo, Schulten, and Schulten for a random coil (Figure 5).44
Figure 5.
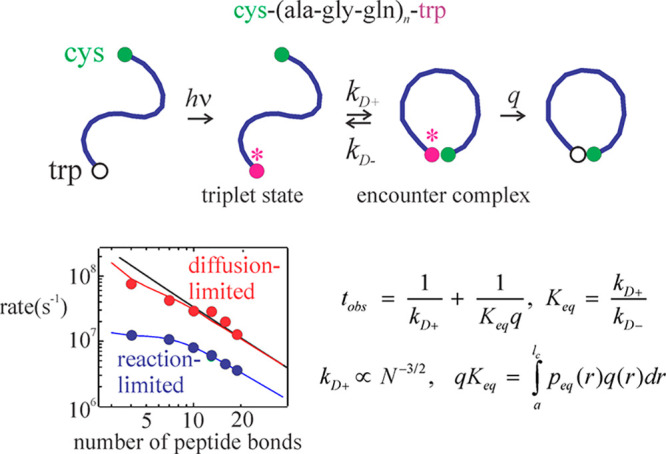
Intramolecular contact formation to form a disordered loop. (Top) Two-step mechanism of tryptophan quenching. The ends of the chain diffuse to form an encounter complex in a diffusion-limited process followed by quenching with a rate constant q. (Bottom) The observed time is the reciprocal of the diffusion-limited end-to-end contact rate (kD+) plus the reciprocal of the reaction limited rate (qKeq). The reaction limited rate depends on the contact radius (a), the contour length (lc), the equilibrium end-to-end distance distribution (peq(r)), and the distant dependent quenching rate (q(r)).
To obtain additional information on polymer physics properties of peptides from the triplet decay rates, Lisa performed an interesting experiment, in which tryptophan was embedded in a rigid glass of trehalose at room temperature containing a much higher concentration of cysteine.45 She determined the distance dependence of the quenching rate from the decay curves and the tryptophan–cysteine distance distribution for particles randomly oriented in three dimensions. Knowing this distance dependence and using the viscosity dependence of the triplet decay permitted separate determination of the reaction-limited and diffusion-limited quenching rates. Application of rather sophisticated theory by Jim Hofrichter and Attila Szabo in analyzing these two rates led to the determination of two important polymer physics properties: the end-to-end diffusion coefficient for a polypeptide chain of 2 × 10⁻⁶ cm2 s–1, about 10 times slower than the diffusion coefficient for unattached, single amino acids, and the persistence length of 0.64 nm in a worm-like chain model.46
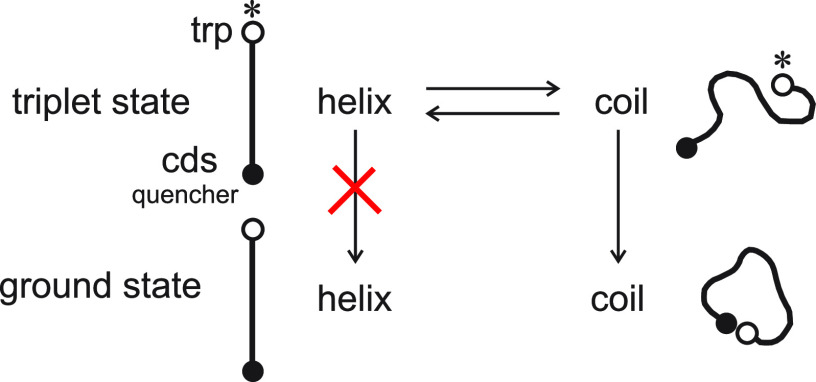
Lisa’s method was used in several additional studies connected to protein folding. She found that the triplet decay rate for a helix forming peptide with a cyclic disulfide and a tryptophan at the ends is biexponential, which was readily explained by a three-state model with excited tryptophan in the helix and coil state and ground state tryptophan in the coil state (Figure 6).47 The eigenvalues and two-state equilibrium constant for this model yielded helix formation and dissociation rates very similar to values obtained by T-jump.47
Figure 6.
Kinetic model for measuring helix–coil rates for a 22-residue alanine-based peptide with tryptophan at one end and a cyclic disulfide (cds) at the other, which quenches the tryptophan triplet state in a diffusion-limited reaction. The model assumes two conformational states, helix and coil, and two electronic states, the triplet excited state and the ground state of tryptophan with the assumption that the helix–coil rates are the same in ground and excited. The eigenvalues of this model obtained from the biexponential decay of the tryptophan triplet state, together with the helix–coil equilibrium constant yields the coil to helix and helix to coil rates, as well as the diffusion limited end-to-end contact rate.47 Decay of the tryptophan triplet in the helix is so slow compared to the coil triplet that it is not considered.
Postdoctoral fellow Marco Buscaglia extended Lisa’s method to proteins. He determined the end-to-end contact rate for the unfolded cold shock protein, CspTm, and found an increasing contact rate as the denaturant concentration decreased, indicating collapse of the protein as observed in single molecule FRET experiments by Ben Schuler and Everett Lipman discussed later.48 Marco also extended earlier work on the Ala-Gly-Gln peptide by studying decay rates at high denaturant concentration. His results showed that chain flexibility is increased by denaturant, which was explained by a decrease in the persistence length from 0.6 to 0.4 nm in a worm-like chain model.49
Many intramolecular contact measurements on peptides of varying composition were made by other groups using extrinsic optical probes, most notably those of Werner Nau50 and Thomas Kiefhaber.51 The net result of all of these measurement by us and by the other groups is that, apart from glycine- or proline-rich sequences, intramolecular contact rates are rather insensitive to the amino acid composition of peptides. For peptides containing tryptophan and a homopolymer of 6 other amino acids, for example, almost all contact rates for different amino acids differ by less than a factor of 5.52
Refining the “Speed Limit” and Ultrafast Folding Proteins
The speed limit suggested from the work on cytochrome c above was estimated as the time required to form an intramolecular contact to form a disordered loop for a segment of an unfolded polypeptide 10-residues in length. Subsequent measurements of rates for basic structural elements of proteins by us and by several other groups resulted in an alternative estimate. Disordered loops between 10 and 100 residues formed in ∼0.1–1 μs.46,51−53 α helices formed in ∼0.5 μs,25,54 and β hairpins, in ∼5 μs.31,55 So, a purely empirical view of the speed limit for folding is that the rate is determined by the slowest forming stable element. Theoretical estimates of the speed limit were also made by estimating the pre-exponential factor and arguing that it corresponds to the “downhill” scenario of Wolynes and co-workers when folding occurs with no free energy barrier.56 For a 100-residue protein, for example, a pre-exponential factor of ∼1 μs could be obtained from the measured folding rate and the free energy barrier height calculated from a theoretical model. An additional interesting theoretical result by Estelle Pitard and Henri Orland is that the collapse time scales linearly as the number of monomer units, n.57 These considerations suggested a simple formula for the speed limit of (n/100) in microseconds, which is probably accurate to better than a factor of 10, with α proteins folding faster and β slower.58
One obvious significance of the speed limit is in the search to find proteins that are prime candidates for enabling direct comparisons between experimental folding kinetics and kinetics obtained from atomistic molecular dynamics simulations. The not so obvious significance is that the disappearance of the free energy barrier at the speed limit would result in the Wolynes “downhill scenario”.56 This scenario would allow observation of intermediates conformations at all positions along the reaction coordinate, unlike folding with barriers where only the populations of the fully folded and fully unfolded states can be observed. The speed limit therefore provided a target rate for engineering fast-folding proteins by site-directed mutagenesis to make them fold even faster. Proteins in the list in Kubelka et al.58 that fold faster than 100 μs were subsequently investigated in the first extensive all-atom molecular dynamics study by David Shaw and co-workers using their special purpose computer, Anton I.59 All these proteins could, in principle, be engineered to fold at a rate 20-fold to more than 100-fold faster.
Villin Subdomain Sets Speed Record and Replaces β Hairpin as Benchmark
Having focused our experimental effort almost exclusively on protein structural elements and polypeptide chains of denatured proteins in ensemble experiments, with the arrival of postdoctoral fellow Jan Kubelka we moved on to T-jump studies of actual protein folding. Jan selected the 35-residue villin subdomain because it was known to be the smallest naturally occurring polypeptide that folds autonomously without disulfide bonds or ligand binding and has equilibrium properties comparable to those of much larger single-domain proteins.60 In addition, because of its small size and helical secondary structure, it was assumed to be a very fast folder and had already been the object of atomistic molecular dynamics simulation studies.61 In his first study, Jan measured a folding time of 4 μs, making it the fastest folding protein at the time and not all that far from the predicted speed limit of (0.35 μs)−1.62 He also provided one of the first important tests of atomistic molecular dynamics simulations by showing that replacement of the C-terminal phenylalanine with alanine had no effect on the rate, in contrast to the increased rate predicted by MD simulations.
Determination of the X-ray structure of the villin subdomain by the group of my close colleague, David Davies, indicated a way to make the protein fold faster by replacing the lysines with norleucines (norleucine is lysine without the terminal amino group) to remove two repulsive interactions (Figure 7a).63 Jan’s T-jump experiments gave a folding rate of (0.7 μs)−1 (Figure 7b), only 2-fold slower than the theoretical speed limit,64 and was given the name “super villin” by Vijay Pande. Such a fast rate suggested that the barrier must be small, which is consistent with the estimate of free energy barrier heights for the wild-type of ∼0.5–2 kcal/mol by three different analyses of calorimetric data.65
Figure 7.
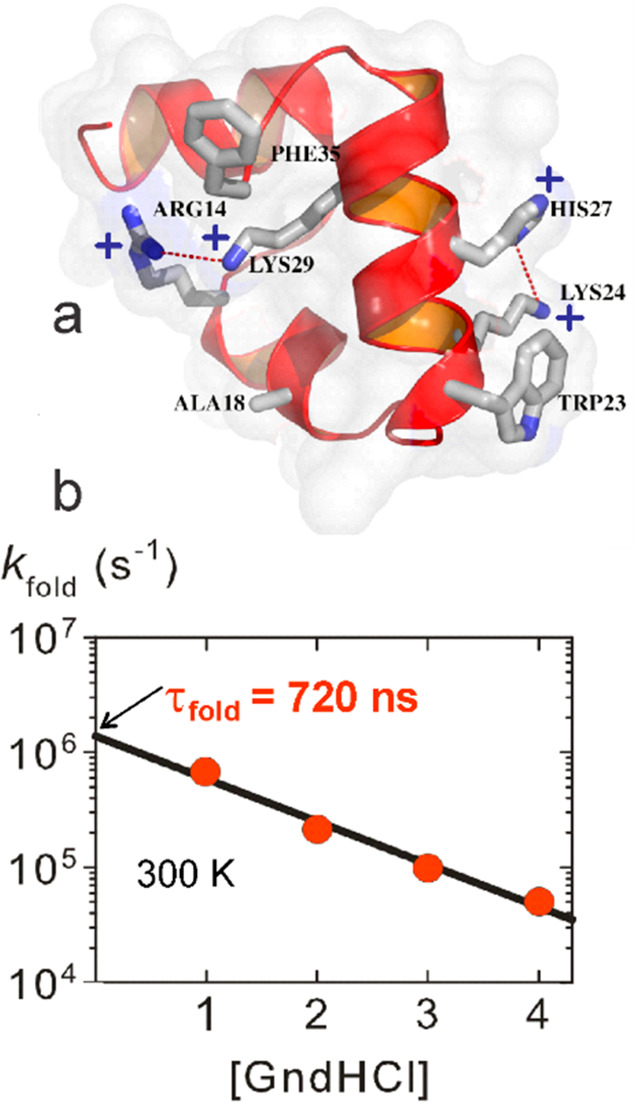
Super villin. (a) Structure showing the two buried lysines at positions 24 and 29 that make repulsive interactions with protonated his27 and arg14. The lysines are replaced with norleucine in super villin. (b) Folding rate for super villin as a function of molar denaturant concentration measured by laser T-jump with monitoring by tryptophan fluorescence at position 23.
Subsequently, Marco and postdoctoral fellow Troy Cellmer did a very important set of experiments to compare folding rates for super villin determined by monitoring tryptophan fluorescence in laser T-jump experiments and the independent method of determining the folding rate by measuring the decay of the tryptophan triplet as was done with the three-state kinetic model that was used for the α helix (Figure 6).66 The two methods produced rates in near perfect agreement (Figure 8a). Even more convincing is the comparison with the study of Feng Gai and co-workers,67 which showed that the rate determined from observation of the vibrational frequency shift of the amide I band due to helix formation, a global probe of folding, is in very good agreement with the fluorescence measurements that monitor local conformation (Figure 8b).
Figure 8.
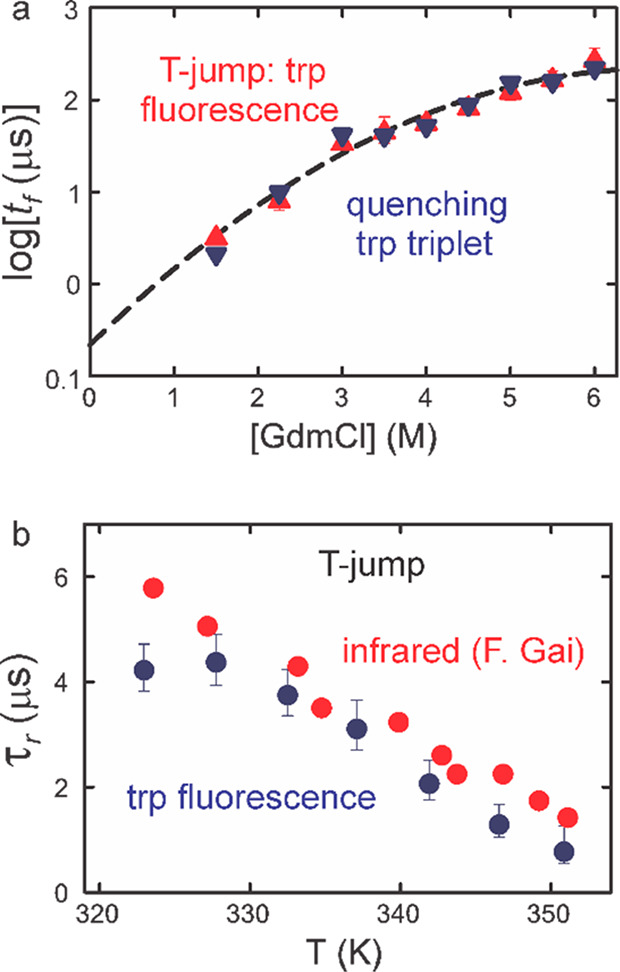
Comparison of folding times measured by laser temperature jump and tryptophan triplet quenching at 283 K. (a) Folding times (points) for super villin as a function of GdmCl concentration and a quadratic fit to all the data (dashed line). The triangles (red points) correspond to folding times measured by temperature jump from experiments on Cys HP35(Nle24,His27,Nle29), whereas the inverted triangles (blue points) are folding rates from the triplet-quenching experiment performed on Cys-HP35(Nle24,Nle29). (b) Comparison of relaxation times for HP35(His27) measured in temperature-jump experiments using IR absorption by Fen Gai and co-workers (red circles)67 or fluorescence (blue circles) detection measured by Troy Cellmer.66
Villin-subdomain folding exhibited two additional unusual properties: relaxation rates that do not change with denaturant concentration68 and ϕ values that are close to zero but increase considerably at high temperature.69 Because of its small size, very fast folding, and novel properties, this mini-protein replaced the β hairpin as the benchmark for simulation studies. Moreover, the measurement of so many different equilibrium and kinetic properties motivated in-depth theoretical investigations using three different kinetic models, including a version of the Muñoz Ising-like model that was considerably improved by Eric Henry.70 A conventional chemical kinetics model used kinetic and equilibrium data to obtain ϕ values that give structural information on the transition state ensemble. A physical kinetics model that describes the kinetics as diffusion on a one-dimensional free energy surface produced a free energy barrier to folding of ∼2 kcal/mol. The Ising-like theoretical model also yielded the results of these two models, as well as explaining a wide range of data, and provided a residue-by-residue description of the evolution of the folded structure with fewer adjustable parameters than either the chemical- or physical-kinetics models. A brief description of the Ising-like model and its application to the villin subdomain follows.
Munoz–Henry–Eaton Theoretical Model and Application to the Villin Subdomain
The outline of the model is shown in Figure 9. The most basic postulate of the model is that only residue–residue interactions in the native, folded structure must be explicitly considered, as in the “perfectly funneled” energy landscape.56,71 These interactions are specified by the α-carbon contact map, which for the villin subdomain is rather sparse (Figure 9). The model is called Ising-like because each residue adopts only two conformations, native (n) and non-native (c), as in the model of Zwanzig, Bagchi, and Szabo.72 A major difference from the standard Ising model is that interactions are not considered between nearest and next-nearest neighbors because they are assumed to be the same in the folded and unfolded states. A second major postulate is the so-called double-sequence approximation, in which structure in an individual molecule grows in no more than two regions of the amino acid sequence, although it could be generalized to more. The double sequence approximation is an enormous simplification because it permits a partition function that exactly enumerates all possible states, which for the 35-residue villin subdomain reduces the number of possible configurations from 235 (∼1010) to ∼105. Both the native-only interaction and double sequence postulates were supported by an analysis by Robert Best and Gerhard Hummer of the all-atom MD simulations of the Shaw group for the villin subdomain, as well as for eight other proteins that were simulated.73 This analysis showed that non-native contacts play no role in the folding mechanism.73a A complementary lattice model study by Phillip Geissler showed that non-native contacts only slowed folding and did not affect mechanism.74 The final simplifying postulate of the model is that all residue–residue interactions have the same energy (ε) and that the conformational entropy change (Δsconf) for the c to n transition is the same for all residues.
Figure 9.
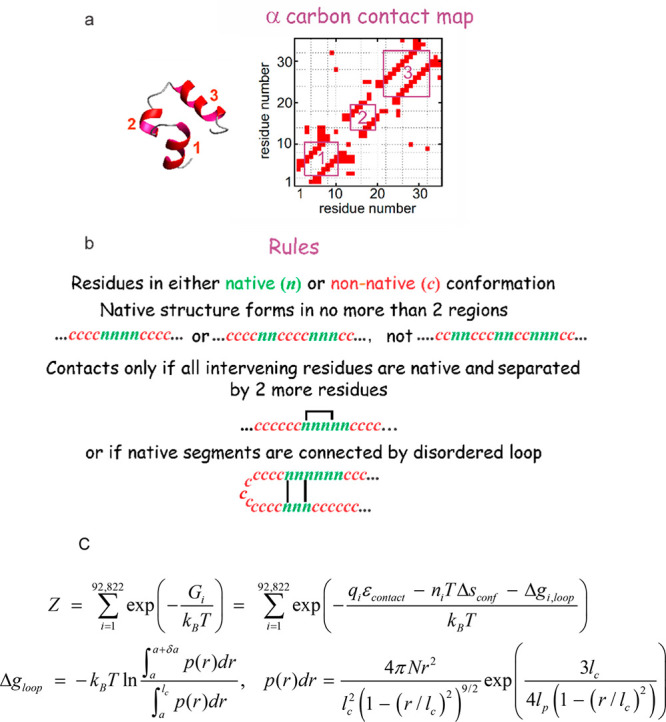
Outline of Muñoz–Henry–Eaton Ising-like, statistical mechanical theoretical model for protein folding. (a) α-carbon contact map. Only α-carbons of residues in contact in the native, folded structure are explicitly considered. (b) Rules of the model. Residues are in either a native (n) or a non-native (coil, c) conformation. Native structure nucleates and grows in no more than 2 regions of the sequence (the double sequence approximation). Since contacts between nearest and next-nearest neighbors are assumed to be the same in the folded and unfolded states, contacts are only considered that form between residues distant by more than 2 residues in the sequence and only if all intervening residues are in the native conformation, with one exception. The exception is that contacts are allowed if the intervening sequence forms a disordered loop. (c) Schematic partition function indicating that there is only a single adjustable energy parameter (εcontact) and a single adjustable conformational entropy parameter Δsconf) no matter the residue type. The free energy of loop formation was calculated from Thirumalai’s formula for the radial distribution function of a semiflexible chain,75 which contains the contour length of the disordered loop (lc), a persistence length, lp = 0.4 nm, and a contact radius, a = 0.1 nm.73b
Unlike any other theoretical
model proposed to date, the Ising-like
model is capable of explaining a wide variety of kinetic and equilibrium
data with very few adjustable parameters, as shown in Figure 10. Perhaps the most impressive
is the close fit to the excess heat capacity calculated from calorimetric
data (Figure 10a)
from the partition function  with just two temperature-independent
adjustable
parameters, εcontact and Δsconf. Except for the circular dichroism
(CD) data (Figure 10b), which requires six adjustable parameters to fit the data because
of the short helices and the strong length dependence of helical CD,
all of the other data sets require just a few. Since the temperature
dependence of free tryptophan fluorescence is known, the fluorescence
data (Figure 10c)
can be fit by adjusting the temperature dependence of the tryptophan
fluorescence quantum yield in the folded state. The free energy profile
(Figure 10d) is determined
from the relative probability of finding a state at each value of
the reaction coordinate. Rates are calculated as diffusion on the
free energy profile with either the number of residues in the native
conformation76 or the fraction of native
contacts as reaction coordinates (Figure 11).77 Diffusion
along the profile is simulated by hopping forward or backward between
adjacent values of the reaction coordinate, biased by the free energy
difference using a linear free energy relation for the rate that most
closely mimics diffusion. The viscosity dependence of the proportionality
constant, the hopping parameter, is determined from the buried surface
area with the assumption that buried residues are not subject to the
solvent viscosity but to the internal viscosity of the protein. The
resulting theoretical curve is very close to the measured relaxation
rates. A much more demanding test of a theoretical model than reproducing
rates (Figure 10e)
is to reproduce the fluorescence amplitudes, which the model does
quite impressively using the fluorescence parameters from fitting
the equilibrium curve (Figure 10f).
Figure 10.
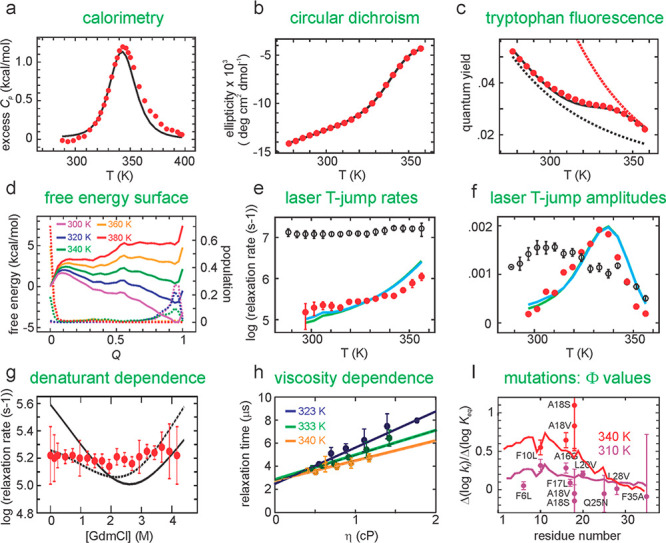
Calculation of experimental quantities from Muñoz–Henry–Eaton Ising-like model. See text for description and legend to Figure S4 in the Supporting Information of ref (73b).
Figure 11.
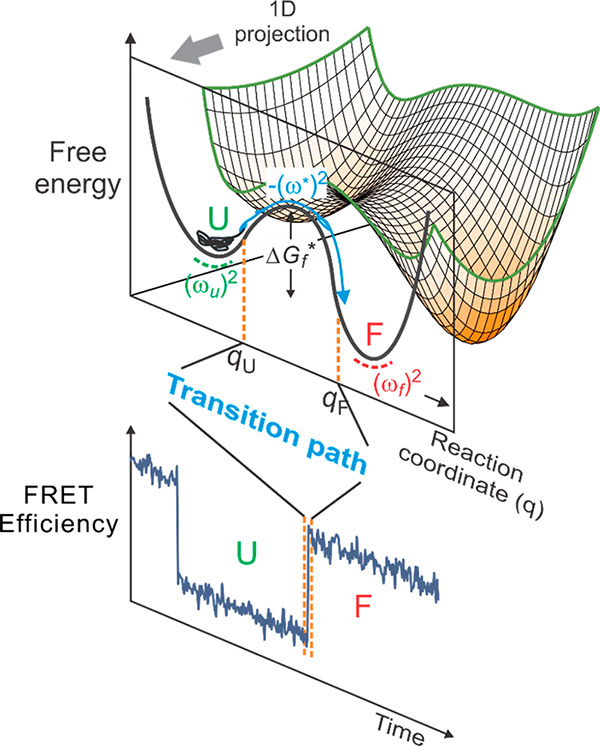
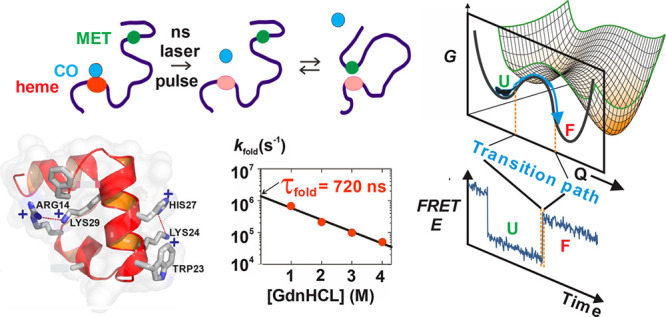
Free-energy surface of protein folding.80 Protein folding can be described as diffusion on a low-dimensional free energy surface with order parameters as reaction coordinates and has been described successfully as diffusion on a 1D free energy surface,81 here projected onto the coordinate q. For a two-state protein, the folded and unfolded states are separated by a free energy barrier with the height of ΔGf*. (ωu)2, (ωf)2, and (ω*)2 are curvatures at the bottom of the unfolded and folded state wells and at the top of the barrier, respectively. An unfolded molecule spends the vast majority of time fluctuating in the unfolded state before making a very rapid transition to the folded state, corresponding to the rapid crossing over the free energy barrier. The transition path is that part of the molecular trajectory that leaves a position qU on the unfolded side of the barrier and reaches qF on the folded side without recrossing qU (blue portion of the trajectory).82 The transition path appears as a near-instantaneous jump in a binned FRET efficiency trajectory (bottom).
Perhaps the most unusual property of the villin subdomain is the denaturant independence of the relaxation rate, rather than the usual chevron-shaped dependence observed for every other protein. The model produces a chevron that is far from the data. However, using the denaturant dependence of the hopping parameter found by Schuler and co-workers for the relative diffusion coefficient of the chains ends of an unfolded protein,78 the chevron is flattened and is much closer to the experimental data. The viscosity dependence of the rate, again scaling the dependence on the solvent from the fraction of residues that are not buried, is well-fit with a single temperature independent parameter of 4 cP for the protein internal viscosity. Another strikingly unique property of the villin subdomain kinetics is the finding of very low ϕ values, which become significantly larger at higher temperature (Figure 10i). This change is readily explained by free energy profiles at different temperatures. At low temperatures the barrier peak is very early along the reaction coordinate where there is very little native structure and therefore low ϕ values, while at the elevated temperature, the barrier has moved to much later along the reaction coordinate and therefore much more native structure and higher ϕ values. It is important to point out that there is no other statistical mechanical model, i.e., a model with a partition function and master equation, that has been proposed that explains so many different kinds of experimental data in such a straightforward way. Our model has been called the Hückel model of protein folding,79 presumably because the model of Erich Hückel was very important in the early days of molecular orbital theory for using a simple linear combination of atomic orbitals to explain π electron properties.
The mechanism from landscape theory shows that helices 1 and 2 form first, while helix 3 forms last (Figure 12a). Interestingly, the transition paths (Figure 11) observed in the Shaw simulations also show helices 1 and 2 forming first (Figures 11 and 12b).73b A more detailed comparison with the simulations was made by simulating the master equation of the Ising-like model to obtain the distribution of transition paths (Figure 12c).73b The simulation consisted of taking random steps between kinetically connected configurations with the probability determined by the ratio of the rate coefficient for the step divided by the sum of the rate coefficients for transitions to all connected configurations. The transition path for folding in the trajectories of the master equation simulation and the MD simulation is defined as that part of the trajectory when the molecule departs the unfolded free energy minimum of the unfolded state and reaches the folded state minimum without ever returning to the unfolded minimum (Figure 11).
Figure 12.

Mechanism of villin subdomain folding and comparison with molecular dynamics simulations. (a) Mechanism according to landscape theory. Probability that a residue is in its native conformation at each value of Q relative to all microstates at that value of Q. (b) Normalized distribution of transition path times from the 25 transitions of the MD simulations with estimated statistical uncertainty due to the small (25) number of transitions. (c) Normalized distribution of transition path times for 2 × 10⁶ transitions in the master equation simulations (no statistical uncertainty).
The transition path is clearly the most important segment of the trajectory because it contains all of the structural information on the folding mechanism. It should be realized that the transition state is only one position along the transition path corresponding to the barrier top, although it is a very important one. There are large statistical errors in the MD simulations because only 25 transition paths were calculated, while there is negligible statistical error in the Ising-like model simulations because the distribution was derived from 2 x 10⁶ trajectories (Figure 12b,c). There is an overall similarity of the Ising-like theoretical model and MD transition path distributions, and a reasonable probability (∼0.8) that the distribution in the MD simulations is sampled from a distribution identical to that of the theoretical model. Finally, I should emphasize that the transition path distribution should be considered the modern definition of folding mechanisms, but I should also point out that the description of a mechanism depends very much on the level of coarse graining. Discussing the mechanism in terms of the six possible orders of helix formation is the natural coarse graining for the villin subdomain mechanism, whereas the number of possible transition paths becomes astronomical if, for example, the mechanism is described in terms the order of forming every native dihedral angle and interatomic distance of the folded molecule.83
The transition path is a single molecule property, so it can only be observed by single molecule spectroscopic methods, which brings us to the next section.
Single Molecule FRET Spectroscopy: Early Experiments
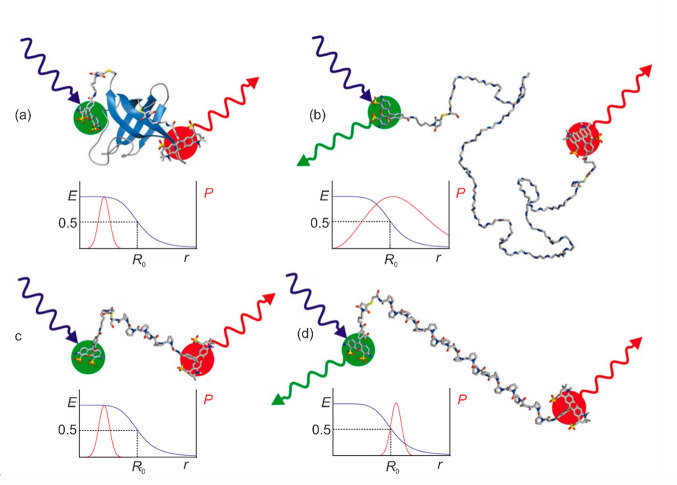
It was widely appreciated immediately after the first single molecule FRET experiments by Taekjip Ha and Shimon Weiss84 that measurements with this method could make important contributions to the study of protein folding. My interest in single molecule measurements was sparked when I saw a poster by Taekjip and Shimon at an ACS meeting where they detected molecules changing position on a glass surface from the change in intensity due to changes in the orientation of the electric dipole transition moment of the fluorophore relative to the linearly polarized excitation light.85 I was fortunately able to recruit Everett Lipman, an astrophysics Ph.D. student, who had all the skills to build a single molecule instrument and another postdoctoral fellow, Benjamin Schuler, a well-trained biochemist, who prepared highly purified, dye-labeled proteins and knew all about protein folding. Our first experiment with Everett’s instrument was extremely disappointing, because there was less emission from the acceptor fluorophore in the folded than in the unfolded state even though it had to be much closer to the donor in the folded state (Figure 13). It was most probably due to quenching of the “Texas Red” acceptor from interacting with aromatic residues on the surface of the folded protein. We then changed the fluorophores to Alexa dyes, which behaved beautifully, and we used these ever since. The first experiments were free diffusion experiments, in which molecules diffuse into the confocal volume of the microscope and, on the basis of the FRET efficiency, were assigned to either a folded or unfolded population (Figure 13).
Figure 13.
Schematic structures of protein and polyproline labeled with donor (Alexa 488) and acceptor (Alexa 594) dyes (from ref (86)): (a) folded CspTm; (b) unfolded CspTm; (c) 6-residue polyproline; (d) 20-residue polyproline. A blue laser excites the green emitting donor dye, which can transfer excitation energy to the red-emitting acceptor dye. In each case, the functional form of the FRET efficiency E versus distance (blue curves) is shown, as well as a representation of the probability distribution of distances between donor and acceptor dyes, P (red curves).
Although we were not watching proteins fold and unfold, there were nevertheless several interesting results.86 First, there were only two FRET efficiency distributions for the cold shock protein CspTm, consistent with the results of ensemble experiments that there are only two populations of molecules at equilibrium: folded and unfolded. Second, the FRET efficiency of the unfolded state decreases as the chemical denaturant concentration increases, indicating an expansion of the polypeptide chain. We also stretched the interpretation of the data to the limit by comparing widths of the FRET efficiency distributions for the unfolded protein and polyproline to estimate an upper bound on the reconfiguration time of 200 μs, and to use this result to estimate a lower limit on the free energy barrier height of 2 kBT.87 In doing so we made a blunder by inadvertently calculating this time from a formula different than what we reported in the paper. This mistake was immediately recognized on the day the paper appeared online by Taekjip Ha who telephoned me to say there was an error, which prompted us to immediately submit later pointed out in an erratum.87 Another problem with this paper is that we were unable to explain the large excess width over that expected from shot noise, although it did not affect any of our conclusions.
Our next single molecule experiment was motivated by the arrival of a new postdoctoral fellow, Olgica Bakajin, who brought expertise in microfluidics to the lab. The collaboration with Ben and Everett led to the first nonequilibrium single molecule folding experiment.88 In this experiment, the chemical denaturant was diluted from the unfolded molecules in a laminar flow mixing region, which were then flowed through a narrow channel (the single molecule microfluidic analogue of the Hartridge and Roughton continuous flow method for measuring fast chemical reactions 80 years earlier89). The FRET efficiency was monitored at different positions along the channel as individual molecules flowed by after mixing to remove chemical denaturant to initiate folding.88 The times were determined by the distance from the mixing region and the flow velocity. The results provided additional strong evidence for two-state behavior not only by showing only two FRET efficiency distributions but also by showing an exchange of the distributions as time progresses (Figure 14).
Figure 14.
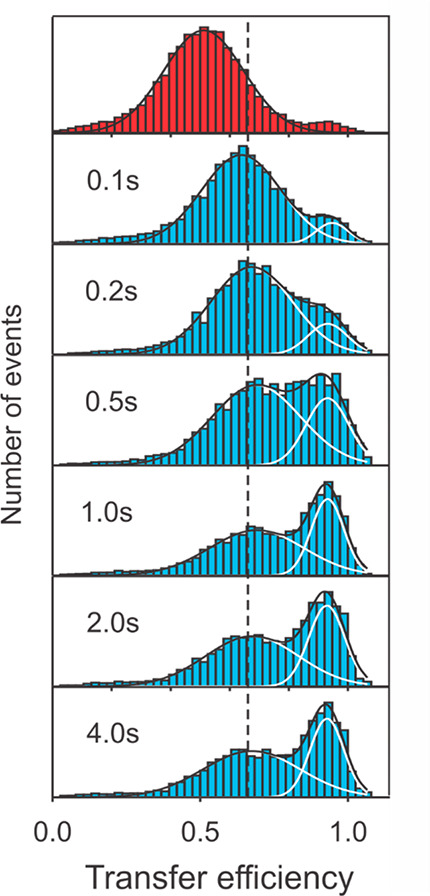
Nonequilibrium protein folding measured by single molecule spectroscopy in a microfluidic mixing device.88 Starting from CspTm unfolded at high denaturant concentration (top), transfer efficiency histograms are measured at different positions along the channel, corresponding to different times after mixing. The fits to Gaussians having the same peak position and width at all times illustrate the redistribution of populations expected for a two-state system after the initial chain collapse as shown by the increase of the FRET efficiency in the unfolded state at the lower denaturant concentration.
Two issues raised in Ben’s and Everett’s 2002 Nature paper were pursued further, one about polyproline and one about expansion of the unfolded state by denaturants. Assuming that polyproline is a perfectly rigid rod, Lubert Stryer used FRET measurements on polyprolines of different length to demonstrate Förster’s prediction of a 1/r6 dependence of the excitation energy transfer rate on distance.90 Since single molecule FRET was being used by many groups to obtain distance information on biological macromolecules, it seemed important to redo Stryer’s experiment at the single molecule level. The experiments gave the puzzling result of FRET efficiencies much higher than expected from Förster theory for polyproline with lengths of 6–40 residues. Molecular dynamics simulations attributed the higher FRET efficiencies to a flexibility of the molecule (i.e., a smaller persistence length) than previously thought, which would bring the ends closer together and account for the high FRET efficiencies. However, there were two flaws in this initial study. One was the assumption that all of the residues of polyproline in water are in the all-trans conformation to produce a straight rod and the other was an artifact caused by inappropriate parameters in the MD simulations, which led to an apparent increase in the flexibility.
Thanks to Ben for telling me about a new instrument built and sold by PicoQuant, a Berlin company, Kiyoshi Mizuuchi, my colleague in Building 5, acquired one and kindly gave me effectively 100% use of it. We now had a powerful, user-friendly single molecule instrument. Both of the above flaws were corrected by a new postdoc, Robert Best, using the PicoQuant instrument and performing NMR experiments in collaboration with Ad Bax, which showed that ∼30% of polyproline molecules in water are kinked because of cis prolines bringing the donor and acceptor dyes closer together. Robert’s very careful single molecule study was able to explain the observed FRET efficiency of polyproline 20 after accounting for differences in detector sensitivity for donor and acceptor photons, for differences in fluorescence quantum yield of donor and acceptor fluorophores, and for the effect of the cis-polyproline population and using molecular dynamics simulations, including the attached fluorophores with their long linkers, to determine distance distributions.91 His simulations also indicated that the failure of Stryer and Haugland to fit their data with the known Förster radius (R0) for their donor and acceptor was due to flexibility of the linkers. This study strongly reinforced the idea that accurate distances can indeed be obtained from single molecule FRET studies.
Robert also collaborated with Irina Gopich and another postdoc, Kusai Merchant, in a study of two proteins of almost identical size, the 66-residue all-β CspTm and the 64 residue α/β protein L, which showed clear expansion of the unfolded protein with increasing GdmCl concentration (Figure 15).93 Irina, who developed the theory of single molecule fluorescence experiments with Attila, ensured that the most rigorous analysis of the data possible was being performed and therefore the most accurate FRET efficiencies possible up to that time for any protein were being obtained. Robert also performed molecular dynamics simulations, which showed that urea denaturant causes expansion of the unfolded protein, as expected from Dave’s theoretical considerations.94 The Merchant/Best paper contributed to sparking a debate on the denaturant expansion of a polypeptide and differences between the radius of gyration obtained from FRET with a Gaussian chain assumption and from small-angle X-ray scattering. The controversy was finally settled by Robert and Ben.95,96 Denaturants do expand unfolded proteins, as predicted by Dave’s theory.
Figure 15.
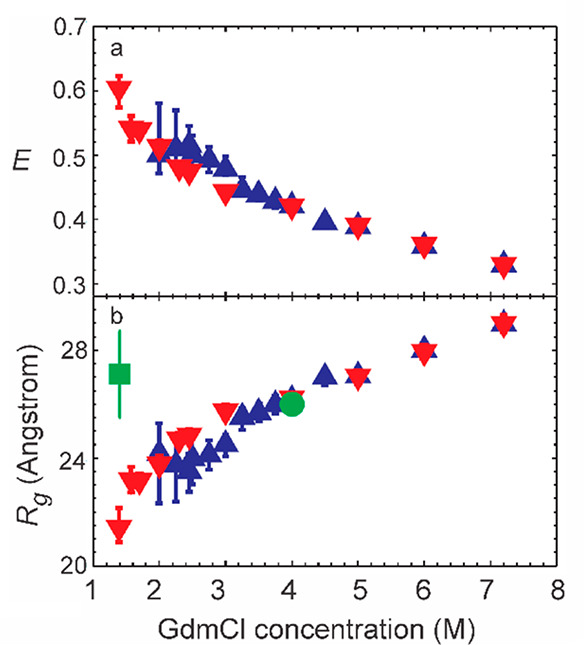
Expansion of polypeptide by chemical denaturant. (a) Mean FRET efficiencies E for the unfolded states of protein L (blue triangles) and CspTm (red inverted triangle). (b) Radii of gyration (Rg) for protein L and CspTm in the unfolded state determined from FRET efficiencies and assuming a Gaussian chain model for the end-to-end distribution. The Rg values previously determined by equilibrium SAXS at 4 M GdmCl (green circle) and by time-resolved SAXS at 1.4 M GdmCl (green square) are also shown.92
Single Molecule FRET Spectroscopy: Transition Path Times
Ben and Gilad Haran made the first attempt at measuring transition path times for single protein molecules undergoing folding/unfolding transitions.97 I did not attempt such measurements until Hoi Sung Chung joined my group in 2007. He immediately attacked this very challenging problem. Recall from above that the transition path is the tiny fraction of an equilibrium single molecule trajectory when the process actually happens, i.e., the rare barrier crossing event (seen as an apparently instantaneous “jump” in single molecule trajectories) (Figure 11). Again, the reason that the transition path is so important is that it contains all of the information on the folding mechanism. The transition path is a uniquely single molecule property that had not been previously measured for any molecular system. We knew it was going to be difficult to obtain any information at all, because we already had indications from molecular dynamics calculations that transition path times for small proteins are extremely short.
The first problem Hoi Sung faced was to attach a protein to a surface in a way that did not change its folding/unfolding properties and to address all of the potential artifacts that had already been observed in experiments by others attempting to measure single molecule folding/unfolding trajectories. With the PicoQuant instrument it was possible to characterize each detected photon by its color, polarization, and time of arrival after picosecond excitation. Hoi Sung determined distributions of FRET efficiencies, donor and acceptor lifetimes, steady state polarizations, and waiting times in the unfolded and folded states that yielded the folding and unfolding rate coefficients, respectively. Unlike what happens in single molecule atomic force microscopy, where most trajectories are uninterpretable and discarded, Hoi Sung’s goal was to explain every trajectory and not discard any, which he managed to do for 95% of his measured trajectories. By performing a statistical analysis of the duration of the window between folded and unfolded states in photon trajectories, he estimated an upper bound of ∼200 μs on the average transition path time.98 Even though only an upper bound, this result was interesting because it was 10 000-times shorter than the folding and unfolding waiting times. These experiments motivated Irina and Attila to develop a much more powerful method to extract average transition path times from photon trajectories consisting of donor and acceptor photons and the interval between them (τk).99 Their likelihood function is
in which Nj is the number of photons in a trajectory, ci is the color of the ith photon (donor or acceptor), and τk is a time interval between the ith and (i – 1)th photons. The photon color matrix F depends on the color of a photon as F (acceptor) = E and F (donor) = I – E, where E is a diagonal matrix with elements that are FRET efficiencies of the individual states, peq is a vector consisting of the equilibrium population of each state, and 1T is a row vector with elements of 1.
The basic idea of their method is that given a kinetic model, i.e., the number of states and their kinetic connectivity, the parameters that maximize the value of the likelihood function correspond to the optimal values for the FRET efficiency of each state and rate coefficients of the model that are most consistent with the photon trajectory.99 Because trajectories are short as a result of dyes rapidly photobleaching at the high required illumination intensities, Hoi Sung realized that to directly measure transition path times would require collectively analyzing data from a very large number of trajectories. In single molecule studies on fast-folding proteins, where many transitions could be observed, Hoi Sung demonstrated that the Gopich–Szabo method yields accurate rate coefficients.100 This work was followed by a heroic effort in which Hoi Sung collected tens of thousands of photon trajectories and carried out the photon-by-photon analysis (Figure 16). He succeeded in directly measuring a transition path time of ∼2 μs for a small all-β protein, the FBP WW domain, that folds in 100 μs and to place an upper bound of ∼10 μs on the transition path time for the much slower folding protein GB1.101
Figure 16.
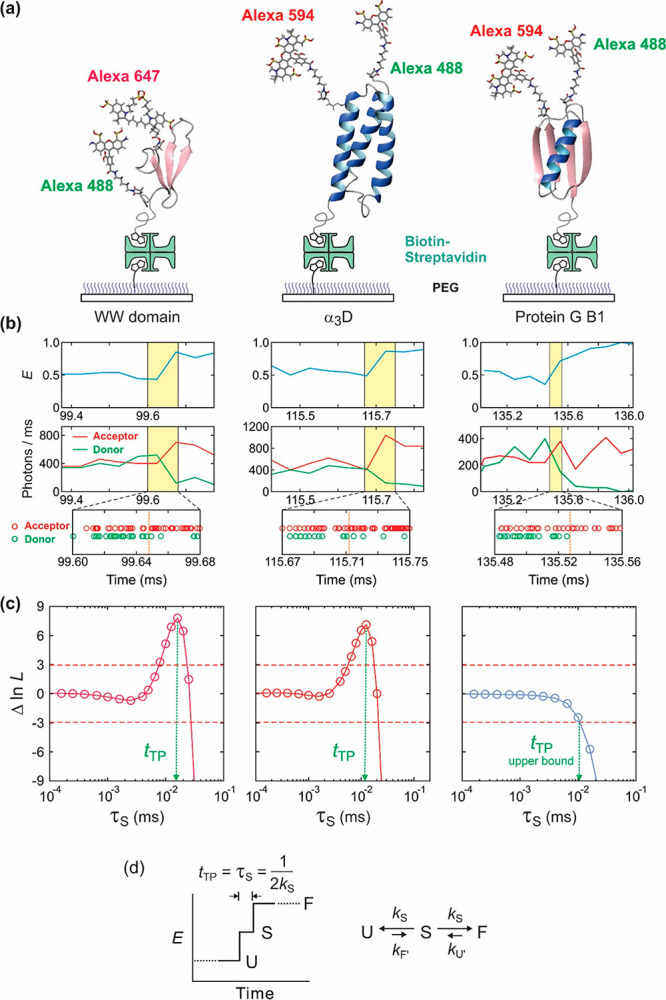
Average transition path time measurements for folding the FBP28 WW domain, α3D, and protein GB1. (a) Proteins are labeled with a donor (Alexa 488) and an acceptor (Alexa 594 or Alexa 647) dye and immobilized on a polyethylene glycol-coated glass surface with a biotin–streptavidin linker. (b) Binned donor and acceptor fluorescence trajectories and photon trajectories near the folding transition (highlighted in yellow). (c) Transition path time determined by analyzing photon trajectories in the yellow transition region using the Gopich–Szabo maximum likelihood method with a three-state model. The average transition path time (tTP) is equal to the lifetime of a virtual intermediate state S (τS), which is determined from the maximum in the difference of the log likelihood, Δln L = ln L(τS) – ln L(0). L(0) is the likelihood for a two-state model, in which transitions are instantaneous (τS = 0). The plot displays how much better (or worse) a two-state model with a finite transition-path time describes the photon trajectories than a two-state model with an instantaneous transition. The transition path time of the WW domain is 16 μs (at the viscosity of 10 cP). The transition path time of α3D (12 μs) was measured without increasing solvent viscosity (see discussion below and Figure 17). Only the upper bound for the transition path time of 10 μs could be determined for GB1 because no peak is observed. (d) Schematic of a FRET efficiency trajectory using a two-step mechanism to describe the transition path from unfolded (U) to folded (F) states for a protein exhibiting two-state thermodynamics and kinetics. In this model, the average transition-path time (⟨tTP⟩) is equal to the lifetime of a virtual intermediate state S [(2kS)−1].
These experiments yielded the surprising result that the WW domain and Protein GB1, with folding rates that differ by 4 orders of magnitude, take almost the same time to fold when folding actually happens, i.e., cross the barrier between the folded and unfolded states (∼2 μs for the WW domain after correcting for the viscosity; <10 μs for protein GB1).101 However, the result was not surprising to Attila, who derived an approximate expression for the average time to cross a high parabolic barrier, showing that compared to the Kramers folding rate, which depends on the exponential of the barrier height, the average transition path time depends logarithmically, so it is relatively insensitive to the barrier height.82,102
Attila’s equation predicts that if all of the difference in folding times arises from differences in the free energy barrier heights, then for identical values of the parameters in the pre-exponential and prelogarithmic factors, the average transition path times would differ by a factor of only 1.4, compared to our experimentaly-determined factor of less than 5.
The designed protein α3D is an interesting case where large changes in rates occur without a change in the free energy barrier height. At pH 7.5, there are two distinct FRET efficiency distributions (Figure 17). The folding rate shows a very weak viscosity dependence, suggesting a large contribution to the landscape diffusion coefficient from internal friction. Examination by Robert of the structures during the transition path in the Shaw simulations, showed many non-native salt bridges between the helices. Non-native contacts are theoretically predicted to be more important for the kinetics and dynamics of designed proteins than for naturally evolved protein.103 Suspecting that these salt bridges were the source of internal friction, Hoi Sung eliminated them by lowering the pH to protonate the carboxyl groups. Not only did the folding rate speed up by a factor of ∼10, without changing the equilibrium constant, but also the viscosity dependence become very close to that measured by Gouri Jas for an isolated helix.39 In addition, the transition path time also increased, leading to the conclusion that all of the 10-fold speed up in the folding rate could be accounted for from an increased landscape diffusion coefficient. Extensive simulations by Stefano Piana-Agostinetti using Anton2 also found that protonating carboxyls increased the diffusion coefficient for motion along Q as a reaction coordinate.104
Figure 17.
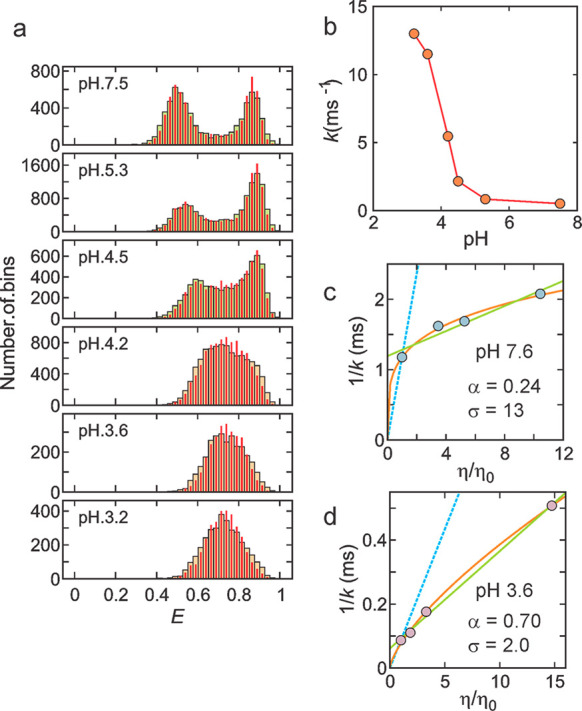
pH and viscosity dependence of α3D folding kinetics close to the chemical denaturant midpoint.104 (a) FRET efficiency histograms as a function of pH determined from 1 ms bin times. At high pH, 2 distributions are observed because the folding/unfolding times are longer than the 1 ms bin time, so 2 FRET efficiency distributions are resolved. At low pH, folding/unfolding times are shorter than the bin time, so many transitions occur within the bin time and only a single distribution is observed. The concentrations of urea are 5 M at pH 7.5 and 6 M at all other pH’s. The near-identity of the measured histograms (wide bars) and the histograms constructed from recolored photon trajectories (red narrow bars), using the parameters obtained from the Gopich–Szabo maximum likelihood method with the two-state model, indicate that this model is adequate.99,100 (b) pH dependence of relaxation rate, k. (c and d) Viscosity dependence of the inverse of the relaxation rate at pH 7.6 (c) and at pH 3.6 (d) under conditions where the stability is only slightly altered. The data were fitted to the power-law function of (η/η0) (orange) or a linear equation A(σ + η/η0) (green),38a where A is an amplitude and σ is the internal viscosity, which reflects the internal friction. The blue dashed lines show the dependence expected when the relaxation times are proportional to the first power of the solvent viscosity.
Acknowledgments
The work that I have described in this article was done in collaboration with senior investigators in the Laboratory of Chemical Physics, Robert Best, Irina Gopich, Eric Henry, James Hofrichter, Gerhard Hummer, and Attila Szabo and a wonderful group of postdoctoral fellows: Olgica Bakajin, Robert Best, Marco Buscaglia, Troy Cellmer, Hoi Sung Chung, Stephen Hagen, Gouri Jas, Colleen Jones, Jan Kubelka, Lisa Lapidus, Everett Lipman, Victor Muñoz, Benjamin Schuler, and Peggy Thompson. I profited enormously in this work from discussions with many theorists other than Best, Hummer, and Szabo, especially Roland Netz, José Onuchic, Henri Orland, Eugene Shakhnovich, Dave Thirumalai, and Peter Wolynes. This research was supported by the Intramural Program of the National Institute of Diabetes and Digestive Diseases of the National Institutes of Health. I thank Robert Best, Hoi Sung Chung, and Attila Szabo for their comments on the manuscript.
Biography

Photograph by Eric Branson
William Allen Eaton has a B.A. in Chemistry, an M.D., and a Ph.D. in Molecular Biology with Robin M. Hochstrasser as his supervisor, all from the University of Pennsylvania. Apart from one semester teaching physical chemistry at Harvard, he has been at the National Institutes of Health in Bethesda since 1968, where he is now an NIH Distinguished Investigator and Chief of the Laboratory of Chemical Physics, NIDDK. His research has focused on the physical chemistry of protein folding, hemoglobin allostery, and sickle cell disease.
The author declares no competing financial interest.
Special Issue
Published as part of The Journal of Physical Chemistry virtual special issue “Dave Thirumalai Festschrift”.
References
- Eaton W. A. Autobiography of William A. Eaton. J. Phys. Chem. B 2018, 122 (49), 10974–10980. 10.1021/acs.jpcb.8b06737. [DOI] [PubMed] [Google Scholar]
- Monod J.; Wyman J.; Changeux J. P. On Nature of Allosteric Transitions: a Plausible Model. J. Mol. Biol. 1965, 12 (1), 88–118. 10.1016/S0022-2836(65)80285-6. [DOI] [PubMed] [Google Scholar]
- Perutz M. F. Stereochemistry of Cooperative Effects in Haemoglobin. Nature 1970, 228 (5273), 726–734. 10.1038/228726a0. [DOI] [PubMed] [Google Scholar]
- Austin R. H.; Beeson K. W.; Eisenstein L.; Frauenfelder H.; Gunsalus I. C. Dynamics of Ligand Binding to Myoglobin. Biochemistry 1975, 14 (24), 5355–5373. 10.1021/bi00695a021. [DOI] [PubMed] [Google Scholar]
- a Eaton W. A.; Hochstrasser R. M. Electronic Spectrum of Single Crystals of Ferricytochrome c. J. Chem. Phys. 1967, 46 (7), 2533–2539. 10.1063/1.1841081. [DOI] [PubMed] [Google Scholar]; b Eaton W. A.; Hochstrasser R. M. Single Crystal Spectra of Ferrimyoglobin Complexes in Polarized Light. J. Chem. Phys. 1968, 49 (3), 985–995. 10.1063/1.1670263. [DOI] [PubMed] [Google Scholar]
- a Eaton W. A.; George P.; Hanania G. I. H. Thermodynamic Aspects of the Potassium Hexacyano-Ferrate(III)-(II) System. I. Ion Association. J. Phys. Chem. 1967, 71 (7), 2016–2021. 10.1021/j100866a007. [DOI] [PubMed] [Google Scholar]; b Hanania G. I. H.; Irvine D. H.; Eaton W. A.; George P. Thermodynamic Aspects of Potassium Hexacyanoferrate System. 2. Reduction Potential. J. Phys. Chem. 1967, 71 (7), 2022–2030. 10.1021/j100866a008. [DOI] [PubMed] [Google Scholar]; c George P.; Eaton W. A.; Trachtman M. Heat and Entropy Changes Accompanying Oxidation of Cytochrome c. Fed. Proc. 1968, 27 (2), 526. [Google Scholar]
- a Eaton W. A.; Lewis T. P. Polarized Single Crystal Absorption Spectrum of 2-Methyl Uracil. J. Chem. Phys. 1970, 53 (6), 2164–2172. 10.1063/1.1674310. [DOI] [PubMed] [Google Scholar]; b Lewis T. P.; Eaton W. A. Polarized single crystal absorption spectrum of cytosine monohydrate. J. Am. Chem. Soc. 1971, 93 (8), 2054–2056. 10.1021/ja00737a039. [DOI] [PubMed] [Google Scholar]
- a Eaton W. A.; Charney E. Near infrared absorption and circular dichroism spectra of ferrocytochrome c. J. Chem. Phys. 1969, 51 (10), 4502–4505. 10.1063/1.1671818. [DOI] [PubMed] [Google Scholar]; b Eaton W. A.; Lovenberg W. Near Infrared Circular Dischroism of an Iron Sulfue Protein: d-d Transitions in Rubredoxin. J. Am. Chem. Soc. 1970, 92 (24), 7195–7198. 10.1021/ja00727a030. [DOI] [PubMed] [Google Scholar]; c Eaton W. A.; Palmer G.; Fee J. A.; Kimura T.; Lovenberg W. Tetrahedral Iron in Acitivity Center of Plant Ferrodoxin and Beef Adrenodoxin. Proc. Natl. Acad. Sci. U. S. A. 1971, 68 (12), 3015–3020. 10.1073/pnas.68.12.3015. [DOI] [PMC free article] [PubMed] [Google Scholar]
- William A.Eaton Festschrift. J. Phys. Chem. B 2018, 122 ( (49), ). [DOI] [PubMed] [Google Scholar]
- Gibson Q. H. Rapid Mixing: Stopped flow. Methods Enzymol. 1969, 16, 187–228. 10.1016/S0076-6879(69)16009-7. [DOI] [Google Scholar]
- Greene B. I.; Hochstrasser R. M.; Weisman R. B.; Eaton W. A. Spectroscopic studies of oxyhemoglobin and carbonmonoxyhemoglobin after pulsed optical exciation. Proc. Natl. Acad. Sci. U. S. A. 1978, 75 (11), 5255–5259. 10.1073/pnas.75.11.5255. [DOI] [PMC free article] [PubMed] [Google Scholar]
- Hofrichter J.; Sommer J. H.; Henry E. R.; Eaton W. A. Nanosecond Abslorption Spectroscopy of Hemoglobin: Elementary Processes in Kinetic ooperativity. Proc. Natl. Acad. Sci. U. S. A. 1983, 80 (8), 2235–2239. 10.1073/pnas.80.8.2235. [DOI] [PMC free article] [PubMed] [Google Scholar]
- Jones C. M.; Henry E. R.; Hu Y.; Chan C. K.; Luck S. D.; Bhuyan A.; Roder H.; Hofrichter J.; Eaton W. A. Fast Events in Protein Folding Initiated by Nanosceond Laser Photolysis. Proc. Natl. Acad. Sci. U. S. A. 1993, 90 (24), 11860–11864. 10.1073/pnas.90.24.11860. [DOI] [PMC free article] [PubMed] [Google Scholar]
- Hagen S. J.; Hofrichter J.; Szabo A.; Eaton W. A. Diffusion-Limited Contact Formation in Unfolded Cytochrome c: Estimating the Maximum Rate of Protein Folding. Proc. Natl. Acad. Sci. U. S. A. 1996, 93 (21), 11615–11617. 10.1073/pnas.93.21.11615. [DOI] [PMC free article] [PubMed] [Google Scholar]
- Szabo A.; Schulten K.; Schulten Z. 1st Passage Time Approach to Diffusion Controlled Reactions. J. Chem. Phys. 1980, 72 (8), 4350–4357. 10.1063/1.439715. [DOI] [Google Scholar]
- a Camacho C. J.; Thirumalai D. Theoretical Predictiions of Folding by Using the Proximity Rule with Applications to Bovine Pancreatic Trypsin Inhibitor. Proc. Natl. Acad. Sci. U. S. A. 1995, 92 (5), 1277–1281. 10.1073/pnas.92.5.1277. [DOI] [PMC free article] [PubMed] [Google Scholar]; b Guo Z. Y.; Thirumalai D. Kinetics of Protein Folding: Nucleation Mechanisms, Time Scales, and Pathways. Biopolymers 1995, 36 (1), 83–102. 10.1002/bip.360360108. [DOI] [Google Scholar]
- McCammon J. A. A Speed Limit for Protein Folding. Proc. Natl. Acad. Sci. U. S. A. 1996, 93 (21), 11426–11427. 10.1073/pnas.93.21.11426. [DOI] [PMC free article] [PubMed] [Google Scholar]
- Eaton W. A.; Trommsdorff H. P. Robin Main Hochstrasser (1931–2013), Giant of Physical Chemistry. Proc. Natl. Acad. Sci. U. S. A. 2013, 110 (23), 9189–9190. 10.1073/pnas.1307692110. [DOI] [Google Scholar]
- Phillips C. M.; Mizutani Y.; Hochstrasser R. M. Ultrafast Thermally Induced Unfolding of RNAse A. Proc. Natl. Acad. Sci. U. S. A. 1995, 92 (16), 7292–7296. 10.1073/pnas.92.16.7292. [DOI] [PMC free article] [PubMed] [Google Scholar]
- Williams S.; Causgrove T. P.; Gilmanshin R.; Fang K. S.; Callender R. H.; Woodruff W. H.; Dyer R. B. Fast Events in Protein Folding: Helix Melting and Formation in a Small Peptide. Biochemistry 1996, 35 (3), 691–697. 10.1021/bi952217p. [DOI] [PubMed] [Google Scholar]
- Ballew R. M.; Sabelko J.; Gruebele M. Direct Observation of Fast Protein Folding: The Initial Collapse of Apomyoglobin. Proc. Natl. Acad. Sci. U. S. A. 1996, 93 (12), 5759–5764. 10.1073/pnas.93.12.5759. [DOI] [PMC free article] [PubMed] [Google Scholar]
- Beitz J. V.; Flynn G. W.; Turner D. H.; Sutin N. Stimulated Raman Effect: a New Source of Laser Temperature Jump Heating. J. Am. Chem. Soc. 1970, 92 (13), 4130–4132. 10.1021/ja00716a063. [DOI] [Google Scholar]
- Thompson P. A.; Eaton W. A.; Hofrichter J. Laser Temperature Jump Study of the Helix Reversible Arrow coil Kinetics of an Alanine Peptide Interpreted with a ‘Kinetic Zipper’ Model. Biochemistry 1997, 36 (30), 9200–9210. 10.1021/bi9704764. [DOI] [PubMed] [Google Scholar]
- Marqusee S.; Robbins V. H.; Baldwin R. L. Unusally Stable Helix Formation in Short Alanine-Based Peptides. Proc. Natl. Acad. Sci. U. S. A. 1989, 86 (14), 5286–5290. 10.1073/pnas.86.14.5286. [DOI] [PMC free article] [PubMed] [Google Scholar]
- Thompson P. A.; Munoz V.; Jas G. S.; Henry E. R.; Eaton W. A.; Hofrichter J. The Helix-Coil Kinetics of a Heteropeptide. J. Phys. Chem. B 2000, 104 (2), 378–389. 10.1021/jp990292u. [DOI] [Google Scholar]
- Takahashi S.; Ching Y. C.; Wang J. L.; Rousseau D. L. Microsceond Generation of Oxygen-Bound Cytochrome c Oxidase by Rapid Solution Mixing. J. Biol. Chem. 1995, 270 (15), 8405–8407. 10.1074/jbc.270.15.8405. [DOI] [PubMed] [Google Scholar]
- Regenfuss P.; Clegg R. M.; Fulwyler M. J.; Barrantes F. J.; Jovin T. M. Mixing Liquids in Microseconds. Rev. Sci. Instrum. 1985, 56 (2), 283–290. 10.1063/1.1138345. [DOI] [Google Scholar]
- Chan C. K.; Hu Y.; Takahashi S.; Rousseau D. L.; Eaton W. A.; Hofrichter J. Submillisecond Protein Folding Kinetics Studied by Ultrarapid Mixing. Proc. Natl. Acad. Sci. U. S. A. 1997, 94 (5), 1779–1784. 10.1073/pnas.94.5.1779. [DOI] [PMC free article] [PubMed] [Google Scholar]
- Shastry M. C. R.; Luck S. D.; Roder H. A continuous-flow capillary mixing method to monitor reactions on the microsecond time scale. Biophys. J. 1998, 74 (5), 2714–2721. 10.1016/S0006-3495(98)77977-9. [DOI] [PMC free article] [PubMed] [Google Scholar]
- Hagen S. J.; Eaton W. A. Two-State Expansion and Collapse of a Polypeptide. J. Mol. Biol. 2000, 301 (4), 1019–1027. 10.1006/jmbi.2000.3969. [DOI] [PubMed] [Google Scholar]
- Muñoz V.; Thompson P. A.; Hofrichter J.; Eaton W. A. Folding Dynamics and Mechanism of beta-Hairpin Formation. Nature 1997, 390 (6656), 196–199. 10.1038/36626. [DOI] [PubMed] [Google Scholar]
- Muñoz V.; Henry E. R.; Hofrichter J.; Eaton W. A. A Statistical Mechanical Model for Beta-Hairpin Kinetics. Proc. Natl. Acad. Sci. U. S. A. 1998, 95 (11), 5872–5879. 10.1073/pnas.95.11.5872. [DOI] [PMC free article] [PubMed] [Google Scholar]
- Muñoz V.; Eaton W. A. A Simple Model for Calculating the Kinetics of Protein Folding from Three-Dimensional Structures. Proc. Natl. Acad. Sci. U. S. A. 1999, 96 (20), 11311–11316. 10.1073/pnas.96.20.11311. [DOI] [PMC free article] [PubMed] [Google Scholar]
- Alm E.; Baker D. Prediction of Protein-Folding Mechanisms from Free-Energy Landscapes Derived from Native Structures. Proc. Natl. Acad. Sci. U. S. A. 1999, 96 (20), 11305–11310. 10.1073/pnas.96.20.11305. [DOI] [PMC free article] [PubMed] [Google Scholar]
- Galzitskaya O. V.; Finkelstein A. V. A Theoretical Search for Folding/Unfolding Nuclei in Three-Dimensional Protein Structures. Proc. Natl. Acad. Sci. U. S. A. 1999, 96 (20), 11299–11304. 10.1073/pnas.96.20.11299. [DOI] [PMC free article] [PubMed] [Google Scholar]
- Baker D. A Surprising Simplicity to Protein Folding. Nature 2000, 405 (6782), 39–42. 10.1038/35011000. [DOI] [PubMed] [Google Scholar]
- Klimov D. K.; Thirumalai D. Mechanisms and Kinetics of Beta-Hairpin Formation. Proc. Natl. Acad. Sci. U. S. A. 2000, 97 (6), 2544–2549. 10.1073/pnas.97.6.2544. [DOI] [PMC free article] [PubMed] [Google Scholar]
- a Ansari A.; Jones C. M.; Henry E. R.; Hofrichter J.; Eaton W. A. The Role of Solvent Viscosity in the Dynamics of Protein Conformational Changes. Science 1992, 256 (5065), 1796–1798. 10.1126/science.1615323. [DOI] [PubMed] [Google Scholar]; b Klimov D. K.; Thirumalai D. Viscosity Dependence of the Folding Rates of Proteins. Phys. Rev. Lett. 1997, 79 (2), 317–320. 10.1103/PhysRevLett.79.317. [DOI] [Google Scholar]
- Jas G. S.; Eaton W. A.; Hofrichter J. Effect of viscosity on the kinetics of alpha-helix and beta-hairpin formation. J. Phys. Chem. B 2001, 105 (1), 261–272. 10.1021/jp0022048. [DOI] [Google Scholar]
- Portman J. J.; Takada S.; Wolynes P. G. Microscopic Theory of Protein Folding Rates. II. Local Reaction Coordinates and Chain Dynamics. J. Chem. Phys. 2001, 114 (11), 5082–5096. 10.1063/1.1334663. [DOI] [Google Scholar]
- Zheng W. W.; De Sancho D.; Hoppe T.; Best R. B. Dependence of Internal Friction on Folding Mechanism. J. Am. Chem. Soc. 2015, 137 (9), 3283–3290. 10.1021/ja511609u. [DOI] [PMC free article] [PubMed] [Google Scholar]
- Sudhakar K.; Phillips C. M.; Owen C. S.; Vanderkooi J. M. Dynamics of Parvalbumin Studied by Fluorescence Emiision and Triplet Absoprtion Spectroscopy of Tryptophan. Biochemistry 1995, 34 (4), 1355–1363. 10.1021/bi00004a030. [DOI] [PubMed] [Google Scholar]
- Strambini G. B.; Gonnelli M. Tryptophan Phosphorescnece in Fluid Solution. J. Am. Chem. Soc. 1995, 117 (29), 7646–7651. 10.1021/ja00134a008. [DOI] [Google Scholar]
- Lapidus L. J.; Eaton W. A.; Hofrichter J. Measuring the Rate of Intramolecular Contact Formation in Polypeptides. Proc. Natl. Acad. Sci. U. S. A. 2000, 97 (13), 7220–7225. 10.1073/pnas.97.13.7220. [DOI] [PMC free article] [PubMed] [Google Scholar]
- Lapidus L. J.; Eaton W. A.; Hofrichter J. Dynamics of Intramolecular Contact Formation in Polypeptides: Distance Dependence of Quenching Rates in a Room-Temperature Glass. Phys. Rev. Lett. 2001, 87 (25), 258101. 10.1103/PhysRevLett.87.258101. [DOI] [PubMed] [Google Scholar]
- Lapidus L. J.; Steinbach P. J.; Eaton W. A.; Szabo A.; Hofrichter J. Effects of Chain Stiffness on the Dynamics of Loop Formation in Polypeptides. Appendix: Testing a 1-Dimensional Diffusion Model for Peptide Dynamics. J. Phys. Chem. B 2002, 106 (44), 11628–11640. 10.1021/jp020829v. [DOI] [Google Scholar]
- Lapidus L. J.; Eaton W. A.; Hofrichter J. Measuring Dynamic Flexibility of the Coil State of a Helix-Forming Peptide. J. Mol. Biol. 2002, 319 (1), 19–25. 10.1016/S0022-2836(02)00193-6. [DOI] [PubMed] [Google Scholar]
- Buscaglia M.; Schuler B.; Lapidus L. J.; Eaton W. A.; Hofrichter J. Kinetics of Intramolecular Contact Formation in a Denatured Protein. J. Mol. Biol. 2003, 332 (1), 9–12. 10.1016/S0022-2836(03)00891-X. [DOI] [PubMed] [Google Scholar]
- Buscaglia M.; Lapidus L. J.; Eaton W. A.; Hofrichter J. Effects of Denaturants on the Dynamics of Loop Formation in Polypeptides. Biophys. J. 2006, 91 (1), 276–288. 10.1529/biophysj.105.071167. [DOI] [PMC free article] [PubMed] [Google Scholar]
- a Hudgins R. R.; Huang F.; Gramlich G.; Nau W. M. A Fluorescence-Based Method for Direct Measurement of Submicrosecond Intramolecular Contact Formation in Biopolymers: An Exploratory Study with Polypeptides. J. Am. Chem. Soc. 2002, 124 (4), 556–564. 10.1021/ja010493n. [DOI] [PubMed] [Google Scholar]; b Nau W. M.; Wang X. J. Biomolecular and Supramolecular Kinetics in the Submicrosecond Time Range: The Fluorazophore Approach. ChemPhysChem 2002, 3 (5), 393–398. . [DOI] [PubMed] [Google Scholar]
- Bieri O.; Wirz J.; Hellrung B.; Schutkowski M.; Drewello M.; Kiefhaber T. The Speed Limit for Protein Folding Measured by Triplet-Triplet Energy Transfer. Proc. Natl. Acad. Sci. U. S. A. 1999, 96 (17), 9597–9601. 10.1073/pnas.96.17.9597. [DOI] [PMC free article] [PubMed] [Google Scholar]
- Huang F.; Nau W. M. A Conformational Flexibility Scale for Amino Acids in Peptides. Angew. Chem., Int. Ed. 2003, 42 (20), 2269–2272. 10.1002/anie.200250684. [DOI] [PubMed] [Google Scholar]
- a Krieger F.; Fierz B.; Bieri O.; Drewello M.; Kiefhaber T. Dynamics of Unfolded Polypeptide Chains as Model for the Earliest Steps in Protein Folding. J. Mol. Biol. 2003, 332 (1), 265–274. 10.1016/S0022-2836(03)00892-1. [DOI] [PubMed] [Google Scholar]; b Chang I. J.; Lee J. C.; Winkler J. R.; Gray H. B. The Protein-Folding Speed Limit: Intrachain Diffusion Times set by Electron-Transfer Rates in Denatured Ru(NH3)(5)(His-33)-Zn-Cytochrome c. Proc. Natl. Acad. Sci. U. S. A. 2003, 100 (7), 3838–3840. 10.1073/pnas.0637283100. [DOI] [PMC free article] [PubMed] [Google Scholar]
- a Wang T.; Du D. G.; Gai F. Helix-Coil Kinetics of Two 14-Residue Peptides. Chem. Phys. Lett. 2003, 370 (5–6), 842–848. 10.1016/S0009-2614(03)00223-9. [DOI] [Google Scholar]; b Werner J. H.; Dyer R. B.; Fesinmeyer R. M.; Andersen N. H. Dynamics of the primary processes of protein folding: Helix nucleation. J. Phys. Chem. B 2002, 106 (2), 487–494. 10.1021/jp0125799. [DOI] [Google Scholar]; c Huang C. Y.; Getahun Z.; Zhu Y. J.; Klemke J. W.; DeGrado W. F.; Gai F. Helix formation via conformation diffusion search. Proc. Natl. Acad. Sci. U. S. A. 2002, 99 (5), 2788–2793. 10.1073/pnas.052700099. [DOI] [PMC free article] [PubMed] [Google Scholar]; d Lednev I. K.; Karnoup A. S.; Sparrow M. C.; Asher S. A. Alpha-Helix Peptide Folding and Unfolding Activation Barriers: A Nanosecond UV Resonance Raman Study. J. Am. Chem. Soc. 1999, 121 (35), 8074–8086. 10.1021/ja991382f. [DOI] [Google Scholar]
- a Xu Y.; Oyola R.; Gai F. Infrared Study of the Stability and Folding Kinetics of a 15-residue Beta-Hairpin. J. Am. Chem. Soc. 2003, 125 (50), 15388–15394. 10.1021/ja037053b. [DOI] [PubMed] [Google Scholar]; b Muñoz V.; Ghirlando R.; Blanco F. J.; Jas G. S.; Hofrichter J.; Eaton W. A. Folding and Aggregation Kinetics of a Beta-Hairpin. Biochemistry 2006, 45 (23), 7023–7035. 10.1021/bi052556a. [DOI] [PubMed] [Google Scholar]
- Bryngelson J. D.; Onuchic J. N.; Socci N. D.; Wolynes P. G. Funnels, Pathways, and the Energy Landscape of Protein Folding - a Synthesis. Proteins: Struct., Funct., Genet. 1995, 21 (3), 167–195. 10.1002/prot.340210302. [DOI] [PubMed] [Google Scholar]
- Pitard E.; Orland H. Dynamics of the Swelling or Collapse of a Homopolymer. Europhys. Lett. 1998, 41 (4), 467–472. 10.1209/epl/i1998-00175-8. [DOI] [Google Scholar]
- Kubelka J.; Hofrichter J.; Eaton W. A. The Protein Folding ‘Speed Limit’. Curr. Opin. Struct. Biol. 2004, 14 (1), 76–88. 10.1016/j.sbi.2004.01.013. [DOI] [PubMed] [Google Scholar]
- Lindorff-Larsen K.; Piana S.; Dror R. O.; Shaw D. E. How Fast-Folding Proteins Fold. Science 2011, 334 (6055), 517–520. 10.1126/science.1208351. [DOI] [PubMed] [Google Scholar]
- McKnight C. J.; Doering D. S.; Matsudaira P. T.; Kim P. S. A Thermostable 35-Residue Subdomain within Villin Headpiece. J. Mol. Biol. 1996, 260 (2), 126–134. 10.1006/jmbi.1996.0387. [DOI] [PubMed] [Google Scholar]
- Duan Y.; Kollman P. A. Pathways to a Protein Folding Intermediate Observed in a 1-Microsecond Simulation in Aqueous Solution. Science 1998, 282 (5389), 740–744. 10.1126/science.282.5389.740. [DOI] [PubMed] [Google Scholar]
- Kubelka J.; Eaton W. A.; Hofrichter J. Experimental Tests of Villin Subdomain Folding Simulations. J. Mol. Biol. 2003, 329 (4), 625–630. 10.1016/S0022-2836(03)00519-9. [DOI] [PubMed] [Google Scholar]
- Chiu T. K.; Kubelka J.; Herbst-Irmer R.; Eaton W. A.; Hofrichter J.; Davies D. R. High-Resolution X-ray Crystal Structures of the Villin Headpiece Subdomain, an Ultrafast Folding Protein. Proc. Natl. Acad. Sci. U. S. A. 2005, 102 (21), 7517–7522. 10.1073/pnas.0502495102. [DOI] [PMC free article] [PubMed] [Google Scholar]
- Kubelka J.; Chiu T. K.; Davies D. R.; Eaton W. A.; Hofrichter J. Sub-Microsecond Protein Folding. J. Mol. Biol. 2006, 359 (3), 546–553. 10.1016/j.jmb.2006.03.034. [DOI] [PubMed] [Google Scholar]
- Godoy-Ruiz R.; Henry E. R.; Kubelka J.; Hofrichter J.; Munoz V.; Sanchez-Ruiz J. M.; Eaton W. A. Estimating Free-Energy Barrier Heights for an Ultrafast Folding Protein from Calorimetric and Kinetic Data. J. Phys. Chem. B 2008, 112 (19), 5938–5949. 10.1021/jp0757715. [DOI] [PubMed] [Google Scholar]
- Cellmer T.; Buscaglia M.; Henry E. R.; Hofrichter J.; Eaton W. A. Making connections between ultrafast protein folding kinetics and molecular dynamics simulations. Proc. Natl. Acad. Sci. U. S. A. 2011, 108 (15), 6103–6108. 10.1073/pnas.1019552108. [DOI] [PMC free article] [PubMed] [Google Scholar]
- Bunagan M. R.; Gao J. M.; Kelly J. W.; Gai F. Probing. the Folding Transition State Structure of the Villin Headpiece Subdomain via Side Chain and Backbone Mutagenesis. J. Am. Chem. Soc. 2009, 131 (21), 7470–7476. 10.1021/ja901860f. [DOI] [PMC free article] [PubMed] [Google Scholar]
- Cellmer T.; Henry E. R.; Kubelka J.; Hofrichter J.; Eaton W. A. Relaxation Rate for an Ultrafast Folding Protein is Independent of Chemical Denaturant Concentration. J. Am. Chem. Soc. 2007, 129 (47), 14564–14565. 10.1021/ja0761939. [DOI] [PubMed] [Google Scholar]
- Kubelka J.; Henry E. R.; Cellmer T.; Hofrichter J.; Eaton W. A. Chemical, Physical, and Theoretical Kinetics of an Ultrafast Folding Protein. Proc. Natl. Acad. Sci. U. S. A. 2008, 105 (48), 18655–18662. 10.1073/pnas.0808600105. [DOI] [PMC free article] [PubMed] [Google Scholar]
- a Henry E. R.; Eaton W. A. Combinatorial Modeling of Protein Folding Kinetics: free Energy Profiles and Rates. Chem. Phys. 2004, 307 (2–3), 163–185. 10.1016/j.chemphys.2004.06.064. [DOI] [Google Scholar]; b Kubelka J.; Henry E. R.; Cellmer T.; Hofrichter J.; Eaton W. A. Chemical, physical, and theoretical kinetics of an ultrafast folding protein. Proc. Natl. Acad. Sci. U. S. A. 2008, 105 (48), 18655–18662. 10.1073/pnas.0808600105. [DOI] [PMC free article] [PubMed] [Google Scholar]
- a Wolynes P. G.; Onuchic J. N.; Thirumalai D. Navigating the Folding Routes. Science 1995, 267 (5204), 1619–1620. 10.1126/science.7886447. [DOI] [PubMed] [Google Scholar]; b Oliveberg M.; Wolynes P. G. The Experimental Survey of Protein-folding Energy Landscapes. Q. Rev. Biophys. 2005, 38 (3), 245–288. 10.1017/S0033583506004185. [DOI] [PubMed] [Google Scholar]
- Zwanzig R.; Szabo A.; Bagchi B. Levinthal’s Paradox. Proc. Natl. Acad. Sci. U. S. A. 1992, 89 (1), 20–22. 10.1073/pnas.89.1.20. [DOI] [PMC free article] [PubMed] [Google Scholar]
- a Best R. B.; Hummer G.; Eaton W. A. Native Contacts Determine Protein Folding Mechanisms in Atomistic Simulations. Proc. Natl. Acad. Sci. U. S. A. 2013, 110 (44), 17874–17879. 10.1073/pnas.1311599110. [DOI] [PMC free article] [PubMed] [Google Scholar]; b Henry E. R.; Best R. B.; Eaton W. A. Comparing a Simple Theoretical Model for Protein Folding with all-Atom Molecular Dynamics Simulations. Proc. Natl. Acad. Sci. U. S. A. 2013, 110 (44), 17880–17885. 10.1073/pnas.1317105110. [DOI] [PMC free article] [PubMed] [Google Scholar]
- Gin B. C.; Garrahan J. P.; Geissler P. L. The Limited Role of Nonnative Contacts in the Folding Pathways of a Lattice Protein. J. Mol. Biol. 2009, 392 (5), 1303–1314. 10.1016/j.jmb.2009.06.058. [DOI] [PubMed] [Google Scholar]
- Thirumalai D.; Ha B. Y.. Statistical Mechanics of Stiff Chains. In Heoretical and Mathematical Models in Polymer Research; Gvrisberg A., Ed.; Academia: New York, 1998; pp 1–35. [Google Scholar]
- Bryngelson J. D.; Wolynes P. G. Intermediates and Barrier Crossing in a Random Energy Model (with Applications to Protein Folding). J. Phys. Chem. 1989, 93 (19), 6902–6915. 10.1021/j100356a007. [DOI] [Google Scholar]
- Shakhnovich E.; Farztdinov G.; Gutin A. M.; Karplus M. Protein Folding Bottlenecks = a Lattive Monte Carlo Simulation. Phys. Rev. Lett. 1991, 67 (12), 1665–1668. 10.1103/PhysRevLett.67.1665. [DOI] [PubMed] [Google Scholar]
- Nettels D.; Gopich I. V.; Hoffmann A.; Schuler B. Ultrafast Dynamics of Protein Collapse from Single-Molecule Photon Statistics. Proc. Natl. Acad. Sci. U. S. A. 2007, 104 (8), 2655–2660. 10.1073/pnas.0611093104. [DOI] [PMC free article] [PubMed] [Google Scholar]
- Schuler B.; Szabo A.; Wolynes P. G. Tribute to William A. Eaton. J. Phys. Chem. B 2018, 122 (49), 10971–10973. 10.1021/acs.jpcb.8b08745. [DOI] [PubMed] [Google Scholar]
- Chung H. S.; Eaton W. A. Protein folding transition path times from single molecule FRET. Curr. Opin. Struct. Biol. 2018, 48, 30–39. 10.1016/j.sbi.2017.10.007. [DOI] [PMC free article] [PubMed] [Google Scholar]
- Socci N. D.; Onuchic J. N.; Wolynes P. G. Diffusive Dynamics of the Reaction Coordinate for Protein Folding Funnels. J. Chem. Phys. 1996, 104 (15), 5860–5868. 10.1063/1.471317. [DOI] [Google Scholar]
- Hummer G. From Transition Paths to Transition States and Rate Coefficients. J. Chem. Phys. 2004, 120 (2), 516–523. 10.1063/1.1630572. [DOI] [PubMed] [Google Scholar]
- Eaton W. A.; Wolynes P. G. Theory, simulations, and experiments show that proteins fold by multiple pathways. Proc. Natl. Acad. Sci. U. S. A. 2017, 114 (46), E9759–E9760. 10.1073/pnas.1716444114. [DOI] [PMC free article] [PubMed] [Google Scholar]
- Ha T.; Enderle T.; Ogletree D. F.; Chemla D. S.; Selvin P. R.; Weiss S. Probing the Interaction Between two Single Molecules: Fluorescence Resonance Energy Transfer Between a Single Donor and a Single Acceptor. Proc. Natl. Acad. Sci. U. S. A. 1996, 93 (13), 6264–6268. 10.1073/pnas.93.13.6264. [DOI] [PMC free article] [PubMed] [Google Scholar]
- Ha T.; Enderle T.; Selvin P. R.; Chemla D. S.; Weiss S. Room Temperature Study of Single Molecule Dynamics on a Surface. Abstracts of Papers: American Chemical Society 1997, 213, 45-Phys. [Google Scholar]
- Schuler B.; Lipman E. A.; Eaton W. A. Probing the Free-Energy Surface for Protein Folding with Single-Molecule Fluorescence Spectroscopy. Nature 2002, 419 (6908), 743–747. 10.1038/nature01060. [DOI] [PubMed] [Google Scholar]
- Schuler B.; Lipman E. A.; Eaton W. A. Probing the free-energy surface for protein folding with single-molecule fluorescence spectroscopy (vol 419, pg 743, 2002). Nature 2003, 421 (6918), 94–94. 10.1038/nature01291. [DOI] [PubMed] [Google Scholar]
- Lipman E. A.; Schuler B.; Bakajin O.; Eaton W. A. Single-Molecule Measurement of Protein Folding Kinetics. Science 2003, 301 (5637), 1233–1235. 10.1126/science.1085399. [DOI] [PubMed] [Google Scholar]
- Hartridge H.; Roughton F. J. W. A Method of Measuring the Velocity of Very Rapid Chemical Reactions. Proc. R. Soc. Ser. a 1923, 104 (726), 376–394. 10.1098/rspa.1923.0116. [DOI] [Google Scholar]
- Stryer L.; Haugland R. P. Energy Transfer - a Spectroscopic Ruler. Proc. Natl. Acad. Sci. U. S. A. 1967, 58 (2), 719–726. 10.1073/pnas.58.2.719. [DOI] [PMC free article] [PubMed] [Google Scholar]
- Best R. B.; Merchant K. A.; Gopich I. V.; Schuler B.; Bax A.; Eaton W. A. Effect of fFexibility and Cis Residues in Single-Molecule FRET Studies of Polyproline. Proc. Natl. Acad. Sci. U. S. A. 2007, 104 (48), 18964–18969. 10.1073/pnas.0709567104. [DOI] [PMC free article] [PubMed] [Google Scholar]
- Plaxco K. W.; Millett I. S.; Segel D. J.; Doniach S.; Baker D. Chain Collapse Can Occur Concomitantly with the Rate-lLmiting Step in Protein Folding. Nat. Struct. Biol. 1999, 6 (6), 554–556. 10.1038/9329. [DOI] [PubMed] [Google Scholar]
- Merchant K. A.; Best R. B.; Louis J. M.; Gopich I. V.; Eaton W. A. Characterizing the Unfolded States of Proteins using Single-Molecule FRET Spectroscopy and Molecular Simulations. Proc. Natl. Acad. Sci. U. S. A. 2007, 104 (5), 1528–1533. 10.1073/pnas.0607097104. [DOI] [PMC free article] [PubMed] [Google Scholar]
- a O’Brien E. P.; Ziv G.; Haran G.; Brooks B. R.; Thirumalai D. Effects of Denaturants and Osmolytes on Proteins are Accurately Predicted by the Molecular Transfer Model. Proc. Natl. Acad. Sci. U. S. A. 2008, 105 (36), 13403–13408. 10.1073/pnas.0802113105. [DOI] [PMC free article] [PubMed] [Google Scholar]; b Samanta H. S.; Zhuravlev P. I.; Hinczewski M.; Hori N.; Chakrabarti S.; Thirumalai D. Protein Collapse is Encoded in the Folded State Architecture. Soft Matter 2017, 13 (19), 3622–3638. 10.1039/C7SM00074J. [DOI] [PubMed] [Google Scholar]
- Borgia A.; Zheng W. W.; Buholzer K.; Borgia M. B.; Schuler A.; Hofmann H.; Soranno A.; Nettels D.; Gast K.; Grishaev A.; Best R. B.; Schuler B. Consistent iew of Polypeptide Chain Expansion in Chemical Denaturants from Multiple Experimental Methods. J. Am. Chem. Soc. 2016, 138 (36), 11714–11726. 10.1021/jacs.6b05917. [DOI] [PMC free article] [PubMed] [Google Scholar]
- Best R. B.; Zheng W. W.; Borgia A.; Buholzer K.; Borgia M. B.; Hofmann H.; Soranno A.; Nettels D.; Gast K.; Grishaev A.; Schuler B. Comment on “Innovative Scattering Analysis Shows that Hydrophobic Disordered Proteins are Expanded in Water. Science 2018, 361, eaar7101. 10.1126/science.aar7101. [DOI] [PMC free article] [PubMed] [Google Scholar]
- Rhoades E.; Cohen M.; Schuler B.; Haran G. Two-state folding observed in individual protein molecules. J. Am. Chem. Soc. 2004, 126 (45), 14686–14687. 10.1021/ja046209k. [DOI] [PubMed] [Google Scholar]
- Chung H. S.; Louis J. M.; Eaton W. A. Experimental Determination of Upper Bound for Transition Path Times in Protein Folding from Single-Molecule Photon-by-Photon Trajectories. Proc. Natl. Acad. Sci. U. S. A. 2009, 106 (29), 11837–11844. 10.1073/pnas.0901178106. [DOI] [PMC free article] [PubMed] [Google Scholar]
- Gopich I. V.; Szabo A. Decoding the Pattern of Photon Colors in Single-Molecule FRET. J. Phys. Chem. B 2009, 113 (31), 10965–10973. 10.1021/jp903671p. [DOI] [PMC free article] [PubMed] [Google Scholar]
- a Chung H. S.; Gopich I. V.; McHale K.; Cellmer T.; Louis J. M.; Eaton W. A. Extracting Rate Coefficients from Single-Molecule Photon Trajectories and FRET Efficiency Histograms for a Fast-Folding Protein. J. Phys. Chem. A 2011, 115 (16), 3642–3656. 10.1021/jp1009669. [DOI] [PMC free article] [PubMed] [Google Scholar]; b Chung H. S.; Cellmer T.; Louis J. M.; Eaton W. A. Measuring Ultrafast Protein Folding Rates from Photon-by-Photon Analysis of Single Molecule Fluorescence Trajectories. Chem. Phys. 2013, 422, 229–237. 10.1016/j.chemphys.2012.08.005. [DOI] [PMC free article] [PubMed] [Google Scholar]
- Chung H. S.; McHale K.; Louis J. M.; Eaton W. A. Single-Molecule Fluorescence Experiments Determine Protein Folding Transition Path Times. Science 2012, 335 (6071), 981–984. 10.1126/science.1215768. [DOI] [PMC free article] [PubMed] [Google Scholar]
- Chung H. S.; Gopich I. V. Fast Single-Molecule FRET Spectroscopy: Theory and Experiment. Phys. Chem. Chem. Phys. 2014, 16 (35), 18644–18657. 10.1039/C4CP02489C. [DOI] [PMC free article] [PubMed] [Google Scholar]
- Ferreiro D. U.; Komives E. A.; Wolynes P. G. Frustration in Biomolecules. Q. Rev. Biophys. 2014, 47 (4), 285–363. 10.1017/S0033583514000092. [DOI] [PMC free article] [PubMed] [Google Scholar]
- Chung H. S.; Piana-Agostinetti S.; Shaw D. E.; Eaton W. A. Structural Origin of Slow Diffusion in Protein Folding. Science 2015, 349 (6255), 1504–1510. 10.1126/science.aab1369. [DOI] [PMC free article] [PubMed] [Google Scholar]


