Abstract
Simple water-soluble lanthanum and europium complexes are effective at detecting neutral sugars as well as glycolipids and phospholipids. In solutions at physiologically relevant pH the fluorescent lanthanum complex binds neutral sugars with apparent binding constants comparable to those of arylboronic acids. Interference from commonly occurring anions is minimal. The europium complex detects sialic acid-containing gangliosides at pH 7.0 over an asialoganglioside. This selectivity is attributed, in large part, to the cooperative complexation of the oligosaccharide and sialic acid residues to the metal center, based on analogous prior studies. In MeOH, lysophosphatidic acid (LPA), a biomarker for several pathological conditions including ovarian cancer, is selectively detected by the europium complex. LPA is also detected via a fluorescence increase in human plasma samples. The 2-sn-OH moiety of LPA plays a key role in promoting binding to the metal center. Other molecules found in common brain ganglioside and phospholipid extracts do not interfere in the ganglioside or LPA fluorescence assays.
Keywords: gangliosides, lysophosphatidic acid, salophenes, saccharides
Nature uses tools such as lectins for the molecular recognition of saccharides. An important mode of lectin binding involves the coordination of a carbohydrate ligand to a metal center. C-type lectins recognize saccharides in a calcium-dependent manner (1). The similar properties of lanthanides and calcium render trivalent lanthanide ions useful substitutes for Ca2+ in studying proteins (2). Herein we describe the utility of water-soluble salophene (3)–lanthanide complexes toward addressing three current challenges: (i) the detection of neutral carbohydrates at physiologically relevant pH, (ii) the selective detection of gangliosides, and (iii) the selective detection of lysophosphatidic acid (LPA).
Results and Discussion
Detection of Neutral Sugars at Physiological pH.
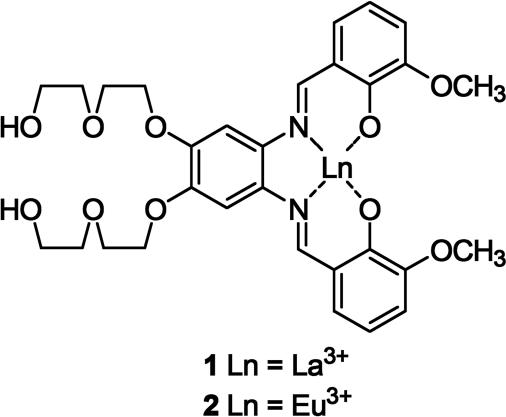
A main problem in the detection of neutral sugars with artificial receptors is competitive binding by bulk water. Elevated solution pH is therefore typically required to attain a useful degree of coordination and signal transduction in the most innovative new metal-based detection methods (4, 5). There is an unmet demand for biomimetic sugar-sensing agents that function in neutral buffer solution (4, 5). Because La3+ and Ca2+ exhibit relatively strong affinity for saccharides as compared with most other metal ions (6, 7), we hypothesize that 1 (Fig. 1) may be useful for detecting sugars in neutral aqueous media. Interestingly, lanthanides can extend their ligand coordination number by the addition of either neutral or charged ligands through ligand-sphere extension, leading to highly coordinated complexes (8).
Fig. 1.
Salophene–lanthanide complexes.
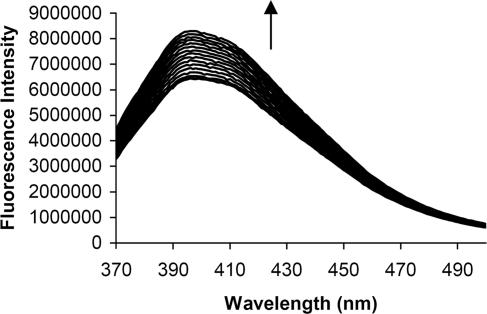
Addition of saccharides (1.1 × 10⁻³ M) to a solution of 1 (5.53 × 10⁻⁶ M, 0.1 M Hepes buffer, pH 7.0) promotes readily monitored increases in emission (Figs. 1 and 2) (ref. 9 and references therein). Lanthanide coordination to salens whereby the ligand conformation is brought into a more rigid cyclic structure increases ligand-centered fluorescence emission (ref. 9 and references therein). Ternary complex formation upon saccharide addition apparently enhances this latter effect. In the 1H NMR of a solution of 1 and d-glucose in D2O, the imine protons of 1 exhibit a modest upfield shift, in keeping with analogous salophene–metal complexes upon binding analytes (3) (see supporting information, which is published on the PNAS web site).
Fig. 2.
Fluorescence changes observed upon titration of 1 with d-glucose in 0.1 M Hepes buffer (pH 7.0). The concentration of 1 is 6 × 10⁻⁶ M. The concentration of glucose is increased from 0 to 6 × 10⁻⁴ M. Excitation is at 360 nm, and emission is monitored at 400 nm.
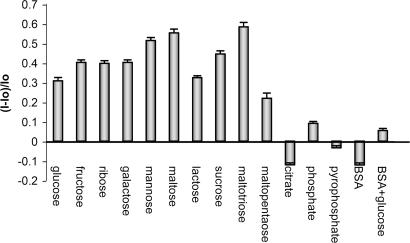
The continuous variation method indicates a 1:1 stoichiometry among glucose, maltose, maltotriose, and 1 (see supporting information). Glucose, maltose, and maltotriose exhibit binding constants of 500, 1,666, and 2,500 M−1, respectively. These values compare very favorably to those of sugar–boronate complexes (10, 11). This finding is significant because boronic acid-containing fluorophores are currently reagents of choice for sugar detection in aqueous and mixed-aqueous media. The emission enhancements shown herein in the presence of neutral sugars range from ≈25% to 60% (Figs. 2 and 3).
Fig. 3.
Relative fluorescence emission (400 nm) changes observed in solutions of 1 (5.53 × 10⁻⁶ M) in the presence of monosaccharides, oligosaccharides, anions (1.1 × 10⁻³ M), BSA (1 mg/ml), and a mixture of BSA and glucose (1 mg/ml and 1.1 × 10⁻³ M, respectively) in Hepes buffer solution (pH 7.0). The standard deviation (n = 3 for each analyte) of the relative fluorescence intensity ranges from 0.01 to 0.027.
Common anions (citrate, phosphate, and pyrophosphate) studied under these conditions promote relatively weaker emission responses (Fig. 3). Additionally, BSA-containing solutions exhibit increased fluorescence only when glucose is present. The concentration of glucose in plasma is typically ≈10−3. The next most abundant monosaccharides are galactose and fructose, present at concentrations two orders of magnitude less than that of glucose.
The Selective Detection of Gangliosides Under Neutral Conditions.
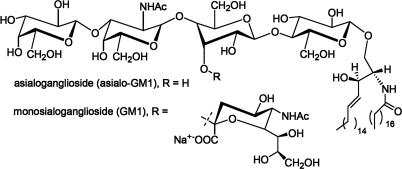
It is well known that an increase or decrease in total sialic acid levels (conjugated plus freely circulating) in biological fluids can indicate the occurrence of certain cancers. The acid-catalyzed liberation of bound sialic acid residues from gangliosides (Fig. 4) for assay typically results in destruction of the analyte (12–16). In the case of enzymatic hydrolysis incomplete sialic acid liberation is a problem (17). Effective sensing agents for sialic acid-containing gangliosides are needed.
Fig. 4.
The structures of asialo GM1 and GM1.
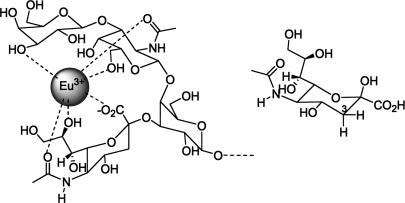
Selectivity toward various anionic substrates can be tuned via the appropriate choice of lanthanide metal (18). Importantly, Sillerud et al. (19) have provided precedent for favorable cooperative binding interactions of the oligosaccharide and sialic acid moieties of micellar gangliosides with Eu3+. For example, the higher affinity of Eu3+ to GM1 as compared with sialic acid was attributed not only to an electrostatic interaction with the GM1 sialic acid carboxylate but also to secondary interactions with the proximal oligosaccharide hydroxyls, resulting in a coordination shell (Fig. 5).
Fig. 5.
Coordination of GM1 to Eu3+ (Left) and free sialic acid (Right).
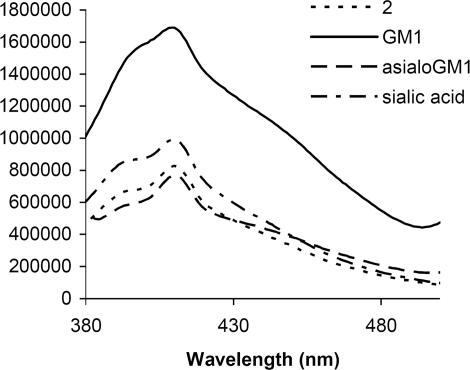
We thus hypothesize that 2 may afford enhanced signaling in the presence of charged gangliosides as compared with neutral sugars and sialic acid. Compound 2 promotes the detection of sialic acid-containing gangliosides selectively compared with asialo GM1 (Fig. 6). In contrast, 1 affords greater fluorescence enhancement than 2 in the presence of neutral asialo GM1 (see supporting information). The smaller the ionic radius of a lanthanide, the more significant are the intramolecular interactions between its ligands. The salophene ligands of 1 and 2 contain both polar and apolar moieties. The combination of these latter structural features, along with the smaller ionic radius of Eu3+ compared with La3+, apparently renders 2 a better substrate for detecting anionic gangliosides compared with 1.
Fig. 6.
Fluorescence intensity change of solutions of 2 (5.53 × 10⁻⁶ M) in response to added gangliosides (0.5 mg/ml, ≈10−4 M each) and sialic acid (1 × 10⁻³ M) in 0.1 M Hepes buffer solution (pH 7.0). Excitation is at 360 nm, and emission is monitored at 400 nm.
The sialic acid residue of GM1 binds Eu3+ via multiple coordination sites (Fig. 5). Free sialic acid binding (as predominantly the β-pyranose form) to metals has also been reported (20). The carboxylate, pyranose ring, and glycerol side-chain oxygens of sialic acid directly participate in coordination. When sialic acid is titrated with 2 in D2O, the 1H NMR signals corresponding to the protons on the glycerol side chain and pyranose ring undergo substantial peak-broadening. The 3Hax proton, on the same side of the pyranose as the carboxylate moiety, is relatively closer to the metal site than 3-Heq. The axial proton resonance of carbon 3 broadens to a greater extent than that of 3-Heq (see supporting information).
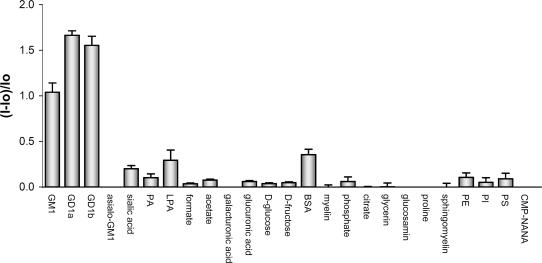
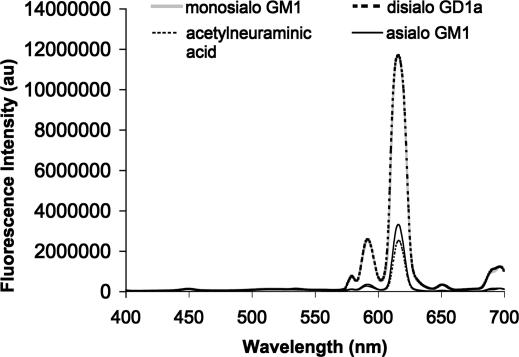
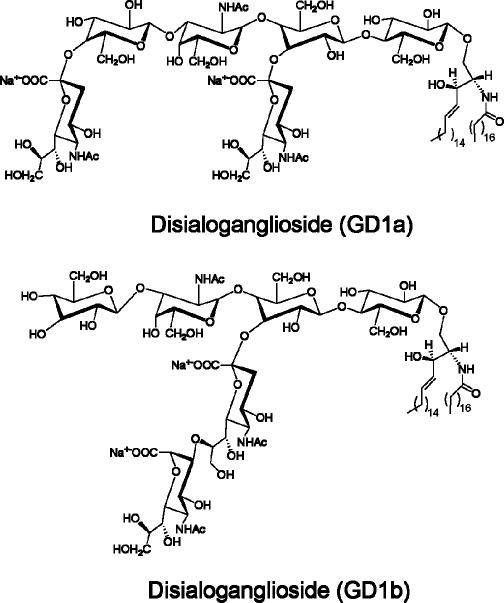
Many compounds are present in typical ganglioside extracts (Figs. 7–9) (21). Major components include free sialic acids, phospholipids, myelins, proline, and glucosamine. These and many structurally related compounds do not interfere with ganglioside detection in neutral buffer solution (Fig. 7). Interestingly, the disiaiogangliosides (GD1a and GD1b)–2 (Fig. 9) complexes show stronger emission than the corresponding complex of monosialo GM1-2.
Fig. 7.
Relative fluorescence intensity changes of solutions of 2 (5.53 × 10⁻⁶ M) in Hepes buffer (pH 7.0) in the presence of various gangliosides, phospholipids, and other charged and neutral analytes. Ganglioside concentration was 0.5 mg/ml, ≈10−4 M each. Concentration of other analytes was 1.1 × 10⁻³ M. The standard deviation (n = 3) of the relative fluorescence intensity for each analyte ranges from 0.01 to 0.11. Proteins such as myelin and BSA were studied at 1 mg/ml concentrations. Asialo-GM1, asialoganglioside GM1; GM1, monosialoganglioside GM1; GD1a and GD1b, disialogangliosides; PI, l-α-phosphatidylinositol; PE, l-α-phosphatidylethanolamine; PS, l-α-phosphatidylserine; CMP-NANA, cytidine-5′-monophospho-N-acetylneuraminic acid.
Fig. 9.
Fluorescence intensity change of solutions of Eu-Tc complex (5.53 × 10⁻⁶ M) in response to added gangliosides (1.1 × 10⁻⁴ M) and sialic acid (1 × 10⁻³ M) in 0.1 M Hepes buffer solution (pH 7.0). Excitation is at 390 nm, and emission is monitored at 615 nm.
Based on these results we conclude, in agreement with Sillerud et al. (19), that a sialic acid moiety appended to an oligosaccharide sequence leads to enhanced affinity. Comparison of the fluorescence spectra of 2 in the presence of GM1 with neutral asialo GM1 as well as several other analytes suggests that proximal oligosaccharide–sialic acid sequences are important factors leading to signal transduction (Fig. 7).
Gangliosides and neutral sugars can also be monitored by using the well known fluorescent europium(III)–tetracycline (Eu-Tc) complex. The Eu-Tc complex exhibits efficient ligand to metal energy transfer (22). This complex allows for fluorescence monitoring at the common europium emission wavelength of 615 nm rather than at the ligand emission, as in the case of 1 or 2 (Fig. 9). The Eu-Tc complex is well known to exhibit fluorescence emission enhancement upon complexation via displacement of bound water (22). However, the Eu-Tc complex is not as selective as 1 and 2. It exhibits fluorescence emission enhancement in the presence of several neutral sugars and anions (see supporting information).
The Selective Detection of LPA.
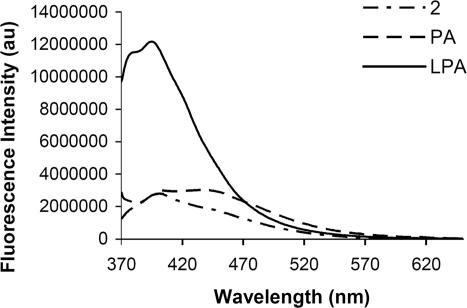
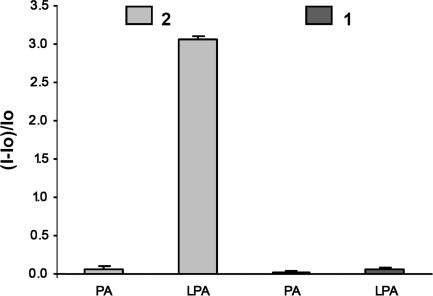
MeOH solutions containing 2 exhibit increased emission in the presence of commercially available LPA (oleoyl-l-α-LPA Na salt, 5.53 × 10⁻⁶ M λex 360 nm λem 400 nm). Solutions containing commercial phosphatidic acid (PA) (3-sn-PA Na salt) exhibit minor fluorescence changes at 400 nm (Figs. 10 and 11), even at millimolar PA levels.
Fig. 10.
Fluorescence intensity change of solutions of 2 (5.53 × 10⁻⁶ M) in response to added LPA or PA (1.1 × 10⁻⁴ M) in MeOH. Excitation is at 360 nm, and emission is monitored at 400 nm.
Fig. 11.
Relative fluorescence intensity changes of solutions of 1 or 2 (5.53 × 10⁻⁶ M) in response to added LPA or PA (1.1 × 10⁻⁴ M) in MeOH. Excitation is at 360 nm, and emission is monitored at 400 nm. The standard deviation (n = 3) of the relative fluorescence intensity for each analyte ranges from 0.01 to 0.03.
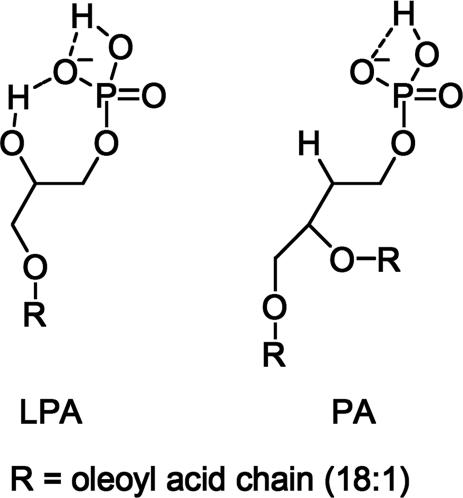
Distinct affinities of LPA and PA for 2 can be interpreted in terms of the magnitude of their corresponding negative charges (23). Intramolecular hydrogen bonding between the phosphate and the 2-sn-OH moieties is observed in the crystal structure of LPA and is known to persist at physiological pH (Fig. 12) (24). The phosphate hydroxyl of LPA is thus more prone to ionization than the phosphate proton of PA. This effect generates a higher negative charge on the LPA phosphate, facilitating proposed binding to 2 dominated by ionic interactions. The free hydroxyl oxygen of LPA may also serve as a cooperative binding site to the lanthanide. It is known that a second coordinating site, especially one containing a hard atom such as oxygen or nitrogen, enhances lanthanide affinity (see also Fig. 5) (25). Indeed, we observe significant broadening of the 1H NMR resonances corresponding to protons on carbons 1–3 (Fig. 13) of LPA compared with the other peaks. We propose that this latter feature, in combination with the relatively higher negative charge of LPA compared with PA, should allow selective detection of LPA compared with PA using 2.
Fig. 12.
Intramolecular hydrogen bonding patterns of LPA and PA explain the lower pKa of LPA (see ref. 23).
Fig. 13.
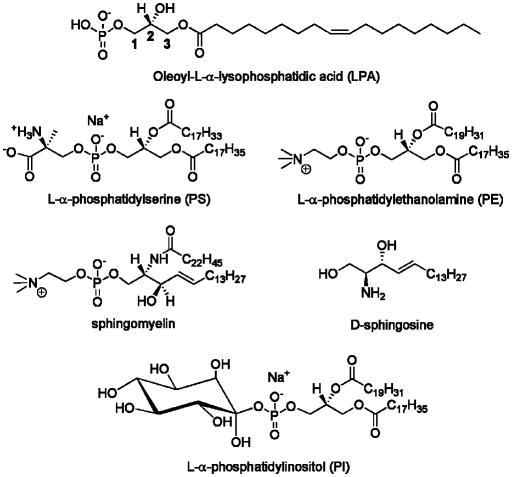
Structure of LPA and other phospholipids investigated.
Ovarian cancer is a global problem. A main reason for the low survival rate of ovarian cancer is the fact that there is no method for early detection. There is evidence that LPAs (1-acyl-glycerol-3-phosphates), the simplest phospholipids, are promising markers for the early detection of ovarian cancer (26). Current assays for LPA are unsuitable for routine diagnostic and point-of-care use. LPA is relatively difficult to detect in nonpolar lipid extracts. LPA is detected selectively by 2 via an increase in fluorescence in MeOH.
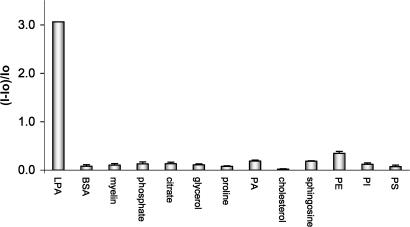
Fig. 14 shows that well known components of phospholipid extracts (27, 28) do not afford fluorescent emission signals comparable to that of LPA in solutions of 2 in MeOH.
Fig. 14.
Relative fluorescence intensity changes of solutions of 2 in MeOH (5.53 × 10⁻⁶ M) in the presence of various phospholipids (LPA and PA; 1.1 × 10⁻⁴ M) and other charged and neutral analytes. Concentration of other analytes was 1.1 × 10⁻³ M. The standard deviation (n = 3) of the relative fluorescence intensity for each analyte ranges from 0.01 to 0.11.
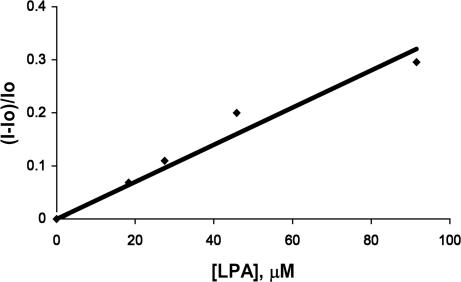
We observe a correlation between fluorescence intensity and LPA concentration in MeOH extracts of lyophilized human plasma previously spiked with LPA (as well as LaCl3 to remove neutral interferents; Fig. 15). LPA is detected in the concentration range of 1.83 × 10⁻⁵ M to 9.15 × 10⁻⁵ M (Fig. 11). Physiological concentrations of LPA in plasma are approximately <0.1–6.3 μM. Danger levels for ovarian cancer are approximately ≤43.1 μM (26).
Fig. 15.
Relative fluorescence emission versus concentration at 437 nm of methanolic extracts of blood plasma samples containing 2 and various concentrations of LPA. When carried out in triplicate, the standard deviation of the relative fluorescence intensity does not exceed 0.03.
Conclusions
To date, the lack of receptors that effectively mimic lectin binding is largely due to the inability to achieve sugar–metal coordination under neutral conditions. The design of compound 1 is inspired by calcium–saccharide interactions found in C-type lectins. It allows for the successful detection of neutral monosaccharides and oligosaccharides in neutral buffer solution. Our initial studies to date show that complex 2 exhibits enhanced fluorescence emission with anionic lipid analytes that possess proximal hard atom (oxygen) coordination sites, such as the α hydroxyl of LPA and the oligosaccharide hydroxyls of gangliosides. This finding is in excellent accord with prior studies of related systems (25).
Compound 2 can be used to selectively detect (i) sialic acid-containing gangliosides in buffer solution and (ii) LPA in MeOH. These latter results are steps toward developing nonhydrolytic assays for sialic acid and facilitating the detection of LPA, respectively. Our initial focus has been on the selectivity and the signal transduction mechanisms. The complexity of the biomolecules and the nature of the emission (i.e., ligand emission rather than lanthanide emission) render the structural study of the tertiary complexes highly challenging.
Materials and Methods
All chemicals were purchased from Sigma-Aldrich and used without further purification. Gangliosides were purchased from Calbiochem. Phospholipids were purchased from Avanti Polar Lipids. Fluorescence spectra were recorded by using a spectrofluorimeter SPEX Fluorolog-3 equipped with double excitation and emission monochromators and a 400-W Xe lamp. 1H and 13C NMR spectra were acquired on a DPX-250 or DPX-300 spectrometer (Bruker). All δ values were reported in parts per million. Coupling constants are reported in hertz. Fourier-transform IR spectra were acquired on a Tensor 27 IR spectrophotometer (Bruker). MS were acquired on a ProFLEX III MALDI-TOF mass spectrometer (Bruker).
Supplementary Material
Fig. 8.
The structure of disialogangliosides GD1a and GD1b.
Acknowledgments
We thank the National Institutes of Health for funding this research through Grant EB 2044 (to R.M.S.). Financial support from the Ministry of Education of the Czech Republic (MSM 6046137307 and LC512) and from the Grant Agency of Czech Republic (203/06/1038 to V.K.) is also gratefully acknowledged.
Abbreviations
- LPA
lysophosphatidic acid
- Eu-Tc
europium(III)–tetracycline
- PA
phosphatidic acid
Footnotes
Conflict of interest statement: No conflicts declared.
References
- 1.Weis W. I., Drickamer K., Hendrickson W. A. Nature. 1992;360:127–134. doi: 10.1038/360127a0. [DOI] [PubMed] [Google Scholar]
- 2.Horrocks W. D., Jr, Sudnick D. R. Acc. Chem. Res. 1981;14:384–392. [Google Scholar]
- 3.vanVeggel F. C. J. M., Verboom W., Reinhoudt D. N. Chem. Rev. 1994;94:279–299. [Google Scholar]
- 4.Striegler S., Dittel M. J. Am. Chem. Soc. 2003;125:11518–11524. doi: 10.1021/ja035561f. [DOI] [PubMed] [Google Scholar]
- 5.Davis A. P., Wareham R. S. Angew. Chem. Int. Ed. 1999;38:2978–2996. [PubMed] [Google Scholar]
- 6.Angyal S. J. Aust. J. Chem. 1972;25:1957–1966. [Google Scholar]
- 7.Angyal S. J., Greeves D., Mills J. A. Aust. J. Chem. 1979;32:1993–2001. [Google Scholar]
- 8.Tsukube H., Shinoda S. Chem. Rev. 2002;102:2389–2404. doi: 10.1021/cr010450p. [DOI] [PubMed] [Google Scholar]
- 9.Liu G.-D., Yang X., Chen Z.-P., Shen G.-L., Yu R.-Q. Anal. Sci. 2000;16:1255–1259. [Google Scholar]
- 10.James T. D., Shinkai S. Top. Curr. Chem. 2002;218:159–200. [Google Scholar]
- 11.Wang W., Gao X., Wang B. Curr. Org. Chem. 2002;6:1285–1317. [Google Scholar]
- 12.Svennerholm L. Biochem. Biophys. Acta. 1957;24:604–611. doi: 10.1016/0006-3002(57)90254-8. [DOI] [PubMed] [Google Scholar]
- 13.Warren L. J. Biol. Chem. 1959;234:1971–1975. [PubMed] [Google Scholar]
- 14.Schauer R., Kelm S., Rerter G., Roggentin P., Shaw L. Biology of the Sialic Acids. In: Rosenburg A., editor. Plenum: New York; 1995. p. 7. [Google Scholar]
- 15.Nagai Y., Iwamori M., Iwamori M. In: Biology of the Sialic Acids. Rosenburg A., editor. Plenum: New York; 1995. p. 197. [Google Scholar]
- 16.Mattoo R. L., Roseman S. Anal. Biochem. 1997;246:30–33. doi: 10.1006/abio.1996.9987. [DOI] [PubMed] [Google Scholar]
- 17.Hikita T., Tadano-Aritomi K., Iida-Tanaka N., Toyoda H., Suzuki A., Toida T., Imanari T., Abe T., Yanagawa Y., Ishizuka I. Anal. Biochem. 2000;281:193–201. doi: 10.1006/abio.2000.4561. [DOI] [PubMed] [Google Scholar]
- 18.Bruce J. I., Dickins R. S., Govenlock L. J., Gunnlaugsson T., Lopinski S., Lowe M. P., Parker D., Peacock R. D., Perry J. J. B., Aime S., Botta M. J. Am. Chem. Soc. 2000;112:9674–9684. [Google Scholar]
- 19.Sillerud L. O., Prestégard J. H., Yu R. K., Schafer D. R, Konigsberg W. H. Biochemistry. 1978;17:2619–2628. doi: 10.1021/bi00606a025. [DOI] [PubMed] [Google Scholar]
- 20.Saladini M., Menabue L., Ferrari E. J. Inorg. Biochem. 2002;88:61–68. doi: 10.1016/s0162-0134(01)00322-1. [DOI] [PubMed] [Google Scholar]
- 21.Byrne M. C., Sbaschnig-Agler M., Aquino D. A., Sclafani J. R., Ledeen R. W. Anal. Biochem. 1985;148:163–173. doi: 10.1016/0003-2697(85)90641-4. [DOI] [PubMed] [Google Scholar]
- 22.Ci Y.-X., Li Y.-Z., Liu X.-J. Anal. Chem. 1995;67:1785–1788. [Google Scholar]
- 23.Kooijman E. E., Carter K. M., van Laar E. G., Chupin V., Burger K. N. J., Kruijff B. D. Biochemistry. 2005;44:17007–17015. doi: 10.1021/bi0518794. [DOI] [PubMed] [Google Scholar]
- 24.Pascher I., Sundell S. Chem. Phys. Lipids. 1985;37:241–250. doi: 10.1016/0009-3084(85)90012-x. [DOI] [PubMed] [Google Scholar]
- 25.Fu P. K.-L., Turro C. J. Am. Chem. Soc. 1999;121:1–7. [Google Scholar]
- 26.Xu Y., Shen Z., Wiper D. W., Wu M., Morton R. E., Elson P., Kennedy A. W., Belinson J., Markman M., Casey G. J. Am. Med. Assoc. 1998;280:719–723. doi: 10.1001/jama.280.8.719. [DOI] [PubMed] [Google Scholar]
- 27.Holland W. L., Stauter E. C., Stith B. J. J. Lipid Res. 2003;44:854–858. doi: 10.1194/jlr.D200040-JLR200. [DOI] [PubMed] [Google Scholar]
- 28.Eryomin V. A., Poznyakov S. P. Anal. Biochem. 1989;180:186–191. doi: 10.1016/0003-2697(89)90110-3. [DOI] [PubMed] [Google Scholar]
Associated Data
This section collects any data citations, data availability statements, or supplementary materials included in this article.


