

Abstract
There are distinct cell subpopulations in normal epithelial tissue, including stem cells, progenitor cells, and more differentiated cells, all of which have been extensively studied for their susceptibility to tumorigenesis. However, normal cells usually have to progress through a precancerous lesion state before becoming a full-blown tumor. Precancerous early lesions are heterogeneous, and the cell subset that is the primary source of the eventual tumor remains largely unknown. By using mouse models that are tailored to address this question, we identified a keratin 6a-expressing precancerous stem cell (PcSC) subset and a more differentiated whey acidic protein-positive (WAP+) cell subset in mammary precancerous lesions initiated by the Wnt1 oncogene. Both cell subsets rapidly progressed to cancer upon introduction of constitutively active versions of either HRAS or BRAF. However, the resulting tumors were dramatically different in protein profiles and histopathology: keratin 6a+ precancerous cells gave rise to adenocarcinoma while WAP+ cells yielded metaplastic carcinoma with severe squamous differentiation and more robust activation of MEK/ERK signaling. Therefore, both stem and non-stem cells in mammary precancerous lesions can contribute to the eventual cancers, but their differentiation status determines the resulting cancer phenotype. This work identifies a previously unknown player in cancer heterogeneity and suggests that cancer prevention should target precancerous cells broadly and not be limited to PcSC.
Keywords: precancerous lesion, stem cell, mammary gland, breast cancer, subtype
Introduction
There are different subpopulations of cells in a normal tissue, including stem cells, progenitor cells, and more differentiated cells (1). There are also cellular heterogeneity and hierarchy in established cancer (1–3). Extensive work has been done to understand these different subsets of cancer cells, especially the cancer stem cells, to better understand cancer progression, therapeutic resistance, residual disease (2). Extensive literature also exists in attempting to identify the cell subset in a normal tissue that is most vulnerable to transformation and carcinogenesis (1, 2, 4, 5). For example, stem cells have been suggested to be the cell of origin in colorectal tumorigenesis (6); however, in the brain both stem and more differentiated cells may give rise to tumors, but of different types (7–9). In the mouse mammary gland, both stem/progenitor cells and more differentiated cells can be induced to form cancer (10–17), and we and others have reported evidence that cells expressing the gene encoding whey acidic protein are at increased susceptibility to transformation by an oncogene such as Erbb2 (10, 18).
However, whatever cell subtype in the normal tissue evolves into the eventual cancer, it usually has to progress through a precancerous lesion state before becoming a fully developed tumor. Understanding how these early lesions progress to cancer has important implications in cancer prevention. The manifestation of precancerous lesions varies in different tissues. For instance, adenomatous polyps, cervical intraepithelial neoplasia (CIN), and actinic keratosis are the common precancerous lesions in the colon, cervix, and skin, respectively. In human mammary glands, atypical ductal hyperplasia (ADH), atypical lobular hyperplasia (ALH), and flat epithelial atypia (FEA) are common precursors to cancer (19). Like their normal or cancerous counterparts, these precancerous lesions often also harbor multiple cell types likely including stem, progenitor, and differentiated cells (20, 21). For example, Lgr5+ cells in the intestinal adenoma are the stem cells of this type of precancerous lesion (21). In mammary precancerous lesions of several mouse models, a population of cells expressing a progenitor marker keratin 6 is expanded (20). These precancerous lesions progress to cancer due to the gain of secondary genetic and epigenetic alterations. For example, mutation in TP53, PIK3CA, and RAS is crucial in driving precancerous lesions of colon, cervix, and skin to cancer, respectively (22–24). In mammary gland, spontaneous mutations in Ras likely instigates the progression from precancerous mammary cells that are transgenic for c-Myc or Wnt1 (25, 26). Forced activation of STAT5 can stimulate the progression of mammary early lesions initiated by ERBB2 (10, 27). However, which cell type in these precancerous lesions is the origin of the eventual carcinoma remains largely a mystery. Even in the case of intestinal adenoma, although tumors can be induced from LGR5+ adenoma stem cells (21), whether these cells are the only vulnerable precursor to intestinal cancer remains unclear.
Defining the cancer vulnerability of different cell subsets in precancerous lesions is technically challenging – these cells are difficult to be separated and studied in vitro without compromising their in vivo properties, and they are hard to be manipulated separately at the genetic level in vivo. Here, we used a well-defined and commonly used MMTV-Wnt1 transgenic mouse model (28) combined with retrovirus-mediated gene delivery methods (29, 30) to investigate cancer susceptibility of distinct subsets of mammary precancerous cells during mammary tumorigenesis. We identified stem-like cells and more differentiated cells in these early lesions. We found that both cell subsets rapidly progressed to cancer upon introduction of an oncogenic event. However, the resulting tumors were dramatically different in histopathology and protein profiles.
Materials and Methods
Experimental mice and animal care.
K6a-tva, WAP-tva and MMTV-tva have been previously described (11, 29, 31). FVB and MMTV-Wnt1 mice (28) (on the FVB/N background) were purchased from the Jackson Laboratory (Bar Harbor, ME). All mice were kept on 2920X Teklad Global Extruded Rodent Diet (Soy Protein-Free; Harlan Laboratories, Indianapolis, IN). For doxycycline-treated mice, 0.2mg/ml of doxycycline was added into the drinking water. Only female mice were used in this study. Experimental mouse numbers were decided based on experience, pilot experimental data, and the ethics of minimal use of animal. Mice dying for non-experimental reasons were defined as censored. Mice were randomly assigned into experimental groups. Investigators were not blinded to allocation during experiments. The pathologist was blinded to the samples. All procedures using mice were performed in compliance with an Institutional Animal Care and Use Committee-approved animal protocol.
Preparation of single cell suspensions from mammary glands and fluorescence-activated-cell-sorting.
Preparation of single cell suspensions from mammary glands and fluorescence-activated-cell-sorting (FACS) have been described previously (11).
RT-qPCR.
Total RNA was extracted using Arcturus™ PicoPure™ RNA Isolation Kit ( Thermo Fisher Scientific, Cat#12204–01) following the manufacturer’s instruction. RNase-Free DNase I (QIAGEN, Cat#79254) was used to remove all genomic DNA. Revers transcription was carried out using iScript™ cDNA Sythesis Kit (BIO-RAD, Cat#170–8891) following the manufacturer’s instruction. qPCR was carried out using TaqMan® Gene Expression Assays (18S: Hs99999901-S1, Hras: Mm01275932_g1, Kras: mm00517492_m1, Nras: Mm03053787_s1, MMTV-Wnt1 transgene: PN4331348, Wnt1: Mm01300554_g1, Vim: Mm01333430_m1) combined with TagMan Fast Advanced Master Mix (Thermo Fisher Scientific, Cat. #4444556). The real-time PCR was run on the Bio-Rad CFX96 Touch™ Real-Time PCR Detection System (BIO-RAD, Cat. #1855196) using program: 50℃ × 2’, 95℃ × 2’, (95℃ × 3”, 60℃ × 30”) × 41 cycles.
Cleared fat pad transplantation.
Cleared fat pad transplantation has been previously described (11). Recipient mice were non-transgenic littermates of MMTV-Wnt1 mice.
RCAS and lentiviruses.
The RCAS-Y vector has been previously reported (32). RCAS-HrasQ61L has been reported (27). RCAS-Actb(HA) has been reported previously (33). RCAS-BRAFV600E was constructed by inserting a PCR fragment of Flag-tagged BRAFV600E cDNA into RCAS-Y through the PacI and ClaI restriction sites. The template used for PCR was pBABEbleo-Flag-BRAFV600E (Addgene, Plasmid #53156). The primers used were: 5’ ACGCCGTTAATTAAATGGATTATAAAGATGACGCGATAAGGCGGCGGT and 5’ TCACTAATCGATTCAGTGGACAGGAAACGCAC. The construct was confirmed by sequencing the whole insert region. RCAS-caErbb2 and RCAS-KrasG12D have been described (29, 34). RCAS-GFP was a gift of Connie Cepko (Harvard Medical School, Boston, MA). RCAS virus preparation has been previously described (11). PCR detecting provirus was used for titer determination of RCAS-HrasQ61L, RCAS-KrasG12D, and RCAS-BRAFV600E. Primers used to detect provirus are: 5’ CCGACGAATTCATGACAGAATACAAGCTTGTG and 5’ AACCGCGTACAACCGAAG for RCAS-HrasQ61L; 5’ACATGGGTGGTGGTATAGCGCTTGCG and 5’AACCGCGTACAACCGAAG for RCAS-KrasG12D; 5’ CCACAGAGAC CTCAAGAG and 5’ AACCGCGTACAACCGAAG for RCAS-BRAFV600E.
FU-CGW lentivirus has been previously reported (35). FUCGW-HrasQ61L was constructed by inserting PCR fragments of HrasQ61L cDNA into FU-CGW at an ECoRI site. The template used for the PCR was RCAS-HrasQ61L. The primers used were: 5’ CCGACGAATTCATGACAGAATACAAGGTGTG and 5’ CTCACGAATTCTCAGGACAGCACACATTTGC, respectively. The construct was confirmed by sequencing the whole insert region. FU-CGW lentivirus virus preparation has been previously described (30) with the following modification: X-tremeGENE 9 DNA Transfection Reagent (Roche, Mannheim, Germany) was used for the transfection following the manufacturer’s instructions.
The pINDUCER plasmids (a gift from Thomas F. Westbrook, Baylor College of Medicine) has been previously reported (36). The piG-KrasG12D was constructed by LR recombination between pCR8/gw/topo-HAKrasG12D and pINDUCER22. The pCR8/gw/topo-HAKrasG12D was constructed by cloning of HA tagged KrasG12D cDNA PCR product (primers: 5’ CTGTGGAATTCATATGGCCTACCCCTAC and 5’ CCGTAGAATTCTCACATAACTGTACACC; template: RCAS-KrasG12D). The piG-NRASG12V was constructed by recombination between pENTR-NRASG12V (a gift from Eric Chang, Baylor College of Medicine) and pINDUCER22.
Intra-ductal injection.
Intra-ductal injection of virus has been previously described (11, 30).
Tissue processing and histological staining.
Tissue processing, hematoxylin and eosin (H&E) staining, immunofluorescent staining, and immunohistochemical staining have been previously described (11) except the following information: Anti-WAP antibody was purchased from Santa Cruz (cat# sc-25526, Dallas, TX). Anti-loricrin antibody was purchased from Abcam (cat# ab85679, Cambridge, MA).
Neutral red mammary gland whole mount staining.
Mammary gland whole mount staining has been previously described (11).
Reverse phase protein array (RPPA) analysis.
Reverse phase protein array assays were carried out as described previously with minor modification (37). Protein lysates were prepared from tumors induced from K6a-tva/MMTV-Wnt1 and WAP-tva/MMTV-Wnt1 mice by RCAS-HrasQ61L and RCAS-BRAFE600D, respectively (24 tumors from 4 groups) with modified Tissue Protein Extraction Reagent (TPER) (Pierce) and a cocktail of protease and phosphatase inhibitors (Roche Life Science). The lysates were diluted into 0.5 mg/ml of total protein in SDS sample buffer and denatured on the same day. The Aushon 2470 Arrayer (Aushon BioSystems) with a 40 pin (185 μm) configuration was used to spot samples and control lysates onto nitrocellulose-coated slides (Grace Bio-labs) using an array format of 960 lysates/slide (2880 spots/slide). The slides were probed with a set of 216 antibodies against total and phosphor- proteins using an automated slide stainer Autolink 48 (Dako). A complete list of validated antibodies for RPPA and their protein targets can be found with the following link: https://www.bcm.edu/centers/cancer-center/research/shared-resources/cprit-cancer-proteomics-and-metabolomics/reverse-phase-proteinarray. Each slide was incubated with one specific primary antibody, and a negative control slide was incubated with antibody diluent instead of primary antibody. Primary antibody binding was detected using a biotinylated secondary antibody followed by streptavidin-conjugated IRDye680 fluorophore (LI-COR Biosciences). Total protein content of each spotted lysate was assessed by fluorescent staining with Sypro Ruby Protein Blot Stain according to the manufacturer’s instructions (Molecular Probes). Fluorescence-labeled slides were scanned on a GenePix 4400 AL scanner, along with accompanying negative control slides, at an appropriate PMT to obtain optimal signal for this specific set of samples. The images were analyzed with GenePix Pro 7.0 (Molecular Devices). Total fluorescence signal intensities of each spot were obtained after subtraction of the local background signal for each slide and were then normalized for variation in total protein, background and non-specific labeling using a group-based normalization method. For each spot on the array, the-background-subtracted foreground signal intensity was subtracted by the corresponding signal intensity of the negative control slide (omission of primary antibody) and then normalized to the corresponding signal intensity of total protein for that spot. Each image, along with its normalized data, was evaluated for quality through manual inspection and control samples. Antibody slides that failed the quality inspection were either repeated at the end of the staining runs or removed before data reporting. The 24 samples (in triplicates) were extracted from the normalized data and then log2 transformed. For each sample, the median value of the three technical replicates was used for statistical analysis. One-way analysis of variance (ANOVA) and Turkey post-hoc test was used for group comparisons. P-value < 0.05 was considered statistically significant.
Western blotting.
Tumor lysates prepared for RPPA were also used for Western blot. Briefly, 20μg protein from each sample was used for 10% polyacrylamide gel electrophoresis, followed by transferring onto nitrocellulose membrane (Biorad, Cat. # 162–0115), blocking with Odyssey Blocking Buffer (PBS) (LI-COR, Lincoln, NE, Cat. # 927–40000) at room temperature for 1h, incubating with primary antibodies at room temperature for 1h and Infrared (IR)-labeled secondary antibodies (IRdye800CW goat anti-rabbit IgG, Cat. 92532211) at room temperature for 1h. Membranes were imaged and quantified using Odyssey Infrared Imaging System and its application software Version 3.0.30 (LI-COR). Newblot Nitro Striping Buffer (LI-COR, Cat. #928–40030) was used for antibody striping and subsequent probing with a different antibody. All first antibodies used are from Cell Signaling Technology (CST): anti-Phospho-MEK1/2 (Ser217/221) antibody (Cat. #9121, 1:1000); anti-MEK1/2 antibody (Cat. #9122, 1:1000); anti-Phospho-p44/42MAPK (Erk1/2) (Thr202/Try204) antibody (Cat. # 4377, 1:1000); and anti-p44/42 MAPK (Erk1/2) antibody (Cat. #9102, 1:1000). Odyssey Protein Molecular Weight Marker (LI-COR, Cat. 928–40000) was used as molecular weight reference.
Statistical analysis.
Each value reported represents the means ± standard deviations of at least three biological replicates. An unpaired two-tailed Student’s t-test (if normally distributed) was used to test the significance of difference between two means. One way ANOVA was used to test the significance of difference among more than two groups. Kaplan-Meier plots were generated by GraphPad software, which uses the Log-rank (Mantel-Cox) test. The stem cell frequencies were calculated using the limdil function in the statmod software package, which is part of R (http://bioinf.wehi.edu.au/software/limdil/index.html).
Results
Precancerous cells in the MMTV-Wnt1 model of breast cancer can be transformed to tumors by mutational activation of RAS
The MMTV-Wnt-1 transgenic mouse model expresses the Wnt-1 transgene in the mammary epithelium under the control of the MMTV LTR, and develops widespread hyperplastic/dysplastic lesions in mammary glands starting by 4–6 weeks of age (28, 38). Precancerous lesions in this model contain multiple cell lineages including cells expressing genes encoding different keratins such as KRT5, 14, 8, and 6 (20), as well as cells producing the whey acidic milk protein (WAP) (Supplementary Fig. S1), which has been often associated with differentiated mammary epithelial cells (39). Stochastic tumors arise from undefined cells in these precancerous lesions with a median latency of six months (28, 38). One-half of the resulting tumors harbor mutated Hras (25), suggesting that RAS activation may play important roles in transforming a subset of these precancerous cells to cancer. Overexpression of Nras can also promote tumorigenesis in MMTV-Wnt1 mice (40).
To determine whether a subset of cells in precancerous lesions in MMTV-Wnt1 mice can be transformed to cancer by RAS activation alone, we used intraductal injection to deliver the lentiviral vector FU-CGW (35) carrying HrasQ61L. This virus infects cells exposed to the ductal lumen non-selectively (30). Palpable tumors were detected within one week post infection, while none of the mice injected with the vector alone developed tumors during the same period of time (Supplementary Fig. S2). Intraductal injection of a lentiviral vector carrying inducible expression of either KrasG12D or NrasG12V also led to swift tumor appearance (Supplementary Fig. S2). Together, these data indicate that at least one subset of cells in these precancerous lesions can be transformed to tumors by RAS activation in this MMTV-Wnt1 model of breast cancer.
Keratin 6-positive precancerous cells are stem cells and are readily induced to form cancer
The cell subpopulations in precancerous lesions of the mammary gland have not been well-defined. Expression of cytokeratin 6a (Krt6a), the predominant form of Krt6 in the mammary gland, identifies bipotential progenitor cells in normal mammary glands (11). These KRT6A+ cells are amplified in precancerous lesions and tumors in MMTV-Wnt1 mice (20), suggesting that this population of cells may be expanded by Wnt1 and may contribute to the subsequent cancer. Unlike their normal counterparts, KRT6A+ precancerous cells lack the epithelial lineage markers KRT8 and estrogen receptor α (ERα) (Supplementary Fig. S3), suggesting that their differentiation status may have changed. To test whether they have gained stem cell properties, we crossed MMTV-Wnt1 mice with K6a-tva mice (11), which express the cDNA encoding the cell surface protein TVA under the control of the Krt6a gene promoter. This GPI-linked cell surface protein enables fluorescence-activated cell sorting (FACS) of live KRT6A+ cells while, as the cellular receptor for avian leucosis virus (ALV), it also sensitizes KRT6A+ cells for ALV-mediated delivery of the GFP gene or an oncogene into the cells for lineage-tracing and tumorigenesis in later studies (11). Therefore, we used the anti-TVA antibody to isolate live KRT6A+ precancerous mammary epithelial cells, and determined their potential in regenerating precancerous lesions in comparison to the general precancerous cell population by a limiting dilution transplantation assay (Fig. 1A). As shown in Table 1 and Fig. 1B, these KRT6A+ precancerous cells were 22-fold better at regenerating hyperplastic/dysplastic mammary tissues – similar to those found in MMTV-Wnt-1 transgenic mice – than the general cell population. Furthermore, these resulting precancerous tissues also harbored multiple cell lineages (Fig. 1C), suggesting that KRT6A is a marker of stem cells in mammary precancerous lesions.
Figure 1. Krt6a-positive cells in K6a-tva/MMTV-Wnt1 mammary glands are enriched for precancerous stem cells.
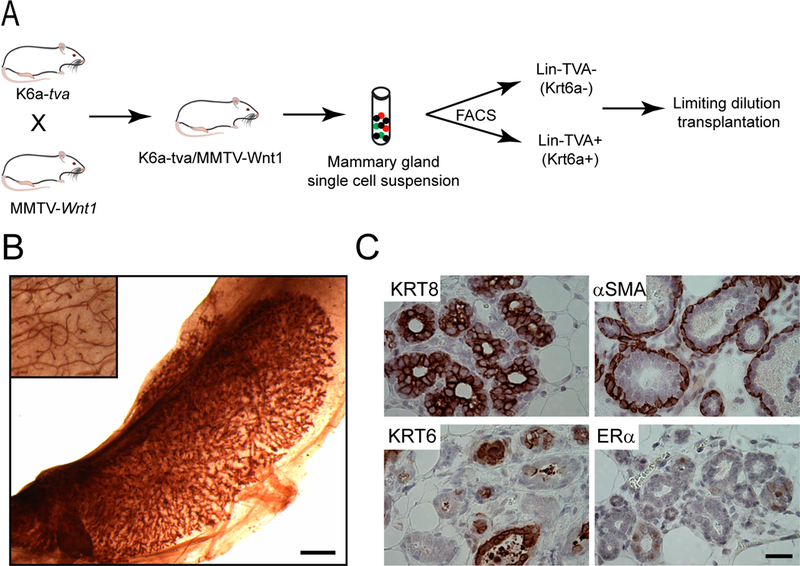
(A) Experimental design of limiting dilution transplantation (LDT). (B) Representative whole mount image of the outgrowth of Lin-TVA+ cells in the #4 cleared fat pad of a recipient mouse. The inset shows the endogenous #2 gland of the same recipient mouse. Scale bar = 1mm. (C) Lin-TVA+ cells give rise to multiple cell lineages. IHC images show the expression of different cell type markers in the outgrowth of Lin-TVA+ cells. Scale bar = 20μm. Lin: non-epithelial cell lineage markers.
Table 1.
KRT6A-positive cells in hyperplastic MMTV-Wnt1 mammary glands are enriched for precancerous stem cells
| No. cells transplanted per fat pad | No. outgrowths/transplantations | |
|---|---|---|
| Lin-TVA- | Lin-TVA+ | |
| 10,000 | 4/4 | |
| 2,000 | 5/8 | |
| 1,000 | 0/4 | |
| 200 | 0/9 | 8/9 |
| 100 | 2/4 | |
| 50 | 1/8 | |
| 10 | 0/3 | |
| Frequency of stem cell (95% CI) | 1/2965 (6181~1422) | 1/137 (251~75) |
| p-value | 7.7E-09 | |
Limiting dilution transplantation of mammary gland cells from K6a-tva/MMTV-Wnt1 mice. Lin: non-epithelial cell lineage markers
Having prospectively defined a precancerous stem cell (PcSC) population, we next determined whether these KRT6A+ PcSCs are the cellular precursor to the eventual cancer. We used the RCAS-TVA technology that we had previously adapted to the mammary gland (29, 41–43). Nine-week-old mice bi-transgenic for K6a-tva/MMTV-Wnt1 were injected with RCAS virus (a modified ALV) carrying HrasQ61L (107 IUs per gland) (27) or the control virus RCAS-Actb (producing HA-tagged β-actin) (33). Tumors were palpated in all RCAS-HrasQ61L-infected mice within two weeks, but not in the control virus-injected mice (Fig. 2A). PCR confirmed RCAS-HrasQ61L provirus in all the resulting tumors (Fig. 2A). RCAS-HrasQ61L at the same dosage injected into K6a-tva mono-transgenic mice did not cause tumors even after more than three months (Supplementary Fig. S4), indicating that HRASQ61L alone is not adequate to transform normal KRT6A+ progenitor cells to cancer in the absence of Wnt1 stimulation. A much stronger oncogene, such as PyMT, was needed to transform these cells without the sensitization by Wnt1 (Supplementary Fig. S4).
Figure 2. Mutated HRAS, BRAF and ERBB2 can transform Krt6a+ PcSC cells in the hyperplastic lesion of MMTV-Wnt1 mammary glands.
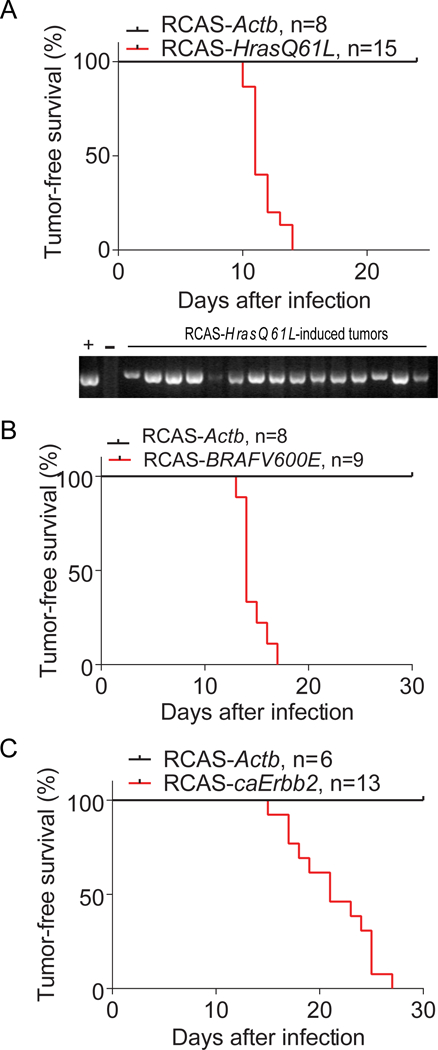
Tumor-free survival Kaplan-Meier plots of K6a-tva/MMTV-Wnt1 mice with mammary glands intraductally infected by RCAS-HrasQ61L (A), RCAS-BRAFV600E (B), and RCAS-caErbb2 (C), respectively. RCAS-Actb-infected mammary glands were used as negative controls. n = mouse number. The gel picture below A shows that Tumors induced by RCAS-HrasQ61L contain RCAS-HrasQ61L provirus. Genomic DNA extracted from tumors from K6a-tva/MMTV-Wnt1 mice infected by RCAS-HrasQ61L was detected for RCAS-HrasQ61L provirus by PCR. The RCAS-HrasQ61L plasmid was used as positive control (+). The genomic DNA from spontaneous MMTV-Wnt1 tumor was used as negative control (−).
We also tested whether another RAS family member can transform these KRT6A+ PcSCs to cancer. Intraductal injection of RCAS-KrasG12D (44) into K6a-tva/MMTV-Wnt1 bi-transgenic mice also led to swift tumor induction (Supplementary Fig. S5). This mutated RAS isoform also failed to transform normal KRT6A+ or other cells marked by the MMTV transgenic promoter within the same window of time as demonstrated by intraductal injection of RCAS-KrasG12 at the same dosage into either K6a-tva mice or MMTV-tva mono-transgenic mice (Supplementary Fig. S5). Together, these data indicate that the KRT6A+ PcSCs can be readily transformed to cancer by either mutated Hras or mutated Kras.
Furthermore, we asked whether these KRT6A+ PcSCs can be transformed to cancer by other oncogenic mutations. Using similar approaches, we tested the mutated BRAF and ERBB2. RCAS-mediated intraductal delivery of either BRAFV600E or caErbb2 (a constitutively activate version of ERBB2/HER2/Neu (29)) into K6a-tva/MMTV-Wnt1 bi-transgenic mice also led to rapid tumor appearance (Fig. 2B & C). In aggregate, these data demonstrate that the KRT6A+ PcSCs can be readily transformed to cancer.
WAP+ precancerous cells are distinct from KRT6A+ cells, more differentiated, and are also vulnerable to progression to cancer
Next, we tested whether other cell subpopulations in these precancerous lesions in MMTV-Wnt1 mice can also be readily transformed to cancer. WAP protein is a milk protein produced by differentiated mammary epithelial cells (39). Therefore, WAP-expressing precancerous cells are likely also differentiated, and if so, may be different from PcSCs in response to an oncogene. We have previously made a Wap gene promoter-driven tva-expressing transgenic mouse line, WAP-tva (31). We crossed this line with MMTV-Wnt1 mice to generate WAP-tva/MMTV-Wnt1 bitransgenic mice. Flow cytometry following anti-TVA staining detected abundant numbers of WAP+ precancerous cells (23.8 ± 8.9%, n = 4) in WAP-tva/MMTV-Wnt1 mice (8~9-weeks-old). These WAP+ cells expressed transgenic and endogenous Wnt1 at levels comparable to the KRT6A+ cells (Supplementary Fig. S6). To test whether these WAP+ precancerous cells indeed lack stem cell properties, we isolated these TVA+ cells by FACS using the anti-TVA antibody and performed a limiting dilution transplantation assay. As shown in Table 2, these WAP+ precancerous cells were no better than the general precancerous cell population at regenerating precancerous lesions, suggesting that these WAP+ precancerous cells lack stem cell properties, unlike the KRT6A+ cells.
Table 2.
WAP-positive cells in hyperplastic MMTV-Wnt1 mammary glands are not enriched for precancerous stem cells
| Transplanted cell # | Outgrowths/transplants | |
|---|---|---|
| Lin-TVA- | Lin-TVA+ | |
| 2000 | 4/6 | 1/6 |
| 1000 | 2/4 | 2/4 |
| 500 | 1/6 | 2/6 |
| 200 | 0/6 | 0/6 |
| 100 | 1/6 | 0/6 |
| Frequency of stem cells (95% CI) | 1/1836 (3736–902) | 1/3631 (8974–1469) |
| p-value | 0.23 | |
Limiting dilution transplantation of mammary gland cells from WAP-tva/MMTV-Wnt1 mice. Lin: non-epithelial cell lineage markers.
To validate further that these WAP+ cells are a cell population distinct from KRT6A+ precancerous cells, we injected RCAS-GFP into WAP-tva/MMTV-Wnt1 mice (12-week-old), and collected the mammary glands one week later for co-immunofluorescence for GFP and KRT6 (there are no KRT6A isoform-specific antibodies available) (Fig. 3A). Among 590 GFP+ cells surveyed in three infected mice, only seven cells (1.3 ± 0.9%) were detected by this pan-KRT6 antibody (Fig. 3B). These data indicate that WAP+ precancerous cells do not significantly overlap with KRT6A+ cells and could be used for comparison with KRT6A+ cells for susceptibility to transformation.
Figure 3. Mutated HRAS and BRAF can transform non-PcSC WAP+ cells in the hyperplastic lesion of MMTV-Wnt1 mammary glands.
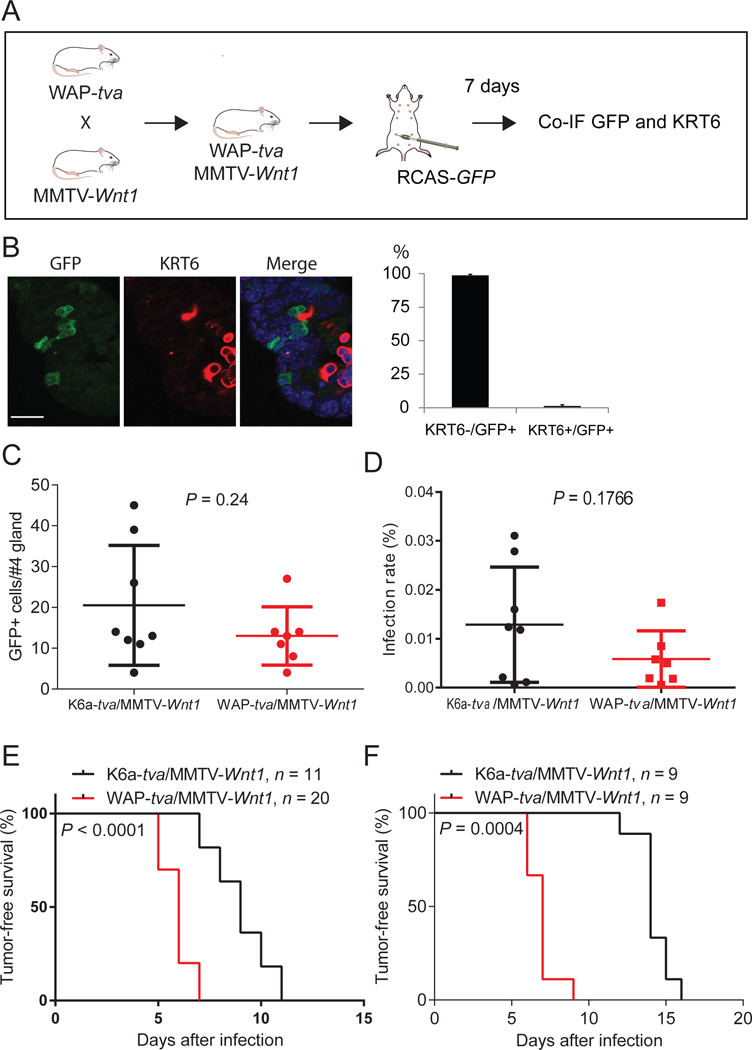
(A) Diagram of experimental design to examine whether TVA+ cells from WAP-tva/MMTV-Wnt1 contain Krt6+ cells. Co-IF, co-immunofluorescent staining. (B) Co-IF of GFP and KRT6 on mammary glands generated from experiment shown in A. The quantification of the percentages of KRT6- and KRT6A+ cells among GFP+ cells are shown next to the image. n = 3, mouse age = 13 weeks. Scale bar = 20μm. (C and D) Identification of the dosages of RCAS virus used to infect similar small numbers of cells in Krt6a-tva/MMTV-Wnt1 vs. WAP-tva/MMTV-Wnt1 mammary glands. The doses of 4×10⁶ and 1×10⁵ IUs of RVAS-GFP per gland for Krt6a-tva/MMTV-Wnt1 and WAP-tva/MMTV-Wnt1 mice, respectively, infected similar small numbers of cells (C) and percentages of cells (D). (E and F) Tumors can be induced from both KRT6A+ and WAP+ cells in MMTV-Wnt1 mammary precancerous lesions by HRASQ61L or BRAFV600E. Kaplan-Meier tumor-free survival plots of K6a-tva/MMTV-Wnt1 and WAP-tva/MMTV-Wnt1 mice infected by RCAS-HrasQ61L (D) and RCAS-BRAFV600E (E), respectively. The virus dosages used were the same as used in C and D.
To test the susceptibility of WAP+ precancerous cells to tumor induction in comparison with the KRT6A+ PcSC cells, we had to ensure that a secondary oncogene was delivered into similar numbers of WAP+ cells vs. KRT6A+ cells. To this end, we experimented with different RCAS-GFP dosages in K6a-tva/MMTV-Wnt1 mice vs. WAP-tva/MMTV-Wnt1 mice. We found that injection of 4×10⁶ IUs of virus into K6a-tva/MMTV-Wnt1 and 1×10⁵ IUs of virus into WAP-tva/MMTV-Wnt1 mice achieved similar numbers of infected cells (20.5 ± 14.7 and 13.0 ± 7.2, respectively; p = 0.24; Fig. 3C) as well as similar percentages of infected cells (Fig. 3D). It is also important to note that with this low infection rate, the infected WAP+ precancerous cell group in any single mouse is unlikely to harbor any KRT6A+ cells that may complicate the interpretation of the tumorigenic data – only 1.3% of infected WAP+ cells produced KRT6A/B, and even if these were all KRT6A+, only one KRT6A+ cell in every 4–5 WAP-tva/MMTV-Wnt1 mice would be expected to be infected. This low infection rate also minimized concerns of infecting any PcSCs in WAP-tva/MMTV-Wnt1 mice, since potential PcSCs among WAP+ precancerous cells were extremely low (Table 2). Using these two different viral doses, we injected RCAS-HrasQ61L into these two cohorts of mice. As shown in Fig. 3E, tumors appeared swiftly in all WAP-tva/MMTV-Wnt1 mice, with a median latency of only six days, indicating that WAP+ precancerous cells are also highly vulnerable to transformation by HrasQ61L. Surprisingly, the latency was even shorter than that in K6a-tva/MMTV-Wnt1 mice (p < 0.0001), further highlighting the high vulnerability of this WAP+ precancerous cell population to transformation.
To further confirm that WAP+ precancerous cells are highly susceptible to transformation, we also injected RCAS-BRAFV600E intraductally into these two cohorts of mice and compared their tumor latencies. Once again, tumors appeared quickly in all WAP-tva/MMTV-Wnt1 mice, even more rapidly than in K6a-tva/MMTV-Wnt1 mice (p = 0.0004; Fig. 3F). Taken together, these data demonstrate that the WAP+ precancerous cells are highly susceptible to tumor induction by an oncogene, and that they are likely to be more susceptible than the KRT6A+ PcSCs in these lesions. Thus, preexisting stemness is not required for precancerous cells to be transformed into cancer, and there are multiple cell subsets in precancerous lesions that may contribute to the eventual cancer.
KRT6A+ PcSC and WAP+ precancerous cells produce different carcinomas
Breast tumors in different patients can be widely different in histopathology, biomarkers, and patterns of spread to secondary organs. The differentiation status of the cancer-initiating cells in the normal mammary tissue has been reported to affect many characteristics of the resulting tumor (11, 14, 16, 17, 31, 45–47). However, it is not known whether different cell subpopulations in the precancerous lesions also evolve into distinct cancers.
We compared these two groups of cancers for potential differences in signaling pathways. We prepared protein lysates from both HasQ61L- and BRAFV600E-induced tumors from both K6a-tva and WAP-tva mice and conducted reverse phase protein array (RPPA). As shown in Fig. 4A, while most elevated proteins are in the tumors originated from KRT6A+ PcSCs, five upregulated proteins are in the tumors originated from WAP+ cells. Two out of the five upregulated proteins belong to the RAS-RAF signaling pathway: phospho-MEK1/2(S217/221) and phospho-ERK1/2(T202/Y204). The elevation of these two proteins were confirmed by Western blotting (Fig. 4B and C), indicate an enhanced RAS-RAF signaling pathway. Collectively, these data suggest that WAP+ precancerous cells may be better equipped to activate MEK/ERK signaling pathway than KRT6A+ precancerous cells after suffering a Ras mutation, potentially explaining why the former cells evolved into cancer more swiftly. Of note, this increased RAS signaling is not due to elevated Ras expression in WAP+ precancerous cells compared to KRT6A+ precancerous cells, as Ras isoforms were detected at lower levels in the former cell subset (Supplementary Fig. S7).
Figure 4. MEK/ERK signaling is elevated in tumors originated from WAP+ cells.
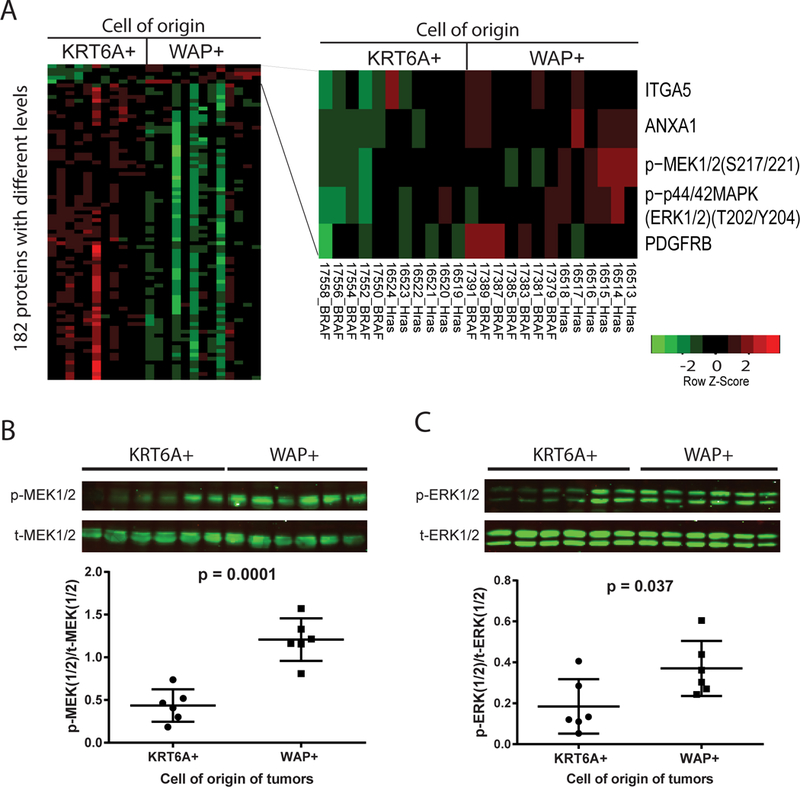
(A) Heat map of differential levels of total and phosphoproteins between tumors induced from WAP-tva/MMTV-Wnt1 mice (6 by RCAS-HrasQ61L and 7 by RCAS-BRAFV600E) and K6a-tva/MMTV-Wnt1 mice (6 by RCAS-HrasQ61L and 5 by RCAS-BRAFV600E) as detected by RPPA. Proteins elevated in tumors originated from WAP+ cells are listed on the right. (B and C) Western blot of total and phosphorylated MEK1/2 (B) and ERK (C) in RCAS-HrasQ61L-induced tumors from WAP-tva/MMTV-Wnt1 and K6a-tva/MMTV-Wnt1 mice. The quantification of Western blot is shown below each corresponding image.
We also analyzed the histopathologic features of the tumors originating from the KRT6A+ and WAP+ precancerous cells. Tumors arising in K6a-tva /MMTV-Wnt1 mice infected by RCAS-HrasQ61L and RCAS-BRAFV600E as well as RCAS-KrasG12D and RCAS-caErbb2 were all adenocarcinoma (Fig. 5A and Supplementary Fig. S8); however, tumors in WAP-tva/MMTV-Wnt1 mice infected by RCAS-HrasQ61L and RCAS-BRAFV600E were all metaplastic carcinoma with squamous differentiation and widespread keratin pearls (Fig. 5A) as well as with notable necrosis (Supplementary Fig. S8). Immunohistochemical staining using lineage markers confirmed these histological characteristics – tumors in the former cohort expressed differentiated luminal cell markers such as KRT8 and ERα, retained KRT6 in some of the tumor cells, and showed evidence of some basal cells based on KRT5. However, tumors in the latter cohort lacked KRT8 and ERα while many tumor cells gained the squamous markers KRT5, KRT6, and loricrin (Fig. 5B). Together, these data demonstrate that the differentiation status of cancer precursor cells in precancerous lesions can influence the phenotype of the resulting tumors (Fig. 5C). In addition, the demonstration of distinct tumors arising in these two cohorts of mice further confirmed that our RCAS-mediated approach indeed delivered the oncogene into distinct cell subsets in the precancerous lesions in this model.
Figure 5. Tumors induced from Krt6a+ and WAP+ cells by HrasQ61L are different.
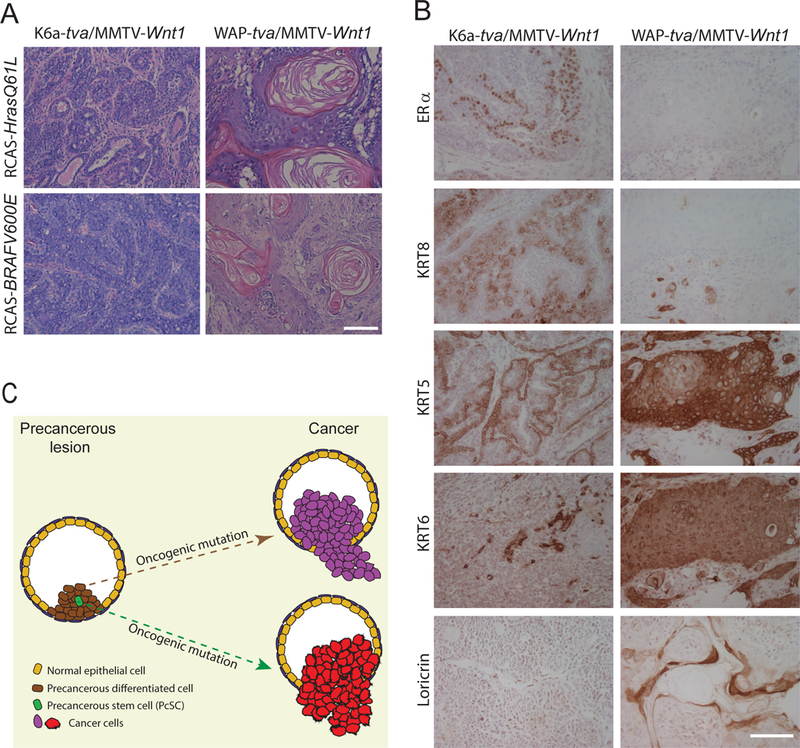
(A) Tumors originated from Krt6+ and WAP+ cells are significantly different. Representative HE staining of tumors induced from Krt6+ (left) and WAP+ (right) precancerous cells by the viruses indicated. (B) Immunohistochemical staining of the indicated markers was performed for tumors induced from K6a-tva/MMTV-Wnt1 (left) and WAP-tva/MMTV-Wnt1 (right) mammary glands by RCAS-HrasQ61L. Scale bar = 100μm. (C) Diagram to show that the cellular origin of cancer in mammary precancerous lesions defines breast cancer subtype.
Discussion
Precancerous lesions are a crucial intermediate tissue between the normal tissue and malignancy, but the cellular hierarchy of these lesions has been speculative and elusive in most tissues, including the mammary gland (20). Here, we provide direct evidence that there indeed exists a precancerous stem cell hierarchy in the precancerous lesions of mammary glands. The stem-like cells in these lesions are distinct from the normal mammary gland stem cells (11); therefore, we named them precancerous stem cells (PcSCs). The cell of origin of these PcSCs remains to be determined. They may be the product of the dedifferentiation of normal KRT6A+ progenitor cells caused by aberrant Wnt1 signaling. Overexpressed Wnt1 may also induce Krt6a expression in normal stem cells, which otherwise do not produce KRT6A (11), and drive them into PcSCs. The molecular network maintaining the stemness in these PcSCs also remains to be dissected. Wnt signaling is known to confer and maintain stemness in normal and cancerous cells (48). While Wnt1 expression levels were similar between KRT6A+ PcSCs and WAP+ precancerous cells (Fig. S6), the downstream pathway may be more activated although staining for nuclear beta-catenin in this model remains a challenge. RAS has been reported to regulate stemness (47), and Hras and Kras were detected at higher levels in KRT6A+ PcSCs than in WAP+ precancerous cells (Supplementary Fig. S7), and they potentially could help stemness in these PcSCs.
Previous studies in cell of origin of cancer have primarily focused on identifying cells in the normal tissue that can evolve into cancer (2, 11–13, 31, 49–51). However, the cancer precursor cells in precancerous lesions remains largely unclear. Here, with the identification of PcSCs and a WAP+ more differentiated cell subset, we were able to seek insight into this critical issue. We found that both PcSCs and non-PcSCs can be readily transformed into cancer. This finding demonstrates that stemness is not a prerequisite for a precancerous cell to progress to cancer, and that oncogene-induced gain of stemness can occur during the progression from precancerous lesions to cancer. Therefore, while the normal KRT6A+ progenitor cells may progress to PcSCs upon Wnt stimulation, the more differentiated progeny in the precancerous lesions may also progress to cancer stem cells (CSCs). Consequently, stemness can be gained at multiple steps in tumorigenesis.
We observed that the more differentiated WAP+ precancerous cells were even more susceptible to cancer induction than the KRT6A+ PcSCs. Although the underlying mechanism remains to be determined, the enhanced RAS/MEK/ERK signaling in the tumors originated from WAP+ cells provides one potential explanation. RAS has been reported to activate JAK2/STAT5 signaling (40, 47). We have previously reported that STAT5 activation can lower the apoptosis anticancer barrier in precancerous cells and promote their progression to cancer (10, 27). STAT5 is also the principal transcriptional factor for WAP, and is activated to higher levels in WAP+ cells than in other cells (31). Therefore, STAT5 activation may underlie the increased susceptibility of these WAP+ precancerous cells to tumor induction by secondary oncogenic mutations.
Previous studies from us and others have indicated that different cell types in the normal mammary gland can evolve into distinct tumors upon the gain of the same oncogenic drivers (11, 14, 16, 17, 31, 45–47). But what has been neglected was the potential role of the differentiation status of precancerous cells on cancer phenotype. Our work revealed a crucial contribution of the precancerous cell subpopulations to the phenotypes of the resulting cancer. Therefore, cancer heterogeneity can arise from multiple stages during cancer initiation. We have previously found plasticity of WAP+ normal mammary cells in differentiating into basal cells upon the activation of ERBB2 (13), and Keller et al. (47) have reported transformation of CD10+ normal basal/myoepithelial cells into metaplastic tumors with squamous differentiation; but it is striking that WAP+ precancerous cells evolved into metaplastic tumors with widespread squamous differentiation upon the gain of either mutated HRAS or mutated BRAF. At this time, we do not know the molecular mechanism responsible for the divergent histopathological paths of KRT6A+ precancerous cells vs. WAP+ precancerous cells. As these differentiated WAP+ precancerous cells gave rise to tumors comprised of different cell lineages, dedifferentiation and concurrent gain of stemness may have occurred following Ras mutations. This is possible as RAS has been reported to confer stemness (52), and our RPPA data also suggest an enhanced RAS signaling in the resulting tumors. However, this potential gain of stemness does not seem to arise from epithelial-to-mesenchymal transition (EMT) in WAP+ precancerous cells as vimentin, a key marker in EMT, was detected in WAP+ precancerous cells at low and comparable levels found in KRT6A+ precancerous cells (Supplementary Fig. S7).
The results reported here have several clinical implications. First, since multiple cell subsets in precancerous lesions, upon suffering an oncogenic driver mutation, can evolve into cancer, cancer prevention should be strategized to eliminate both stem cells and more differentiated cells in developing precancerous lesions. As JAK-STAT signaling is activated in large proportions of cells in human ADH (53), likely in both PcSCs and more differentiated cells, and maintains cell viability (54), targeting it may be a value alternative to anti-estrogenic chemoprevention, which prevents ER+ cancer only (54, 55). Preclinical data are promising (10, 27), and a window-of-opportunity clinical trial for the proof of principle is ongoing (https://clinicaltrials.gov/ct2/show/NCT02928978?term=ruxolitinib&rank=2). Second, while patient tumors are increasingly sequenced for driver mutations to help guide the selection of target therapeutics, our data suggest that tumors with the same set of oncogenic drivers may have vast differences in histopathological features, protein profiles, and other characteristics and may thus require better tailored treatment plans. Conversely, histologically distinct tumors may share the same set of oncogenic drivers, and a targeted drug proven to be effective in one histological subtype may also be efficacious in another histological subtype when the same driver mutations are shared; therefore, it is important to profile oncogenic mutations even in histologically obscure tumors so as to take full advantage of currently available targeted therapeutics.
Supplementary Material
Statement of Significance:
This work uses a novel mouse mammary gland cancer model to show that tumors initiated from different precancerous mammary epithelial cells are distinct.
Acknowledgements
We thank Drs. Jeffrey M. Rosen, Xiang Zhang, and Gary C. Chamness for stimulating discussions and/or critical review of this manuscript; Fuli Jia and Danli Wu for technical support with RPPA experiments and Cristian Coarfa and Kimal Rajapakshe for assistance with analysis of RPPA data. The authors also acknowledge the assistance of the BCM Breast Center Pathology Core and BCM Cytometry and Cell Sorting Core with the assistance of Joel M. Sederstrom.
Financial support: This work was supported in part by funds from NIH R01CA204926 (Y.L.), R01CA205594 (Y.L.), U54CA149196 (S.T.C.W.), NIH CA125123 (C.J.C.), and P50CA186784 (Y.L.); and from Susan G. Komen for the Cure PDF15330612 (Y.L.); as well as by resources from the Dan L. Duncan Cancer Center (P30CA125123). BCM Cytometry and Cell Sorting Core with funding from the NIH (NIAID P30AI036211, NCI P30CA125123, and NCRR S10RR024574); BCM Antibody-Based Proteomics Core for RPPA experiments with funding from a Cancer Prevention & Research Institute of Texas Core Facility Support Award (RP170005) (D.P.E. and S.H.) and NCI Cancer Center Support Grant (P30CA125123) (D.P.E. and S.H.).
Footnotes
Conflict of interest disclosure statement: The authors declare no potential conflicts of interest.
References
- 1.Reya T, Morrison SJ, Clarke MF, Weissman IL. Stem cells, cancer, and cancer stem cells. Nature. 2001;414(6859):105–11. [DOI] [PubMed] [Google Scholar]
- 2.Visvader JE. Cells of origin in cancer. Nature. 2011;469(7330):314–22. [DOI] [PubMed] [Google Scholar]
- 3.Navin N, Kendall J, Troge J, Andrews P, Rodgers L, McIndoo J, et al. Tumour evolution inferred by single-cell sequencing. Nature. 2011;472(7341):90–4. [DOI] [PMC free article] [PubMed] [Google Scholar]
- 4.Skibinski A, Kuperwasser C. The origin of breast tumor heterogeneity. Oncogene. 2015. [DOI] [PMC free article] [PubMed] [Google Scholar]
- 5.Wahl GM, Spike BT. Cell state plasticity, stem cells, EMT, and the generation of intra-tumoral heterogeneity. NPJ breast cancer. 2017;3:14. [DOI] [PMC free article] [PubMed] [Google Scholar]
- 6.Barker N, Ridgway RA, van Es JH, van de Wetering M, Begthel H, van den Born M, et al. Crypt stem cells as the cells-of-origin of intestinal cancer. Nature. 2009;457(7229):608–11. [DOI] [PubMed] [Google Scholar]
- 7.Liu C, Sage JC, Miller MR, Verhaak RG, Hippenmeyer S, Vogel H, et al. Mosaic analysis with double markers reveals tumor cell of origin in glioma. Cell. 2011;146(2):209–21. [DOI] [PMC free article] [PubMed] [Google Scholar]
- 8.Friedmann-Morvinski D, Bushong EA, Ke E, Soda Y, Marumoto T, Singer O, et al. Dedifferentiation of neurons and astrocytes by oncogenes can induce gliomas in mice. Science. 2012;338(6110):1080–4. [DOI] [PMC free article] [PubMed] [Google Scholar]
- 9.Alcantara Llaguno S, Chen J, Kwon CH, Jackson EL, Li Y, Burns DK, et al. Malignant astrocytomas originate from neural stem/progenitor cells in a somatic tumor suppressor mouse model. Cancer Cell. 2009;15(1):45–56. [DOI] [PMC free article] [PubMed] [Google Scholar]
- 10.Haricharan S, Dong J, Hein S, Reddy JP, Du Z, Toneff M, et al. Mechanism and preclinical prevention of increased breast cancer risk caused by pregnancy. eLife. 2013;2(0):e00996. [DOI] [PMC free article] [PubMed] [Google Scholar]
- 11.Bu W, Chen J, Morrison GD, Huang S, Creighton CJ, Huang J, et al. Keratin 6a marks mammary bipotential progenitor cells that can give rise to a unique tumor model resembling human normal-like breast cancer. Oncogene. 2011;30(43):4399–409. [DOI] [PMC free article] [PubMed] [Google Scholar]
- 12.Bu W, Zhang X, Dai H, Huang S, Li Y. Mammary Cells with Active Wnt Signaling Resist ErbB2-Induced Tumorigenesis. PLoS One. 2013;8(11):e78720. [DOI] [PMC free article] [PubMed] [Google Scholar]
- 13.Hein SM, Haricharan S, Johnston AN, Toneff MJ, Reddy JP, Dong J, et al. Luminal epithelial cells within the mammary gland can produce basal cells upon oncogenic stress. Oncogene. 2016;35(11):1461–7. [DOI] [PMC free article] [PubMed] [Google Scholar]
- 14.Molyneux G, Geyer FC, Magnay FA, McCarthy A, Kendrick H, Natrajan R, et al. BRCA1 basal-like breast cancers originate from luminal epithelial progenitors and not from basal stem cells. Cell stem cell. 2010;7(3):403–17. [DOI] [PubMed] [Google Scholar]
- 15.Lim E, Vaillant F, Wu D, Forrest NC, Pal B, Hart AH, et al. Aberrant luminal progenitors as the candidate target population for basal tumor development in BRCA1 mutation carriers. Nature medicine. 2009;15(8):907–13. [DOI] [PubMed] [Google Scholar]
- 16.Koren S, Reavie L, Couto JP, De Silva D, Stadler MB, Roloff T, et al. PIK3CA(H1047R) induces multipotency and multi-lineage mammary tumours. Nature. 2015;525(7567):114–8. [DOI] [PubMed] [Google Scholar]
- 17.Van Keymeulen A, Lee MY, Ousset M, Brohee S, Rorive S, Giraddi RR, et al. Reactivation of multipotency by oncogenic PIK3CA induces breast tumour heterogeneity. Nature. 2015. [DOI] [PubMed] [Google Scholar]
- 18.Henry MD, Triplett AA, Oh KB, Smith GH, Wagner KU. Parity-induced mammary epithelial cells facilitate tumorigenesis in MMTV-neu transgenic mice. Oncogene. 2004;23(41):6980–5. [DOI] [PubMed] [Google Scholar]
- 19.Morrow M, Schnitt SJ, Norton L. Current management of lesions associated with an increased risk of breast cancer. Nature reviews Clinical oncology. 2015;12(4):227–38. [DOI] [PubMed] [Google Scholar]
- 20.Li Y, Welm B, Podsypanina K, Huang S, Chamorro M, Zhang X, et al. Evidence that transgenes encoding components of the Wnt signaling pathway preferentially induce mammary cancers from progenitor cells. Proceedings of the National Academy of Sciences of the United States of America. 2003;100(26):15853–8. [DOI] [PMC free article] [PubMed] [Google Scholar]
- 21.Schepers AG, Snippert HJ, Stange DE, van den Born M, van Es JH, van de Wetering M, et al. Lineage tracing reveals Lgr5+ stem cell activity in mouse intestinal adenomas. Science. 2012;337(6095):730–5. [DOI] [PubMed] [Google Scholar]
- 22.Kinzler KW, Vogelstein B. Lessons from hereditary colorectal cancer. Cell. 1996;87(2):159–70. [DOI] [PubMed] [Google Scholar]
- 23.Wright AA, Howitt BE, Myers AP, Dahlberg SE, Palescandolo E, Van Hummelen P, et al. Oncogenic mutations in cervical cancer: genomic differences between adenocarcinomas and squamous cell carcinomas of the cervix. Cancer. 2013;119(21):3776–83. [DOI] [PMC free article] [PubMed] [Google Scholar]
- 24.Ratushny V, Gober MD, Hick R, Ridky TW, Seykora JT. From keratinocyte to cancer: the pathogenesis and modeling of cutaneous squamous cell carcinoma. The Journal of clinical investigation. 2012;122(2):464–72. [DOI] [PMC free article] [PubMed] [Google Scholar]
- 25.Podsypanina K, Li Y, Varmus HE. Evolution of somatic mutations in mammary tumors in transgenic mice is influenced by the inherited genotype. BMC Med. 2004;2:24. [DOI] [PMC free article] [PubMed] [Google Scholar]
- 26.D’Cruz CM, Gunther EJ, Boxer RB, Hartman JL, Sintasath L, Moody SE, et al. c-MYC induces mammary tumorigenesis by means of a preferred pathway involving spontaneous Kras2 mutations. Nature medicine. 2001;7(2):235–9. [DOI] [PubMed] [Google Scholar]
- 27.Johnston AN, Bu W, Hein S, Garcia S, Camacho L, Xue L, et al. Hyperprolactinemia-inducing antipsychotics increase breast cancer risk by activating JAK-STAT5 in precancerous lesions. Breast cancer research : BCR. 2018;20(1):42. [DOI] [PMC free article] [PubMed] [Google Scholar]
- 28.Tsukamoto AS, Grosschedl R, Guzman RC, Parslow T, Varmus HE. Expression of the int-1 gene in transgenic mice is associated with mammary gland hyperplasia and adenocarcinomas in male and female mice. Cell. 1988;55(4):619–25. [DOI] [PubMed] [Google Scholar]
- 29.Du Z, Podsypanina K, Huang S, McGrath A, Toneff MJ, Bogoslovskaia E, et al. Introduction of oncogenes into mammary glands in vivo with an avian retroviral vector initiates and promotes carcinogenesis in mouse models. Proceedings of the National Academy of Sciences of the United States of America. 2006;103(46):17396–401. [DOI] [PMC free article] [PubMed] [Google Scholar]
- 30.Bu W, Xin L, Toneff M, Li L, Li Y. Lentivirus vectors for stably introducing genes into mammary epithelial cells in vivo. J Mammary Gland Biol Neoplasia. 2009;14(4):401–4. [DOI] [PubMed] [Google Scholar]
- 31.Haricharan S, Hein SM, Dong J, Toneff MJ, Aina OH, Rao PH, et al. Contribution of an alveolar cell of origin to the high-grade malignant phenotype of pregnancy-associated breast cancer. Oncogene. 2014;33(50):5729–39. [DOI] [PMC free article] [PubMed] [Google Scholar]
- 32.Dunn KJ, Williams BO, Li Y, Pavan WJ. Neural crest-directed gene transfer demonstrates Wnt1 role in melanocyte expansion and differentiation during mouse development. Proceedings of the National Academy of Sciences of the United States of America. 2000;97(18):10050–5. [DOI] [PMC free article] [PubMed] [Google Scholar]
- 33.Toneff MJ, Du Z, Dong J, Huang J, Sinai P, Forman J, et al. Somatic expression of PyMT or activated ErbB2 induces estrogen-independent mammary tumorigenesis. Neoplasia. 2010;12(9):718–26. [DOI] [PMC free article] [PubMed] [Google Scholar]
- 34.Holland EC, Li Y, Celestino J, Dai C, Schaefer L, Sawaya RA, et al. Astrocytes give rise to oligodendrogliomas and astrocytomas after gene transfer of polyoma virus middle T antigen in vivo. The American journal of pathology. 2000;157(3):1031–7. [DOI] [PMC free article] [PubMed] [Google Scholar]
- 35.Xin L, Teitell MA, Lawson DA, Kwon A, Mellinghoff IK, Witte ON. Progression of prostate cancer by synergy of AKT with genotropic and nongenotropic actions of the androgen receptor. Proceedings of the National Academy of Sciences of the United States of America. 2006;103(20):7789–94. [DOI] [PMC free article] [PubMed] [Google Scholar]
- 36.Meerbrey KL, Hu G, Kessler JD, Roarty K, Li MZ, Fang JE, et al. The pINDUCER lentiviral toolkit for inducible RNA interference in vitro and in vivo. Proceedings of the National Academy of Sciences of the United States of America. 2011. [DOI] [PMC free article] [PubMed] [Google Scholar]
- 37.Creighton CJ, Huang S. Reverse phase protein arrays in signaling pathways: a data integration perspective. Drug design, development and therapy. 2015;9:3519–27. [DOI] [PMC free article] [PubMed] [Google Scholar]
- 38.Li Y, Hively WP, Varmus HE. Use of MMTV-Wnt-1 transgenic mice for studying the genetic basis of breast cancer. Oncogene. 2000;19(8):1002–9. [DOI] [PubMed] [Google Scholar]
- 39.Robinson GW, McKnight RA, Smith GH, Hennighausen L. Mammary epithelial cells undergo secretory differentiation in cycling virgins but require pregnancy for the establishment of terminal differentiation. Development. 1995;121(7):2079–90. [DOI] [PubMed] [Google Scholar]
- 40.Zheng ZY, Tian L, Bu W, Fan C, Gao X, Wang H, et al. Wild-Type N-Ras, Overexpressed in Basal-like Breast Cancer, Promotes Tumor Formation by Inducing IL-8 Secretion via JAK2 Activation. Cell reports. 2015;12(3):511–24. [DOI] [PMC free article] [PubMed] [Google Scholar]
- 41.Du Z, Li Y. RCAS-TVA in the mammary gland: an in vivo oncogene screen and a high fidelity model for breast transformation? Cell Cycle. 2007;6(7):823–6. [DOI] [PubMed] [Google Scholar]
- 42.Siwko SK, Bu W, Gutierrez C, Lewis B, Jechlinger M, Schaffhausen B, et al. Lentivirus-mediated oncogene introduction into mammary cells in vivo induces tumors. Neoplasia. 2008;10(7):653–62. [DOI] [PMC free article] [PubMed] [Google Scholar]
- 43.Reddy JP, Li Y. The RCAS-TVA system for introduction of oncogenes into selected somatic mammary epithelial cells in vivo. J Mammary Gland Biol Neoplasia. 2009;14(4):405–9. [DOI] [PubMed] [Google Scholar]
- 44.Orsulic S, Li Y, Soslow RA, Vitale-Cross LA, Gutkind JS, Varmus HE. Induction of ovarian cancer by defined multiple genetic changes in a mouse model system. Cancer Cell. 2002;1(1):53–62. [DOI] [PMC free article] [PubMed] [Google Scholar]
- 45.Ince TA, Richardson AL, Bell GW, Saitoh M, Godar S, Karnoub AE, et al. Transformation of different human breast epithelial cell types leads to distinct tumor phenotypes. Cancer Cell. 2007;12(2):160–70. [DOI] [PubMed] [Google Scholar]
- 46.Drobysheva D, Smith BA, McDowell M, Guillen KP, Ekiz HA, Welm BE. Transformation of enriched mammary cell populations with polyomavirus middle T antigen influences tumor subtype and metastatic potential. Breast cancer research : BCR. 2015;17(1):132. [DOI] [PMC free article] [PubMed] [Google Scholar]
- 47.Keller PJ, Arendt LM, Skibinski A, Logvinenko T, Klebba I, Dong S, et al. Defining the cellular precursors to human breast cancer. Proceedings of the National Academy of Sciences of the United States of America. 2012;109(8):2772–7. [DOI] [PMC free article] [PubMed] [Google Scholar]
- 48.Lindvall C, Bu W, Williams BO, Li Y. Wnt signaling, stem cells, and the cellular origin of breast cancer. Stem cell reviews. 2007;3(2):157–68. [DOI] [PubMed] [Google Scholar]
- 49.Blanpain C Tracing the cellular origin of cancer. Nature cell biology. 2013;15(2):126–34. [DOI] [PubMed] [Google Scholar]
- 50.Holloway KR, Sinha VC, Toneff MJ, Bu W, Hilsenbeck SG, Li Y. Krt6a-positive mammary epithelial progenitors are not at increased vulnerability to tumorigenesis initiated by ErbB2. PLoS One. 2015;10(1):e0117239. [DOI] [PMC free article] [PubMed] [Google Scholar]
- 51.Holloway KR, Sinha VC, Bu W, Toneff M, Dong J, Peng Y, et al. Targeting Oncogenes into a Defined Subset of Mammary Cells Demonstrates That the Initiating Oncogenic Mutation Defines the Resulting Tumor Phenotype. International journal of biological sciences. 2016;12(4):381–8. [DOI] [PMC free article] [PubMed] [Google Scholar]
- 52.Li Q, Bohin N, Wen T, Ng V, Magee J, Chen SC, et al. Oncogenic Nras has bimodal effects on stem cells that sustainably increase competitiveness. Nature. 2013;504(7478):143–7. [DOI] [PMC free article] [PubMed] [Google Scholar]
- 53.Shi A, Dong J, Hilsenbeck S, Bi L, Zhang H, Li Y. The Status of STAT3 and STAT5 in Human Breast Atypical Ductal Hyperplasia. PLoS One. 2015;10(7):e0132214. [DOI] [PMC free article] [PubMed] [Google Scholar]
- 54.Haricharan S, Dong J, Hein S, Reddy JP, Du Z, Toneff M, et al. Mechanism and preclinical prevention of increased breast cancer risk caused by pregnancy. eLife. 2013;2. [DOI] [PMC free article] [PubMed] [Google Scholar]
- 55.Brown P Prevention: Targeted therapy-anastrozole prevents breast cancer. Nature reviews Clinical oncology. 2014;11(3):127–8. [DOI] [PubMed] [Google Scholar]
Associated Data
This section collects any data citations, data availability statements, or supplementary materials included in this article.