Abstract
We analyzed a very large set of molecular interactions that had been derived automatically from biological texts. We found that published statements, regardless of their verity, tend to interfere with interpretation of the subsequent experiments and, therefore, can act as scientific “microparadigms,” similar to dominant scientific theories [Kuhn, T. S. (1996) The Structure of Scientific Revolutions (Univ. Chicago Press, Chicago)]. Using statistical tools, we measured the strength of the influence of a single published statement on subsequent interpretations. We call these measured values the momentums of the published statements and treat separately the majority and minority of conflicting statements about the same molecular event. Our results indicate that, when building biological models based on published experimental data, we may have to treat the data as highly dependent-ordered sequences of statements (i.e., chains of collective reasoning) rather than unordered and independent experimental observations. Furthermore, our computations indicate that our data set can be interpreted in two very different ways (two “alternative universes”): one is an “optimists’ universe” with a very low incidence of false results (<5%), and another is a “pessimists’ universe” with an extraordinarily high rate of false results (>90%). Our computations deem highly unlikely any milder intermediate explanation between these two extremes.
Keywords: Bayesian inference, quality of science, text mining, experiment interpretation, information cascade
More than 5 million biomedical research and review articles have been published in the last 10 years. Automated analysis and synthesis of the knowledge locked in this literature has emerged as a major challenge in computational biology. Recent advances in automated text analysis have provided an opportunity for collecting and scrutinizing huge collections of published statements, offering a unique and previously inaccessible “bird’s eye” view of a large field. Among others, the GeneWays text-mining project (1–3) recently made available for analysis millions of biological statements extracted from 78 contemporary research journals. By developing computational tools that allowed detailed statistical analysis of millions of statements extracted from scientific texts, we used these unique data to probe the large-scale properties of the scientific knowledge-production process. We explicitly modeled both the generation of experimental results and the experimenters’ interpretation of their results and found that previously published statements, regardless of whether they are subsequently shown to be true or false, can have a profound effect on interpretations of further experiments and the probability that a scientific community would converge to a correct conclusion.
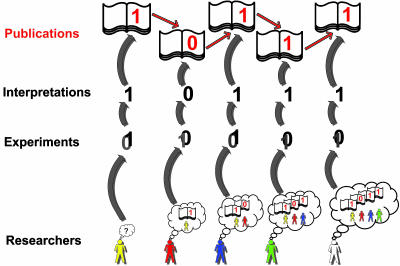
In this study, we focused on chronologically ordered chains of statements about published molecular interactions, such as “protein A activates gene B” or “small molecule C binds protein D.” Each chain comprises chronologically ordered positive and/or negative statements about the same pair of molecules; for brevity, we encode each such chain with a series of 0’s for the negative statements, and 1’s for the positive statements. For example, an imaginary chain of length 3 could include “protein A activates protein B” (1), “protein A does not activate protein B” (0) and “protein A activates protein B” (1) (see also Fig. 1). Discrepancies across published statements may arise because of variations in experimental conditions, errors in the conduct of the experiment, misinterpretation of results, or a combinations of these factors.
Fig. 1.
A hypothetical chain of collective reasoning. The chain is started by a scientist who performs an experiment hidden from the outside world. The results of the experiment involve some fuzziness, and the chain originator publishes the most likely interpretation given the absence of prior publications. The second, third, and all other scientists who join the chain later, think in the context of the published opinions and can be led to interpret their experimental results differently than would be done in the absence of prior data. The fourth and fifth persons in the chain publish interpretations of their data that would be opposite in the absence of prior publication.
There is a well established term in economics, “information cascade” (4), which represents a special form of a collective-reasoning chain that degenerates into repetition of the same statement (4). Here we suggest a model that can generate a rich spectrum of patterns of published statements, including information cascades. We then explore patterns that occur in real scientific publications and compare them to this model.
Results and Discussion
Modeling Experiments and Publication Process.
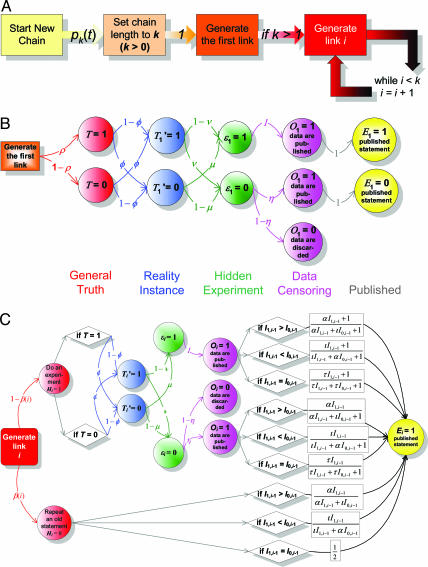
There are numerous possible ways to evaluate dependencies across published statements. The simplest approach is to evaluate a correlation between the chronologically consecutive statements within the same chain of reasoning. We started with the simple correlation analysis and observed an overwhelmingly strong dependence between statements within a chain (correlation coefficient is 0.9857, with 842,720 pairs of neighboring statements studied; the corresponding P value is 0 for all practical purposes). However, this simple analysis is very hard to interpret, because the strong correlation across statements in a chain can be due to a number of different factors: because all statements within a chain have the same “true” value, because biological experiments have a very low error rate, because most of the published statements are not experimentally supported but are restatements of earlier statements, because published statements have large “momentums” that affect interpretation of later experiments, or because the general likelihood of randomly formulating a correct statement is high (if most of the molecules were capable of interacting in some way, most of the random statements of the form “A interacts with B” would be correct). Therefore, we designed a probabilistic model that allowed us to discriminate contributions of these factors while being simple and computationally tractable (see Model Box and Fig. 2 for explanation of the model assumptions and its application; see also Supporting Text, which is published assupporting information on the PNAS web site, for further in-depth mathematical details). One of the benefits of formulating our model in probabilistic terms is the ability to quantify our confidence in the results of the analysis, given the model and its assumptions.
Fig. 2.
The probabilistic model that generates chains of collective reasoning in our study. Plot A gives an overview of the major stochastic components of the model. Plot B specifies a pathway that leads to generation of the first link in a chain of reasoning. Plot C explains the stochastic processes that lead to chain extension. Note that, to save space, we show only the extension of a chain with a positive statement; the probability for extending the chain with a negative statement is 1 minus the probability of publishing a positive statement. Definitions of the nine model parameters are provided in the Model Box section and Table 1, and the probability equations required for implementing the model are provided in Supporting Text.
Patterns.
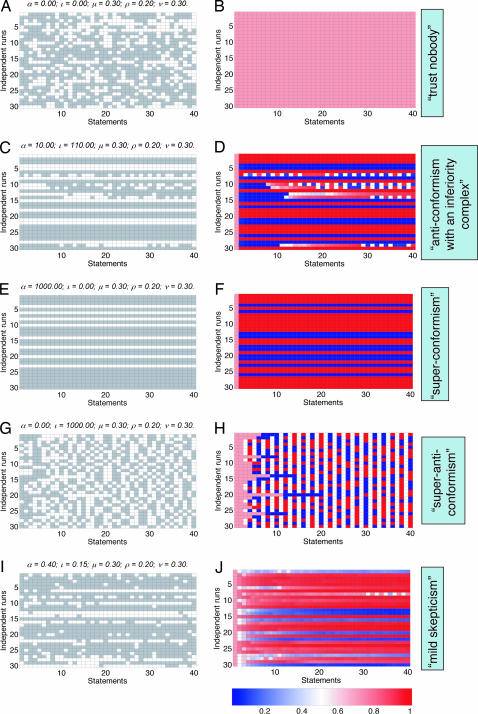
Our model can represent a rich spectrum of possible patterns in chains of published statements (see Fig. 3): all patterns that we propose here occur in the real chains, albeit some of them are rarer than others. The plots on the left side of Fig. 3 represent sequences of simulated positive and negative statements, viewed as white and gray cells, respectively; plots on the right side of the figure show the probability of reaching the correct answer (which is, of course, known only in a simulation) at each step of a reasoning chain for the chains shown to their left. All five patterns are characterized by distinct distributions of single-digit run lengths; for example, the runs of single digits are on average longest for the third pattern (Fig. 3 E and F) and shortest for the fourth pattern (Fig. 3 G and H).
Fig. 3.
Hypothetical patterns of conflicting statements that can be observed in real publications. Each row in the left group of plots (A, C, E, G, and I) corresponds to an independent chain (from left to right) of reasoning, where white cells indicate positive statements and gray cells indicate negative statements. Different plots correspond to different parameter values in the underlying model. Each row in the right group of plots (B, D, F, H, and J) represents the probability that the correct result will be reached at the given step of the corresponding chain shown in the same row in the left group.
The first pattern, shown in Fig. 3 A and B, corresponds to a complete statistical independence of published statements (“trust nobody” but yourself): scientists in this imaginary world do not read one another’s papers (momentums of all published statements are zero), and prior publications produce no bias in interpretation of experiments by a scientist. The probability of publishing a correct statement in this case is the same for all links in a reasoning chain (Fig. 3B).
The second, third, and fourth patterns (Fig. 3 C and D, E and F, and G and H, respectively) illustrate three possible modes of dependence within a single reasoning chain. The third and fourth patterns correspond to extreme conformism (the superconformism pattern, indicating high concordance with the majority of statements), and anticonformism (the superanticonformism pattern, indicating a tendency to disagree with the majority of statements), respectively. Both patterns can result from published statements having large momentums: If the majority statements are heavier that the minority statements, the model produces the extreme conformism pattern, whereas if the minority statements are heavier, the resulting pattern is anticonformism. The superconformism pattern (Fig. 3 E and F) is a perfect example of an information cascade. Another pattern (anticonformism with an inferiority complex; Fig. 3 C and D) is a curious hybrid between the conformism and anticonformism patterns: The scientists in this hypothetical universe tend to follow the majority of published statements as long as there are no conflicts, but once the first conflicting statement is published, the same scientists tend to follow an anticonformist model, by joining the minority opinion and generating a stutter-like publication signature.
We call the fifth pattern, shown in Fig. 3 I and J, mild skepticism: The published statements here are dependent, because they have small, but positive, momentums, and the majority statements are heavier than the minority statements. This dependence is manifested by runs of zeros and ones longer than those observed in the independent model (Fig. 3 A and B), but the dependence is relatively weak. In this hypothetical world, scientists do read their peers’ articles and try to compare their own results to the published ones but tend to trust their own data more than the data published by their peers.
Patterns that resemble the mild skepticism were prevalent in our real-world data set (described below), but analysis revealed the presence of all five hypothetical patterns.
Data Analysis.
To estimate the momentums of published statements, we applied our computational tools to data stored in the geneways 6.0 database (3). To detect possible variations in behavior of statements about different types of molecular interactions, we divided interactions in the large data set into logical interactions (such as activate, regulate, and inhibit) and physical interactions (such as bind, phosphorylate, and methylate). This subdivision resulted in three distinct data sets: (i) the whole data set (all), and (ii) logical and (iii) physical interaction subsets.
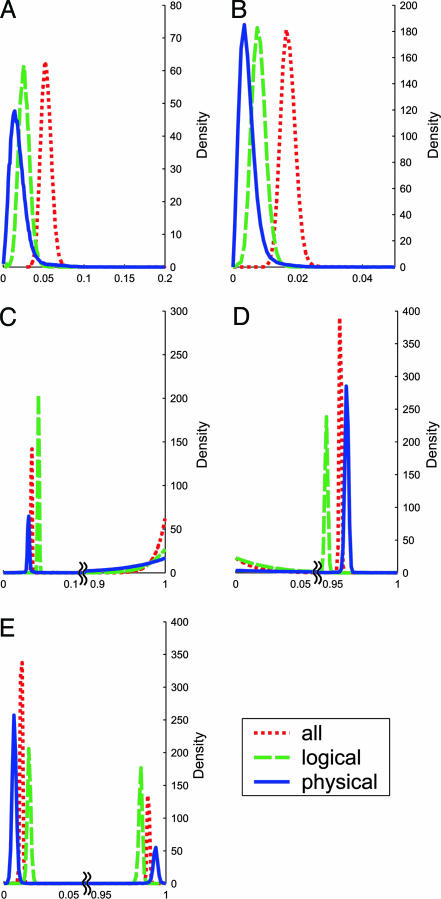
Our first observation, based on computation, was that, because of the huge data set, we can clearly demonstrate that momentums of published statements are notably positive, but <0.1 (see Fig. 4A and B). This result means that scientists are often strongly affected by prior publications in interpreting their own experimental data, while weighting their own private results (which have weight 1 under our model) at least 10-fold as high as a single result published by somebody else.
Fig. 4.
The estimated posterior distributions of the parameters for three data sets (all, logical, and physical). A, B, C, D, and E correspond to parameters α, ι, ν, μ, and ρ, respectively.
The second observation was that, for all three data sets, the dominant statements were considerably “heavier” than the nondominant statements, revealing a tendency toward conformism (see Fig. 4; see also Appendix 1 and Data Sets 1 and 2, which are published as supporting information on the PNAS web site).
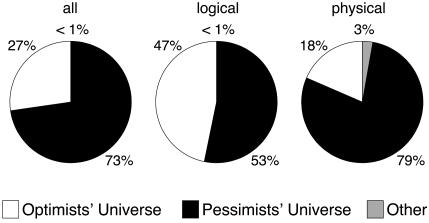
Our third and most striking finding emerged from the need to explain the observation that the published statements in our data set are predominantly positive (<5% of them are negative) and are highly correlated within chains. The estimated momentums of published statements are too small to wholly account for the high correlation, and a mechanical republication of the old statements (without experimental reevaluation) appears to be insufficient to explain the trend either (see Model Box and Fig. 4). Our stochastic analysis of the real data produced not a single, most likely explanation, but rather two sets of nearly equally probable “alternative universes” (see Fig. 4 C–E). These statistically derived “universes” reflect a conclusion that perhaps can be reached through a common-sense logical reasoning (such a derivation, however, would lack quantification of the confidence). One explanation is that the high agreement among published statements is due to a very low rate of experimental errors (optimists’ universe, where both false-positive and false-negative error rates are <0.05) and an overwhelming predominance of positive statements over negative ones among true statements. The alternative explanation posits a pessimists’ universe that is characterized by exceptionally error-prone experiments; both false-positive and false-negative error rates are significantly >0.9, and a randomly chosen positive statement is far more likely to be false than true. The statistical tools allow us to conclude that intermediate milder universes are very unlikely under our assumptions (see estimated marginal posterior distributions of parameter values in Fig. 4) and that both universes enjoy considerable support by data (see Fig. 5). This ambiguity is not due to the model’s weakness, but due to the lack of information about the actual proportion of positive versus negative statements that exist. In fact, our data-shuffling experiments (described in detail in Supporting Text) showed that the two-universe effect disappears for many types of reshuffled data. Furthermore, our model parameter estimates are sensitive to data randomization and to elimination of constant (single-digit) chains or variable (double-digit) chains (see Supporting Text).
Fig. 5.
The estimated posterior probabilities of the universe classes for three data sets (all, logical, and physical). The universes are defined in terms of the values of parameters ρ, μ, and ν: The optimists’ universe with significant posterior probability has low values of both μ and ν (<0.5) and a large value of ρ,and the pessimists’ universe with significant posterior probability has high values of both error-related parameters (>0.5) and a small value of ρ. There is one more optimists’ universe with a small value of ρ and one more pessimists’ universe with a large value of ρ that have negligible posterior probabilities and are included into group other. The remaining four universes (also included into group other in the plot) have one low and one high error-parameter value. Only one of the pessimists’ and one of the optimists’ universes have nonnegligible posterior probabilities.
Optimum Parameter Values.
Our probabilistic model allows us to find optimum parameter values that maximize the probability that a given chain of scientific reasoning will converge to correct result. An evaluation of the optimum parameters under our model (see Model Box) indicated that the momentums of published statements estimated from real data are too high to maximize the probability of reaching the correct result at the end of a chain. This finding suggests that the scientific process may not maximize the overall probability that the result published at the end of a chain of reasoning will be correct.
A detailed analysis of a measure leading to improved probability of publishing correct results is outside of the focus of this study, but experience in the fields of physics (5) and structural biology (6) offers concrete steps (such as random and independent benchmarking of published results) that provide scientists with feedback about the true distribution of experimental errors. Another major question also remains open: In which of the two alternative universes discovered in our analysis are we living? Our results indicate that the optimistic and pessimistic realities are almost equally likely given currently available data.
Evaluating the quality of the published facts is more than a matter of pure academic curiosity: If the problem of convergence to a false “accepted” scientific result is indeed frequent, it might be important to focus on alleviating it through restructuring the publication process or introducing a means of independent benchmarking of published results.
Model Box
Our model is built on eight simple and intuitive assumptions. First, we assume that for every pair of substances, there is a general truth or rule: These substances either usually do or usually do not interact. The odds of encountering a negative rule (“A usually does not interact with B”) are not necessarily the same as the odds of encountering a positive rule (“C usually does interact with D”); we denote the corresponding probabilities by 1 − ρ and ρ, respectively. Second, each general rule may have an exception, with probability φ (e.g., proteins A and B interact in most cases, but do not interact when in tissue X). Third, we allow experiments to produce erroneous results: They produce false-negative results with probability ν and false-positive results with probability μ. Fourth, we assume an asymmetry in terms of ease of publication between negative and positive experimental results. Many experimentalists believe that it is more difficult to publish a negative result (“we were unable to demonstrate that A and B interact”) than to publish a positive result (“we demonstrated that A and B interact”), so the model allows negative results to be discarded, without publication, with probability 1 − η. Fifth, we assume that a published statement can be based on original experiments (with probability 1 − βi) or can be a restatement of an earlier published statement (with probability βi). We tested two formulations of the model: The simpler version assumes that βi is constant, whereas, in the more complicated version of the model, βi is increasing as the chain grows longer: βi = 1 − i−ψ, ψ > 0. The more complicated formulation asserts that the chances that a scientist would experimentally reverify an old statement drop with the growth of the available evidence. We assume that the first statement in every chain is always supported by an experiment. Sixth, we allow an experimenter’s interpretation of her own data (and hence of her published result) to differ from the “unbiased” interpretation of the same data that an expert would have in the absence of prior publications. This model feature reflects our observation that, when reading about published experiments similar to their own, scientists build in their minds an equivalent of statistical prior distributions of experimental outcomes that they are using for interpreting their own experimental data. We assume that each published statement has a weight that is different for statements in reasoning chains where they are in the majority (α), are the minority (ι), and are of equal number (τ). For example, for the chain of reasoning 1, 0, 0, 1, 1, 1, every published positive statement would have weight α (because it is in the majority), whereas each negative statement would have weight ι. For the hypothetical chain 0, 1, 0, 1, the weight of each the statement would be equal (τ), because there are an equal number of zeros and ones. The weight of each published statement is nonnegative and reflects the importance of published statements in influencing both a researcher’s choice of experiments (and thus ultimately observed results) and her interpretation of the results. We set the subjective weight of the researcher’s own experiment to 1. Seventh, we assume that relationship among statements related to the same molecular interaction is adequately represented with a linear structure (a chain). Eighth, we assume that different chains are statistically independent.
In our model (Fig. 2A), each chain of reasoning results from a combination of two processes: one determines the length of the chain, whereas the other specifies the arrangement of zeros and ones within the chain given that length. The first process is described in detail in Supporting Text. The second process (see Fig. 2B and C) is responsible for generating a specific sequence of zeros and ones within a chain of a given length. In this study, we emphasize analysis of the second process.
Note that in our model, experimental data cannot be observed directly by the research community. They have to be inferred from publications. For that reason, we call the experimental results “hidden” (see Fig. 2 B and C) by analogy with the hidden states in the hidden Markov models.
To estimate the marginal posterior distributions for the parameters, we used the Metropolis-coupled Markov chain Monte Carlo technique (refs. 7 and 8; our implementation of the algorithm closely followed that of Altekar and colleagues, ref. 9), run on a cluster of 40 Intel processors. The value of parameter τ for these computations was assumed to be equal to the average of α and ι and the values of φ and η to 0 and 1, respectively. This assumption did not affect our findings regarding values of the other parameters, yet it greatly reduced computational complexity. Using the Metropolis-coupled Markov chain Monte Carlo technique, we estimated a full posterior distribution of parameters given data, P(parameters | data). We then divided the whole space of the permissible parameter values into “bad” and “good” neighborhoods [the error rate is very high in the bad neighborhood (>0.5) and low in the good neighborhood (<0.5)] and computed the posterior probabilities that the parameter values belong to each neighborhood. Our estimates of the marginal posterior distributions for major parameters are shown in Fig. 4. As long as in our computation we assumed noninformative prior parameter distributions, the mode of each estimated marginal density corresponds to the maximum-likelihood estimate of the parameter value; a narrow peak indicates a high degree of certainty in the estimate, whereas a wide peak indicates that the variance of the estimate is large.
The data set that we used for analysis included 2.5 million reasoning chains containing 3.3 million individual statements extracted from the geneways 6.0 database (1–3). We did our data analysis in two ways. In one version of the analysis, we used only one (most frequent) statement of each kind per article, whereas in the other version of analysis, we used all statements available in the database. The results of the two analyses are qualitatively indistinguishable, and we show here only results of the analysis of the former type.
Analysis of all three data sets under the constant-β model produced consistent estimates of β with the posterior mean close to 0.2 (the 95% credible interval for the largest dataset, all, was bound by 0.166 and 0.235). To determine whether this simple way of estimating restatements was reasonable, we manually analyzed 200 statements about molecular interactions in Drosophila melanogaster (these statements were randomly sampled from the fly-specific portion of the geneways 6.0 database). Among these 200 statements, 107 were based on original experiments, which gave us an estimate of β equal to 0.465 with a 95% confidence interval (0.394 and 0.637; see Supporting Text). Therefore, the simple constant-β model was falsified with the data. We were then able to estimate the value of the decay parameter (ψ) by using the manually collected data (ψ was equal to 0.445, 0.479, and 0.502 for datasets all, logical, and physical, respectively). Notably, however, when we compared estimation results under the simpler constant-β model with those under the more complicated decaying-β model, all of the major results reported here held for both computations, demonstrating the robustness of our model to estimates of mechanical restatements.
The probabilistic approach to analysis of data naturally allowed us to compare directly the relative plausibility of each alternative universe (by estimating the latter’s posterior probability, see Fig. 5). To define the bounds of universes, we divided the parameter space into eight equal-sized subspaces, and we estimated the proportion of the posterior density associated with each subspace. [The subspaces were separated by three mutually orthogonal planes cutting axes (ρ, μ, ν) at ρ = 0.5, μ = 0.5, and ν = 0.5, respectively.] Because the number of informative (cold) Metropolis-coupled Markov chain Monte Carlo technique iterations in our analysis was enormous (3 × 10⁶), the differences between posterior probabilities of the two universes are statistically significant.
We can draw several conclusions from this analysis of the relative plausibility of the alternative universes. For the largest combined data set (all), the most likely universe was the pessimists’ (posterior probability 0.73), followed by the optimists’ (posterior probability 0.27). A very similar picture is observed for the smaller data sets (Fig. 5), but for all practical purposes, both universes successfully explained reality.
Optimum Parameter Values.
Assuming that both experimental error rates (false-negative and false-positive) do not exceed 0.5, the optimum value for parameter ι is zero, whereas the optimum value of α depends on the length of the chain. The optimum values of α are close to 0.39, 0.29, and 0.21 for chains of length 3, 6, and 9, respectively (data not shown). As the chain grows longer, the optimum value of α becomes progressively smaller.
Supporting Information.
For more information, see Figs. 6–23, which are published as supporting information on the PNAS web site.
Supplementary Material
Table 1.
Major parameters and variables used in the modeling
| Variable or parameter | Definition |
|---|---|
| T | A binary variable corresponding to an unknown true rule about interaction between a pair of molecules, T = 1 if interaction can occur under appropriate conditions and T = 0 otherwise |
| Ti′ | A binary variable corresponding to an instance of the rule: it may differ from the rule (an exception) |
| εi | An experimental result (hidden from the outside world) about a molecular interaction |
| Oi | A binary indicator variable, that is equal to 0 if a hidden experiment with negative result (εi = 0) is discarded |
| Hi | An indicator variable which is equal to 1 if researcher performs an experiment before inserting a statement into a publication |
| Ei | A binary variable corresponding to a published statement about a molecular interaction. Ei = 1, if the statement is positive |
| ρ | A parameter representing P(T = 1), the probability of sampling a positive rule about molecular interactions |
| α | “Momentum” of a single statement that belongs to the majority of published statements |
| ι | Momentum of a single statement that belongs to the minority of published statements |
| τ | Momentum of a single statement in a tie situation (equal number of positive and negative statements) |
| β(i) | The probability of publishing a statement without doing an additional experiment as a function of position, i, in the chain |
| η | The probability that a negative experimental observation is published |
| φ | The probability of observing an exception to a rule, P(T ≠ Ti′) |
| ν | The probability of getting a single false negative result, P(εi = 0|Ti′ = 1) in an experiment |
| μ | The probability of getting a single false positive result, P(εi = 1|Ti′ = 0) in an experiment |
| ψ | Decay parameter for β(i) |
| I0,i−1 | The total number of negative statements in a chain of i − 1 statements about the same molecular interaction |
| Il,i−1 | The total number of positive statements in a chain of i − 1 statements about the same molecular interaction |
Acknowledgments
We thank Lynn Caporale, Murat Cokol, Lyn Dupré, Michael Krauthammer, Ani Nenkova, Paul Pavlidis, Valerie Reinke, James J. Russo, Rita Rzhetsky, and Tian Zheng for comments on the earlier version of the manuscript; Dennis Vitkup for suggesting the term “momentum of a statement”; and Ahmet Sinav for the artwork. This study was supported by grants from the National Institutes of Health (to A.R. and K.P.W.), the National Science Foundation, the Department of Energy, the Cure Autism Now Foundation, and the Defense Advanced Research Projects Agency (to A.R.), and the W. M. Keck Foundation (to K.P.W.).
Footnotes
Conflict of interest statement: No conflicts declared.
References
- 1.Friedman C., Kra P., Yu H., Krauthammer M., Rzhetsky A. Bioinformatics. 2001;17(Suppl. 1):S74–S82. doi: 10.1093/bioinformatics/17.suppl_1.s74. [DOI] [PubMed] [Google Scholar]
- 2.Krauthammer M., Kra P., Iossifov I., Gomez S. M., Hripcsak G., Hatzivassiloglou V., Friedman C., Rzhetsky A. Bioinformatics. 2002;18(Suppl. 1):S249–S257. doi: 10.1093/bioinformatics/18.suppl_1.s249. [DOI] [PubMed] [Google Scholar]
- 3.Rzhetsky A., Iossifov I., Koike T., Krauthammer M., Kra P., Morris M., Yu H., Duboue P. A., Weng W., Wilbur W. J., et al. J. Biomed. Inform. 2004;37:43–53. doi: 10.1016/j.jbi.2003.10.001. [DOI] [PubMed] [Google Scholar]
- 4.Anderson L. R., Holt C. A. Am. Econ. Rev. 1997;87:847–862. [Google Scholar]
- 5.Henrion M., Fischhoff B. Am. J. Physics. 1986;54:791–798. [Google Scholar]
- 6.Venclovas C., Zemla A., Fidelis K., Moult J. Proteins. 2003;53(Suppl. 6):585–595. doi: 10.1002/prot.10530. [DOI] [PubMed] [Google Scholar]
- 7.Gilks W. R., Richardson S., Spiegelhalter D. J., editors. Markov Chain Monte Carlo in Practice. London: Chapman & Hall/CRC; 1996. [Google Scholar]
- 8.Geyer C. J. In: Computer Science and Statistics: Proceedings of the 23rd Symposium on the Interface. Keramidas E. M., editor. Fairfax Station, VA: Interface Found.; 1991. pp. 156–163. [Google Scholar]
- 9.Altekar G., Dwarkadas S., Huelsenbeck J. P., Ronquist F. Bioinformatics. 2004;20:407–415. doi: 10.1093/bioinformatics/btg427. [DOI] [PubMed] [Google Scholar]
Associated Data
This section collects any data citations, data availability statements, or supplementary materials included in this article.


