Abstract
We describe a model of neutral DNA evolution that allows substitution rates at a site to depend on the two flanking nucleotides (“context”), the branch of the phylogenetic tree, and position within the sequence and implement it by using a flexible and computationally efficient Bayesian Markov chain Monte Carlo approach. We then apply this approach to characterize phylogenetic variation in context-dependent substitution patterns in a 1.7-megabase genomic region in 19 mammalian species. In contrast to other substitution types, CpG transition substitutions have accumulated in a relatively clock-like fashion. More broadly, our results support the notion that context-dependent DNA replication errors, cytosine deamination, and biased gene conversion are major sources of naturally occurring mutations whose relative contributions have varied in mammalian evolution as a result of changes in generation times, effective population sizes, and recombination rates.
Despite their fundamental role in evolution and genetic disease, relatively little is known about the causes of naturally occurring mutations in mammalian genomes. Even basic questions, such as the relative proportions attributable to replication errors or to chemical or radiation damage, remain unresolved. Neutrally evolving genomic DNA in principle provides a faithful record of the mutations occurring within it, and through its analysis, an increasingly complex picture of the characteristics of the mutation process is emerging. Studies of pseudogenes have found that transition substitutions occur at higher rates than transversions and that substitutions from S (G or C) to W (A or T) nucleotides generally occur at a higher rate than those from W to S (1, 2). The nucleotides that flank a site have a large (≈50-fold) effect on substitution rate (3, 4); the most dramatic instance is CpG dinucleotide “hotspots” (5), where the elevated rate reflects deamination of methyl cytosine, but there are significant (and as yet not understood) effects of other flanking nucleotides as well. Such “context effects” are also detected in studies of single-nucleotide polymorphisms (6) and disease-causing mutations (7).
With the availability of large genomic datasets, more subtle trends are being uncovered. Comparison of human and mouse genomic sequences have revealed that substitution rates vary by position on a large scale (8). Recombination rate is correlated both with overall substitution rate (9) and with the ratio of W→S to S→W rates (10), the latter correlation probably reflecting biased gene conversion (11–13). There is an asymmetry in the substitution process within transcribed regions, with higher rates of purine than of pyrimidine transitions on the nontranscribed strand (14); this is hypothesized to result from an asymmetry in DNA polymerase errors that is uncovered by transcription-coupled repair.
Analysis of evolutionarily diverse, multispecies datasets, such as those being developed by the NISC Comparative Sequencing Program (15), provides increasing opportunity to gain insight into the biological factors that may underlie these observations by studying how trends vary across organisms and sequences. For this purpose, it is useful to have models of neutral evolution that incorporate as many of the above complexities as possible. In addition to illuminating the mutation process, such models should improve our ability to detect functional features in the genome as nonneutrally evolving regions, and they should help increase the effectiveness of standard sequence analysis methods, such as alignment and phylogenetic reconstruction. Inadequate models not only reduce analysis power but can also lead to misleading conclusions (16–18).
Of the mutational complexities mentioned above, the most difficult to accommodate mathematically is context dependence of rates. Several recent studies have developed evolutionary models allowing for context dependence but in an approximate or partial fashion. These models include a Markov chain Monte Carlo (MCMC) approach for estimating CpG effects in pairwise alignment (19); an approximate likelihood method that requires fixing the ancestral sequence to deduce CpG effects along a star topology (20, 21); and two studies that assume approximate models of neighbor dependence along a tree to estimate context-dependent rates (ref. 22 and research.microsoft.com/research/pubs/view.aspx?tr_id=687).
In this paper, we describe a rigorous evolutionary model incorporating context effects that are allowed to depend on sequence position and lineage. We implement the model by means of a flexible and computationally efficient Bayesian MCMC approach that permits large numbers of model parameters to be estimated simultaneously and reliably and apply it to analyze variation in substitution trends across a 19-species mammalian phylogeny in a 1.7-megabase (Mb) genomic region. We find that, in contrast to other context-dependent rates, CpG transition substitutions have accumulated in a relatively clock-like fashion; our analysis also helps illuminate factors that may underlie failure of the molecular clock for other substitution types. We find variation in the ratios of W→StoS→W rates and CpG transitions to total rate, which appears to reflect varying generation times, effective population sizes, and recombination rates during mammalian evolution. We also gain further insight into the transcription-associated substitution asymmetry.
Methods
Evolutionary Model. We assume we are given an alignment of several homologous sequences, together with sequence annotations indicating the presence of biological features, and a rooted evolutionary tree indicating the ancestral relationships among the sequences. The alignment is taken to imply which positions are homologous in the different sequences. Bases present in some sequences but not others at a given position reflect insertion or deletion events (indels), which we assume have been assigned (e.g., by parsimony) to particular locations on the tree. Conditional on the alignment and the assigned indel locations, we seek to model neutral sequence evolution (base substitutions and the composition of inserted segments) along the tree, allowing substitution rates to depend on the two flanking bases and on position within the sequence and within the tree. Evolution is assumed to occur independently along each tree branch.
To simplify computation, each branch is partitioned into two or more small discrete time units (such that the average substitution rate per time unit is ≤0.005), and, at most, one substitution at each sequence site is permitted per time unit. We index the tree positions that separate time units as t = 0,..., m, with 0 being the root, m – k + 1,..., m being the k leaves (corresponding to the observed sequences), and 1,..., m – k being the internal positions. For each t, let bt be the branch on which t lies and (if t ≠ 0) βt the tree position that immediately precedes t. We assume the indexing is such that βt < t.
For bases x ≠ z, let ψib(wxy→z) = κbστλση(wxy→z) be the probability that, in one time unit of branch b = bt, the base x at position i and time βt mutates to z at time t, given neighboring bases w and y at time βt. The index σ = σi specifies the “region type” in which i falls; η = ηb specifies a grouping of branches; and τ = τwxy→z specifies the “substitution type” of the context-dependent substitution wxy→z. We allow two region types (transcribed and untranscribed). In an initial analysis (see Results and Discussion), we assume a single τ that includes all context-dependent substitutions and allow variation among lineages by means of different η values for each of the major clades. In subsequent analyses, we assume a single η and allow variation among lineages by means of different τ values for each set of similarly behaved context-dependent substitutions. We scale λση such that its weighted average for each choice of σ, η, and τ is 1, i.e.,
 |
where fwxy is the trinucleotide frequency in observed sequences; hence, the product of the scaling factor κbστ and the number of time units in branch b approximates the expected number of substitutions of type τ for each target base per applicable σ site along the branch. The probability of no substitution is ψib(wxy→x) = 1 – Σz≠x ψib(wxy→z). For σ corresponding to untranscribed regions, we assume that complementary events have equal rates: λση(wxy→z) = λση(ycxcwc→zc), where xc denotes the complement of x. For notational convenience, we let ψibt(wxy→z) = 1if t = 0orif w, x, y, or z = φ (the gap character).
We model the distribution of bases x that are at the root or that are newly inserted as an inhomogeneous second-order Markov chain with transition parameters πρ(x|v, w), where v and w are the bases that immediately precede x. The index ρ = ρi permits different categories of sequence composition. If x is not a root or a newly inserted base or if v or w = φ, we let πρ(x|v, w) = 1. Second-order Markov chains have been found to roughly approximate short-term dependencies in DNA sequences (23). In our analyses, we allow four distinct ρ values that reflect whether the sequence position i is transcribed and whether it is within an annotated repeat. No symmetry conditions are imposed on the π values.
Let Xit ∈ {A, C, G, T, N, φ} denote the base or gap at the ith site of the sequence at tree position t for 1 ≤ i ≤ n and 0 ≤ t ≤ m, where n is the number of alignment columns. Because indel locations are assumed known, the set of Xit assigned as gaps is fixed. We let Xit = N if and only if m – k + 1 ≤ t ≤ m and the corresponding position in the observed sequence has an unspecified base. Let  denote the nearest neighboring base (ignoring gaps) to the left of Xit in X·t; we set
  = N if Xit is the first base in the sequence. Similarly,
  denotes the next-nearest neighboring base to the left of Xit, and X+ the neighboring base to the right. We think of Xit as the “complete data,” composed of the observed data D (corresponding to Xit with m – k + 1 ≤ t ≤ m) and the “missing data” M (corresponding to Xit with 0 ≤ t ≤ m – k).
Under our model, the Xit form a unilateral Markov random field (24), and we define the probability of X, conditional on the parameter values and indel locations, as
 |
where θ = {λ, π, κ} consists of the substitution rate parameters λση, the root and inserted sequence distribution parameters πρ, and the branch-scaling parameters κbστ. Note that for a given i and t, at least one of the two factors is 1. In the special case in which the sequences are ungapped, κλ is small, and λ is independent of time, sequence position, and neighboring bases, this discrete-time model closely approximates the continuous-time model of DNA sequence evolution described in ref. 25.
Bayesian MCMC. We adopt the Bayesian approach to statistical inference (26) and estimate the posterior parameter distribution p(θ|D) implied by the observed data D. A prior distribution p(θ) represents any known information regarding the parameters before D is observed; we use uninformative priors that assign equal probability density to all combinations of parameter values satisfying λ, κ, π > 0, Σz≠x κbστλση(wxy→z) < 1, and Σx≠G πρ(x|v, w) < 1. With increasing length of sequence data, p(θ|D) approaches a normal distribution centered on the maximum likelihood estimate of the parameters, independently of the prior (27).
A powerful approach to Bayesian analysis of missing data problems is MCMC sampling from p(θ, M|D), the joint distribution of the parameters and of the missing data given the observed data (28). A Markov chain with stationary distribution p(θ, M|D) is used to generate the sample (θ(1), M(1)), (θ(2), M(2)),...,(θ(sk), M(sk)), where each (θ(i), M(i)) is some realization of θ and M.
At each step of this chain, we update either a single parameter θi or a single missing data component Mi = {Xit|t = 0,..., m – k}. Each θi is updated according to the distribution p(θi|θ–i, M, D), where θ–i denotes all parameters other than θi, and Mi is updated according to p(Mi|θ, M–i, D). (Details regarding the updating procedure and other implementation issues are available as Supporting Text, which is published as supporting information on the PNAS web site). Total run time for analysis of our dataset, with 0.84 billion updates, was ≈36 hours on a single 1.2-GHz IBM POWER4+ processor.
After a large number of updates, the sample of realizations is effectively drawn from p(θ, M|D). To reduce the storage requirements, we record the parameter values only for a set of evenly spaced realizations of θ, i.e., θ(k), θ(2k),..., θ(sk) for some k. The posterior distribution p(θ|D) is then approximated by the sample distribution of θ(k), θ(2k),..., θ(sk), and the sample mean  is an estimate of θi.
The difference between  and the true value θi may be decomposed as
  , where
  is the (unknown) maximum-likelihood estimate. There should be no strong dependency between the two terms, and so
  . We estimate
  by using the initial monotone1 sequence estimator (29) and
  as the sample variance
  [because maximum likelihood estimates and posterior distributions both have variances approximated by the inverse Fisher information (30)]. As the number of samples s increases, the estimate of
  is approximately constant, whereas
  decreases at the rate 1/s (29). For our analysis runs below, the estimated
  is ≈3% of the estimated
  , suggesting that most of the variance in the estimates arises from the finite amount of data rather than the MCMC approach.
By asymptotic normality of  (27), 95% confidence intervals for
  are approximated by
  . Estimates of functions of the parameters, such as averages of substitution rates over contexts, are derived as
  with variance and confidence intervals estimated as above. Reliability of the variance estimates and of the normality assumptions was checked by simulation (see below).
The software used in this analysis is available from www.phrap.org.
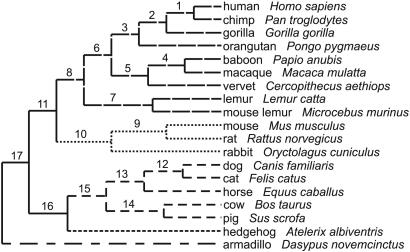
Dataset. We analyzed sequences of the greater cystic fibrosis transmembrane conductance regulator region from 19 mammals (Fig. 1), generated by the NISC Comparative Sequencing Program (15) and aligned by using tba (32). (The dataset is available at www.nisc.nih.gov/data.) This region spans ≈1.7 Mb and includes nine genes. Sequence positions present in at least three species, including representatives from at least two of four major clades (primates, rodents + rabbit, carnivores + horse + artiodactyls + hedgehog, and armadillo), along with segments <10 bases present in only one or two species, were retained; all other positions were excluded. We also removed positions falling in low-complexity regions, CpG islands, or known exons for any species, because the substitution process for such regions is not being modeled here. About 13% of the sequence was not present in enough species, and a further 5.5% was filtered out by content, leaving 746 kb of transcribed and 543 kb of untranscribed sequence in human and a total of 8.9 Mb of transcribed and 5.2 Mb of untranscribed sequence in all 19 mammals (see Supporting Text for filtering methods and Table 2, which is published as supporting information on the PNAS web site, for lengths of sequence available in each species). Although some of this sequence may be under selection, nonexonic selected regions appear to comprise a small percentage (<4%) of the mammalian genome (8) and should have minimal impact on our analyses.
Fig. 1.
Phylogenetic relationships (following ref. 31) among the 19 mammalian species analyzed. (Depicted branch lengths are arbitrary.) The branch shading patterns indicate a partitioning of the tree into five clades plus a group of three ancestral branches that was assumed in initial analyses of rate variation across the tree (see Results and Discussion). For reference in later figures, internal branches are labeled by number and external branches are referred to by species name.
Sequencing errors and misalignments may obscure true substitution events or incorrectly suggest their occurrence. Repeating the analyses with poorly aligned sequences removed (as described in Supporting Text) did not yield qualitatively different results, although it did decrease the branch lengths between distantly related species.
Our analysis approach requires that the tree location of indels be held fixed. At any sequence position where a gap occurs in the alignment, indels were mapped to the tree so as to minimize the total number of events. When more than one such mapping was possible, we chose the one that maximized the number of tree positions assigned as gaps so as to minimize the subsequent computational burden. This choice has the effect of placing insertion events at the last common ancestor of all sequences in which the base is present and of placing deletions immediately after internal nodes.
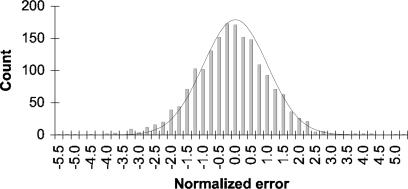
Reliability of Estimates. Several features of our approach (the complexity of the model, the use of a discrete-time approximation, and issues regarding MCMC convergence and applicability of asymptotic theoretical results) make it important to assess the reliability of our parameter estimates and inferred distributions. We performed this assessment by analyzing simulated datasets that matched the real data in the amount of sequence of each type and history of insertions and deletions. Evolution of the sequences was simulated using a continuous-time version of the model described above, with parameter values that had previously been estimated from the real data for a particular analysis. Our Bayesian MCMC approach was then used to reestimate these parameters from the simulated dataset. For the simulation analysis, the error of each parameter estimate is known: It is the difference between the estimate and the value used for the simulation. If our variance estimates and normality assumptions are correct, then this error divided by its estimated standard deviation should follow a standard normal distribution. The agreement is excellent for the branch length and rate parameters (Fig. 2), suggesting that (provided our evolutionary model is correct) the parameter values and confidence intervals estimated from the real data by means of Bayesian MCMC are reliable. Variances of the root and inserted sequence distribution parameters tended to be underestimated; however, these were not directly considered in subsequent analyses and did not appear to affect the reliability of other estimates. Note that this simulation does not evaluate issues such as uncertainty in indel placement and the validity of the model, e.g., the assumption that rates depend only on the immediately flanking nucleotides and feature type.
Fig. 2.
Error distribution for 1,800 estimated substitution rates and branch lengths for the analysis with 14 substitution types (see Results and Discussion). The MCMC approach was used to estimate parameters from a simulated dataset, and the normalized errors were computed by dividing the difference between the estimate and the value used for the simulation by the estimated standard deviation. The error distribution is approximately standard normal (shown by curve), indicating that the MCMC approach is able to reliably estimate values and confidence intervals for a large number of parameters.
Results and Discussion
Our evolutionary model allows the substitution rate at each site to depend on the two flanking nucleotides (“context”), the branch of the phylogenetic tree, and the type of biological feature in which the site is located. Parameter estimates and confidence intervals are obtained by Bayesian MCMC analysis, and their reliability is checked by using simulations (see Methods). To reveal substitutional trends during mammalian evolution, we analyzed a dataset consisting of orthologous sequences from 19 mammals for a 1.7-Mb genomic region that was filtered to remove exons and other sequences likely to be nonneutrally evolving.
Variation of Context Effects Across Lineages. In an initial MCMC analysis, we explored the broad pattern of rate variation across the mammalian tree by estimating separate context-dependent rate matrices for transcribed and untranscribed regions for each of five clades (primates, rodents + rabbit, carnivores + artiodactyls + horse, hedgehog, and armadillo) and for a sixth group comprising three ancestral branches (Fig. 1), a total of 12 matrices. Each matrix has 192 parameters representing the rates of context-dependent substitution events wxy→z, where w and y are the 5′ and 3′ neighbors of x and z is the base to which x mutates (our model assumes the event affects a single nucleotide at a time, so that w and y are unchanged). In untranscribed regions (but not transcribed regions, cf. ref. 14), we assume that rates of complementary events are equal, so the number of potentially distinct matrix parameters reduces to 96. Branch-specific scaling factors (again estimated separately for transcribed and untranscribed regions) allow variation by branch within a clade by means of a multiplicative factor applied simultaneously to all context-dependent rates.
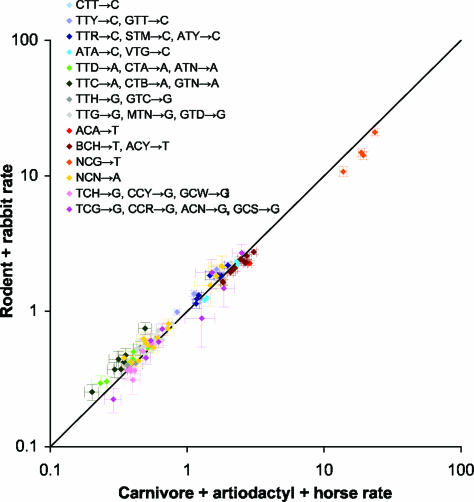
Comparison of the context-dependent rates across clades (Fig. 3) indicates that they are broadly similar but have some intriguing systematic differences. The differences appear primarily to be shifts of groups of rates of similar types parallel to the diagonal in log–log scale, implying that, within each group, a single multiplicative factor relates the (untransformed) rates in one clade to those in the other. This pattern suggests that the set of context-dependent substitutions wxy→z can be partitioned into subsets, which we call “types,” such that rate variation across the tree is largely captured by lineage-specific multiplicative shifts in the baseline rate for each type. Each specific context within a type modifies the baseline rate for that type in a manner that is largely independent of lineage.
Fig. 3.
Comparison of context-dependent substitution rates in untranscribed regions in the rodent + rabbit and carnivore + artiodactyl + horse clades. Each point represents the rates in the two clades for a particular substitution wxy→z. Rates were normalized such that within a clade the average rate, weighted by the observed frequencies of the trinucleotides wxy, is 1. Horizontal and vertical bars indicate 95% confidence intervals. The rates are broadly consistent between the clades, but groups of rates are shifted approximately parallel to the diagonal in log–log scale, suggesting that a multiplicative factor relates the rates within each group across clades. (If y = mx, then log y = log x + log m.) Similar trends were seen for other comparisons (see Fig. 10, which is published as supporting information on the PNAS web site). The color scheme reflects a grouping of substitutions into 14 types that explain much of the difference among clades (see Table 1).
Consequently, we adopt a model in which a single matrix of context-dependent rates applies to all tree branches but is modified by scaling factors that are specific for each branch and substitution type. To determine the optimal partitioning into types for this purpose in an objective and statistically rigorous manner, we carried out a weighted ANOVA, taking advantage of the fact that we have reliable variance and covariance estimates for the parameter estimates from the MCMC analysis. A partitioning into 14 types turns out to capture most of the variation across the phylogeny (Table 1). One of these types (NCG→T in our notation) corresponds to CpG→TpG substitutions, which are thought to arise primarily from deamination of methylated C (5). The remaining types apparently lack such simple mechanistic interpretations. We attempt below to gain some insight into the factors causing type rates to vary differentially across the mammalian tree.
Table 1. The 14 substitution types that best explain rate differences in untranscribed sequences across clades.
| Type | Substitutions |
|---|---|
| 1 | CTT→C |
| 2 | TTY→C, GTT→C |
| 3 | TTR→C, STM→C, ATY→C |
| 4 | ATA→C, VTG→C |
| 5 | TTD→A, CTA→A, ATN→A |
| 6 | TTC→A, CTB→A, GTN→A |
| 7 | TTH→G, GTC→G |
| 8 | TTG→G, MTN→G, GTD→G |
| 9 | ACA→T |
| 10 | BCH→T, ACY→T |
| 11 | NCG→T |
| 12 | NCN→A |
| 13 | TCH→G, CCY→G, GCW→G |
| 14 | TCG→G, CCR→G, ACN→G, GCS→G |
Each substitution type consists of a set of context-dependent substitutions (M = A or C; R = A or G; W = A or T; S = C or G; Y = C or T; V = A, C, or G; H = A, C, or T; D = A, G, or T; B = C, G, or T; and N = A, C, G, or T). For untranscribed regions, each type is also assumed to include the complementary substitutions to those listed, whereas for transcribed regions, the complementary substitutions are considered a separate type (resulting in a total of 28 types in transcribed regions). Although the overall division into substitution types has strong statistical support, support for this particular partitioning over other similar ones is relatively weak in some cases, so the assignment of particular contexts to types may be somewhat arbitrary. See Supporting Text for analysis method.
This model has somewhat fewer parameters while allowing additional branch-specific variation within clades, and it captures the major variation of context effects across the tree in the variation of branch-scaling factors. We obtained new parameter estimates by a MCMC analysis using this model, with 14 scaling factors per branch in untranscribed regions and with 28 scaling factors in transcribed regions to allow rate differences between each substitution type and its complement.
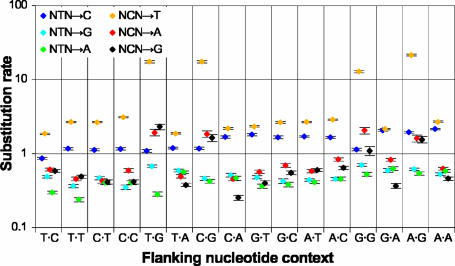
The estimated context-dependent substitution rates for untranscribed regions are shown in Fig. 4. The trends are similar to those noted in previous studies of human pseudogenes (3, 4). In particular, NTN→N substitution rates tend to increase with the number of flanking purines, and NCG→N rates are increased compared with NCH→N rates, for both NCG→R transversions and NCG→T transitions.
Fig. 4.
Context-dependent substitution rates for untranscribed regions. Each point corresponds to the rate of a particular substitution wxy→z, with the flanking context w·y indicated on the horizontal axis and x→z indicated by color. Because the rates may vary across the tree, each rate shown is the average across the entire tree, scaled such that the average of all rates (weighted according to the frequency of each trinucleotide in all sequences) is 1. Vertical bars indicate 95% confidence intervals.
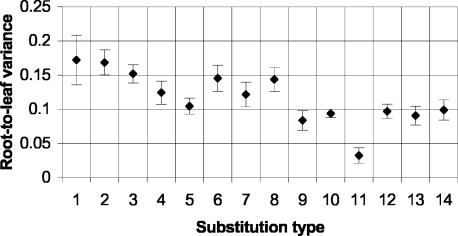
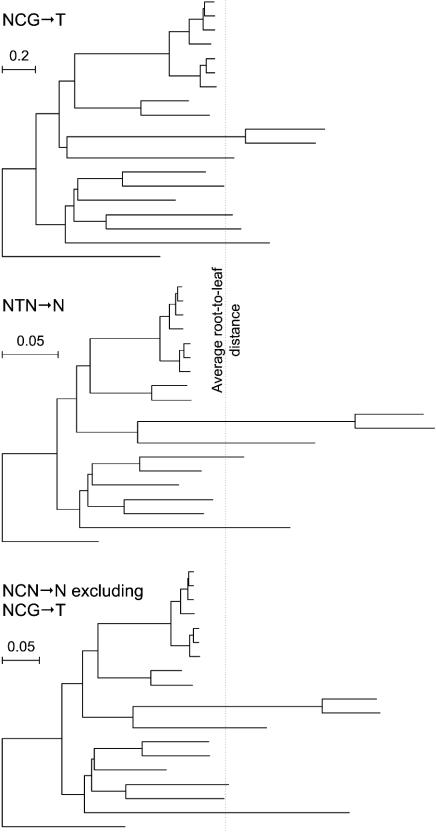
The Molecular Clock Hypothesis for Different Substitution Types. The molecular clock hypothesis (33), which states that substitutions accumulate at a rate proportional to clock time in all lineages, is known to fail for neutral nucleotide substitutions in mammals (34), with some lineages (e.g., rodents) showing greatly elevated rates relative to others. Because our substitution types capture crossphylogeny variation in relative rates, we were interested in the possibility that they might differ in the degree to which they deviate from clock-like behavior. To investigate this possibility, we computed for each substitution type the variance of the set of normalized root-to-leaf distances (Fig. 5). By this criterion, the types fall roughly into three groups: NCG→T has a very low variance of 0.032; other NCN→N types have intermediate variances in the range 0.08–0.10; and NTN→N types have high variances in the range 0.10–0.18. In particular, NCG→T substitutions apparently occur at close to clock-like rates, whereas NTN→N rates are the least clock-like. These trends are corroborated by examination of tree shape (Fig. 6).
Fig. 5.
Deviation from clock-like behavior by substitution type. For each type (indicated by number as in Table 1), we computed the total branch length (in expected substitutions per site) from the root to each leaf and measured deviation from molecular clock behavior as the variance of the set of root-to-leaf distances (normalized so that the mean distance is 1 in each case). Vertical bars indicate 95% confidence intervals.
Fig. 6.
Tree shape varies according to substitution type, with NCG→ T the most clock-like. Branch lengths indicate the expected number of substitutions of the indicated types per pertinent site. Branch-length values with 95% confidence intervals for each substitution type and for all types combined are given in Figs. 11–25, which are published as supporting information on the PNAS web site. The trees are scaled so that the average root-to-leaf distance (indicated by the vertical line) is the same for all trees. See Fig. 1 for species labels.
Suggested explanations for deviation from clock-like behavior include the “generation time” hypothesis (34, 35), which proposes that organisms with shorter generation times (more precisely, having a higher average number of germline cell divisions per year) have higher substitution rates as a result of DNA replication errors; and the “metabolic rate” hypothesis (36), which proposes that organisms with higher weight-specific metabolic rates have higher mutation rates as a result of oxidative damage. Because generation time and metabolic rate are both correlated with body size, these hypotheses have been difficult to distinguish (36, 37). For example, the lineages having the greatest excess over the mean branch length in our data (Fig. 6) are rodent, rabbit, and hedgehog, which have both relatively short generation times and relatively high metabolic rates.
Oxidative damage, however, is predicted to mainly induce mutations of G or C to A or T (38). Our results indicate that the most pronounced phylogenetic variation instead involves T→N substitutions. Thus, varying rates of oxidative damage do not appear to be a major direct cause of mammalian nuclear substitution rate variation [they may be more relevant for mitochondrial rates (38)]. On the other hand, armadillo and horse, which have among the lowest metabolic rates of these mammals (39, 40) but relatively short generation times, have the shortest branch lengths for all substitution types (Fig. 6), which suggests that metabolic rate may influence mutation rate by mechanisms other than oxidation. One possible mechanism, proposed in ref. 36, is error-prone repair of oxidatively damaged DNA, which involves “replication error” in a more general sense (not associated with cell division). This suggestion has the appealing feature of allowing variation in substitution rates to be attributed to a single mechanism, DNA replication. Further support for the influence of replication errors on mutation rate comes from the fact that males, which have more germline cell divisions than females, also have higher mutation rates (41).
Our finding that NCG→T substitutions are relatively clock-like presumably reflects the fact that most NCG→T mutations arise from hydrolytic deamination of methylated C (5), which should be relatively unaffected by DNA replication (note incidentally that this chemical reaction does not involve oxidative damage). Conversely, the fact that NTN→N types show the greatest variation suggests that most of these mutations may be DNA replication-associated. Because other NCN→N substitutions show intermediate variation, they likely include both a replication-dependent component and a more clock-like component, the latter perhaps being deamination of (unmethylated) cytosine (42). Of course, it is likely that there is some variation in the accuracy and efficiency of replication and repair machinery in these organisms as well (e.g., see refs. 43 and 44), which may play a contributing role.
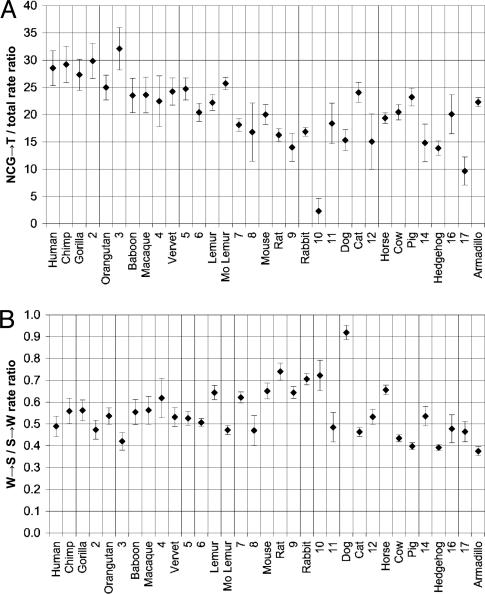
Given the relatively clock-like behavior of NCG→T rates, we expect the branch-specific ratio of NCG→T rate to overall substitution rate (plotted in Fig. 7A) to correlate with those factors (generation time or metabolic rate) that are responsible for overall rate variation relative to clock time across the tree. Note that there is a 2-fold variation in this ratio, from ≈30 in great apes to <15 in hedgehog. In general, the correlation appears stronger with generation time than metabolic rate; branches in Fig. 7A that correspond to extant species with shorter generation times tend to have lower ratios. The ratios also generally are lower in ancestral branches than descendant branches: seven of the 17 ancestral branches have significantly (P < 0.05) lower ratios than their descendants, whereas only one has significantly higher ratio (Fig. 27, which is published as supporting information on the PNAS web site). This finding suggests generation times have tended to lengthen in several lineages, which is consistent with paleontological evidence indicating a trend of increasing body size (Cope's rule) in many mammalian lineages (45, 46).
Fig. 7.
Variation in relative substitution rates by branch. Branch labels are as indicated in Fig. 1; data for internal branches 1, 13, and 15 are omitted because of relatively large variance. Vertical bars indicate 95% confidence intervals. (A) NCG→ T/overall rate ratio. Because NCG→ T substitutions are relatively clock-like, this ratio provides a measure of deviation of the overall rate from clock-like behavior on each branch. (B) W→ S/S→ W rate ratio. This ratio is hypothesized to reflect biased gene conversion. Results were qualitatively similar when NCG→ T substitutions were excluded from the calculation of the S→ W rate (see Fig. 26, which is published as supporting information on the PNAS web site).
The trend of increasing NCG→T/overall rate also provides an alternative interpretation for observations in ref. 21. Arndt et al. (21) conjecture, based on analyzing the rates of NCG→T substitutions relative to other substitutions in human repeats, that the NCG→T rate has been increasing since the time of the mammalian radiation. We suggest instead that the NCG→T rate has remained relatively constant, whereas the rate of other, replication-dependent errors has decreased during primate evolution because of increasing generation times.
S Versus W Substitution Bias. Bias in the relative rates of W→S and S→W neutral substitutions is thought to be a major driver of genome G + C content (47). Most eukaryotes have A + T rich genomes, suggesting that there is a phylogenetically widespread mutational pressure favoring S→W over W→S mutations. However, a strong circumstantial case has recently emerged (10–13) that biased gene conversion, a tendency to repair W:S mismatches to C:G rather than T:A in DNA heteroduplexes formed during recombination, acts as a significant counterbalancing force that mitigates or reverses this mutational pressure by increasing the frequency of W→S and decreasing the frequency of S→W substitutions. The magnitude of the biased gene conversion effect is predicted to be positively correlated with conversion rate, effective population size, and the strength of the repair asymmetry (48).
Examination of the W→S/S→W ratio by tree branch (Fig. 7B) reveals significant variation across the mammalian phylogeny. Assuming that this pattern reflects variation in the effects of biased gene conversion and that the basic characteristics of the recombination process have remained relatively constant, we expect that higher values of W→S/S→W should reflect higher effective population sizes (Ne) and/or recombination rates along certain branches, with Ne likely dominating the trends because it is thought to vary over a greater range than recombination rate among most mammals (an order of magnitude or more versus a factor of two or three). In general, Ne does appear to explain much of the variation. For example, the rodent + rabbit clade has relatively high W→S/S→W ratios compared with most other mammals, presumably reflecting their large Ne [the average crossover rate in rodents is only about half that in humans (49)]. Chimp has a significantly higher ratio than human, consistent with its apparently larger Ne (50). Some of the variability in ratios may reflect recombination rate differences, however; for example, the higher ratio for rat relative to mouse, which has also been observed on a genome-wide scale (51), is consistent with rat's somewhat higher recombination rate [for the rat and mouse chromosomes containing the cystic fibrosis transmembrane conductance regulator region, the crossover rates are 0.55 centimorgans per Mb and 0.45 centimorgans per Mb, respectively (49)]. The exceptionally high ratio for dog may arise from the fact that dog tends to have shorter chromosomes and therefore likely has a higher average recombination rate per megabase (10) than other mammals (the cystic fibrosis transmembrane conductance regulator region is on the 163-Mb chromosome 7 in human and the 72-Mb chromosome 14 in dog).
It is interesting to note that, just as Fig. 7A appears to provide a window into variation of generation times across the mammalian phylogeny, Fig. 7B may provide a window into variation of effective population sizes and recombination rates.
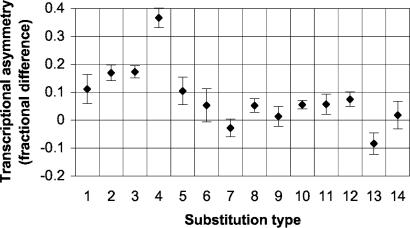
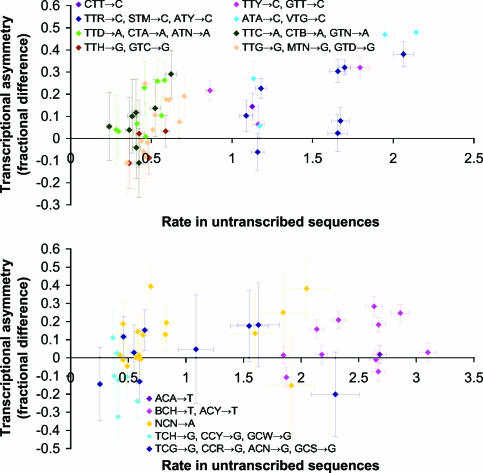
Transcription-Associated Substitutional Asymmetry. We have previously found (14) that there is an asymmetry in substitution rates in transcribed regions, with pyrimidine transitions (T→C and C→T) occurring at higher rates on the transcribed strand than purine transitions (note that in ref. 14, substitutions were read on the coding, or nontranscribed, strand). We confirm that pattern here (Fig. 8) and find that the degree of asymmetry varies by neighboring context, with the ATA→C, VTG→C substitution type having the strongest asymmetry. In addition, we find significant asymmetry for four of the seven transversion substitution types.
Fig. 8.
Transcriptional asymmetry by substitution type. For each type (indicated by number as in Table 1), we computed the fractional difference between its rate and that of its complement in transcribed regions. Rates were computed with respect to the transcribed strand and averaged over the entire tree. Vertical bars indicate 95% confidence intervals.
The degree of transcriptional asymmetry for each context is correlated with the substitution rate in untranscribed regions for NTN→N substitutions, whereas no strong correlation is clear for NCN→N substitutions (Fig. 9). Moreover in general, there appears to be little or no transcriptional asymmetry for the contexts having the lowest substitution rates within each type. These observations suggest that each NTN→N type has a baseline rate of substitutions that occur via a symmetric process, and that contexts within a type act to increase the rate over the baseline via a mechanism that is subject to the asymmetry. Under the model proposed in ref. 14, the underlying asymmetry is at the level of replication errors made by DNA polymerase, namely a greater frequency of misinserted purines than of misinserted pyrimidines. The fact that the correlation we see is strongest for NTN→N substitutions is then consistent with the suggestion above that those substitutions have the highest proportion of replication-dependent errors.
Fig. 9.
Relationship between transcriptional asymmetry and untranscribed substitution rate. Asymmetry is measured as in Fig. 8. Each point represents a particular substitution wxy→z, with color indicating its type. NCG→ T substitutions, omitted here because of scale, do not display clear correlation. Horizontal and vertical bars indicate 95% confidence intervals.
Summary. Bayesian MCMC offers a powerful and flexible approach to the elucidation of molecular evolution trends and should allow increasingly complex models of the mutation and substitution process to be investigated. We have used it here to characterize mammalian variation in context-dependent substitution patterns in a 1.7-Mb genomic region. Our results appear to support the hypotheses that context-dependent DNA replication errors, cytosine deamination, and biased gene conversion are the major sources of naturally occurring point mutations and that the relative contributions of these have varied in mammalian evolution as a result of varying generation times, effective population sizes, and recombination rates. In particular, CpG transitions have accumulated in a relatively clock-like fashion, in comparison with other context-dependent substitution types.
Supplementary Material
Acknowledgments
We thank the NISC Comparative Sequencing Program, in particular Eric Green, Bob Blakesley, Gerry Bouffard, and Pam Thomas, for generating and providing the annotated sequence; Matthew Stephens and Joseph Felsenstein for helpful suggestions; and Matthew Stephens and Eric Green for comments on the manuscript. This work was supported by the Howard Hughes Medical Institute, the National Institutes of Health, and the Poncin Foundation.
This contribution is part of the special series of Inaugural Articles by members of the National Academy of Sciences elected on May 1, 2001.
Abbreviations: MCMC, Markov chain Monte Carlo; Mb, megabase.
See accompanying Biography on page 13991.
References
- 1.Gojobori, T., Li, W.-H. & Graur, D. (1982) J. Mol. Evol. 18, 360–369. [DOI] [PubMed] [Google Scholar]
- 2.Li, W.-H., Wu, C.-I. & Luo, C.-C. (1984) J. Mol. Evol. 21, 58–71. [DOI] [PubMed] [Google Scholar]
- 3.Blake, R. D., Hess, S. T. & Nicholson-Tuell, J. (1992) J. Mol. Evol. 34, 189–200. [DOI] [PubMed] [Google Scholar]
- 4.Hess, S. T., Blake, J. D. & Blake, R. D. (1994) J. Mol. Biol. 236, 1022–1033. [DOI] [PubMed] [Google Scholar]
- 5.Ehrlich, M. & Wang, R. Y. H. (1981) Science 212, 1350–1357. [DOI] [PubMed] [Google Scholar]
- 6.Zhao, Z. & Boerwinkle, E. (2002) Genome Res. 12, 1679–1686. [DOI] [PMC free article] [PubMed] [Google Scholar]
- 7.Krawczak, M., Ball, E. V. & Cooper, D. N. (1998) Am. J. Hum. Genet. 63, 474–488. [DOI] [PMC free article] [PubMed] [Google Scholar]
- 8.Waterston, R. H., Lindblad-Toh, K., Birney, E., Rogers, J., Abril, J. F., Agarwal, P., Argawala, R., Ainscough, R., Alexandersson, M., An, P., et al. (2002) Nature 420, 520–562.12466850 [Google Scholar]
- 9.Hellmann, I., Ebersberger, I., Ptak, S. E., Paabo, S. & Przeworksi, M. (2003) Am. J. Hum. Genet. 72, 1527–1535. [DOI] [PMC free article] [PubMed] [Google Scholar]
- 10.Meunier, J. & Duret, L. (2004) Mol. Biol. Evol. 21, 984–990. [DOI] [PubMed] [Google Scholar]
- 11.Galtier, N., Piganeau, G., Mouchiroud, D. & Duret, L. (2001) Genetics 159, 907–911. [DOI] [PMC free article] [PubMed] [Google Scholar]
- 12.Eyre-Walker, A. & Hurst, L. D. (2001) Nat. Rev. Genet. 2, 549–555. [DOI] [PubMed] [Google Scholar]
- 13.Birdsell, J. A. (2002) Mol. Biol. Evol. 19, 1181–1197. [DOI] [PubMed] [Google Scholar]
- 14.Green, P., Ewing, B., Miller, W., Thomas, P. J., Green, E. D. & NISC Comparative Sequencing Program (2003) Nat. Genet. 33, 514–517. [DOI] [PubMed] [Google Scholar]
- 15.Thomas, J. W., Touchman, J. W., Blakesley, R. W., Bouffard, G. G., Beckstrom-Sternberg, S. M., Margulies, E. H., Blanchette, M., Siepel, A. C., Thomas, P. J., McDowell, J. C., et al. (2003) Nature 424, 788–792. [DOI] [PubMed] [Google Scholar]
- 16.Yang, Z., Goldman, N. & Friday, A. (1994) Mol. Biol. Evol. 11, 316–324. [DOI] [PubMed] [Google Scholar]
- 17.Zhang, J. (1999) Mol. Biol. Evol. 16, 868–875. [DOI] [PubMed] [Google Scholar]
- 18.Huelsenbeck, J. P. & Nielsen, R. (1999) Syst. Biol. 48, 317–328. [DOI] [PubMed] [Google Scholar]
- 19.Jensen, J. L. & Pedersen, A.-M. K. (2000) Adv. Appl. Probab. 32, 499–517. [Google Scholar]
- 20.Arndt, P. F., Burge, C. B. & Hwa, T. (2003) J. Comput. Biol. 10, 313–322. [DOI] [PubMed] [Google Scholar]
- 21.Arndt, P. F., Petrov, D. A. & Hwa, T. (2003) Mol. Biol. Evol. 20, 1887–1896. [DOI] [PubMed] [Google Scholar]
- 22.Siepel, A. & Haussler, D. (2004) Mol. Biol. Evol. 21, 468–488. [DOI] [PubMed] [Google Scholar]
- 23.Blaisdell, B. E. (1984) J. Mol. Evol. 21, 278–288. [DOI] [PubMed] [Google Scholar]
- 24.Pickard, D. K. (1980) Adv. Appl. Probab. 12, 655–671. [Google Scholar]
- 25.Tavaré, S. (1986) Lect. Math. Life Sci. 17, 57–86. [Google Scholar]
- 26.Gelman, A., Carlin, J. B., Stern, H. S. & Rubin, D. B. (2003) Bayesian Data Analysis (Chapman & Hall/CRC, Boca Raton, FL), 2nd Ed.
- 27.Heyde, C. C. & Johnstone, I. M. (1979) J. R. Stat. Soc. B 41, 184–189. [Google Scholar]
- 28.Wilson, I. J. & Balding, D. J. (1998) Genetics 150, 499–510. [DOI] [PMC free article] [PubMed] [Google Scholar]
- 29.Geyer, C. J. (1992) Stat. Sci. 7, 473–483. [Google Scholar]
- 30.Ferguson, T. S. (1996) A Course in Large Sample Theory (Chapman & Hall, London).
- 31.Springer, M. S., Murphy, W. J., Eizirik, E. & O'Brien, S. J. (2003) Proc. Natl. Acad. Sci. USA 100, 1056–1061. [DOI] [PMC free article] [PubMed] [Google Scholar]
- 32.Blanchette, M., Kent, W. J., Riemer, C., Elnitski, L., Smit, A. F. A., Roskin, K. M., Baertsch, R., Rosenbloom, K., Clawson, H., Green, E. D., et al. (2004) Genome Res. 14, 708–715. [DOI] [PMC free article] [PubMed] [Google Scholar]
- 33.Zuckerkandl, E. & Pauling, L. (1965) J. Theor. Biol. 8, 357–366. [DOI] [PubMed] [Google Scholar]
- 34.Li, W. H., Tanimura, M. & Sharp, P. M. (1987) J. Mol. Evol. 25, 330–342. [DOI] [PubMed] [Google Scholar]
- 35.Laird, C. D., McConaughy, B. L. & McCarthy, B. J. (1969) Nature 224, 149–154. [DOI] [PubMed] [Google Scholar]
- 36.Martin, A. P. & Palumbi, S. R. (1993) Proc. Natl. Acad. Sci. USA 90, 4087–4091. [DOI] [PMC free article] [PubMed] [Google Scholar]
- 37.Bromham, L., Rambaut, A. & Harvey, P. H. (1996) J. Mol. Evol. 43, 610–621. [DOI] [PubMed] [Google Scholar]
- 38.Martin, A. P. (1995) Mol. Biol. Evol. 12, 1124–1131. [DOI] [PubMed] [Google Scholar]
- 39.Porter, R. K. (2001) Cell. Mol. Life Sci. 58, 815–822. [DOI] [PMC free article] [PubMed] [Google Scholar]
- 40.Boily, P. (2002) J. Exp. Biol. 205, 3207–3214. [DOI] [PubMed] [Google Scholar]
- 41.Li, W.-H., Yi, S. & Makova, K. (2002) Curr. Opin. Genet. Dev. 12, 650–656. [DOI] [PubMed] [Google Scholar]
- 42.Fryxell, K. J. & Zuckerkandl, E. (2000) Mol. Biol. Evol. 17, 1371–1383. [DOI] [PubMed] [Google Scholar]
- 43.Drake, J. W., Charlesworth, B., Charlesworth, D. & Crow, J. F. (1998) Genetics 148, 1667–1686. [DOI] [PMC free article] [PubMed] [Google Scholar]
- 44.Parrinello, S., Samper, E., Krtolica, A., Goldstein, J., Melov, S. & Campisi, J. (2003) Nat. Cell Biol. 5, 741–747. [DOI] [PMC free article] [PubMed] [Google Scholar]
- 45.Alroy, J. (1998) Science 280, 731–734. [DOI] [PubMed] [Google Scholar]
- 46.Meng, J., Wyss, A. R., Dawson, M. R. & Zhai, R. (1994) Nature 370, 134–136. [DOI] [PubMed] [Google Scholar]
- 47.Sueoka, N. (1992) J. Mol. Evol. 34, 95–114. [DOI] [PubMed] [Google Scholar]
- 48.Nagylaki, T. (1983) Proc. Natl. Acad. Sci. USA 80, 6278–6281. [DOI] [PMC free article] [PubMed] [Google Scholar]
- 49.Jensen-Seaman, M. I., Furey, T. S., Payseur, B. A., Lu, Y., Roskin, K. M., Chen, C.-F., Thomas, M. A., Haussler, D. & Jacob, H. J. (2004) Genome Res. 14, 528–538. [DOI] [PMC free article] [PubMed] [Google Scholar]
- 50.Yu, N., Jensen-Seaman, M. I., Chemnick, L., Kidd, J. R., Deinard, A. S., Ryder, O., Kidd, K. K. & Li, W.-H. (2003) Genetics 164, 1511–1518. [DOI] [PMC free article] [PubMed] [Google Scholar]
- 51.Rat Genome Sequencing Project Consortium (2004) Nature 428, 493–521.15057822 [Google Scholar]
Associated Data
This section collects any data citations, data availability statements, or supplementary materials included in this article.


